Abstract
The utilization of metal roofing as natural air terminals is a standard practice in lightning protection; however, the risk of thermal perforation and subsequent ignition of internal hazardous atmospheres remains a critical safety concern. While current standards (e.g., IEC 62305) primarily focus on material thickness and total charge (Q), this study demonstrates that these parameters alone are insufficient for predicting burn-through failure. We present a comprehensive electrothermal analysis based on the method of images to simulate three-dimensional heat diffusion in finite-thickness plates (0.5–7 mm) made of aluminum, copper, and steel. Unlike simplified 1D models, our approach considers the spatial distribution of the heat source and the varying depth of the thermal penetration. The results confirm that the continuing current component ( C) is the primary driver of volumetric melting. Crucially, the sensitivity analysis reveals that the lightning channel radius () acts as a governing factor for perforation risk; a reduction in the lightning channel radius from 5 mm to 2 mm can shift the outcome from minor surface heating to complete perforation for thin sheets ( mm), even under identical charge conditions. This paper identifies a “safety gap” in current engineering practices, demonstrating that neglecting this parameter constriction effect results in an underestimation of the thermal threat. The proposed analytical model provides a precise tool for determining the safety margins of natural air terminals, offering direct applicability for designing lightning protection systems in high-risk industrial facilities.
1. Introduction
The utilization of metal roofing, facades, and pipes as “natural air terminals” is a standard and economically efficient practice in modern construction, explicitly permitted by international standards, such as IEC 62305 [1,2,3,4]. For typical civil structures, minor thermal damage caused by a lightning strike is acceptable. However, in critical industrial facilities—specifically, those housing explosive atmospheres or flammable materials—the hermetic integrity of the metal sheet is paramount. Any perforation or “hot spot” exceeding the auto-ignition temperature on the inner surface can lead to catastrophic failure. Current lightning protection standards primarily correlate the temperature risk of damage with two parameters: the material thickness and the total charge of the flash (Q). While this approach is sufficient for thick plates, it may be overly optimistic for thin-walled structures ( mm), which are characteristic of modern lightweight construction. The existing literature focuses heavily on the total energy deposition but often overlooks the spatial distribution of the heat source. Specifically, the influence of the lightning channel radius ()—the area over which the lightning energy is delivered—is rarely accounted for in simplified engineering safety assessments. This creates a potential safety gap: A lightning strike with a relatively low charge but a highly constricted lightning channel could theoretically perforate a sheet that is deemed “safe” by standard metrics. To address this, this paper presents a rigorous electrothermal analysis using the method of images adapted for finite-thickness plates. While complex finite element method (FEM) models considering coupled thermal–electrical–mechanical effects are being developed [5], analytical approaches provide a necessary rapid engineering alternative. Unlike 1D models that average temperatures or calculate them for just one point, the 3D model presented below allows for a precise evaluation of the thermal gradient and the “burn-through” risk. The main objectives are to determine the sensitivity of different materials (Al, Cu, and steel) to the constriction of the lightning and to demonstrate that the continuing current component, combined with a slight lightning channel radius, represents the worst-case scenario for natural air terminals.
2. Mechanism of Thermal Damage and Problem Formulation
One of the most common doubts at the design stage of a lightning protection system is determining whether the sheet metal roof covering can be used as a natural rod. The high energy of lightning focused on a small area of the sheet metal hit by the discharge can lead to significant thermal growth, depending on the material properties and discharge current parameters. The considerations presented in the following article are critical in evaluating the potential for thermal initiation to lead to explosions or fires, taking into account the individual structural features of a given object and the possible concentrations of hazardous substances in contact with the sheet metal layer. In the case of industrial buildings, the sheet metal layer may be in direct contact with the insulation layer or with the atmosphere containing explosive concentrations inside the analyzed object. If the thermal growth exceeds the ignition level of this layer or triggers a gas explosion, it can have catastrophic consequences. Fire and explosion hazards are well described in [6,7].
Having information on the ignition temperature of the considered construction material or located directly in the vicinity of the structure, it is possible to confront it with the expected thermal increase value, which may occur as a result of a direct hit by a lightning discharge and the flow of lightning current through the analyzed sheet metal. The problem lies in determining the aforementioned thermal increase, as the lightning protection standard does not specify a method for calculating it. Examples of the effects of burning roof sheet metal coatings due to a direct lightning strike are shown in Figure 1.
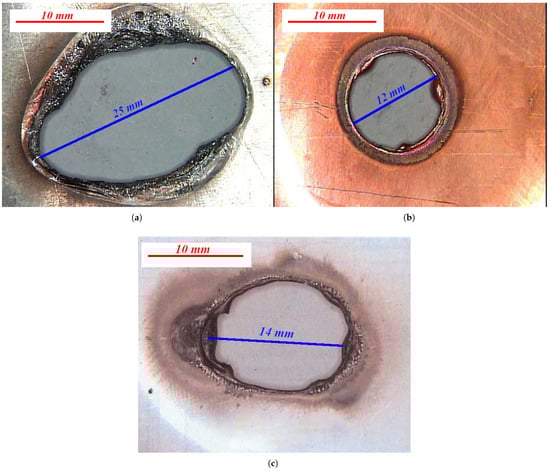
Figure 1.
Examples of the effects of burnt holes in a thick (0.5 mm) sheet (developed on the basis of [8]): (a) aluminum as a result of the action of a current of A for a period of time ms ( C), (b) copper as a result of a current of A for a period of time ms ( C), and (c) steel as a result of a current of A for a period of time ms ( C).
In addition to the fire hazard, it is essential to remember the explosion hazard. Any gas in combination with oxygen and nitrogen at the appropriate concentration can lead to an explosion hazard in the event of a flashover or a temperature rise above the lower explosion limit. In the case of lightning protection, this is particularly important because a high value of the lightning current causes the aforementioned thermal increases, as well as significant values of the electric field, which can cause sparks on improperly made connections of lightning conductive elements. Therefore, its design features must be considered to protect a structure from lightning. Still, conducting an additional threat level analysis may be necessary to select the most appropriate parameters for protective measures.
Figure 1 clearly demonstrates the localized nature of the thermal damage. The perforation creates a hole with a specific diameter (approximately 10 mm), which directly correlates with the constriction of the lightning channel radius at its end close to the metal sheet (the parameter). This proves that the energy did not spread throughout the entire sheet but was concentrated in a “channel”. This is the physical representation of the parameter , which is described later in the article. This empirical evidence suggests that analyzing the total charge (Q) alone is insufficient; the spatial concentration of this energy—defined by the channel radius—is the decisive factor for the hole formation.
3. Mathematical Modeling of Heat Diffusion in Finite-Thickness Plates
The first step in assessing the feasibility of using metal roofing for lightning protection is to derive formulae that allow for the degree of thermal increase at the point of the lightning strike, on the surface struck by lightning, on the opposite surface, and in the cross-section of the material. The individual stages of the analytical work are presented in the following subsections.
3.1. Lightning Channel Contact Radius
When lightning strikes the roof covering of the sheet metal, energy is released at the external boundary with the surrounding air and in the volume of the sheet metal as a result of resistive losses defined as Joule heat [9,10,11]. The penetration of heat into the natural air duct in the form of sheet metal hit by lightning results in the occurrence of locally varied temperatures (), defined as a point located at the bottom side opposite to the lightning-struck place (at the point marked as BLP in Figure 2), which, for any fragment of such a natural air duct, can be calculated by applying appropriate solutions of the differential equation of thermal conductivity [11,12,13,14,15,16]. In computational analyses, it is generally assumed that lightning perforation of the sheet occurs as a result of the occurrence of a melting temperature () of the metal from which the sheet is made [14,17,18] at the point defined as the centrally opposite lightning strike. It should be added that the instantaneous value of the radius () marked in Figure 2 is expressed in millimeters, and for lightning with normative charges and durations, it can be estimated based on the formulae [19,20]
where the instantaneous current () is expressed (A), and the value is a constant characteristic for a given metal and the polarity of the lightning. The values of the coefficient were determined and published in [20] as well as collected in Table 1.
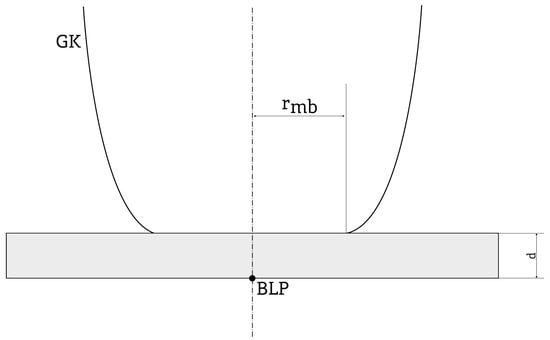
Figure 2.
Schematic visualization of the lightning discharge channel radius. (The symbol description is in the text below).

Table 1.
Values of the coefficient determined for steel, copper, and aluminum for both polarities of lightning.
The empirical coefficients () presented in Table 1 are based on the hydrodynamic theory of electrical discharges. To verify their feasibility, we calculated the resulting channel radius for the test current used in this study ( A). Using the value for air (), the calculated arc radius is approximately 10 mm. This result aligns well with experimental photographic evidence of long laboratory sparks and triggered lightning channels, where the visible core radius is typically reported in the range from to 2 cm, depending on the current amplitude. Furthermore, the classic Braginskii model [21,22] for spark channel expansion predicts similar orders of magnitude, confirming that the values in Table 1 provide a physically realistic representation of the arc root for engineering calculations. In relation to the statistical distributions of lightning parameters and the probability of their occurrence at the level of 50%, the quantities used in the formula are defined as follows:
- As, ms A
- As, ms A
It is worth noting the significant convergence of the dimensions of the discharge channel with the radius of the melted material from the surface of the sheet [8]. Figure 2 schematically shows the final radius of a lightning discharge channel.
The marking with the letters is the assumed location of the point centrally opposite to the lightning strike (into the sheet of the natural rod with a thickness of d). The designation denotes the boundary of the final fragment of the lightning channel, having the shape described in works [13,19,23]. Using Formula (2), the calculation results of the parameter values were obtained and are presented in Table 2.
Table 2.
Values of the lightning radius () (mm) determined for steel, copper, and aluminum for both polarities of lightning.
3.2. Point Thermal Increments
To perform the derivation, the method of virtual sources (summation over individual virtual temperature sources ()) was used for a plate of finite thickness (Figure 3).
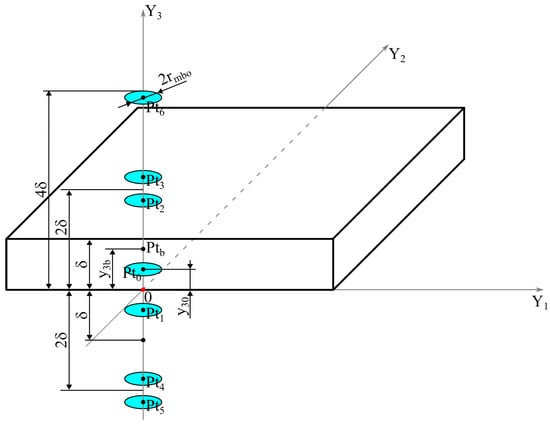
Figure 3.
Visualization of the heat reflection method used.
To explain the version of the method in question, the rectangular coordinate system () is applied to an assumed infinite metallic body, the axis of which is perpendicular to the planes above (their locations are determined by the coordinates and ). It is also assumed that this axis coincides with the straight line that is the axis of a circular heat source, quantitatively identical to the energy (), having a radius (), a heat flux density () given by Equation (3), and a center located at point —with the initial condition .
where —constant heat flux density, —contact surface with the lightning channel (), —thermal energy released in the sheet, Q—electric charge transferred by the flash, and —time between the beginning of the thermal saturation period of the infinite body under consideration and the functioning of an elementary instantaneous heat source in it.
Reflections of this heat source in the planes and introduce two new, necessarily also circular, heat sources with centers at points and . To satisfy the condition of heat not passing through the planes that bound the area they delimit in an infinite body, the newly introduced heat sources must be reflected further, as a result of which, in the next step, further heat sources arise—with centers at points and as well as and —requiring further reflection. As a result of such reflection of heat sources, two infinite series of them are obtained, which coordinates on the axis are defined by Equations (4) and (5), where takes on negative and positive integer values and the value zero.
For the whole process, it was essential to establish the form of a formula that would allow for the assessment of changes in the assumed time (t), the increase () above the initial temperature level of a point lying on a line located in a metallic infinite body, occurring after introducing to it an instantaneous heat source, quantitatively identical in energy (), situated on the elementary inter-peripheral surface () of two circles having a common center lying on this line and radii (r) and () perpendicular to it, the larger of which can be (at most) equal to the radius ()—Figure 4.
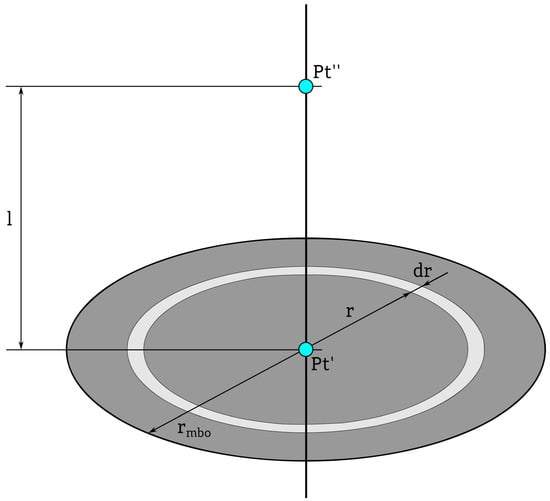
Figure 4.
A drawing explaining the initial part of the implemented derivation. (The symbol description is in the text).
Based on Formula (6),
where —temperature equalization coefficient, —thermal conductivity coefficient, —ambient temperature, and —distance from the heat source used to determine the temperature of an infinite body [24], one can conclude that the formula in question is written as follows:
where l is the distance from the center of the circles between which circumferences the mentioned heat source is located (marked in Figure 4 with the symbol ), from the point of the mentioned line under consideration (marked in Figure 4 as ).
Establishing the notation of Formula (7) opens the way to the following stages of deriving the desired set of dependencies, enabling the calculation of the time variability of temperature increases at points centrally opposite to the places where lightning strikes the sheets treated as natural air terminals of the building.
In the first of the mentioned stages, it was necessary to determine the general relationship used to assess the time variability of the temperature increase () of an infinite metal body at the point marked in Figure 4 with the symbol , but this time, assuming the presence on the surface (), defined by the formula
of a continuous heat source operating in time t, quantitatively identical to energy , with a heat flux density given by the definition formula [25,26]
It corresponds to the moment , which is the time between the beginning of the period of thermal saturation of the infinite body under consideration and the functioning of the elementary instantaneous heat source () in it.
From Formulae (7) and (9), the following formula defining the above-mentioned temperature increase results is
For the calculations carried out in this article, the authors assumed, with the necessary simplification, that the mentioned heat flux density does not depend on time [11,13,19,20] and that it is specified, as a function of the radius (r) only, by the relation
where and —dimensions of the elementary cylinder for which the energy (W) calculation is performed.
In the final necessary developed notation, it was taken into account that
and therefore
which leads to the formula
which is a transformation and, at the same time, a clarification of the dependence, Equation (10).
As a result, the derived pair of formulae was established and is written as follows:
It should be added that in this article, it is assumed to determine the temperature increase of the natural air terminal sheet at the point centrally opposite to the lightning strike location above the ambient temperature (), the calculated level of which was assumed to be 20 °C (293 K) [17,18,27,28].
The formula used for thermal growth is divided into two time domains. This is the classical solution of the heat diffusion equation for a volume or surface source acting for a finite time ().
- () describes the temperature increase during the current flow. The function 1 − erf(…) (i.e., erfc) is characteristic of continuous heat supply;
- () describes the thermal relaxation after the source is removed. The difference between the two erf functions represents the superposition “source on since ” minus “source on since ”;
- The term in the denominator under the square root suggests using the method of images for a plate of thickness . We simulate an infinite number of “virtual” heat sources to satisfy the boundary conditions (thermal insulation on the sheet surfaces—adiabatic walls);
- The presence of the integral with the factor means that the heat source is not point like but is distributed over a circular surface of radius with a parabolic profile (the greatest heating is in the center and zero at the edge of the spot).
The proposed analytical model is a fast and accurate alternative to complex FEM (finite element method) simulations.
3.3. Generalization to 3D Spatial Distributions
The formula from the above section describes the temperature only along the axis of symmetry (). From a practical perspective, it is worth noting that the problem is axisymmetric. To obtain the value at a distance R from the center, we must include the distance from each element of the heat source ring to the measurement point within the integral. This requires numerical integration over the angle , which reduces to averaging over the circumference of the source. At this point, and the next one, the off-axis solution is computed using the law of cosines within the integral. This amounts to a generalization of the original formula for cylindrical coordinates .
From the cross-section thermal distribution in the first formula, the geometric term was “rigidly” set at the bottom surface, i.e., for the depth coordinate (). To calculate the temperature inside the material at any depth (z), where is the impact surface, and is the bottom, this constant distance must be replaced with a variable. Instead of , the formula will read .
The temperature distribution () in a plate of thickness , at a radial distance (r) from the lightning-struck axis, and at a depth of z (where is the impact surface, and is the back wall), is given by the integral expression
where is the material’s density, and is the angular integral averaging over the heat source circumference and has the following form:
The following auxiliary definitions were adopted in two formulae. The first one, named the effective geometric distance (), is defined as the distance from the source element to the observation point, taking into account the reflection method (for the nth apparent source) and cylindrical geometry (from the law of cosines) as follows:
The second one, named the time function (), is defined as a function describing the time evolution of the temperature (analogous to the source formula), depending on the discharge phase as follows:
The descriptions of the used symbols:
- r—the radial coordinate of the observation point (distance from the axis of symmetry);
- z—depth coordinate ();
- —integration variable (the radius of the heat source element, from 0 to );
- —integration variable (the azimuthal angle of the source, from 0 to );
- n—summation index in the virtual source method (reflections from the sheet metal walls);
- —Gaussian error function.
The effective length mentioned above is a key element in generalizing the model to points outside the axis of symmetry. It is defined as the Euclidean distance between the heating element with coordinates and the observation point . The term accounts for the penetration and reflection depth (Z-axis), while the cosine term (based on the law of cosines) accounts for the radial displacement of the observation point relative to the center of the contact surface.
4. The Selection of Simulation Parameters and Justification of the Thermal Load
The idealized waveforms as functions of time t, for typical short-term current surges of the main lightning discharges, are assigned a formula defined by the so-called Heidler function, with , of the following order [1,28,29]:
where I—peak current value (A), k—correction factor for the peak value of the lightning current, —rise time factor of the lightning current, and —time to half the peak factor of the lightning current.
A graphical visualization and a description of the basic parameters of the short-duration component of the lightning current are presented in Figure 5.
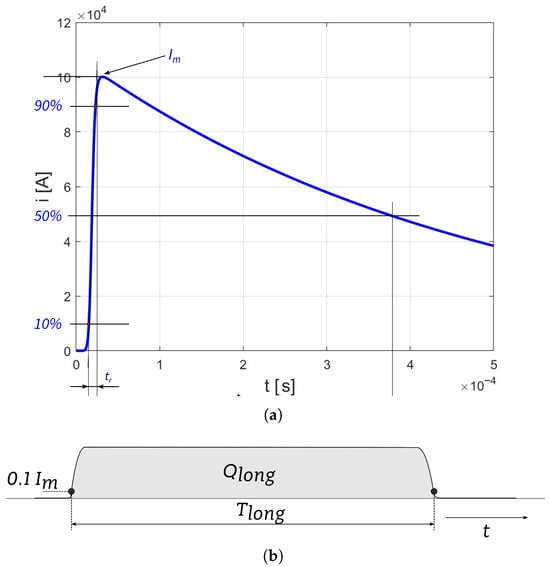
Figure 5.
An example of lightning currents: (a) idealized using Equation (22) for a standardized return-stroke current waveform of 10/350 µs for the first positive lightning discharge; (b) for a standardized continuing current shape, typically 2 ms < < 1 s.
Although the short-term component is often used to assess the effects of lightning currents, the long-term component of the lightning current (continuing current) is more significant in determining thermal increases [30,31]. This statement is absolutely correct for two reasons, as presented below.
4.1. Total Charge and Energy Deposition
In the proposed mathematical model, the temperature rise scales linearly with the total electric charge transferred, denoted as Q (i.e., ). The total energy dissipated by the lightning current at the strike point is defined as follows:
Assuming a simplified model with a constant cathode voltage drop (), typically 10–20 V [32,33], the energy equation can be approximated as follows:
Comparing the orders of magnitude for typical lightning components reveals the dominant role of the continuing current:
- Return stroke (first stroke)—characterized by an extremely high peak current (even 200 kA for LPL I, typically kA) but a very short duration (≈350 μs)
- Continuing current (long duration component)—characterized by a relatively low current (e.g., 400 A) but a significantly longer duration (≈0.5 s)
As the conclusion might be stated, the continuing current component delivers approximately two orders of magnitude more charge than the return stroke, making it the primary factor responsible for thermal damage.
4.2. Thermal Diffusion Time and Penetration Depth
For the heat flux to propagate through the metal sheet and induce a temperature rise on the rear surface, a specific time scale is required. This physical constraint is governed by the thermal relaxation time (diffusion time constant) of the material, defined as follows:
where is the sheet thickness, and is the thermal diffusivity.
- Short-impulse regime—for a return stroke duration (), the thermal energy does not have sufficient time to penetrate the material depth. Consequently, the energy is primarily dissipated through surface phenomena, such as ablation or vaporization of the outer layer, rather than through volumetric heating;
- Continuing current regime—the duration of the continuing current is comparable to or longer than the diffusion time–stroke duration (). This allows for effective heat conduction through the entire thickness of the sheet, leading to a significant temperature rise on the bottom surface and potential melt-through.
It is worth noting that these two currents have different time characteristics, so it is crucial to determine their relationship to the charge delivered to the impact site. The most straightforward and precise definition states that the total charge (Q) is the integral of the current () over the duration of the discharge.
In a graphical sense, Q is the area under the current–time graph. The formulae presented above (Equations (16) and (17)) contain the term
We can transform it by taking the average current () as follows:
Thus, to simplify somewhat, the formula assumes that a constant current of intensity flows for time , delivering a continuous heat flux () to the material. At time , the current suddenly disappears, resulting in a rectangular heat pulse. This is the so-called rectangular approximation. For the long-term component (continuing current), which is actually relatively flat and stable, this approximation is excellent.
An exemplary visualization of the influence of both discharge components on the temperature increase is presented in Figure 6.
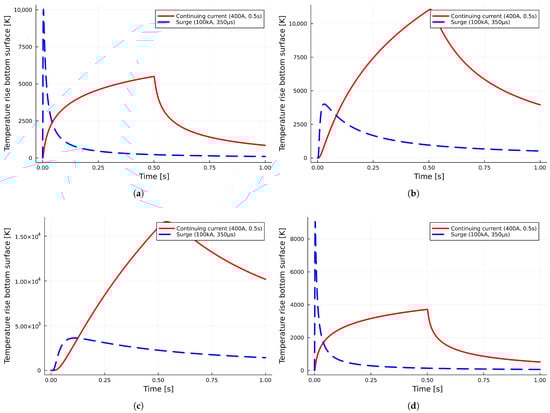
Figure 6.
An exemplary comparison of temperature risings for two lightning current components and analyzed materials with a thickness of mm: (a) aluminum sheet, (b) low-carbon steel sheet, (c) stainless-steel sheet, and (d) copper sheet.
Although the return stroke has a massive peak power (P), it is the continuing current that delivers the critical charge (Q) required for the phase change (melting). Recent studies have confirmed that the continuing current component is the primary driver of thermal damage and ignition risks, prompting new investigations into its physical mechanisms [34,35]. The comparative graph reveals two different mechanisms of the thermal impact of lightning on a thin sheet ( mm) as follows:
- Return-stroke regime (blue line)—The thermal mechanism is strictly dependent on power-controlled phenomena (P). Due to the enormous current (i.e., 100 kA), a large amount of energy is delivered to the material in a fraction of a millisecond. Thermal conductivity cannot keep up with the heat dissipation to the sides, which causes a rapid, almost adiabatic temperature rise. In effect, although the instantaneous temperature is high, the total amount of heat is limited (, resulting from the integration of the assumed 100 kA/350 μs surge waveform). After the pulse stops, the material cools very quickly—heat dissipates throughout the sheet metal. The primary hazards for this mechanism are the risks of surface vaporization (ablation) and mechanical damage (shock waves), with a lower risk of melting the entire volume;
- Continuous regime (red line)—This thermal mechanism is dependent on energy-controlled phenomena (Q). The current is relatively low (400 A), so the initial temperature increase is negligible. However, the phenomenon lasts for a long time ( s), allowing for gradual heat accumulation in the material (“annealing”). As the effect might be observed, the temperature increases monotonically and covers an increasingly wider area of the material. The final temperature is much higher because the total energy balance (200 C) is many times higher. The main hazards this time are classic remelting, the formation of a large pool of liquid metal, and perforation (holes).
In reality, lightning currents are rarely rectangular. They are usually described by double-exponential functions (the so-called Heidler function or a simple sum exponential). The return-stroke component is characterized by a very rapid rise, on the order of microseconds, and a slightly slower decay. Although the peak value of is enormous (e.g., 100 kA), the current flow time is very short. Consequently, the integral is low and results in a temperature rising of several degrees Celsius. At this point, it is essential to note the accuracy of this type of representation of stroke waveforms. It is subject to some error because of extending this short spike pulse over the duration (). However, due to the thermal inertia of the metal, the total energy delivered (), not the pulse shape, is what matters for the overall temperature increase. The long-term component (continuing current) often has a trapezoidal or a rectangular shape, lasting hundreds of milliseconds. Therefore, considering not only relatively low values of , on the order of several hundred Amperes, but also a much longer duration, the integral Q will have a very high value. The fit to the model itself will be ideal in this case because the model assumes a continuous and uniform heat supply (constant heat flux density). As the continuing current component of lightning is naturally characterized by such a stable, quasi-steady current flow (as opposed to an impulsive surge), the mathematical assumptions of the model match the actual course of the phenomenon almost exactly. Therefore, the results for this case are highly reliable and are not subject to averaging error.
5. Calculations and Obtained Results
The calculations were performed for four types of materials: aluminum, low-carbon steel, stainless steel, and copper. These are the most commonly chosen materials for roof covering, so it is important to be aware of the differences in resistance to lightning current resulting from a direct lightning strike. The main parameters were determined in Table 3.
Table 3.
Set of material parameters used for calculations.
The value of , the radius of the lightning discharge channel for negative return strokes with a specific current value calculated and adopted in the analyses, was equal to that presented in Table 2. The mechanism of the calculation is described in [6]. Each material was tested based on parameters related to , a continuing current and a sheet thickness of mm, as most commonly used, as well as mm, defined in Table 3 by the minimal thickness that prevents burnout, depending on the material type described in the standard [3].
5.1. Temporal Dynamics of Thermal Heat Penetration at the Impact Point
First, analyses of thermal increases were conducted for the fundamental equation relating to the point located centrally on the surface opposite to the lightning strike location, marked as the BLP point. The results for the analyzed materials are collected in Figure 7.
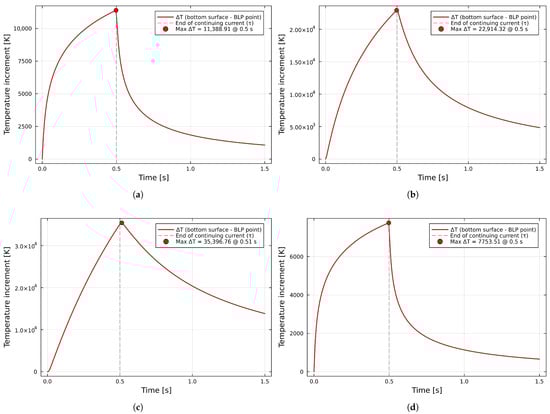
Figure 7.
Results for the point analysis—thermal increment observed at the BLP point ( mm): (a) aluminum, (b) low-carbon steel, (c) stainless steel, and (d) copper.
The results reveal a critical vulnerability in aluminum sheets. Due to high thermal diffusivity, the temperature rise is almost instantaneous. As shown in Figure 7a, the melting point (933 K) is exceeded within the first 50 milliseconds of the continuing current flow. This implies that for thin cladding ( mm), perforation occurs immediately, acting faster than any material thermal relief can occur. It implies that the thermal shock is too rapid for the material to respond via conduction or structural deformation, resulting in immediate localized melting.
The second step of this stage involves a scenario with a sheet thickness of d, defined as being compliant with the standard [3]: mm for aluminum, mm for both types of steel, and mm for copper. The thermal increments are presented in Figure 8.
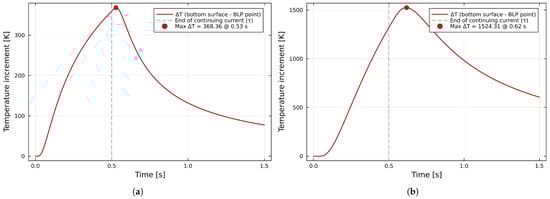
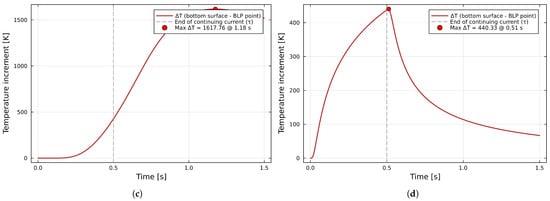
Figure 8.
Results for the 1D analysis—thermal increment observed at the BLP point for sheet thicknesses compliant with the minimal requirements: (a) aluminum ( mm), (b) low-carbon steel ( mm), (c) stainless steel ( mm), and (d) copper ( mm).
The differences are visible not only at first glance, as well as in the maximum temperature, but also in the time of their occurrence. The thermal increases are significantly lower, but the time it takes to reach the maximum value is much different from the thinner sheet case. With this method, it is possible to simply conclude if the given material on the roof has enough resistance to withstand the thermal effect of lightning or not.
5.2. Surface Hazard Analysis: Radial Heat Spread on the Inner Side
At this point, analyses of thermal growth were conducted for the extended equation relating to the thermal distribution on the bottom side of the metal sheet. The results for analyzed materials with a mm thickness are collected in Figure 9.
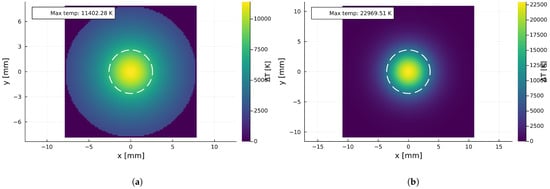
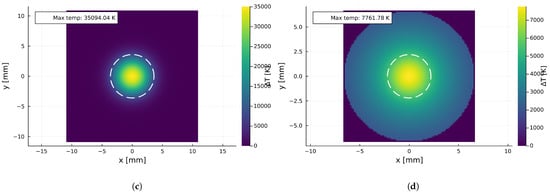
Figure 9.
Results for the thermal distribution observed on the bottom surface for sheet thicknesses compliant with a typical dimension of mm: (a) aluminum, (b) low-carbon steel, (c) stainless steel, and (d) copper.
The 2D thermal maps (Figure 9) identify a dangerous “hazard zone” on the inner surface. Even if the sheet is not fully perforated, the area exceeding the auto-ignition temperatures of common industrial gases (e.g., K) extends several millimeters radially from the impact axis. This “hot spot” creates a potential ignition source for flammable mixtures inside the facility, confirming that structural continuity alone does not guarantee explosion safety.
As a result, thermal profiles for each material were also calculated. A profile is defined as a line on the bottom sheet surface, radially directed outward from the BLP point. The results are collected in Figure 10.
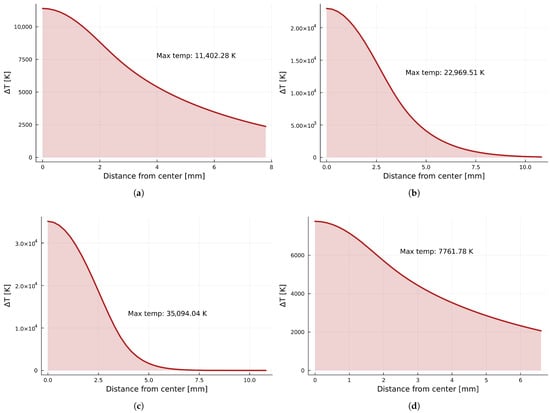
Figure 10.
Results for thermal profiles observed on the bottom surface for sheet thicknesses compliant with a typical dimension of mm: (a) aluminum, (b) low-carbon steel, (c) stainless steel, and (d) copper.
The second step involves a scenario with a sheet thickness of d, defined as being compliant with the standard [3]: mm for aluminum, mm for both types of steel, and mm for copper. The thermal increments on the bottom side of the metal sheet are presented in Figure 11 and Figure 12.
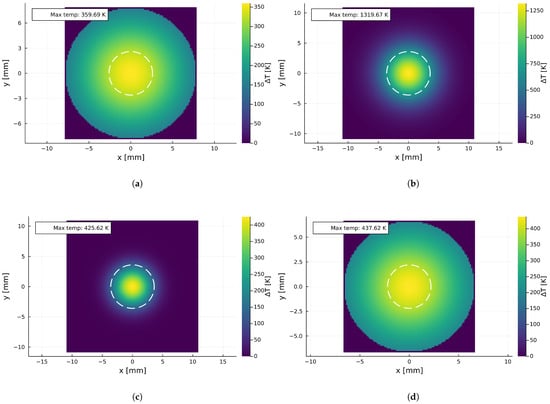
Figure 11.
Results for the thermal rise distribution on the bottom surface for sheet thicknesses compliant with the minimal requirements: (a) aluminum ( mm), (b) low-carbon steel ( mm), (c) stainless steel ( mm), and (d) copper ( mm).
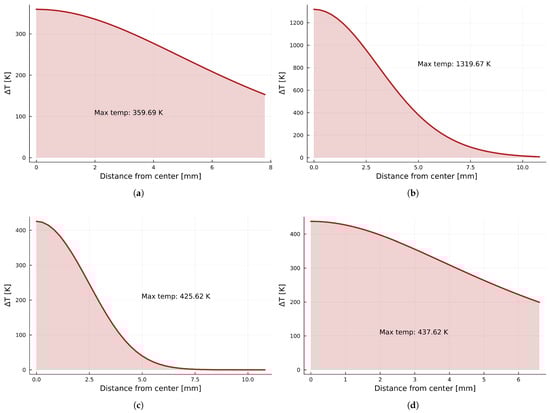
Figure 12.
Results for thermal rise profiles on the bottom surface for sheet thicknesses compliant with the minimal requirements: (a) aluminum ( mm), (b) low-carbon steel ( mm), (c) stainless steel ( mm), and (d) copper ( mm).
The thermal rise profiles for each material are collected in Figure 12.
As can be observed, the obtained results are highly convergent with those obtained during the first stage of the investigation. This time, it can be concluded not only that the temperature rises but also how far the thermal influence extends on the bottom side of the metal sheet struck by lightning.
5.3. Through-Thickness Thermal Profiling and Material Integrity
At this point, analyses of thermal growth were conducted for the extended equation relating to the thermal distribution within the analyzed sheet. The results for a mm thickness are collected in Figure 13. In some pictures, two additional markings are visible:
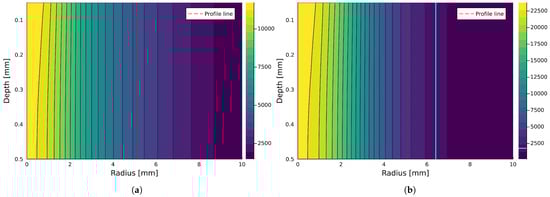
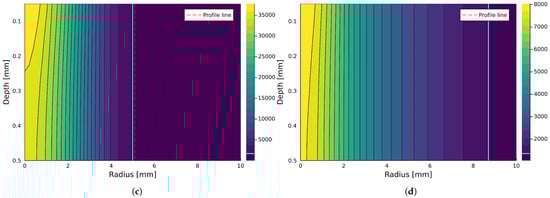
Figure 13.
Results for the thermal distribution observed within sheet thicknesses compliant with a typical dimension of mm (the temperature scale is in K): (a) aluminum, (b) low-carbon steel, (c) stainless steel, and (d) copper.
- Red line—It is a marker for the temperature profile visualized in Figure 14;
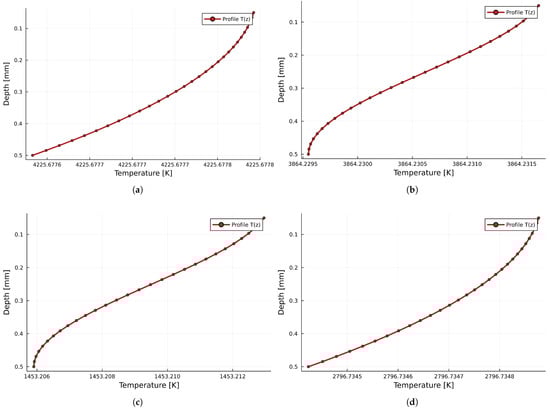 Figure 14. Results for thermal profiles observed within sheet thicknesses compliant with a typical dimension of mm: (a) aluminum, (b) low-carbon steel, (c) stainless steel, and (d) copper.
 - Light blue line—It is a marker for the melting temperature of the given material, according to Table 5.
If a marker connected with a melting temperature is not visible, it means that all the visible cross-sections will be melted.
These visualizations clearly revealed that such a thin metal sheet is not prepared for such enormous lightning energy, and all of them will be perforated. Thermal rise profiles (at the location marked by the red line) for each material are collected in Figure 14.
The second step of this investigation stage involves a scenario with a sheet thickness of d, defined as being compliant with the standard [3]: mm for aluminum, mm for both types of steel, and mm for copper. The temperature increments are presented in Figure 15.
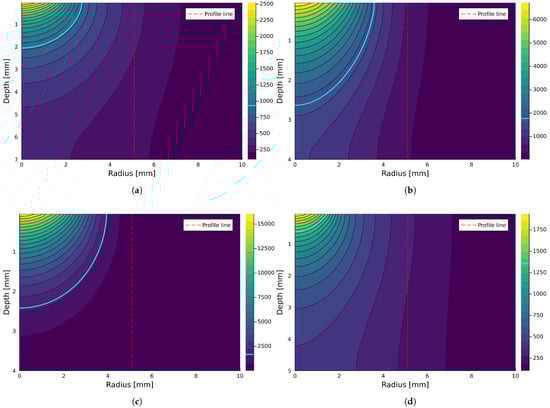
Figure 15.
Results for the thermal distribution observed within sheet thicknesses compliant with the minimal requirements (the temperature scale is in K): (a) aluminum ( mm), (b) low-carbon steel ( mm), (c) stainless steel ( mm), and (d) copper ( mm).
As might be observed, the given thicknesses of the metal sheets are enough to dissipate lightning energy and not be perforated—the blue line does not reach the bottom side of any of the analyzed sheets. The cross-sectional analysis (Figure 15) demonstrates the protective capacity of thicker sheets ( mm). A steep thermal gradient is observed: While the impact surface undergoes melting and ablation (as indicated by the yellow zones), the rear surface remains relatively cool ( K). This confirms that standard-compliant thicknesses effectively dissipate the energy of the continuing current through volumetric diffusion, preventing burn-through. The thermal rise profiles (their location is marked by a red line) for each material are collected in Figure 16.
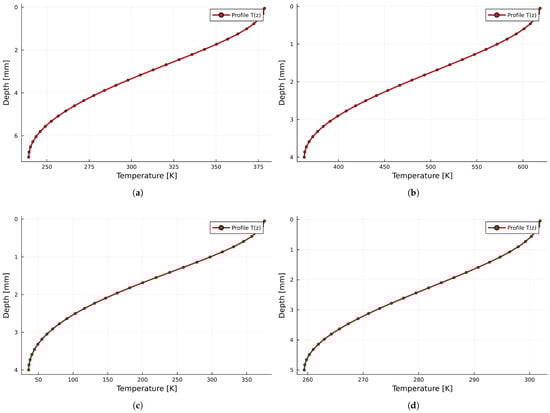
Figure 16.
Results for thermal profiles observed within sheet thicknesses compliant with the minimal requirements: (a) aluminum ( mm), (b) low-carbon steel ( mm), (c) stainless steel ( mm), and (d) copper ( mm).
These results may be helpful in assessing whether the given metal sheet will be perforated or not, as well as how much material will be melted.
5.4. The Critical Role of the Lightning Channel Radius
In comparing the obtained results, a clear convergence is observed between the temperature increments at the bottom point and the distribution on the bottom surface, as well as some differences, such as in the distribution along the cross-section versus the temperature distribution on the bottom surface. In practice, the accuracy of the results is influenced by factors such as
- The assumed lightning contact radius—During the research, it was discovered that the lightning radius parameter is more important than the charge itself. Even small changes in its value significantly affect the obtained results, making it crucial to determine them based on documented publications. The exemplary relation for mm aluminum, between the maximum rising temperature and the assumed value, is shown in Figure 17;
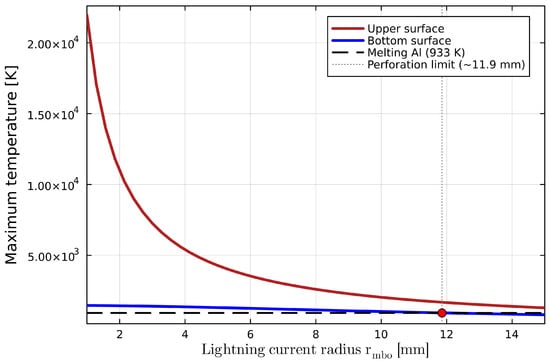 Figure 17. The relation between the maximum temperature and assumed value of the lightning channel radius ().
 - The dynamic nature of the arc root, influenced by factors such as the aerodynamic flow and current amplitude, remains a critical variable in safety assessments, as highlighted in recent simulations [36];
- The lack of consideration of in the current lightning protection standards in the assessment of thermal effects results in the risk of sheet perforation, even if its thickness is selected in accordance with the requirements, as illustrated in Table 4—if will be assumed to be less than the size given in the table, perforation is highly probable;
Table 4. Summary of the risk of sheet metal perforation at a given electrical charge, depending on the radius of the discharge channel ().
- Even if perforation does not occur, a local hot spot exceeding the auto-ignition temperature of gases (e.g., hydrogen or methane) creates an invisible but deadly hazard;
- The thickness of the analyzed material—heat needs a certain time to penetrate the material and, in particular, to pass through its thickness, which can be estimated using the formula s (2.5 ms). In combination with the lightning current time (short or long), various thermodynamic phenomena are observed, which are not easily described by a single universal formula;
- The presented results demonstrate the presence of very large temperature gradients along the Z-axis in a thin layer of material. The surface in contact with the lightning strike often exhibits temperatures well above the melting point, while the bottom surface temperature is below this limit. This observation justifies the use of 2D/3D models instead of simple 1D models, which often average the temperature over a single dimension;
- Numerical consistency in determining the appropriate number of reflections for thin elements is also important. In this work, the parameter was assumed. Choosing a value that is too low will result in a noticeable underestimation of the thermal increments, while selecting a value that is too high will impact the calculation time.
The perforation limit marked in Figure 17 determines the radius (), below which .
Figure 17 presents the most significant finding of this study: the nonlinear sensitivity of the maximum temperature to the lightning channel radius (). While standards focus on the charge (Q), our model shows that reducing this radius from 10 mm to 2 mm results in a tenfold increase in the local temperature density. The red dot marks the ‘perforation limit’ (∼11.9 mm for Al). This proves that a standard lightning continuing current (200 C) can be either harmless or destructive, depending solely on how focused the lightning channel is. This parameter is currently underestimated in risk assessment protocols.
6. Discussion
The conducted analyses proved that the solution to the problem requires conducting research in both thermal and electrical areas. For this reason, exact assumptions must be made, both in terms of materials and in terms of model parametrization and analytical calculations. The presented solution provides an analytical description of heat diffusion in a plate of a finite thickness. However, it should be noted that the model does not account for the latent heat of fusion. Temperatures of around 35,000 K are merely theoretical—in reality, the material would evaporate, and the temperature would stabilize at the boiling point. Currently, the model is linear to infinity. The interpretation of the key components of the equation is as follows.
6.1. Physical Interpretation of the Model
The energy term, defined by the amplitude, scales the resulting temperature depending on the supplied energy and material properties.
The numerator () represents the total energy released in the near-cathode region (the product of the cathode voltage drop and the charge). The denominator () determines the thermal inertia of the system—the higher the thermal conductivity () or the longer the pulse time () at the same energy, the smaller the temperature rise—and heat will have time to dissipate.
The infinite sum described by the apparent source method is responsible for fulfilling the adiabatic boundary conditions on the plate surfaces—no heat flows to the environment.
Physically, this means taking into account multiple “reflections” of the heat wave from the upper and lower surfaces of the sheet. For , we have a real source. For , these are virtual sources distributed in space at intervals of , which simulate thermal insulation.
The heat source profile describes the heat flux density distribution inside a spot of radius .
A parabolic distribution is used, which means that the maximum heating occurs at the lightning-strike center () and decreases to zero at the edge of the spot (). The factor results from the transition to polar coordinates—the Jacobian of the surface integral.
The effective distance (in 3D geometry) is a key element in generalizing the model to points outside the axis of symmetry.
It is the Euclidean distance between the heating element with coordinates and the observation point, . The term is responsible for the penetration and reflection depth (Z-axis). The term with the cosine takes into account the radial shift of the observation point relative to the center of the spot.
The time evolution function () describes the dynamics of heating and cooling based on the fundamental solution of the diffusion equation.
The error function () is characteristic of heat propagation in a continuum. The argument of the function () determines the rate of progression of the thermal front into the material.
And last but not least, spatial integration represents the principle of superposition.
The temperature at any point is the sum of the contributions from all the infinitesimal elements of the heating surface.
An important feature of the model used is the combination of geometric precision (the method of apparent sources ensuring adiabatic conditions on the walls) with a realistic source profile (a parabolic distribution, not flat). Thanks to this approach, the 3D model (Formula (18)) visualizes the temperature gradient along the Z-axis, which simple 1D models cannot visualize.
6.2. Metallurgical Aspects—The “Mushy Zone” Hazard
The obtained results might be used to assess the probability of material melting. Table 5 compares the values characteristic of the analyzed materials [37,38,39].
Table 5.
Comparison of melting points of selected materials.
The concept of “solidus–liquidus” comes from materials science (exactly, from metallurgy) and is crucial when considering alloys (e.g., steel). Unlike pure aluminum or copper, which melt at a single specific temperature, alloys melt within a range of temperatures. Temperature limits are defined as follows:
- The solidus temperature is the temperature at which melting begins. Below this temperature, the material is 100% solid. When the temperature exceeds the solidus point, the first liquid droplets appear in the metal structure, and to be precise, the components with the lowest melting points melt first. Above this temperature, the sheet metal loses its mechanical strength, even though it is not yet in a liquid state. It can deform under the influence of the electrodynamic forces of lightning;
- The liquidus temperature is the temperature at which melting ends. Above this temperature, the material is 100% liquid. Below this temperature, the first solid grains begin to crystallize in the liquid. Only after this temperature is exceeded does the material become fully fluid and can flow freely and create holes or splatter;
- The two-phase region, between the solidus and liquidus, characterizes the material as being in a mushy state. It is a mixture of solid crystals suspended in a liquid, and its consistency resembles that of slush.
In calculations such as this one, a single average value or liquidus value is often assumed as the moment of the occurrence of physical damage (i.e., a hole forms). This is how the melting point limit, as shown in the figures above, was defined. However, it is crucial for the lightning protection designer to recognize that reaching the solidus temperature (the point at which melting begins) is already being in a critical state. The material then loses its mechanical-load-bearing capacity and may rupture under the influence of wind or electrodynamic forces of lightning, even if it is theoretically not yet a liquid.
6.3. Model Limitations and a Conservative Approach
While the proposed analytical model provides a rapid and effective tool for safety assessment, certain limitations inherent to the mathematical simplifications must be acknowledged:
- Temperature-dependent properties—the model assumes constant material parameters (thermal conductivity and specific heat) averaged over the temperature range. In reality, these parameters exhibit nonlinear behavior near the phase transition point. However, comparison with experimental damage patterns suggests that this simplification does not significantly alter the predicted perforation radius for thin sheets;
- The stationary arc assumption—the simulation assumes a stationary arc root. Under natural conditions, aerodynamic flow (wind) may cause the arc to sweep across the surface, distributing the heat over a larger area. Therefore, our stationary model represents a “worst-case scenario”, yielding the highest possible local temperature rise, which is the appropriate approach for defining safety margins in explosion hazard zones;
- Phase-change enthalpy—the analytical solution focuses on the temperature rise up to the melting point. While it identifies the point of the damage (in the solidus–liquidus zone), it does not explicitly model the latent heat absorption during the phase-change process itself (the Stefan problem), which is better suited for complex numerical methods. Nevertheless, for safety engineering, predicting the start of melting is usually sufficient to define the failure criterion.
7. Conclusions
Based on the research carried out and the results discussed above, the following conclusions can be drawn:
- It is possible to carry out electrothermal investigations in the field of the examination of thermal increments of metal sheets constituting the roofing used as a natural lightning rod;
- While conducting this type of research, special attention should be paid to the selection of materials, as well as the method and parameters used for calculations;
- The top surface of the sheet is at risk of melting the material in any case of a lightning strike;
- The bottom surface of the sheet is at risk of the temperature rising above the melting value only for the thinnest sheet thicknesses;
- During the work on the next edition of the IEC 62305 standard, an update will be considered in the assessment of the possibility of using sheet metal as a natural air terminal;
- In particular, the minimum thickness of the sheet required to fulfill lightning protection in the scope of receiving lightning discharges should be made more realistic, for example, by introducing an easy-to-use formula specifying the expected temperature value on the lower surface of the sheet or by preparing software in addition to standard software;
- Since the channel radius of a natural lightning strike is a variable parameter that cannot be controlled, engineering standards should adopt a conservative approach by defining the minimum reference radius (e.g., corresponding to the highest expected current density) to guarantee safety margins;
- Research should be continued, in the form of simulations and laboratory tests, to make the correlation of coefficients with actual parameters more realistic.
Author Contributions
Conceptualization, K.S.; methodology, K.S. and P.S.; software, K.S.; validation, K.S. and P.S.; formal analysis, P.S. and K.S.; investigation, P.S. and K.S.; writing—original draft preparation, K.S.; writing—review and editing, K.S.; visualization, K.S. All authors have read and agreed to the published version of the manuscript.
Funding
This research received no external funding.
Institutional Review Board Statement
Not applicable.
Informed Consent Statement
Not applicable.
Data Availability Statement
The original contributions presented in this study are included in the article. Further inquiries can be directed to the corresponding author.
Conflicts of Interest
The authors declare no conflicts of interest.
References
- IEC 62305-1:2024; Protection Against Lightning—Part 1: General Principles. IEC: Geneva, Switzerland, 2024.
- IEC 62305-2:2024; Protection Against Lightning—Part 2: Risk Management. IEC: Geneva, Switzerland, 2024.
- IEC 62305-3:2024; Protection Against Lightning—Part 3: Physical Damage to Structures and Life Hazard. IEC: Geneva, Switzerland, 2024.
- IEC 62305-4:2024; Protection Against Lightning—Part 4: Electrical and Electronic Systems Within Structures. IEC: Geneva, Switzerland, 2024.
- Sun, J.; Yao, X.; Ren, J.; Le, Y.; Wu, Y.; Rong, M. Analytical Investigation of Lightning Strike-Induced Damage of OPGWs Based on a Coupled Arc-Electrical-Thermal Simulation. IEEE Trans. Power Deliv. 2022, 37, 5252–5260. [Google Scholar] [CrossRef]
- Sobolewski, K.; Struzewski, P. Analysis of Thermal Growth of Sheet Metal Roofing as a Result of Direct Lightning Discharges. In Proceedings of the 2024 Progress in Applied Electrical Engineering (PAEE), Koscielisko, Poland, 24–28 June 2024; pp. 1–8. [Google Scholar] [CrossRef]
- Markiewicz, H. Instalacje Elektryczne; Wydawnictwo Naukowe PWN: Warszawa, Poland, 2018; ISBN 978-83-01-20018-3. [Google Scholar]
- Sowa, A. Thermal impact of lightning currents. Pr. Nauk. Politech. Białostockiej Elektr. 2011, 11, 123–132. [Google Scholar]
- Sowa, A.; Stakhiv, P.; Strużewski, P. Numerical model for calculation of lightning currents in low-voltage power systems. In Proceedings of the 18th International Scientific and Technical Conference on Power Electronics and Energy Efficiency (CEE), Alushta, Ukraine, 17–21 September 2012; pp. 147–151. [Google Scholar]
- Flisowski, Z.; Zieliński, J. Lightning hazard of industrial buildings with modern roofing. Przegląd Elektrotechniczny 1976, 52, 435–438. [Google Scholar]
- Kern, A. The heating of metal sheets caused by direct lightning strikes–model and measurement. In Proceedings of the 20th International Conference on Lightning Protection (ICLP), Interlaken, Switzerland, 24–28 September 1990; pp. 1–6. [Google Scholar]
- Brocke, R.; Noack, F.; Reichert, F.; Ruales, L.; Schönau, J. The effects of long duration lightning currents and their simulation. In Proceedings of the 25th International Conference on Lightning Protection (ICLP), Rhodes, Greece, 18–22 September 2000; pp. 423–428. [Google Scholar]
- Gonzáles, D.; Noack, F. Thermal effects of long strokes on metal sheets: Mathematical model and laboratory results. In Proceedings of the 29th International Conference on Lightning Protection (ICLP), Uppsala, Sweden, 23–26 June 2008; pp. 1–14. [Google Scholar]
- Horváth, T. Durchwärmung des Bleches von Tankdächern beim Blitzeinschlag. In Proceedings of the 17th Internationale Blitzschutzkonferenz (IBK), Den Haag, The Netherlands, 6–9 September 1983; pp. 99–103. [Google Scholar]
- Strużewski, P. Numerical model for assessing the increase in temperature of the inner side of the sheet after a lightning strike. Visnyk Natl. Univ. “Lviv. Polytech.”–Electr. Power Electromechanical Syst. 2010, 71, 92–98. [Google Scholar]
- Uhlig, F.; Lilienhof, H.J. An inverse method approach to evaluate the energy transfer occurring at the electrode surface under the effect of an electrical arc. In Proceedings of the 24th International Conference on Lightning Protection (ICLP); Staffordshire University: Birmingham, UK, 1998; pp. 944–949. [Google Scholar]
- Flisowski, Z. Ochrona Odgromowa Budynków. Tendencje Rozwojowe; Państwowe Wydawnictwo Naukowe (PWN): Warszawa, Poland, 1986. [Google Scholar]
- Hasse, P.; Wiesinger, J.; Zischank, W. Handbuch für Blitzschutz und Erdung, 5th ed.; Richard Pflaum Verlag: Munich, Germany, 2006. [Google Scholar]
- Abramow, H. Calculation of the thermal impact of the lightning channel on metal objects. Izv. Akad. Nauk. SSSR Energ. Transp. 1986, 1, 118–125. [Google Scholar]
- Abramow, H.; Larionow, V. Characteristics of penetration of the walls of metal objects when exposed to lightning. Elektrichestvo 1986, 11, 22–27. [Google Scholar]
- Uman, M.A. The Lightning Discharge; Academic Press: San Diego, CA, USA, 1987. [Google Scholar]
- Braginskii, S.I. Theory of the development of a spark channel. Sov. Phys. JETP 1958, 34, 1068–1074. [Google Scholar]
- Zischank, W.; Drumm, F.; Fisher, R.; Schnetzer, G.; Morris, M. Simulation of lightning continuing current effects on metal surfaces. In Proceedings of the 23rd International Conference on Lightning Protection (ICLP), Firenze, Italy, 23–27 September 1996; pp. 519–526. [Google Scholar]
- Myśliwiec, M. Cieplno-Mechaniczne Podstawy Spawalnictwa; Wydawnictwa Naukowo-Techniczne: Warszawa, Poland, 1972. [Google Scholar]
- Werszko, D. Wybrane Zagadnienia z Techniki Cieplnej, 3rd ed.; Oficyna Wydawnicza Politechniki Wrocławskiej: Wrocław, Poland, 2003; p. 294. [Google Scholar]
- Hering, M. Termokinetyka dla Elektryków; Wydawnictwa Naukowo-Techniczne: Warszawa, Poland, 1980. [Google Scholar]
- Ryżko, H. Podstawy Ochrony Budowli Przed Piorunami; Państwowe Wydawnictwo Naukowe: Warszawa, Poland, 1959. [Google Scholar]
- Sowa, A. Ochrona Urządzeń oraz Systemów Przed Narażeniami Piorunowymi; Oficyna Wydawnicza Politechniki Białostockiej: Białystok, Poland, 2011. [Google Scholar]
- Lira, G.; Nobrega, L.A.; Gomes, L.V.; Costa, E.G. Performance evaluation of MOSA models against lightning discharges. In Proceedings of the XI International Symposium on Lightning Protection (SIPDA), Fortaleza, Brazil, 3–7 October 2011; pp. 154–159. [Google Scholar] [CrossRef]
- Cooray, V. Thermal effects of lightning. In Lightning Protection; IET: London, UK, 2010; pp. 369–406. [Google Scholar] [CrossRef]
- Matsui, M.; Watanabe, T.; Yamamoto, K. Experimental Study on Thermal Damage of Metal Plates Struck by Lightning. In Proceedings of the 32nd International Conference on Lightning Protection (ICLP), Shanghai, China, 11–18 October 2014; pp. 1–6. [Google Scholar] [CrossRef]
- Rakov, V.A.; Uman, M.A. Lightning: Physics and Effects. In Lightning: Physics and Effects; Cambridge University Press: Cambridge, UK, 2003; Chapter 6; pp. 285–340. [Google Scholar]
- Lago, F.; Chamorro, J.J.; López, P.; Ferguson, J.; Edwards, K. A numerical modelling of the lightning arc–aircraft skin interaction. J. Phys. D Appl. Phys. 2006, 39, 2294–2304. [Google Scholar] [CrossRef]
- Yuan, S.; Qie, X.; Jiang, R.; Wang, D.; Sun, Z. Characteristics of continuing currents in negative cloud-to-ground flashes in a plateau region. Atmos. Res. 2020, 236, 104809. [Google Scholar] [CrossRef]
- Perez-Invernon, F.J.; Huntrieser, H.; Gordillo-Vzquez, F.J.; Soler, S. A parameterization of long-continuing-current (LCC) lightning in the lightning submodel LNOX. Geosci. Model Dev. 2022, 15, 1545–1565. [Google Scholar] [CrossRef]
- Meng, G.; Qu, Y.; Zhang, Y. Influence of the aerodynamic flow on the dynamic characteristics of a lightning sweeping arc. Front. Astron. Space Sci. 2023, 10, 1083158. [Google Scholar] [CrossRef]
- Rumble, J.R. (Ed.) CRC Handbook of Chemistry and Physics, 105th ed.; CRC Press: Boca Raton, FL, USA, 2024. [Google Scholar]
- International, A. (Ed.) ASM Handbook, Volume 1: Properties and Selection: Irons, Steels, and High-Performance Alloys, 10th ed.; ASM International: Materials Park, OH, USA, 1990. [Google Scholar]
- Callister, W.D.; Rethwisch, D.G. Materials Science and Engineering: An Introduction, 10th ed.; John Wiley & Sons, Inc.: Hoboken, NJ, USA, 2018. [Google Scholar]
Disclaimer/Publisher’s Note: The statements, opinions and data contained in all publications are solely those of the individual author(s) and contributor(s) and not of MDPI and/or the editor(s). MDPI and/or the editor(s) disclaim responsibility for any injury to people or property resulting from any ideas, methods, instructions or products referred to in the content. |
© 2025 by the authors. Licensee MDPI, Basel, Switzerland. This article is an open access article distributed under the terms and conditions of the Creative Commons Attribution (CC BY) license.