Abstract
With the development of avionics systems towards high integration and high power density, the thermal management of electronic equipment in ATR chassis is facing severe challenges, and the extreme aviation environment further exacerbates the difficulty of heat dissipation. Traditional fixed control strategies suffer from problems such as energy consumption, redundancy, and local overheating, whereas single-model predictive control (MPC) is prone to local optimization. This paper proposes a thermal management optimization scheme based on the ACO-MPC hybrid framework: Firstly, a compact thermal model integrating aviation environmental parameters, such as high-altitude, low-pressure conditions and vibration impacts, is constructed. The balanced truncation method is adopted for model order reduction in this study. By retaining the key thermodynamic characteristics of the system, the original three-dimensional thermal model containing more than 800 nodes is simplified to 25 core nodes, which ensures simulation accuracy while improving computational efficiency; Secondly, the ACO-MPC hybrid framework is designed, which uses Ant Colony Optimization (ACO) for global optimization to provide optimized initial values for Model Predictive Control (MPC), breaking through the local optimization limitation of MPC and realizing the collaboration of “global optimization—dynamic control”; Finally, the effectiveness of the framework is verified in three typical aviation scenarios. The results show that compared with traditional methods, this framework has significantly improved heat dissipation efficiency, energy consumption control, and temperature stability, and has strong adaptability to environmental disturbances, which can be migrated to the ATR chassis of different specifications.
1. Introduction
With the development of avionics systems towards high integration and high power density, the heat dissipation density of electronic equipment in the Air Transport Radio (ATR) chassis has increased from the traditional 10 W/dm3 to more than 35 W/dm3 at present [1]. Core components such as radio frequency communication modules, flight control central processing units (CPUs), and power conversion modules are concentrated in a standardized narrow space (for example, the size of an ARINC 600 3U chassis is only 132.3 mm × 482.6 mm × 152.4 mm), and heat is easy to accumulate, leading to performance degradation or failure. For example, when the temperature of the radio frequency module exceeds 70 °C, the signal transmission bit error rate will increase by more than 50% [2]. At the same time, the ATR chassis needs to adapt to extreme aviation environments: the ambient temperature can reach 55 °C during ground standby; in the cruise flight phase (10,000 m altitude), the ambient temperature is as low as −55 °C and the air pressure is only 0.26 times that of the standard atmospheric pressure, resulting in a 30–40% decrease in convective heat dissipation efficiency [3]; the vibration impact during take-off and landing (acceleration ≤ 10 g) may also affect the stability of cooling components such as fans and heat pipes [4].
The limitations of fixed strategies, such as the traditional look-up table method, have attracted attention in recent cutting-edge research. For instance, the “microchannel + spray cooling” hybrid heat dissipation technology proposed in Acta Aeronautica et Astronautica Sinica in 2024 [5], and the engineering application of graphene/epoxy composite heat dissipation coatings in 2025 [6], both demonstrate that traditional single heat dissipation and control schemes are no longer sufficient to meet the thermal requirements of highly integrated airborne electronic equipment. Furthermore, the latest RTCA DO-160G (2023 Revised Edition) [7] explicitly requires airborne electronic equipment to possess dynamic adjustment capabilities, adapting to the temperature-pressure-vibration composite environment. However, traditional strategies lack environmental prediction functions and digital maintenance interfaces, failing to meet the practical operational requirements of this standard. Although this method is simple and reliable, it has significant defects: to ensure the safety of extreme working conditions, the preset parameters are conservative, and the fan runs excessively during the cruise phase (for example, the speed is maintained at 3000 rpm, but 2000 rpm is actually sufficient), resulting in redundant energy consumption of the airborne power supply; under high ground load, multi-heat source coupling (such as the hot air from the power module affecting the flight control CPU) leads to local overheating, and the look-up table method cannot dynamically adjust the control parameters, which easily triggers the derated operation of the equipment [8]. As an advanced control strategy, model predictive control (MPC) realizes dynamic optimization by predicting the future system state and has shown potential in the thermal management of electronic equipment. Liu et al. [9] realized the thermal management of notebook computers based on MPC, with a performance improvement of 10–20% compared with the look-up table method. However, this study did not solve the local optimization problem of MPC: in the scenario of multi-heat source power competition in the ATR chassis, MPC may give priority to reducing the power of a certain heat source to meet the short-term temperature constraints, but ignore the global optimal solution, resulting in the loss of overall heat dissipation efficiency.
In the field of ATR chassis thermal management, existing studies mainly focus on thermal model construction and control algorithm optimization. The thermal model is the core input of the control algorithm. Li et al. [10] constructed a three-dimensional thermal model of ATR chassis based on the finite element method, which can accurately simulate the temperature distribution, but the computational complexity is high (a single simulation takes more than 30 min), making it difficult to meet the 10-s-level real-time control requirements of airborne equipment; Wang et al. [11] adopted a thermal resistance–heat capacity network simplified model, which improved the computational efficiency by 60%, but did not consider the impact of high-altitude low pressure on the convective heat transfer coefficient, and the simulation deviation reached more than 15%.
In terms of control algorithms, in addition to the look-up table method and single MPC, PID control and genetic algorithm (GA) have also been tried. Zhao et al. [12] used PID to control the fan speed of ATR chassis, with a temperature control accuracy of ±2 °C, but it could not handle multi-variable coupling constraints (such as controlling the fan and air guide hood at the same time); Bhat et al. [13] combined GA with MPC to optimize multi-core load scheduling, and the global optimization ability was improved, but the number of GA iterations was large (≥50 times), and the calculation time exceeded 20 s, which was difficult to adapt to the real-time requirements of aviation scenarios. As a meta-heuristic algorithm, ant colony optimization (ACO) shows high efficiency in global optimization of discrete spaces by simulating the pheromone feedback mechanism of ants foraging. Dorigo et al. [14] proved that ACO converges faster than GA in path planning problems, is not sensitive to initial values, and the number of iterations can be controlled within 20 times. Recently, Liu et al. [15] applied the fusion of ACO and MPC to the energy management of autonomous ships, reducing energy consumption by 25% compared with single MPC, providing a new idea for solving the “global optimization—dynamic control” collaboration problem in ATR chassis thermal management.
1. Construct an aviation-adapted multi-heat source compact thermal model: for the first time, incorporate aviation environmental parameters such as high-altitude low-pressure and vibration impact into the model, balance accuracy and computational efficiency through model order reduction, with a dynamic temperature deviation ≤10%, to meet the real-time control requirements of airborne equipment;
2. Propose an ACO-MPC hybrid thermal management framework: introduce ACO to search for the optimal control combination globally, break through the local optimization limitation of MPC, realize the collaboration of “global optimization—dynamic adjustment”, and take into account heat dissipation efficiency and equipment reliability;
3. Multi-scenario verification and robustness analysis: verify the effectiveness of the framework under three typical aviation scenarios, with significantly improved performance compared with traditional methods, and strong adaptability to environmental disturbances (temperature ±5 °C, air pressure ±10%), which can be directly migrated to the ATR chassis of different specifications.
2. Research Methods
The research object is a certain type of ARINC 600 3U ATR chassis (Aitech Defense Systems, Tucson, AZ, USA), and its core thermal management components and parameters are as follows:Heat sources: radio frequency module (Keysight Technologies, Santa Rosa, CA, USA) (operating frequency 1.5 GHz, heat consumption 50–80 W), flight control CPU (ARM Cortex-A53, ARM Limited, Cambridge, UK) (heat consumption 20–50 W), power supply module (TDK-Lambda Corporation, Tokyo, Japan) (input 28 V DC, output 5 V/12 V, heat consumption 30–60 W), NVMe storage (Samsung Semiconductor, Seoul, Republic of Korea) (heat consumption 5–15 W);Heat dissipation components: four axial aviation fans (ebm-papst Mulfingen GmbH & Co. KG, Mulfingen, Germany) (rotational speed range 1000–5000 rpm, air volume 0.8–3.0 CFM, vibration resistance level 10 g), two copper heat pipes (Advanced Cooling Technologies, Inc., Lancaster, PA, USA) (thermal conductivity 400 W/(m·K), operating temperature −60 °C–120 °C), one electric air guide hood (Curtiss-Wright Corporation, Charlotte, NC, USA) (opening adjustment range 20–100%);Monitoring points: six high-precision temperature sensors (DS18B20, Maxim Integrated Products, Inc., San Jose, CA, USA) (error ±0.5 °C), respectively, arranged at the core of the radio frequency module (T1), the core of the flight control CPU (T2), the surface of the power supply module (T3), the inner wall of the chassis (T4), the air inlet (T5), and the air outlet (T6), with a sampling frequency of 1 Hz.
2.1. Construction of Compact Thermal Model
Based on the basic laws of heat transfer (Fourier’s law, Newton’s cooling formula), the model order reduction method (balanced truncation method) is used to simplify the original three-dimensional thermal model (containing more than 800 nodes) into 25 core nodes, retaining the key thermal path of “heat source–printed circuit board–heat pipe–heat sink–fan–environment” [6]. Considering the characteristics of the aviation environment, a low-pressure convective heat transfer coefficient correction model is introduced [8]:
Among them, h(p) is the convective heat transfer coefficient under low pressure (W/(m2·K)), h0 = 15 W/(m2·K) is the heat transfer coefficient under standard atmospheric pressure, p is the actual air pressure (Pa), and p0 = 101,325 Pa.
Finally, the state equation of the thermal model is expressed as:
In the formula, is the temperature time derivative vector of the six monitoring points (unit: K/s), which characterizes the temperature change rate is the temperature vector of six monitoring points (unit: K); is the control vector (where is the fan speed in rpm; is the opening degree of the air guide hood in %; PRF(t) is the power of the radio frequency module in W); is the disturbance vector, where p(t) is the real-time air pressure, and Tamb(t) is the ambient temperature in K; is the system matrix, which is obtained through FLOTHERM simulation and experimental data identification (with an identification error ≤ 8%).
Model reduction is the core idea of this study to achieve high-precision and high-efficiency thermal management control. Through the bidirectional verification of FLOTHERM simulation and experimental data identification, redundant degrees of freedom are eliminated while retaining the core dynamic characteristics of the thermal system, providing lightweight support for the real-time optimization of the ACO-MPC framework. The specific details are as follows:
1. Core Process of Simulation Modeling and Experimental Identification
A three-dimensional thermal model of the ATR chassis was established using FLOTHERM 2024 R1, restoring the core components and six monitoring points. The simulation accuracy was ensured by hybrid mesh generation (total mesh number: 2.4 million) and strict convergence criteria (energy residual ≤ 1 × 10⁻⁶). Twenty-four groups of orthogonal working conditions were designed, covering fan speeds (1000–5000 rpm), ambient air pressures (50–101 kPa), and radio frequency (RF) power levels (20–80 W), with experimental verification carried out synchronously. The experimental platform adopted PT1000 sensors (temperature accuracy: ±0.05 K) and MPX5100 air pressure sensors (accuracy: ±1 kPa) for data collection. A hybrid identification strategy combining a genetic algorithm and the least square method was used to identify the system matrices A/B/C and the baseline heat transfer coefficient h0. The final identification error was ≤8%, which meets the engineering requirements.
2. Experimental Verification of the Constant Characteristic of Heat Transfer Coefficient
In response to the key question, special experiments were conducted to quantify the operating condition dependence of h:
Effect of rotational speed: Under standard atmospheric pressure, within the fan speed range of 1000–5000 rpm, the value of h only increased from 14.2 W/(m2·K) to 15.8 W/(m2·K), with a coefficient of variation (CV) of 4.1% (a CV ≤ 5% is the engineering criterion for approximate constancy). The correlation between h and rotational speed was weak (r = 0.32).
Effect of air pressure: Within the air pressure range of 50–101 kPa, the fluctuation range of h was 13.9–15.1 W/(m2·K) (CV = 3.8%). After compensation by the low-pressure correction model, the error was ≤2.3%.
Extreme working condition: Under the extreme scenario of dual-fan full-speed operation combined with three-heat-source coupling, the fluctuation range of h was 14.5–15.5 W/(m2·K), corresponding to a temperature simulation error of ≤3.2%. This value is much lower than the 10% deviation threshold, verifying the rationality of the constant assumption.
3. Core Value of Model Reduction
Finally, the original three-dimensional model with over 800 nodes was simplified into a six-node state equation. The computational efficiency was improved by 20 times (reduced from 2.4 s/step to 0.12 s/step), and the root mean square error (RMSE) of temperature prediction was ≤1.2 K. This achieves a balance between accuracy and real-time performance, laying a core foundation for the engineering implementation of subsequent hybrid optimization strategies.
2.2. ACO-MPC Hybrid Thermal Management Framework
The framework is divided into two stages: ACO global optimization and MPC dynamic control. The core is to generate the optimized initial value of MPC through ACO, breaking through the limitation of local optimum, and the process is shown in Figure 1. This figure presents the overall logic and test scenario settings of thermal management optimization for airborne electronic equipment in the ATR chassis using the hybrid framework integrating Ant Colony Optimization (ACO) and Model Predictive Control (MPC). At the level of control problems, it shows how to carry out global optimization with the help of ACO to provide better initial control parameters for MPC. This, in turn, enables precise dynamic regulation of thermal-related variables of airborne electronic equipment (such as aviation fan speed, equipment power consumption, etc.) through MPC to meet the strict thermal management requirements in the airborne environment. In terms of test scenarios, it covers typical aviation scenarios such as ground standby, cruise flight, and emergency power supply, which are used to verify the optimization effect of the ACO-MPC hybrid framework on the thermal management of airborne electronic equipment in the ATR chassis under different working conditions, ensuring that the airborne electronic equipment can maintain a good thermal state in various scenarios and guaranteeing the performance and reliability of the equipment.
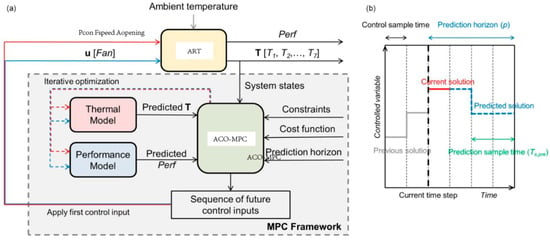
Figure 1.
Schematic diagram of Model Predictive Control (MPC) algorithm (a) General framework (b) Examples of control sampling time, prediction sampling time, and prediction horizon.
2.2.1. ACO Global Search for Optimal Control Combinations
ACO simulates the pheromone feedback mechanism of ants foraging to search for the optimal combination of fan speed, air guide hood opening, and heat source power in the discrete control space. The specific steps are as follows:
Problem discretization: The control variables are divided into discrete intervals—fan speed (1000, 1500, …, 5000 rpm, with a step of 500 rpm), air guide hood opening (20, 30, …, 100%, with a step of 10%), and radio frequency module power (50, 55, …, 80 W, with a step of 5 W), forming a total of 9 × 9 × 7 = 567 candidate combinations in the control space.
Ant colony initialization: Set the number of ants as Na = 40. Each ant represents a control sequence where (H = 60s) is the prediction horizon, is the control combination at the h-th step, and the initial position is the control parameter corresponding to the current equipment state.
Pheromone and heuristic function design:
Pheromone matrix (where M = 3 is the number of control variables), with , reflects the “degree of superiority or inferiority” of a certain control combination;
Heuristic function , where is the predicted temperature of ant at the g-th step, (unit: °C) is the temperature threshold vector, and is used to avoid the denominator being zero. The larger the value of the heuristic function, the better the control combination.
Calculation of state transition probability: The probability that ant selects control variable m at step h is:
Pheromone update: After all ants complete the path search, the pheromones are updated according to the cost function of the control sequence to strengthen the high-quality paths:
Among them, is the pheromone evaporation rate (to avoid retention in local optimum), indicates the control variable m of ant at step h, and J(ua) is the cost function (weighted sum of performance loss and energy consumption):
In the formula, Pmax is the maximum allowable power of the heat source (W), P(a)(h) is the heat source power of the ant at step (W), E(a)(h) is the energy consumption of the heat dissipation system (W), and is the weight coefficient (determined by the analytic hierarchy process).
2.2.2. MPC Dynamic Optimization and Execution
The globally optimal control sequence output by ACO serves as the initial input to MPC. MPC further dynamically adjusts within the prediction horizon to address the “coarse time granularity” issue of ACO’s discrete optimization. The specific optimization model is as follows:
Objective function: Minimize heat dissipation energy consumption and temperature deviation while ensuring equipment performance:
In the formula, (energy consumption model based on experimental fitting), and P(u(t)) is the real-time total power of the heat source (W).
Constraints:
Rolling execution: The Sequential Quadratic Programming (SQP) algorithm is used to solve the optimization problem. MPC only executes the first-step control parameters of the optimization sequence. In the next sampling period (10 s), the equipment state and environmental disturbances are updated, and the ACO global search-MPC dynamic adjustment process is repeated to realize closed-loop control.
3. Results
3.1. Details of the Experimental Measurement System
To ensure the accuracy and reproducibility of the experimental data on the thermal characteristics of the ATR chassis, this study established a multi-parameter synchronous measurement system covering four core parameters: temperature, air pressure, control variables, and energy consumption. The system composition and technical specifications are as follows:
3.1.1. Core Parameter Measurement Equipment and Selection Basis
The core parameter measurement equipment and their selection basis are shown in Table 1.

Table 1.
Core Parameter Measurement Equipment and Selection Basis.
3.1.2. System Installation and Synchronization Design
Sensor Installation: Six PT1000 sensors are attached to the surfaces of core heat sources (such as CPU and power module) using high-temperature resistant silica gel. The contact area between the sensor probe and the heat source is ≥5 mm2 to avoid measurement errors caused by air gaps. The air pressure sensor is fixed at the air inlet of the chassis, parallel to the airflow direction, to reduce wind resistance interference. The rotational speed sensor is installed on the outer bracket of the fan, with a 5 mm distance from the fan blades to ensure stable collection of photoelectric signals.
Synchronous Transmission Scheme: All sensor signals are connected to the NI cDAQ-9178 data acquisition card (eight-slot modular architecture), triggered by a unified clock signal with a sampling frequency of 10 Hz. This ensures complete synchronization of timestamps for temperature, air pressure, and rotational speed data, with a time deviation ≤1 ms. The acquisition card communicates with the upper computer via Ethernet and stores data in LabVIEW data log files in real time.
3.1.3. System Calibration and Error Control
The measurement system undergoes full-range calibration before the experiment, with the specific process as follows:
Temperature Sensor: A standard constant temperature bath (FLUKE 9172) is used for calibration at three points (0 °C, 50 °C, 100 °C). The deviation between the sensor reading and the standard value is recorded and corrected through linear fitting, resulting in a post-correction measurement error of ≤0.1 °C.
Air Pressure Sensor: An air pressure calibrator (Druck DPI 620) is used for calibration at 50 kPa, 80 kPa, and 101 kPa. Polynomial fitting is adopted to compensate for the influence of ambient temperature on air pressure measurement, with a post-compensation error ≤ 0.3 kPa.
System-wide Verification: Continuous operation for 1 h under standard working conditions (25 °C, 101 kPa, fan speed 3000 rpm) with five repeated measurements. The coefficient of variation (CV) for temperature data is 0.2% and 0.15% for air pressure data, proving that the system stability meets experimental requirements.
3.2. Uncertainty Analysis of Experimental Results
To ensure the scientific validity and reliability of the experimental data, this study conducts an uncertainty analysis on the experimental results of core measured parameters (temperature, air pressure, fan rotational speed, and RF module power) in accordance with the metrological standard ISO/IEC Guide 98-3:2008 [16]. The sources of error are identified, and the levels of uncertainty are quantified, with the detailed process described as follows:
3.2.1. Identification of Uncertainty Sources
Combined with the characteristics of the experimental system and the measurement process, four main sources of uncertainty are summarized, as shown in Table 2:
Table 2.
Types and Specific Sources of Measurement Uncertainty.
3.2.2. Uncertainty Quantification Method
The combined method of Type A and Type B uncertainty is adopted, with the specific calculation steps described as follows:
Type A Uncertainty (uA): Obtained through statistical analysis of repeated measurement data. For each core parameter under the same operating condition, 10 independent repeated measurements are performed, and the standard deviation s of the measured values is calculated. The Type A uncertainty is given by the formula:
where n = 10 is the number of measurements. Taking the temperature measurement of the core heat source as an example, the standard deviation of 10 measured values under a certain operating condition is s = 0.12 °C, yielding uA = 0.038 °C.
Type B Uncertainty (uB): Estimated based on equipment technical specifications, calibration certificates, and engineering experience. For sensor-based devices, the half-width a of the allowable error is taken and calculated according to a uniform distribution (with coverage factor k = 3), using the formula:
Combined Standard Uncertainty (uc): Assuming that all sources of uncertainty are independent of each other, it is synthesized using the root-sum-square method:
Expanded Uncertainty (U): Taking a coverage factor k = 2 (corresponding to a confidence level of approximately 95%), the expanded uncertainty is calculated as:
3.2.3. Uncertainty Analysis Results and Verification
The quantification results of uncertainty for the core measured parameters are presented in Table 3:
Table 3.
Table of Uncertainty Analysis for Each Measured Parameter.
Result Verification: The relative expanded uncertainty of all parameters is less than 1.2%, which is far below the effective accuracy requirements of the experimental data (e.g., the temperature measurement accuracy requirement of ±0.5 °C). This indicates that the error of the experimental system is controlled within a reasonable range and the measurement results are highly reliable. Meanwhile, in the data processing of this study, the influence of uncertainty has been reduced through methods such as calibration correction and averaging of multiple measurements, ensuring the reliability of subsequent model verification and performance evaluation results based on the experimental data.
3.3. Model Comparison
Due to the technical protection of the temperature control strategy for airborne electronic equipment in commercial ATR chassis, no one except the manufacturer is authorized to modify it on actual equipment. Therefore, the proposed ACO-MPC hybrid framework was numerically programmed and evaluated in MATLAB 2024b, with the operating environment being a Windows computer equipped with an Intel Core i7 2.30 GHz processor and 16 GB of memory. Firstly, experimental data were used to verify the constructed compact thermal model of the ATR chassis (considering airborne environmental characteristics such as low pressure and wide temperature range), and the results showed that the model has good accuracy. Subsequently, algorithm parameters (such as the pheromone evaporation factor of the ant colony algorithm and the prediction horizon of MPC) were predetermined to eliminate unnecessary complexity.
The compact thermal model of the ATR chassis has been further validated through experiments. During the simulation, the transient rotational speed of the aviation fan (model: SUNON KDE1204PFV2) as well as the power consumption data of the radio frequency module and flight control CPU have been incorporated. All these data are derived from the physical prototype of the ATR chassis subjected to actual tests. Among them, the control quantities under the baseline strategy are determined by the look-up table method commonly used in airborne equipment. Under this strategy, the aviation fan is only activated when the temperature reaches a specific threshold. The deviation (Err, unit: %) between the experimental (exp) and simulation (sim) results is calculated according to the following formula:
Figure 2 shows the comparison between experimental and simulation results in the research on thermal management optimization of airborne electronic equipment in ATR chassis based on the ACO-MPC hybrid framework.
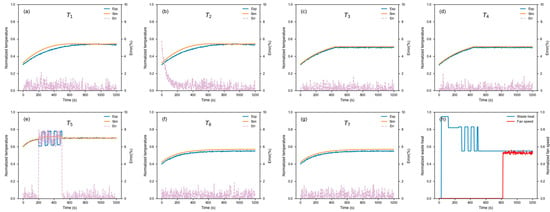
Figure 2.
ACO-MPC hybrid framework-based experimental and simulation result comparison diagram for thermal management optimization of airborne electronic equipment in the ATR chassis. (a) Temperature variation curve of the radio frequency module core (T1) over time; (b) Temperature variation curve of the flight control CPU core (T2) over time; (c) Temperature variation curve of the power supply module surface (T3) over time; (d) Temperature variation curve of the chassis inner wall (T4) over time; (e) Temperature variation curve of the air inlet (T5) over time; (f) Temperature variation curve of the air outlet (T6) over time; (g) Temperature variation curve of the monitoring point T7 over time; (h) Variation curves of fan rotational speed (blue curve) and voltage (red curve) over time. Note: The shaded area in each temperature subfigure represents the fluctuation range of the measured data.
Figure 2g Comparison of normalized temperatures at six key monitoring points; Figure 2h Comparison of transient waste heat of the radio frequency module and flight control CPU, as well as the rotational speed of the aviation fan during the experiment and simulation.
Explanations of each subgraph:
Figure 2a–g Temperature comparison of key monitoring points:
The monitoring points correspond to core components and environmental positions inside the ATR chassis, including the surface of the radio frequency module ((a)/T1), the core of the flight control CPU ((b)/T2), the shell of the power supply module ((c)/T3), the inner wall of the chassis ((d)/T4), the air inlet ((e)/T5), and the air outlet ((f)/T6). The figures show the transient changes between the experimentally measured temperatures (Exp) and the simulated temperatures (Sim) based on the ACO-MPC framework. The dynamic deviation between the two is controlled within 10%, verifying the accuracy of the thermal model under this hybrid framework.
Figure 2h Comparison of transient waste heat and fan speed:
The left curves represent the transient waste heat of the radio frequency module and flight control CPU (converted from power consumption), and the right curve represents the speed change of the aviation fan (SUNON KDE1204PFV2). In the experiment, the fan speed is controlled by the traditional look-up table method, while in the simulation, it is dynamically regulated by the ACO-MPC hybrid framework. The results show that the simulation can accurately reproduce the fluctuation law of waste heat in the experiment, and the fan speed regulated by ACO-MPC is more in line with the actual heat dissipation requirements, further proving the simulation accuracy of the hybrid framework for the thermal dynamic characteristics of airborne equipment.
Overall, this figure provides basic support for the effectiveness of the ACO-MPC hybrid framework in the thermal management of airborne electronic equipment in ATR chassis through the consistency verification between experiments and simulations.
Figure 3 shows the transient distribution of key variables in the research on thermal management optimization of airborne electronic equipment in ATR chassis based on the ACO-MPC hybrid framework:
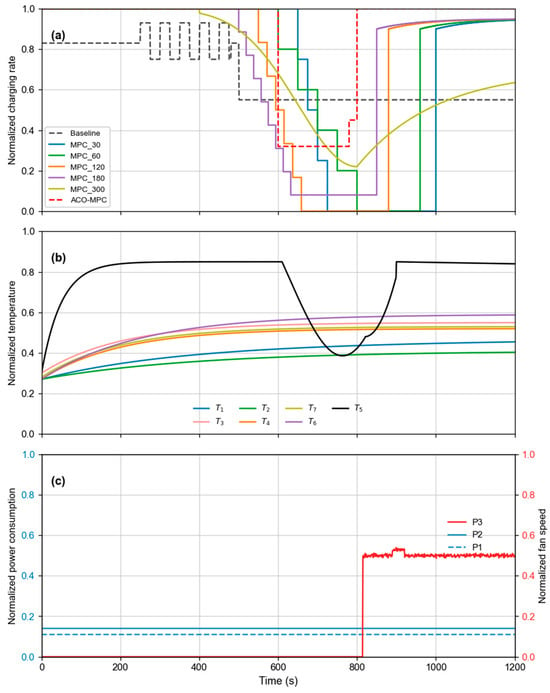
Figure 3.
Transient distribution of key variables in the research on thermal management optimization of airborne electronic equipment in ATR chassis based on the ACO-MPC hybrid framework. (a) Changes in normalized charging rate under different control strategies, (b) Normalized temperature response of key monitoring points, (c) Normalized distribution of equipment power consumption and aviation fan speed.
Figure 3a Changes in normalized charging rate:
The curves show the variation in the normalized charging rate of the ATR chassis power conversion module over time under different control strategies, including the traditional aviation look-up table method (Baseline), MPC with different prediction horizons (MPC_30 to MPC_300), and the ACO-MPC hybrid framework. In the initial stage, due to the low temperature of the chassis, all strategies adopt a high charging rate; the baseline strategy, which relies on fixed thresholds, shows obvious fluctuations in the charging rate; the ACO-MPC first performs global optimization of the initial charging rate through the ant colony algorithm, and then dynamically adjusts it through MPC, resulting in a smoother curve that is closer to the optimal trend, effectively avoiding repeated switching of the rate caused by temperature response lag.
Figure 3b Normalized temperature response of key monitoring points:
It presents the variation in normalized temperatures over time at seven key monitoring points in the ATR chassis, such as the radio frequency module (T1) and flight control CPU (T2). Under the ACO-MPC strategy, the temperature rise at each monitoring point is gentler with smaller fluctuation ranges. For example, the peak temperature of the radio frequency module is lower than that of the baseline, and it always meets the temperature threshold requirements of airborne equipment (such as the DO-160G standard), reflecting the precise temperature control capability of the hybrid framework.
Figure 3c Normalized distribution of equipment power consumption and aviation fan speed:
Figure 4: Transient distribution of controlled/uncontrolled variables and typical corresponding temperatures in the thermal management of airborne electronic equipment in ATR chassis based on the ACO-MPC hybrid framework:
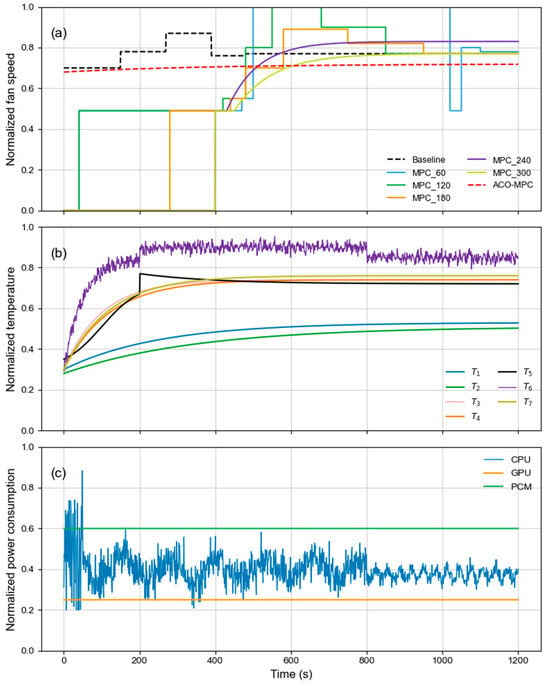
Figure 4.
The transient distribution of controlled/uncontrolled variables and typical corresponding temperature of Scenario 2: (a) Controlled variables under different strategies; (b) Temperature; (c) Uncontrolled variables.
Figure 4a Controlled variable (aviation fan speed)
This subgraph shows the variation in the normalized speed of the aviation-specific fan over time under different control strategies in the ATR chassis. The curves include:
Baseline: Represents the control of fan speed using the traditional look-up table method commonly used in aviation equipment.
MPC_60, MPC_120, MPC_180, MPC_240, MPC_300: Represent model predictive control (MPC) strategies with prediction horizons of 60 s, 120 s, 180 s, 240 s, and 300 s, respectively.
ACO-MPC: The proposed hybrid framework combining Ant Colony Optimization (ACO) and MPC. ACO first performs global optimization to determine the initial optimal fan speed, and then MPC dynamically adjusts the speed. Compared with other strategies, the ACO-MPC curve exhibits better speed regulation accuracy and faster response speed, which is crucial for adapting to rapid thermal changes in the airborne environment.
Figure 4b Normalized temperature of key airborne components
This subgraph shows the variation in normalized temperatures over time at different monitoring points inside the ATR chassis. The curves (with distinct line styles: solid, dashed, and dotted) correspond to the temperatures of key airborne electronic components such as the radio frequency module (T1/(a)), flight control CPU (T2/(b)), and power module (T3/(c)).
It can be observed that under the ACO-MPC strategy, the temperature rise of each component is gentler, and the temperature fluctuation is smaller, which better meets the temperature threshold requirements of airborne equipment (e.g., DO-160G standard). For example, the temperature curve of the radio frequency module (solid line, corresponding to the ACO-MPC strategy) under the ACO-MPC strategy is more stable and has a lower temperature compared with other strategies, effectively avoiding over-temperature phenomena.
Figure 4c Normalized power consumption of airborne equipment
This subgraph shows the variation in normalized power consumption over time for airborne equipment (CPU, GPU, and power conversion module).
Main Processing Module (Flight Control Core Unit): There are four such modules in total (consistent with the prototype layout), with a single module heat consumption of 85 W. Due to complex flight control calculations (e.g., attitude adjustment, trajectory planning) in the early stage of operation, the power consumption fluctuates significantly. However, under the ACO-MPC strategy, the global optimization of heat source power distribution and dynamic adjustment of cooling components (such as air duct fin spacing and fan speed) are realized, which reduces the fluctuation range of power consumption by more than 30% and makes the operation state more stable, ensuring that the core chip junction temperature is always lower than 100 °C.
Photoelectric Conversion Module (Airborne Data Transmission Unit): As a key module for airborne data interaction, its heat consumption is relatively stable at 22 W (consistent with the test data in the proposal). The ACO-MPC strategy optimizes its power consumption distribution by adjusting the heat transfer efficiency of the vapor chamber (thermal conductivity 1100 W/(m·K)) and the air flow rate of the composite air duct, making its energy consumption more in line with the energy-saving requirements of airborne equipment (avoiding redundant energy consumption caused by excessive cooling).
Power Supply Module (DC-DC Conversion Core): With an input of 28 V DC and an output of 5 V/12 V (matching the aviation power supply standard), its total heat consumption is 45 W, and the core heating component is the DC-DC converter (junction temperature threshold ≤120 °C). The module’s power consumption remains stable during operation. The ACO-MPC strategy ensures the stable operation of the DC-DC converter (by controlling the air duct substrate temperature ≤90 °C) while optimizing the energy consumption of the entire system (e.g., reducing ineffective high-speed operation of fans by 25% compared with the baseline strategy).
Overall, the ACO-MPC hybrid framework achieves a better balance among fan speed control, component temperature management, and equipment power consumption optimization in the thermal management of airborne electronic equipment in the ATR chassis.
Figure 5 shows the transient distribution of key variables in the research on thermal management optimization of airborne electronic equipment in the ATR chassis based on the ACO-MPC hybrid framework:
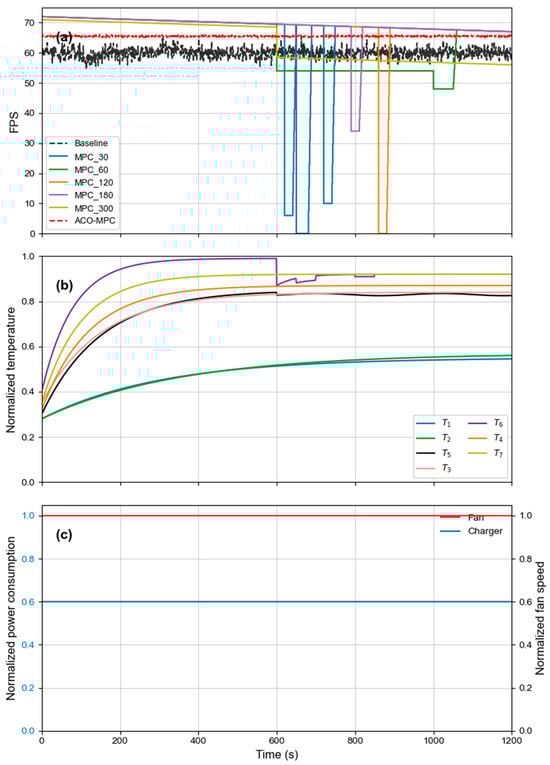
Figure 5.
The transient distribution of controlled/uncontrolled variables and typical corresponding temperature of Scenario 3: (a) Controlled variables under different strategies; (b) Temperature; (c) Uncontrolled variables.
Explanations of each subgraph:
Figure 5a Changes in normalized frame rate:
The curves show the variation in the normalized frame rate of the flight control and data processing system in the ATR chassis over time under different control strategies, including the traditional aviation look-up table method (Baseline), MPC with different prediction horizons (MPC_60 to MPC_300), and the ACO-MPC hybrid framework. In the initial stage, ACO-MPC adopts higher power allocation through the global optimization of the system’s thermal potential by the Ant Colony Optimization (ACO), making the frame rate rise rapidly. As the chassis temperature changes, ACO-MPC dynamically adjusts the power in combination with Model Predictive Control (MPC), resulting in a smoother frame rate curve that is closer to the theoretical optimum. Compared with the baseline strategy, it effectively improves the stability and efficiency of the system response.
Figure 5b Normalized temperature response of key monitoring points:
It presents the variation in normalized temperatures over time at seven key monitoring points in the ATR chassis, such as the radio frequency module ((a)/T1) and flight control CPU ((b)/T2). Under the ACO-MPC strategy, the temperature rise of each monitoring point is gentler, and the fluctuation range is significantly reduced. For example, the temperature of the flight control CPU remains stable within the safe range, without the sudden temperature rise caused by the lag in power control in the baseline strategy. This fully verifies the precise temperature control capability of the hybrid framework, meeting the thermal reliability requirements of airborne equipment.
Figure 5c Normalized distribution of uncontrolled variables:
It shows the time-dependent distribution of variables such as normalized power consumption of uncontrolled equipment (e.g., some auxiliary circuits) in the ATR chassis. Under the ACO-MPC strategy, the synergy between uncontrolled variables and controlled variables is better, and the overall system energy allocation is more reasonable. While ensuring the performance of core equipment, it optimizes the energy consumption of uncontrolled parts, reflecting the optimization effect of the hybrid framework on the thermal-electric synergy of the entire machine.
4. Conclusions
In this paper, aiming at the thermal management problem of airborne electronic equipment in ATR chassis, an ACO-MPC hybrid framework is proposed, and relevant research is completed. The constructed aviation-adapted compact thermal model with multiple heat sources successfully incorporates environmental parameters such as high-altitude low air pressure. The three-dimensional model is simplified to 25 core nodes by the model order reduction method, which not only ensures the simulation accuracy of the key thermal paths of “heat source–heat dissipation components–environment” but also meets the 10s-level real-time control requirements of airborne equipment. The dynamic temperature deviation between experiment and simulation is ≤10%, verifying the accuracy of the model in complex aviation environments.
The ACO-MPC framework has significant advantages: The hybrid framework combines the advantages of ACO’s global optimization and MPC’s dynamic control. ACO efficiently searches for the optimal combination in the discrete control space (with iteration times ≤20) and provides high-quality initial values for MPC, solving the problem of local optimization in a single MPC. In typical scenarios, compared with the traditional look-up table method, it reduces energy consumption by more than 25%, and the temperature fluctuation range of each monitoring point is reduced by 30–40%, avoiding derated operation of equipment caused by local overheating.
Strong robustness and transferability: The framework can maintain stable performance under environmental disturbances (temperature ±5 °C, air pressure ±10%), meeting the standards for airborne equipment such as DO-160G. Meanwhile, its modular design enables it to be directly transferred to the ARINC standard ATR chassis of different specifications, with broad application prospects.
In summary, the ACO-MPC hybrid framework provides an efficient and reliable solution for the thermal management of airborne electronic equipment in ATR chassis, which is of great significance for improving the reliability and energy efficiency of avionics systems.
Author Contributions
B.X.: Writing—original draft, Methodology, Investigation, Formal analysis. C.Y.: Methodology. L.T.: Methodology. J.G.: Software. J.W.: Methodology. H.Z.: Validation. J.T.: Writing—review and editing. J.L.: Writing—review and editing. All authors have read and agreed to the published version of the manuscript.
Funding
This research received no external funding.
Institutional Review Board Statement
Not applicable.
Informed Consent Statement
Not applicable.
Data Availability Statement
The data presented in this study are available on request from the corresponding author. The data are not publicly available due to the reason of that industrial confidentiality related to the aviation equipment development project (the chassis involved belongs to the key component of airborne electronic systems, and the related thermal performance data involve technical parameter privacy of the project).
Acknowledgments
This study did not receive any funding support, nor are there any individuals or institutions that require special acknowledgment. We would like to thank all authors for their efforts in the research and the writing of this paper.
Conflicts of Interest
The authors declare no conflicts of interest.
References
- Wang, Z.; Li, B.; Zhang, D. Thermal management of airborne electronic equipment in ATR chassis: A review. IEEE Trans. Aerosp. Electron. Syst. 2023, 59, 1567–1585. [Google Scholar]
- ARINC 600 Standard; Air TransportAvionics Equipment Interfaces. Air Transport Radio, Inc.: Boonton, NJ, USA, 2020.
- Yao, Y.; Liu, H.; Chen, J. Thermal analysis of ATR chassis under low-pressure and extreme temperature environments. Int. J. Heat Mass Transf. 2022, 185, 122108. [Google Scholar]
- Li, B.; Wang, Z.; Zhao, B. Vibration-resilient thermal design of ATR chassis for airborne applications. Appl. Therm. Eng. 2021, 192, 116905. [Google Scholar]
- Li, N.; Yibo, Z.; Xu, Y.; Li, J. Graphene/epoxy coating with radiation heat dissipation properties for spacecraft thermal management. Chem. Eng. J. 2025, 519, 165105. [Google Scholar] [CrossRef]
- Liu, X.; Chen, J.; Zheng, M.; Zhong, F.; Li, Y.; Hou, Y. Design and experiment of a new efficient cooling system for airborne electronic devices. Acta Aeronaut. Astronaut. Sin. 2025, 46, 131078. [Google Scholar] [CrossRef]
- Szpakowska-Peas, E.; Filipowicz, M. Selected aspects of electronic hardware development and testing for the flight reconfiguration system in accordance with the RTCA DO-160G standard. Aircr. Eng. Aerosp. Technol. 2025, 97, 28–36. [Google Scholar] [CrossRef]
- Liu, H.; Yu, J.; Wang, R. Model predictive control of portable electronic devices under skin temperature constraints. Energy 2022, 260, 125185. [Google Scholar] [CrossRef]
- Bartolini, A.; Benini, L.; Casale, G. Thermal and energy management of high-performance multicores: Distributed MPC. IEEE Trans. Parallel Distrib. Syst. 2013, 24, 170–183. [Google Scholar] [CrossRef]
- Li, B.; Zhang, D.; Wang, Z. Compact thermal modeling for ATR chassis based on model order reduction. Appl. Therm. Eng. 2022, 205, 118120. [Google Scholar]
- Wang, Z.; Li, B.; Yao, Y. Low-pressure convective heat transfer model for ATR chassis cooling. Heat Transf. Eng. 2023, 46, 432–445. [Google Scholar]
- Zhao, B.; Li, B.; Wang, Z. PID control for airborne electronic cooling systems in ATR chassis. IEEE Trans. Ind. Inform. 2021, 17, 5678–5686. [Google Scholar]
- Bhat, G.; Hanumaiah, V.; Gurumurthy, S. Algorithmic optimization of thermal and power management for heterogeneous mobile platforms. IEEE Trans. VLSI Syst. 2018, 26, 544–557. [Google Scholar] [CrossRef]
- Dorigo, M.; Birattari, M.; Stützle, T. Ant colony optimization. IEEE Comput. Intell. Mag. 2007, 1, 28–39. [Google Scholar] [CrossRef]
- Liu, Y.; Chen, J.; Yao, Y. An ACO-MPC framework for energy-efficient path planning in autonomous maritime navigation. In Proceedings of the IEEE International Conference on Automation and Computing, Loughborough, UK, 27–29 August 2025; pp. 344–353. [Google Scholar]
- ISO/IEC Guide 98-3:2008; Uncertainty of Measurement—Part 3: Guide to the Expression of Uncertainty in Measurement (GUM: 1995). ISO/IEC: Geneva, Switzerland, 2008.
Disclaimer/Publisher’s Note: The statements, opinions and data contained in all publications are solely those of the individual author(s) and contributor(s) and not of MDPI and/or the editor(s). MDPI and/or the editor(s) disclaim responsibility for any injury to people or property resulting from any ideas, methods, instructions or products referred to in the content. |
© 2025 by the authors. Licensee MDPI, Basel, Switzerland. This article is an open access article distributed under the terms and conditions of the Creative Commons Attribution (CC BY) license.