Abstract
Incorporating sensors such as microelectromechanical system (MEMS)-based inertial measurement units (IMUs) and strain gauges into aircraft structures has the potential to complement ground vibration testing results and improve the tracking of structural modes and wing shape in flight, as well as structural health monitoring. This study evaluates the feasibility and accuracy of employing MEMS accelerometers and gyroscopes together with strain gauges to estimate the structural modes of an aircraft. For this purpose, a ground vibration test was carried out on a 1:3 scaled Diana 2 glider model from which the displacement, rotation, and strain modes were estimated. The estimated modal parameters were compared with traditional piezoelectric accelerometer results and Finite Element Method model predictions. The results showed that the modal frequencies, damping ratios, and mode shapes estimated using MEMS IMUs and strain gauges closely matched the reference accelerometer estimates. Furthermore, the combination of displacement, rotation, and strain mode shapes allowed for greater insight into the structural dynamics. The exploratory use of gyroscopes for aircraft GVT allowed the structural torsion to be captured directly, thereby potentially simplifying future GVT setups by eliminating the need for placing accelerometers in pairs across the structure.
1. Introduction
In the development and certification process of a new aircraft, Ground Vibration Testing (GVT) is an essential step in updating and validating the mathematical models of the aircraft. These models are then used to predict flutter and show that the aircraft is safe to fly within the operating conditions [1,2]. During the GVT, the aircraft structure is excited with a modal hammer or shakers and the excitation force is measured together with the structure’s response. The excitation and response measurements are then used to derive frequency response functions (FRFs) from which modal parameters such as natural frequencies, damping and mode shapes are extracted [3]. In the traditional experimental modal analysis (EMA), the responses are measured using motion sensors such as piezoelectric accelerometers or laser vibrometers. Therefore, the resulting mode shapes correspond to displacement mode shapes. Accelerometers, in particular, have been the standard choice for aircraft GVTs for decades and have been used extensively across many GVT programs [1,2,4,5].
An alternative but less common approach is to measure the aircraft responses using strain sensors such as strain gauges or fiber Bragg grating sensors. Then, strain frequency response functions (SFRFs) are derived instead, and the resulting mode shapes correspond to strain mode shapes. This allows for direct investigation of the strain distribution for different vibration modes in the structure in an experimental manner. The small size and low weight of strain gauges make them especially suitable for testing structures sensitive to the sensors’ added mass, such as helicopter or turbine blades [6,7,8,9]. In such applications even the small added weight of the accelerometers can result in a shift in modal frequencies and change the mode shapes. Fiber optic strain sensors offer additional benefits, including high sensitivity, immunity to electromagnetic interference, and the possibility of having multiple sensors along a single fiber. These sensors are already being implemented in aircraft and rotorcraft for real-time structural health monitoring for damage or wing shape sensing [10,11,12,13,14,15]. However, the main drawback of using strain sensors is the need for careful installation to ensure a good quality bond between the strain gauge and the test structure. Moreover, interpreting the strain mode shapes on their own can be challenging as it can be unclear which displacement mode shape they correspond to. Therefore, a GVT using both strain gauges and accelerometers simultaneously has been recommended by dos Santos and Peeters [7]. This allowed them to obtain a better understanding between the displacement modes and corresponding strains when testing the wings of the F-16 aircraft.
Another relatively unexplored option in aerospace is to measure the response of the aircraft structure using gyroscopes. This allows the measured rotational rates to be used to directly estimate the rotational modes instead of indirectly deriving them from the displacement modes. Using gyroscopes for vibration testing has been explored in civil engineering, where it showed improved sensitivity to damage localisation when testing concrete beams [16]. The addition of gyroscopes could also bring further advantages to aircraft vibration testing, where improvements to reduce testing time, setup effort, and overall costs are continuously being explored [1,5]. For example, to capture the twisting motion of the aircraft wing, the accelerometers are usually placed in pairs along the wing’s span. Instead of instrumenting two locations with accelerometers, only one location with a combination of accelerometer and gyro would need to be installed to capture the same information. For a GVT program of an Airbus A380, where around 850 sensors were used [2] or Airbus A350 with more than 500 accelerometers [5], this would reduce the number of sensor locations and could lead to significant time savings during the test preparation. Furthermore, the gyroscope measurements and rotational mode shapes can also be used in flight for improved tracking of the structural modes or wing shape sensing [17,18].
As different types of sensors each have their own advantages, a combination of different sensor types could lead to further improvements when estimating the aircraft modal parameters during a GVT or in flight. Both 3-axis accelerometers and gyros can be commonly found in inertial measurement units (IMUs). Microelectromechanical system (MEMS) IMUs have become only a few millimetres in size, are very lightweight and low in cost, and can be found in many consumer electronics products like smartphones and smartwatches. One advantage of MEMS IMUs over piezoelectric accelerometers is their ability to capture static and very low-frequency responses, which is particularly beneficial when testing large or highly flexible aircraft with low-frequency structural modes. These characteristics make MEMS sensors an appealing candidate for in-flight structural monitoring and vibration testing, although their performance in GVT environments remains largely unexplored.
This study evaluates the feasibility and accuracy of using MEMS accelerometers and gyroscopes in combination with strain gauges for aircraft ground vibration testing and demonstrates simultaneous estimation of displacement, rotation, and strain modes. For this purpose, a GVT was conducted on a 1:3 scaled Diana 2 glider model instrumented with IMUs and strain gauges across its structure for aeroelastic flight testing [19]. The modal parameter estimates obtained using MEMS IMUs and strain gauges were then compared with traditional piezoelectric accelerometer results and a Finite Element Method (FEM) model.
The remainder of this paper is organised as follows. Section 2 presents an overview of the modal analysis theory. Section 3 describes the test aircraft and the experimental setup, while Section 4 outlines the FEM model updating procedure based on the GVT and load-displacement test data. Section 5 evaluates the GVT results obtained using different sensor sets by comparing the estimated modal frequencies, damping ratios, and mode shapes. Finally, Section 6 summarises the main findings and conclusions.
2. Modal Analysis Theoretical Background
This section gives a brief overview of the equations governing modal analysis, while a more extensive derivation is presented by Silva [20]. The motion of a continuous structure can be approximated as a system of masses, springs, and dampeners. Such a system with an external force excitation can be described as in Equation (1).
where , , and are the mass, damping, and stiffness matrices, respectively. The column vector contains the mass displacements, and contains the time-varying excitation forces. When looking at the steady state response in the frequency-domain and using the system modal parameters, it can be represented as in Equation (2).
where is the oscillation frequency and , , and are the mode shape matrix, nth natural frequency, and nth damping ratio, respectively. These parameters are part of the FRF matrix . During the EMA, the goal is to extract these parameters from the test data.
According to the modal theory, it is then possible to approximate the structural response as a summation of N modal contributions:
where is the generalised modal coordinate of mode n.
These FRFs are traditionally determined from the displacement, velocity, or acceleration responses measured during the vibration testing. However, this formulation is also valid when gyroscopes are used to measure the rotational rate responses. Then, the degrees of freedom in correspond to displacement in rotation instead of translation, and the resulting mode shapes are rotational mode shapes rather than displacement mode shapes. When strain responses of the structure are measured, it is possible to relate the strains to modal coordinates as shown in Equation (5) [8,20].
where corresponds to measured strains and is a differential operator matrix, which gives the strain mode shapes when applied to the displacement mode shape. Transforming the displacement responses in Equation (2) to strain responses, one can obtain the strain frequency response functions .
As the form for both FRFs and SFRFs is similar, it is possible to apply the same modal parameter estimation tools for both cases.
3. Test Aircraft and Setup Overview
The experiments were conducted on a 1:3 scaled Diana 2 glider model. This model was manufactured by Baudismodel [21] and was subsequently instrumented to serve as a test platform for aeroelastic flight testing and flexible aircraft system identification. This composite glider model has a wingspan of 5 m at a weight of 10.7 kg. An overview of the main technical parameters for the model are presented in Table 1 together with a picture of the glider shown in Figure 1.

Table 1.
Diana 2 model technical parameters.
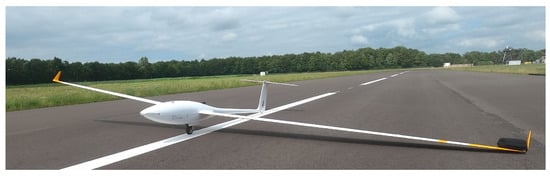
Figure 1.
Diana 2 1:3 scaled glider [19].
The model was instrumented with IMUs, strain gauges, and other sensors, as presented by Jürisson et al. [19]. For the IMUs, the ICM20948 MEMS sensors by TDK InvenSense (San Jose, CA, USA) were used, while the strain gauge voltages were measured using ADS1115 16-bit analogue to digital converters by Texas Instruments (Dallas, TX, USA). External PCB 356A33 and PCB 352C22 piezoelectric accelerometers by PCB Piezotronics (Depew, NY, USA) were also used during the GVT to validate the integrated sensor results. In Figure 2, the integrated sensor locations are presented, while Figure 3 shows the placement of the external accelerometers. There are 12 IMUs, all measuring acceleration and rotational rate along three axes. The external accelerometers consist of 5 triaxial and 30 single-axis sensors connected to a SCADAS acquisition system and Siemens Testlab. As can be seen, the reference accelerometers on the wings are placed in pairs of two to capture the wing torsion.
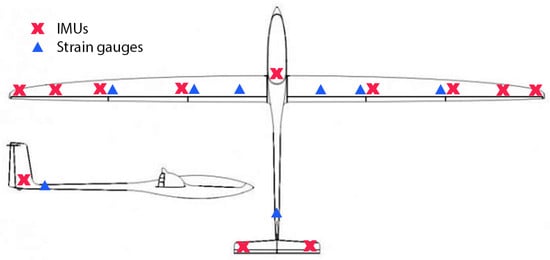
Figure 2.
Integrated IMU and strain gauge locations.
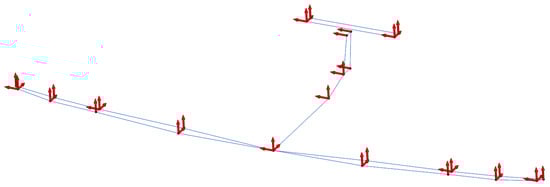
Figure 3.
Reference accelerometer locations with arrows indicating sensor orientation.
Strain gauges are installed at three locations along the span of the wings. Each location has one strain gauge for bending in full bridge configuration and two strain gauges for shear, as seen in Figure 4. At the tail, there are two bending and one shear gauge in full bridge configuration, as seen in Figure 5. The strain gauge used for bending is the EA-06-250PD-350, while the CEA-06-250US-350 was used for shear. In total, 21 strain responses are measured.
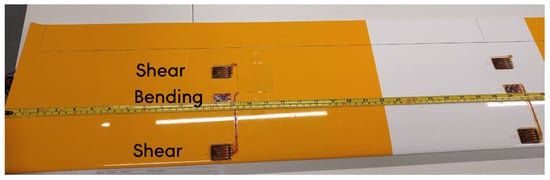
Figure 4.
Strain gauge placement on the wings.
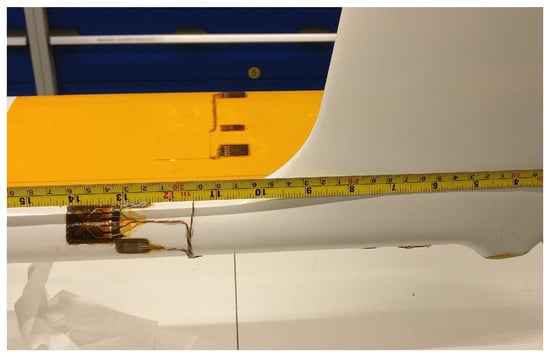
Figure 5.
Strain gauge placement at the tail.
During the test, the aircraft was suspended with elastic bands and excited with a modal hammer at multiple locations. This test setup can be seen in Figure 6.
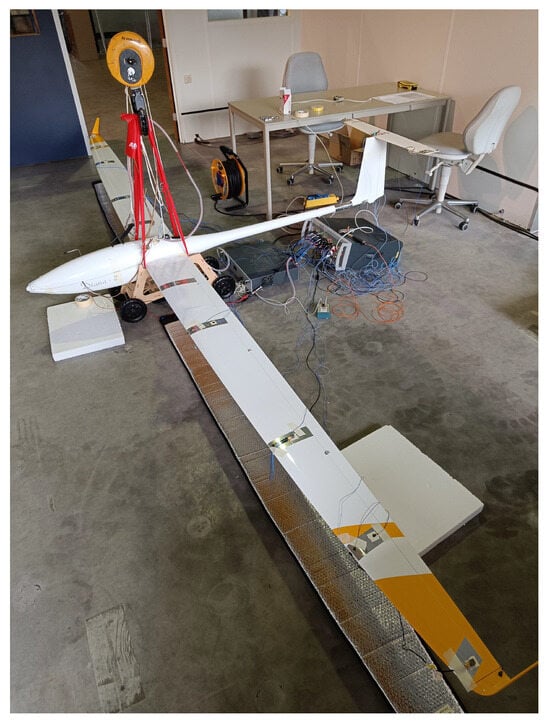
Figure 6.
Ground vibration testing setup.
As the structural responses were collected using two different systems (internal and external), it was necessary to synchronise both systems to ensure the correct calculation of the frequency response functions. The modal hammer output was split into two and connected to both systems to achieve this. This allowed the time signals for a given test point and direction to be recorded in a single, long measurement that covered all hammer hits. The peaks corresponding to the hammer impacts were determined, and the time shift between the two systems was calculated for each hit. The time shifts were then averaged to obtain the final time offset applied to the internal system data. The overall magnitude of this offset was on the order of a few seconds, as the data recordings were started at slightly different times. The variations in the time offsets determined between the different hammer hit peaks were less than the sampling time of the system. At each test location, seven hits were performed to better estimate the average time shift and improve the averaged FRFs for the internal sensors. The custom-built data acquisition system [19] inside the glider does not enforce a fixed sampling time. Therefore, after determining the time shift between the systems, the measurements were also interpolated to match them to the fixed 512 Hz sampling time of the reference system. During the GVT, the objective was to capture structural modes up to approximately 50 Hz. To reduce the influence of high-frequency noise, a low-pass filter with a 100 Hz cutoff was also applied to the data.
4. Diana 2 Glider FEM Model Updating
A FEM model of the glider was also created and updated using the GVT test responses. A FEM model was necessary to be able to directly evaluate the rotational mode shape estimates obtained using the gyroscopes as opposed to indirectly deriving them from the displacement shapes.
The outer geometry of the scaled glider was used to create an initial NASTRAN model that consists of 48 beam elements. These beam elements contain parameters like material properties, cross-sectional area, moment of inertia and mass which can then be adjusted and connected with other beams to represent the structural behaviour of the aircraft. As there was limited information available about the structural properties, this model also allowed to evaluate different sensor layout options for the GVT. In Figure 7, the outer geometry and the beam model are presented.

Figure 7.
Diana 2 model outline and NASTRAN model.
The FEM model structural parameters were updated using the modal frequencies and mode shapes obtained from the GVT tests. In addition, the mass and centre of gravity of the wing and the aircraft were also measured to provide extra constraints for the updating procedure. The weight of the individual wings was measured to be 1.95 kg with a centre of gravity located 0.975 m from the aircraft axis of symmetry. The weight of the fuselage and the tail was 6.8 kg, resulting in a total weight of 10.7 kg for the aircraft, with a centre of gravity 0.74 m from the nose.
A load–displacement test was conducted to gather information about the stiffness of the wings. During the testing, the wing tips were first loaded with lead weights, and then additional loads were applied 1 m from the wing tip. The displacements at 4 points on both wings were recorded for each load case, as shown in Figure 8. These measurement points are indicated as distance y from the centre of the fuselage.

Figure 8.
Diana 2 wing displacement responses for varying tip and mid-wing loads [22].
With all the tests completed, it was possible to perform FEM model updating. For this purpose, FEMtools 4.1 software was used, where all the individual responses can be collected, and automated parameter updating can be performed. First, only the parameters related to wing stiffness were updated based on the load–displacement responses. After that, the entire glider model could be updated using the mass, centre of gravity, and GVT measurements, including the estimated modal frequencies and the displacement and rotational mode shapes. Both of the wings were constrained to have identical structural properties. During the updating, the model parameters are optimised by minimising a cost function based on the differences between the responses predicted by the FEM model and the experimental measurements. The model updating iterations were then performed until convergence was reached, where additional iterations did not improve the model fit further. With the updated FEM model, it was now possible to have an extra point of reference when evaluating the modal estimation results.
5. Results and Discussion
Once the vibration testing was completed and the raw time signals were resampled and filtered, it was possible to determine the FRFs of the internal and external sensors using a estimator as in Equation (9).
Here is the cross-spectrum estimate between the acceleration, rotational rate, or strain output and force input while is the estimate of the input power spectrum. These FRFs were then imported to Siemens Testlab, where the natural frequencies, modal damping, and mode shapes were estimated using the PolyMAX method [23].
First, the quality of the FRFs was assessed. Figure 9 and Figure 10 show the FRFs for the external reference and internal accelerometers. These correspond to the accelerations measured at the elevator’s right tip when the excitation impact was given to the side of the vertical tail. These are indicated as points 23 and 29 in the legend, respectively. The FRFs were calculated from the response measurements covering seven hammer hits at this location. As can be seen, the resonance peaks and phase signals are well captured for both cases and have similar quality.
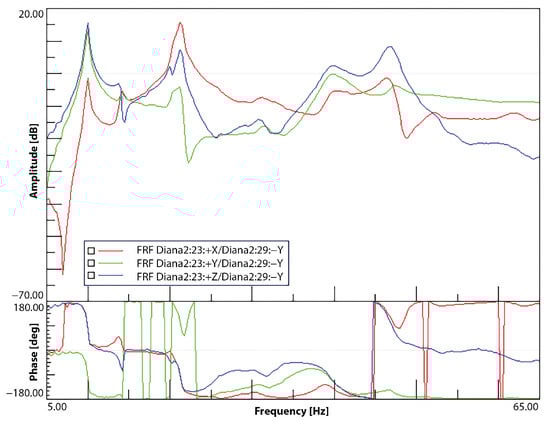
Figure 9.
Right elevator tip reference accelerometer FRFs—vertical tail excitation.
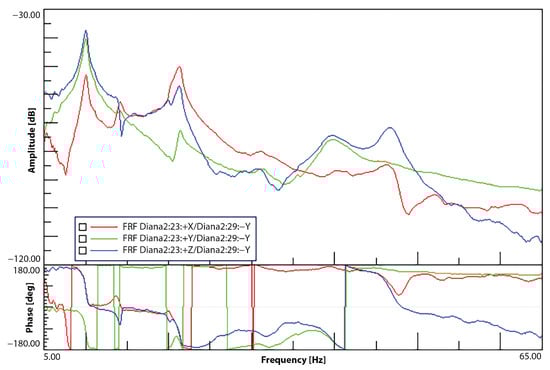
Figure 10.
Right elevator tip internal accelerometer FRFs—vertical tail excitation.
Figure 11 and Figure 12 also present the FRFs for the gyroscopes and strain gauges corresponding to the same test point. Both gyroscopes and strain gauges are able to capture the resonance peaks seen in the accelerometer responses. A slight increase in noise for the FRF amplitude and phase can be seen for the gyroscopes, whereas the strain gauge responses present a much larger noise level. This was expected, as the strain gauge responses are measured using low-cost analogue to digital converters that are limited by their sensitivity and noise. However, despite the sensor limitations, the resonance peaks can still be clearly distinguished.
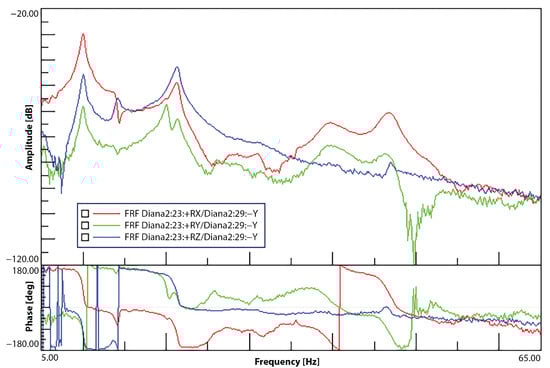
Figure 11.
Right elevator tip gyroscope FRFs—vertical tail excitation.
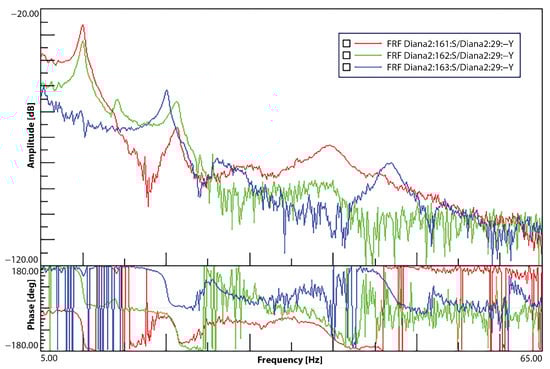
Figure 12.
Tail strain FRFs for vertical tail excitation—torsion (red), side force (green), lift (blue).
Next, the modal parameters were estimated for all the sensor types separately, together with a single combined estimation where the internal accelerometers, gyros, and strain gauges were used simultaneously. The estimations were based on the FRFs from all test points, which were processed together in a single evaluation. First, in Table 2, a description of the estimated modes is presented.
Table 2.
Identified mode descriptions.
In Table 3, a comparison with respect to the reference accelerometers (highlighted) in terms of the natural frequencies is presented. As can be seen, the mode frequency estimates are very close to each other in all cases, with mostly less than difference from the external accelerometer reference case and the largest estimate difference being .
Table 3.
Estimated modal frequency [Hz] comparison between FEM model, reference external accelerometers and internal sensors individually and combined.
A similar comparison is made for the damping estimates in Table 4. A larger variation in the estimated values can be observed for damping, but generally, a close match is still achieved for all sensor types. Furthermore, most of the damping values are close to the 1–2% that is traditionally assumed for structural damping when developing FEM models. For modes 8 and 9, there is a larger difference between the estimates where one estimate resulted in around damping, but other cases have estimates around 5–6% and 3–4%, respectively.
Table 4.
Estimated modal damping results for reference external accelerometers and internal sensors individually and combined.
Next, the corresponding mode shapes were evaluated. In Figure 13, Figure 14, Figure 15, Figure 16, Figure 17 and Figure 18, the first mode shapes are presented that were obtained using all internal sensors simultaneously. In these figures, the aircraft displacement corresponds to the displacement mode shapes. The arrows correspond to the rotational mode shapes, point in the resultant vector direction, and follow the right-hand rule. Finally, the colours correspond to the strain mode shapes, with blue indicating compression and red tension.

Figure 13.
Mode 1.
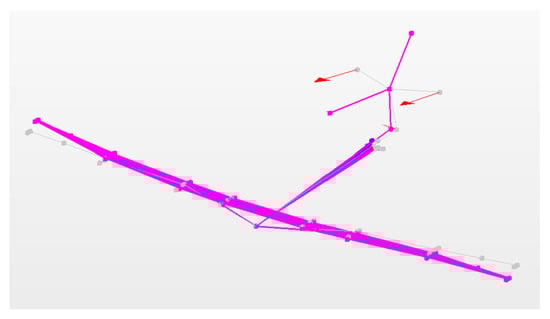
Figure 14.
Mode 2.

Figure 15.
Mode 3.

Figure 16.
Mode 4.
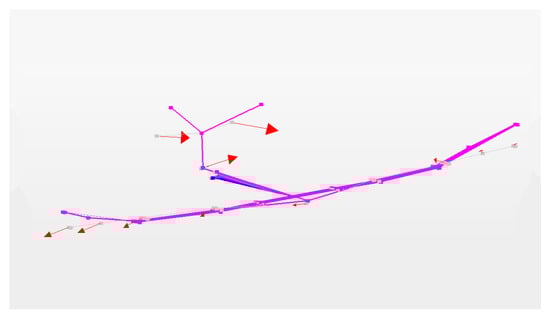
Figure 17.
Mode 5.
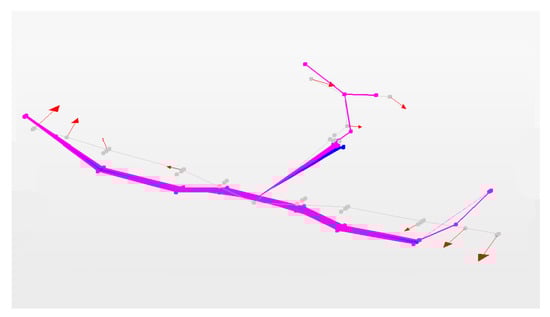
Figure 18.
Mode 7.
The estimated mode shapes were then compared to the external accelerometer reference and FEM model shapes using the Modal Assurance Criterion (MAC) [24] as shown in Equation (10).
where and are the mode shape vectors being compared. The closer the MAC value is to one, the more similar the mode shapes are.
Table 5 presents the computed MAC values for the displacement and rotational mode shapes. The MAC values for the internal MEMS and reference accelerometer mode shapes are calculated in the second column. As can be seen, the displacement mode shapes estimated using the internal MEMS sensors match the reference accelerometer mode shapes very closely, with MAC values close to or well over 0.9 for most modes. Mode 5 was the only outlier with a MAC value of 0.737. The main reason for this appeared to be the wingtip nodes moving out of phase with the rest of the wing during the inplane bending in the reference accelerometer mode. Columns 4 and 5 show the comparison between the displacement and rotational mode shapes estimated using the internal sensors and the FEM model. It can be seen that the FEM model mode shapes were fitted well during the model updating process as, again, most modes achieve a MAC value close to or over 0.9. Both displacement and rotational shapes in the FEM model show similar fitting performance. Only outliers can be seen for modes 9, 10 and 12, where the MAC values remain around 0.7 for either the displacement or rotational shapes. Finally, in column 3, the comparison between the reference accelerometer and FEM model displacement mode shapes is presented. In this case, it was also possible to include the additional measurement points used for capturing the torsion of the wings and horizontal stabiliser. Here again, a similar trend can be seen with most MAC values above 0.9 and a few around 0.65–0.75, matching the other columns. Overall, all the comparisons showed excellent matches in mode shapes with only a few outlier modes with MAC values around 0.7, which can still be considered a good match.
Table 5.
Mode shape comparison between FEM, reference, and internal MEMS sensors for displacement and rotational shapes.
In Table 6 the MAC values are determined between the individual mode shapes estimated using the accelerometers, gyroscopes and strain gauges simultaneously. This allows one to check how similar the mode shapes are to each other, which is also visualised by the background colour in the table. As can be seen, the largest similarities are between modes 1, 7, and 8, which cover the first and second symmetric wing bending motion, and modes 4 and 10, which cover the second and third asymmetric wing bending motion.
Table 6.
AutoMAC results for mode shapes estimated using combined accelerometer, gyroscope, and strain gauge responses.
A well-tuned FEM model was essential to be able to directly compare the rotational mode shapes obtained from the gyroscope measurements. This is opposed to indirectly deriving them from the displacement mode shapes, as is typically required when only accelerometer measurements are available. However, such a derivative-based approach can now be used to evaluate the strain mode shapes. To illustrate this, the mode shapes for the glider main wing are presented in Figure 19, Figure 20, Figure 21 and Figure 22 for modes 1, 4, 7, and 10. These correspond to the first symmetric bending, second asymmetric bending, second symmetric bending, and third asymmetric bending modes. First, the normalised displacement modes in the z-direction are shown, which were all directly obtained from the experiments or the FEM model. Next, a polynomial fitting was performed on the reference accelerometer results, which are also presented. Using the fitted polynomial, it was possible to obtain the corresponding rotational mode shape by differentiation. This is then presented together with directly obtained gyroscope and FEM model results. Other numerical differentiation methods can also be used, as polynomials were used here for simplistic illustration purposes.

Figure 19.
Mode 1—1st symmetric wing bending mode shape comparison.
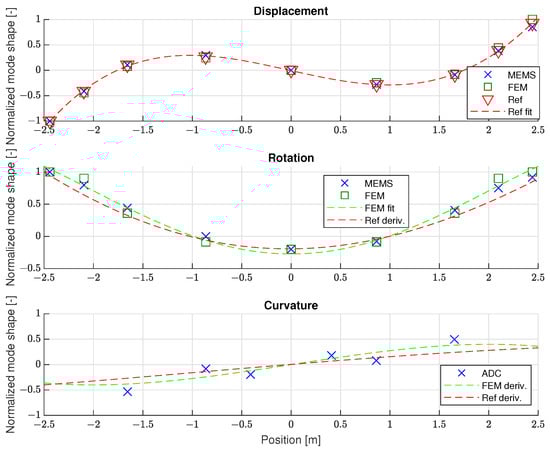
Figure 20.
Mode 4—2nd asymmetric wing bending mode shape comparison.
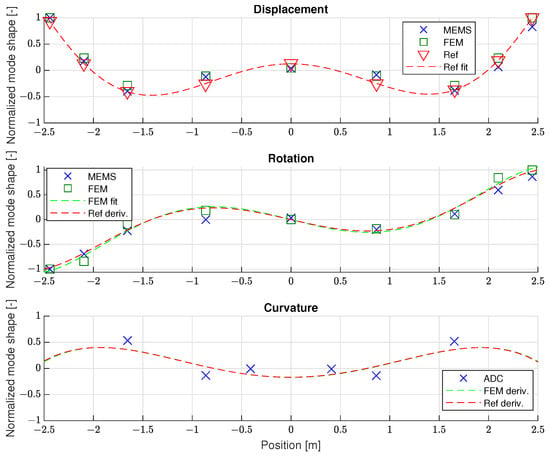
Figure 21.
Mode 7—1st symmetric wing bending mode shape comparison.
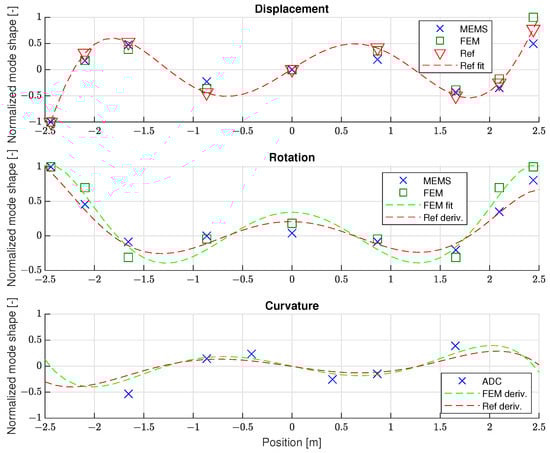
Figure 22.
Mode 10—2nd asymmetric wing bending mode shape comparison.
When considering the main wing as a beam, it is also possible to evaluate the measured strain shapes by comparing them with the wing curvature. This is due to the relation between the curvature and strain at the beam surface shown in Equation (11) [16]:
Here, w is the out-of-plane displacement of the beam, is the slope of that displacement corresponding to the rotation, and is the curvature which is related to the maximum strain on the beam surface through the height of the beam h.
Therefore, in Figure 19, Figure 20, Figure 21 and Figure 22, the wing’s curvature is estimated by taking a second derivative of the polynomial fit for the reference accelerometers. Similarly, for the FEM model, a polynomial fitting for the rotational shapes is performed that is then differentiated and used to estimate the curvature. Both of these indirect results are then compared to the measured strain results. While the results in Table 5 showed good agreement for the displacement and rotational modes, it was now possible to determine that the bending strain modes on the main wings are consistent with the curvature estimates obtained through differentiation.
However, the indirect estimation of mode shapes is very sensitive to errors in the initial displacement shapes, as the minor differences can become significant differences for the rotational and curvature shapes due to differentiation. In this case, it was possible to evaluate the fit accuracy by comparing it with the experimental data and adjusting the polynomial order when necessary. However, in most cases, this would not be possible due to the lack of experimental data, making this process much more difficult. For this reason, using gyroscopes and strain gauges during the GVT has the advantage of obtaining those results directly. Such additional insight into the measured structure can then be used, for example, as additional higher-order constraints during FEM model fitting.
Overall, the results show that it is possible to obtain modal parameter estimates using MEMS IMUs and strain gauges that closely match those obtained using piezoelectric accelerometers. While the objective was not to surpass the traditional approach, the use of different sensor types can provide unique advantages and support new applications such as tracking structural dynamics in flight [18]. A key benefit is the complementary sensitivity of accelerometers, gyroscopes, and strain gauges. At a location where one type of sensor might only show a weak response, another can have a much stronger signal. Gyroscopes and the resulting rotational mode shapes are particularly effective at revealing where twisting and rotational motion occurs, without the need to place accelerometers in pairs along the wings and tail. As a result, their use could reduce the time required to instrument aircraft for future GVTs. The combined estimation approach using IMUs and strain gauges provided greater insight into the structural dynamics than accelerometers alone, offering a much clearer picture of where displacements, rotations, and strains occur. Importantly, using IMUs and strain gauges does not impose limitations on the GVT procedure, as the same excitation methods can be applied.
6. Conclusions
In this work, experimental modal analysis was performed on a scaled Diana 2 glider using MEMS-based IMUs and strain gauges to estimate displacement, rotation, and strain modes. The estimated modal parameters were compared with results obtained using traditional piezoelectric accelerometers and FEM model predictions. This allowed for evaluation of the accuracy of the MEMS IMU sensors and exploration of the feasibility of using gyroscopes for aircraft ground vibration testing.
For this purpose, ground vibration testing was carried out on the scaled Diana 2 glider model using a modal hammer to excite the structure. From the testing, natural frequencies, damping, and mode shapes of the structure were estimated for all different sensor types. A comparison of the experimental results showed that the natural frequency estimates of the structure were within for all the sensors in most cases, with being the largest difference. While more variation in the structural damping estimates was observed, a close match with the reference sensor values was still obtained, with most estimates resulting in around 1–2% damping. Finally, the mode shapes were compared, where MAC values well above 0.9 were achieved for most modes.
The rotational and strain modes obtained directly using the internal sensors were compared to results obtained indirectly by differentiating the external accelerometer displacement modes. The results showed that getting a good approximation of the rotational shapes is possible through displacement shape differentiation. However, as these results are sensitive to errors in the displacement shapes, rotational shapes obtained directly with gyroscopes would be preferred instead.
In conclusion, the estimated modal parameters obtained using the MEMS IMUs and strain gauges integrated into the scaled Diana 2 glider closely aligned with the results obtained using the reference piezoelectric accelerometers. Furthermore, using accelerometers, gyroscopes, and strain gauges simultaneously during the modal analysis allowed for a more comprehensive overview of the vibration modes to be established. More specifically, it allows for better interpretation of strains resulting from corresponding displacements, and gyroscopes help to capture twisting motions without the need for additional accelerometers. These derived displacement, rotation, and strain mode shapes have potential applications in improving in-flight structural dynamics tracking or acting as additional constraints during FEM model updating.
Author Contributions
Conceptualisation, A.J., B.J.G.E., C.d.V. and R.D.B.; methodology, A.J.; validation, A.J. and B.J.G.E.; formal analysis, A.J.; investigation, A.J. and B.J.G.E.; resources, A.J., B.J.G.E. and R.D.B.; data curation, A.J.; writing—original draft preparation, A.J.; writing—review and editing, A.J., B.J.G.E., C.d.V. and R.D.B.; visualisation, A.J.; supervision, B.J.G.E., C.d.V. and R.D.B.; project administration, A.J.; funding acquisition, B.J.G.E. All authors have read and agreed to the published version of the manuscript.
Funding
This research received no external funding.
Institutional Review Board Statement
Not applicable.
Informed Consent Statement
Not applicable.
Data Availability Statement
The data presented in this study are openly available in 4TU Research Data repository at DOI: https://doi.org/10.4121/2c7ef9a5-d749-4b82-a63e-bde7d15d213e.
Acknowledgments
The authors would like to thank the Royal Netherlands Aerospace Centre Flight Physics and Loads department (AVFP) for the support of this research project.
Conflicts of Interest
The authors declare no conflicts of interest.
Abbreviations
The following abbreviations are used in this manuscript:
| EMA | Experimental modal analysis |
| FEM | Finite element method |
| FRF | Frequency response function |
| GVT | Ground vibration testing |
| IMU | Inertial measurement unit |
| MAC | Modal Assurance Criterion |
| MEMS | Microelectromechanical system |
| SFRF | Strain frequency response function |
References
- Peeters, B.; Hendricx, W.; Debille, J.; Climent, H. Modern solutions for ground vibration testing of large aircraft. Sound Vib. 2009, 43, 8. [Google Scholar]
- Giclais, S.; Lubrina, P.; Stephan, C. Aircraft Ground Vibration Testing at ONERA. Aerospace Lab J. 2016, 12, 1–18. [Google Scholar] [CrossRef]
- Ewins, D.J. Modal Testing: Theory, Practice and Application, 2nd ed.; Number 10 in Mechanical Engineering Research Studies Engineering Dynamics Series; Research Studies Press: Baldock, UK, 2000. [Google Scholar]
- Göge, D.; Böswald, M.; Füllekrug, U.; Lubrina, P. Ground Vibration Testing of Large Aircraft—State-of-the-Art and Future Perspectives. In Proceedings of the 25th International Modal Analysis Conference (IMAC XXV), Orlando, FL, USA, 9–13 October 2007. Number 258. [Google Scholar]
- Lubrina, P.; Giclais, S.; Stephan, C.; Boeswald, M.; Govers, Y.; Botargues, N. AIRBUS A350 XWB GVT: State-of-the-Art Techniques to Perform a Faster and Better GVT Campaign. In Proceedings of the Topics in Modal Analysis II; Allemang, R., Ed.; Springer: Cham, Switzerland, 2014; Volume 8, pp. 243–256. [Google Scholar]
- Peeters, B.; dos Santos, F.L.M.; Pereira, A.; Araujo, F. On the use of optical fiber Bragg grating (FBG) sensor technology for strain modal analysis. AIP Conf. Proc. 2014, 1600, 39–49. [Google Scholar] [CrossRef]
- dos Santos, F.L.M.; Peeters, B. On the use of strain sensor technologies for strain modal analysis: Case studies in aeronautical applications. Rev. Sci. Instruments 2016, 87, 102506. [Google Scholar] [CrossRef] [PubMed]
- Kranjc, T.; Slavič, J.; Boltežar, M. A comparison of strain and classic experimental modal analysis. J. Vib. Control 2016, 22, 371–381. [Google Scholar] [CrossRef]
- Weber, S.; Kissinger, T.; Chehura, E.; Staines, S.; Barrington, J.; Mullaney, K.; Fragonara, L.Z.; Petrunin, I.; James, S.; Lone, M.; et al. Application of fibre optic sensing systems to measure rotor blade structural dynamics. Mech. Syst. Signal Process. 2021, 158, 107758. [Google Scholar] [CrossRef]
- Ma, Z.; Chen, X.; Ma, Z.; Chen, X. Fiber Bragg Gratings Sensors for Aircraft Wing Shape Measurement: Recent Applications and Technical Analysis. Sensors 2018, 19, 55. [Google Scholar] [CrossRef] [PubMed]
- Terroba, F.; Frövel, M.; Atienza, R. Structural health and usage monitoring of an unmanned turbojet target drone. Struct. Health Monit. 2019, 18, 635–650. [Google Scholar] [CrossRef]
- Alvarez-Montoya, J.; Carvajal-Castrillón, A.; Sierra-Pérez, J. In-flight and wireless damage detection in a UAV composite wing using fiber optic sensors and strain field pattern recognition. Mech. Syst. Signal Process. 2020, 136, 106526. [Google Scholar] [CrossRef]
- Murthy N, M.; Kakade, P.D. Review on Strain Monitoring of Aircraft Using Optical Fibre Sensor. Int. J. Electron. Telecommun. 2022, 68, 625–634. [Google Scholar] [CrossRef]
- James, S.W.; Kissinger, T.; Weber, S.; Mullaney, K.; Chehura, E.; Pekmezci, H.H.; Barrington, J.H.; E Staines, S.; Charrett, T.O.H.; Lawson, N.J.; et al. Fibre-optic measurement of strain and shape on a helicopter rotor blade during a ground run: 1. Measurement of strain. Smart Mater. Struct. 2022, 31, 075014. [Google Scholar] [CrossRef]
- Zhang, H.; Wang, Z.; Teng, F.; Xia, P. Dynamic Strain Measurement of Rotor Blades in Helicopter Flight Using Fiber Bragg Grating Sensor. Sensors 2023, 23, 6692. [Google Scholar] [CrossRef] [PubMed]
- Bońkowski, P.A.; Bobra, P.; Zembaty, Z.; Jędraszak, B. Application of rotation rate sensors in modal and vibration analyses of reinforced concrete beams. Sensors 2020, 20, 4711. [Google Scholar] [CrossRef] [PubMed]
- Lustosa, L.R.; Kolmanovsky, I.; Cesnik, C.E.S.; Vetrano, F. Aided Inertial Estimation of Wing Shape. J. Guid. Control Dyn. 2021, 44, 210–219. [Google Scholar] [CrossRef]
- Jurisson, A.; Eussen, B.; de Visser, C.C.; De Breuker, R. Flight path reconstruction filter extension for tracking flexible aircraft modal amplitudes and velocities. In Proceedings of the AIAA SCITECH 2023 Forum; American Institute of Aeronautics and Astronautics: National Harbor, MD, USA, 2023. [Google Scholar] [CrossRef]
- Jurisson, A.; De Breuker, R.; de Visser, C.; Eussen, B.; Timmermans, H. Aeroservoelastic flight testing platform development for system identification. In Proceedings of the AIAA SCITECH 2022 Forum; American Institute of Aeronautics and Astronautics: San Diego, CA, USA, 2022; p. 13. [Google Scholar] [CrossRef]
- E Silva, J.M.M. An Overview of the Fundamentals of Modal Analysis. In Modal Analysis and Testing; Springer: Dordrecht, The Netherlands, 1999; pp. 1–34. [Google Scholar] [CrossRef]
- Baudismodel.com. Diana 2 (Scale 1/3)-Baudismodel. 2025. Available online: https://www.baudismodel.com/en/production/k2408-actual-production/3-diana-2-scale-1-3.html (accessed on 15 December 2025).
- Jurisson, A.; Timmermans, H.; Eussen, B.; de Visser, C.; De Breuker, R. Ground vibration testing and FEM model updating of scaled Diana 2 glider model using accelerometer, gyro and strain measurements. In Proceedings of the International Forum on Aeroelasticity and Structural Dynamics, IFASD, Madrid, Spain, 13–17 June 2022; pp. 1–10. [Google Scholar]
- Peeters, B.; Van der Auweraer, H.; Guillaume, P.; Leuridan, J. The PolyMAX frequency-domain method: A new standard for modal parameter estimation? Shock Vib. 2004, 11, 395–409. [Google Scholar] [CrossRef]
- Allemang, R.J. The Modal Assurance Criterion—Twenty Years of Use and Abuse. Sound Vib. 2003, 37, 14–23. [Google Scholar]
Disclaimer/Publisher’s Note: The statements, opinions and data contained in all publications are solely those of the individual author(s) and contributor(s) and not of MDPI and/or the editor(s). MDPI and/or the editor(s) disclaim responsibility for any injury to people or property resulting from any ideas, methods, instructions or products referred to in the content. |
© 2025 by the authors. Licensee MDPI, Basel, Switzerland. This article is an open access article distributed under the terms and conditions of the Creative Commons Attribution (CC BY) license.