Abstract
This study develops comprehensive Safety Performance Functions (SPFs) for various intercity road types in Saudi Arabia, including freeways, multilane highways, and two-lane two-way roads. Data spanning 2017–2019 were analyzed for five regions—Riyadh, Makkah, Eastern, Aseer, and Tabuk—using Negative Binomial (NB) regression models aligned with the Highway Safety Manual (HSM). A total of 26 SPFs were developed to predict total and fatal and injury (FI) crashes, incorporating contextual variables (e.g., tunnel density, U-turn frequency, high-speed vehicle proportion) and developing models separately for each region. It was found that as the median width increases on freeway roads in the Riyadh region, the predicted number of total and fatal and injury crashes decreases. Also, as the percentage of heavy vehicles and U-turn density increases, the number of total and fatal crashes increases on multilane roads in the Makkah region. Moreover, as the degree of curvature increases, the predicted number of total and fatal andinjury crashes increase on multilane and two-lane two-way roads in Tabuk. Lastly, in Aseer, median double marking and tunnel density along curves were significantly affecting crashes on two-lane two-way roads. This study is useful to enhance the methodology used to identify hotspots on the intercity roads in KSA.
1. Introduction
Traffic collisions represent a significant public health challenge in Saudi Arabia, ranking among the top causes of mortality for children and young adults. In 2016, the kingdom recorded the highest rate of traffic fatalities—28.8 deaths per 100,000 people—among all high-income nations [1]. Since then, Saudi authorities have launched a comprehensive road safety campaign aiming to lower this figure to 8 fatalities per 100,000 by 2030. By 2024, the fatality rate had already fallen to 12.3 per 100,000 [2], reflecting concerted efforts by various government agencies. A key element of this progress has been the expansion of enforcement measures across major corridors, and those measures include speed-monitoring cameras, red-light running cameras, seat-belt cameras, and mobile-phone use cameras. While these enforcement measures have significantly improved safety, further reductions will require engineering-based solutions (e.g., geometric and facility improvements). Nevertheless, to close the remaining gap toward the 2030 target, further investment in engineering-focused interventions—such as safer roadway geometry, improved signage, and enhanced pavement treatments—will be essential to complement enforcement and maintain momentum.
The Highway Safety Manual (HSM) [3] presents validated techniques and analytical tools that help to enhance road safety in general. It consists of four parts. Part A contains an introduction about traffic safety and human factor principles for road safety. Part B discusses the road safety management process with its detailed steps. Part C presents predictive methods for estimating crash frequency on a network, facility, or individual site, which are mainly safety performance functions (SPFs). Part D summarizes the effect of different treatments on the various types of roads, which are mainly crash modification factors (CMFs). Therefore, the HSM is a very useful tool that helps government agencies and safety practitioners to handle the different challenges of road safety properly.
SPFs are implemented to predict crash frequencies at specific types of roadway elements, such as intersections and roadway segments. The SPF is a regression model that relates crash frequency with site characteristics, and it is used mainly to predict the number of crashes at a specific roadway element as a function of traffic volume, and in some cases, roadway characteristics. SPF development is important and could be used in many applications, such as the network screening process, evaluating the impact of a countermeasure, and identifying the effect of design changes [4]. Therefore, SPF is an important tool to enhance traffic safety on roads. In the HSM, all SPFs are developed using the negative binomial (NB) model as it is very popular in predicting crash occurrence and not complicated to develop, and it accounts for the overdispersion issue.
This study undertakes one of the first efforts to develop comprehensive SPFs tailored for various types of intercity roads in Saudi Arabia, including freeways, multilane roads, and two-lane two-way roads, across five key regions—Riyadh, Makkah, Eastern, Aseer, and Tabuk. This study offers a detailed analysis of factors contributing to total crashes as well as fatal and injury (FI) crashes on these critical road networks. Despite global efforts to implement the HSM, no prior studies have comprehensively developed SPFs for intercity roads in Saudi Arabia, and detailed comparison with existing studies is provided in the following literature review section. This study bridges that gap by modeling crash predictors across five regions using NB regression. This work not only advances the understanding of region-specific crash predictors but also lays the foundation for data-driven safety interventions tailored to the unique traffic and road conditions of Saudi Arabia.
Accordingly, this paper has three main objectives: (1) to develop region-specific negative binomial SPFs for total and fatal/injury crash frequencies on intercity freeways, multilane highways, and two-lane roads in Saudi Arabia; (2) to identify the key roadway and traffic factors affecting crash rates in each region (including novel variables such as U-turn density and tunnel density); and (3) to compare these full SPFs against simpler AADT-only models to quantify the gain from local variables. These objectives aim to address the gaps identified above and provide data-driven safety tools for Saudi intercity roads.
2. Literature Review
Extensive efforts from transportation professionals have been made to adopt the HSM within the US and worldwide. In the US, the developed SPFs in the HSM were from five states only, and it was recommended for transportation agencies to develop, calibrate, or transfer the SPFs using local data to reflect local conditions. Therefore, some states developed their state-specific SPFs, other states calibrated SPFs for the whole roads or certain roadway classifications, and few states just transferred the HSM-SPFs to their states as it happened to be transferable. Some studies, e.g., [5,6] showed that developing SPFs have superior fit to local data compared to calibrated models from the HSM. In addition, the development of new models allows introduction of new variables which most likely will lead to a better fit of the data.
First, tremendous effort has been made within the US to implement the SPFs by the state departments of transportation. In Florida, researchers [7,8] have developed simple and full SPFs using NB regression models for different crash severity levels, collision types, and time periods for the different road types. In addition, Al-Deek et al. [9] have developed 19 SPFs for intersections based on the new context classification system for state roadways. In Pennsylvania, they have developed Pennsylvania-specific base SPF for 26 of the HSM roadway facility types, and each roadway type has two SPF equations, which address total and fatal and injury crashes [10]. It should be noted that the base condition used is different from the HSM base condition, and it varies by roadway type. Regarding Tennessee, both calibration and development of SPFs have been used, and a total of 15 Tennessee-specific SPFs have been developed. Khattak et al. [11] have developed Tennessee-specific SPFs for rural 3-leg stop-controlled intersections, rural 4-leg stop-controlled intersections, and rural 4-leg signalized intersections. In the same study, they developed a calibration factor for the previous types of intersections. In addition, Khattak et al. [12] have developed Tennessee-specific simple and full SPFs for rural four-lane divided segments, rural four-lane undivided segments, and rural five-lane undivided with two-way left-turn lane segments. Moreover, Khattak et al. [13] have developed calibration factors for interstate roads, expressway, and interchange ramps. With respect to Illinois, they developed Illinois-specific SPFs for 20 of the HSM roadway facility types, and each roadway type has four SPF equations, which are fatal, type-A injury, type-B injury, and fatal and injury crashes [14]. Lastly, a Wisconsin study developed full SPFs for rural two-lane two-way undivided roadways in the state of Wisconsin for all crash types, fatal and injury crashes, and weather-related crashes [15]. They also developed separate SPFs for different Annual average daily traffic (AADT) ranges.
Globally, there are many countries that implemented the HSM approach. In Italy, they have developed four base SPFs for single vehicle, multi-vehicle, fatal and injury for different types of roads [16]. A total of 116 road segments and 5 years’ worth of traffic and crash data were used for base SPF development, and 718 road segments were used for calibration. They considered many variables including horizontal curvature, average radius, lane width, inside shoulder width, portion of segment with a barrier in the median/roadside, distance from edge to barrier face, outside shoulder width, and distance to upstream/downstream entrance. With respect to Spain, they developed a total of 6 models: simple and full SPFs for all AADT range and for two different AADT ranges (AADT ≤ 4000 and AADT > 4000) for rural two-lane two-way undivided roads [17]. They developed simple SPFs based on AADT and full SPFs based on AADT and all road features. A total of 456 homogeneous road segments and a 5-year data were used for model development. They have considered many variables including AADT, percentage of heavy vehicles, length of homogeneous section, lane width, shoulder width, platform width, longitudinal grade, radius, curvature ratio, tangent ratio, driveway density, percentages of existing shoulder, percentages of existing paved shoulder, and speed limit. Regarding Australia, they have developed a total of 30 mean SPFs (for 5 severe crash types: run-off-road, head-on, intersection, pedestrian, other and 6 road types: rural undivided, rural divided/freeway, urban freeway, urban divided, urban undivided, urban local) that predict mean crashes for a particular crash type and particular road for average of the road conditions [18]. They have considered 42 road attributes, such as operating speed, lane width, curvature, quality of curve, delineation, shoulder rumble strips, centerline rumble strips, road condition, AADT per lane, vehicle composition, median type, and lighting.
Within MENA (the Middle East and North Africa), Elagamy et al. [19] developed SPFs for major arterial roads in Egypt. In addition, Asal and Said [20] examined the HSM-SPF models, and they found that there is a need for a further step to develop local SPFs. They developed SPF for rural multilane roads, and it was found that the curve density was the main roadway characteristics affecting crash frequencies on this type of roads. Locally, Kaaf and Abdel-Aty [21] have explored the transferability of HSM-SPFs and developed local SPFs in Riyadh, Saudi Arabia for urban four-lane divided roads and urban intersections. A total of six SPFs were developed for urban four-lane divided roads and three SPFs were developed for urban intersections. They found that the local SPFs provided the best fit of the data (for intersections and divided segments) compared to calibrated SPFs using the HSM default values and Riyadh local CMF values. The considered variables include AADT, length, speed limit, driveway density, lane width, shoulder width, median width for model development for urban four-lane divided roads, and they considered AADT, left-turn lanes, right turn lanes, lighting, left-turn signal phasing, right turn on red, red-light cameras, median width, posted speed limit for both major and minor roads for urban intersection model development. This was the only study to apply SPFs in the kingdom, and it is limited to one city and urban roads only.
Many SPF studies rely on transferring or calibrating default models rather than developing new local SPFs. Additionally, previous research often covers only one state or urban area at a time. In contrast, this study uses comprehensive local crash and traffic data across five regions and builds new SPFs for each road class in each region. By including variables like truck percentage, U-turn density, and tunnel presence, this study addresses the lack of detailed local predictors in earlier work. Thus a significant gap exists in addressing intercity roads in Saudi Arabia, despite their critical role in the region’s transportation network. This study fills that void by developing detailed SPFs for five distinct regions—Riyadh, Makkah, Eastern, Aseer, and Tabuk—incorporating a comprehensive range of roadway characteristics. The inclusion of region-specific variables and advanced modeling ensures a nuanced understanding of crash determinants, enabling targeted safety improvements. By benchmarking the performance of simple SPFs against full SPFs, this research sets a precedent for rigor in evaluating model effectiveness. This work contributes not only to enhancing road safety within Saudi Arabia but also serves as a template for similar region-specific initiatives in other countries seeking to optimize their traffic safety frameworks.
3. Data Collection and Preparation
The Kingdom of Saudi Arabia (KSA) is divided into 13 administrative regions as shown in Figure 1. A significant effort was invested in the data collection and preparation process since this study covers five regions from different directions in KSA, and these regions include Riyadh, Makkah, Eastern, Aseer, and Tabuk regions.
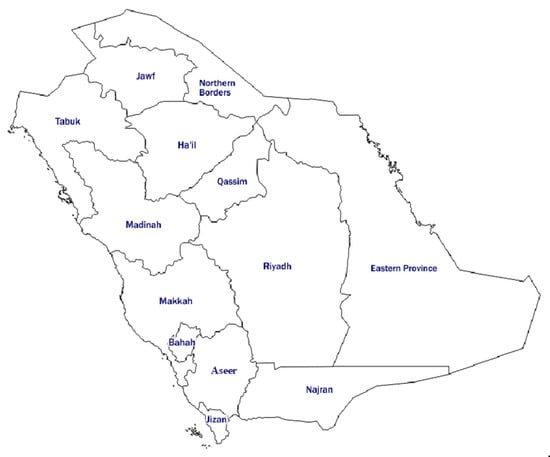
Figure 1.
Administrative regions of Saudi Arabia.
The development of SPF models requires roadway characteristics data, traffic volume data, and crash data. These data are essential for developing full SPFs. However, the development of simple SPFs requires only traffic volume and crash data. Therefore, three years of crash, traffic, and roadway characteristics data were collected for this study.
The intercity roads in KSA are under the supervision of the Ministry of Transport and Logistic Services (MoTLS), and they classified their roads into three categories, which are freeways, multilane highway, and two-lane, two-way roads. Therefore, traffic volume, roadway characteristics, and crash data were collected for each roadway classification in the five regions. Data were retrieved on 10 March 2023. It should be noted that the data was supplied in aggregate, anonymized form, and no personal or identifying information was accessed or used.
Data for this study were primarily sourced from the MoTLS and the National Road Safety Center (NRSC). In addition, there was a need to collect manually more traffic volume data and gather some roadway characteristics information in some regions to develop reliable SPF models. AADT for roads in the study area was estimated using daily traffic volume available for the period of 2017 to 2019 before COVID-19 pandemic for the development of SPFs.
Following that, organizing, cleaning, and preparing the data to have the most accurate and complete data. Homogeneous roadway segments were defined in accordance with the standard guidelines of the HSM to ensure consistency and reliability in SPF development. Segments were split at any location where key roadway or traffic characteristics changed. These characteristics included, but were not limited to, the number of lanes, presence and type of shoulder (paved or unpaved), shoulder width, median type and median width, horizontal curvature characteristics, and the presence of intersections or interchanges. With respect to traffic volume, AADT was treated as a primary exposure variable, and segment boundaries were introduced whenever the AADT changed by more than ±10% relative to the adjacent segment. By applying these criteria, each segment maintained internally consistent geometric and traffic characteristics. All data layers were aligned using the ArcMap, Table 1 presents descriptive statistics for the main variables in the five regions.

Table 1.
Descriptive statistics of main variables in the five regions.
It can be seen that the segment length in this study is variable, and the homogeneous road segments were identified based on AADT, number of lanes, curvature, outside and inside shoulder widths, median width, and presence of intersection/interchange. It can be seen that no segment is less than 160 m. Regarding model development, 80% of the data were used for model development and 20% for validation purposes.
Regarding other variables, this study includes many other variables, such as number of lanes, median width, insider and outsider shoulder widths, driveway density, degree of curvature, curve density, U-turn density, percentage of heavy vehicles, gas station density, observed road speed, proportion of roadside/median barriers, presence of lights, and posted speed. It can be seen that some of those variables were not included in the HSM, and the goal here is to examine their significance in the full SPF models. A total of 22, 23, and 24 independent variables were collected and examined in the full SPF models in freeway, multilane, and two-lane two-way roads, respectively.
4. Methodology
SPF is a regression model that relates crash frequency with traffic volume and site characteristics, and it is used mainly to predict number of crashes at a location as a function of traffic volume, and some roadway characteristics in some cases. Simple SPF relates crash frequency with AADT as a sole independent variable. Full SPF related crash frequency with traffic parameters and geometric parameters as independent variables. In this study, both full and simple SPFs were developed, yet only the model with the best performance, based on goodness-of-fit measures, is presented in the paper.
This study follows the HSM approach to develop SPFs. Therefore, an NB regression model is used to develop SPFs. Poisson and NB regression models could be used for crash frequency analysis. NB models relax the variance assumption by adding an error term to the mean of the Poisson model. The presence of overdispersion is fixed by the log-linear relationship between the predicted number of crashes and covariates.
The general full SPF form for segments is described as follows:
where N represents predicted number of crashes on segment of length L in n number of years, α represents model intercept, AADT represents the annual average daily traffic volume along the segment, β represents coefficient of AADT, xk represents the kth traffic, topographical, or road geometric features along the segment, βk represent coefficient of the kth feature, and m represents total number of these features included in the SPF.
In order to validate the models to ensure accurate results, the validation process will be performed first through a process of checking and measuring reliability. Two goodness-of-fit (GoF) performance indicators were used for validation: mean absolute deviation (MAD) and mean squared prediction error (MSPE). The GoF performance indicators measure the differences between observed and predicted values of SPFs.
The equations for MAD and MSPE measures are as follows:
where n = sample size; = predicted crashes for site i; and = observed crashes for site i.
Full and simple SPFs were developed by employing the NB model. Also, the SPFs for total crashes and FI crashes were developed using the NB model. Akaike information criterion (AIC) value was computed for model comparison between the simple and full SPFs.
5. Analyses and Results
The correlations between explanatory variables were examined using the Pearson product-moment method. Multicollinearity among explanatory variables can alter the magnitude and direction of coefficients or lead to incorrect variable signs. According to Evans [22], the correlation between two explanatory variables is considered high if the absolute value of correlation coefficient is 0.6 or above. In the presence of high correlation, the most significant explanatory variable was kept in the model, and the other correlated explanatory variables were removed.
Alternative model forms have been considered as well. A likelihood-ratio test (comparing Poisson vs. NB) confirmed significant overdispersion (α > 0, p < 0.001), justifying the NB specification. Zero-inflated NB models were also evaluated but provided no significant improvement since segment-level crash counts were not excessively zero-inflated. Variable selection was performed via backward stepwise elimination. A total of 26 full SPF NB models were developed in this study for the different road types in the five regions. For each roadway classification, two models were developed, which are total and FI crashes. Six full SPF models were developed for Riyadh Region, six full SPF models were developed for Makkah Region, six full SPF models were developed for Eastern Region, four full SPF models were developed for Tabuk Region, and four full SPF models were developed for the Aseer Region. In addition, simple SPFs were developed just to compare the goodness-of-fit measure between the simple and full SPFs. Statistical software R version 4.4.1 was used for model development.
Comparisons of goodness-of-fit tests were performed on both the development and validation data for SPFs models of Makkah region, as shown in Table 2.
Table 2.
Results of the goodness-of-fit tests for all developed SPFs of the Makkah Region.
It can be seen that the values of GoF measures for validation set data are comparable with those of development data, indicating that the SPFs have good ability to describe the validation data set. Furthermore, the values of the GoF measures for the full SPFs are smaller compared to the simple SPFs, indicating that the full SPFs outperform simple SPFs. In addition, Figure 2 shows a plot of predicted versus observed all crash frequency values of the total crashes SPFs models for multilane roads in Makkah.
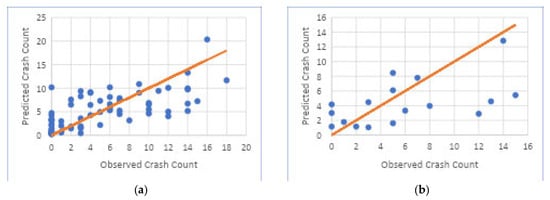
Figure 2.
Plot of the predicted versus the observed all crash counts for multilane roads in the Makkah Region. (a) Makkah total crashes-full SPF; (b) Makkah total crashes-full SPF (validation).
As shown in Table 3, the SPF modeling results for the Riyadh region show that, for freeways, all significant variables except median width have positive coefficients, which indicates that the predicted crash frequencies would increase with an increase in values of those variables. AADT and the percentage of cars driving over 140 km/h are measures of exposure to traffic. The increase in traffic exposure is expected to increase the crash frequency.
Table 3.
Riyadh-specific full SPFs for total and FI crashes on freeway, multilane, and two-lane two-way roads.
Driveway density increases the number of conflicts per km and tends to increase expected crash frequency, and this is consistent with previous studies [23,24]. In addition, as the posted speed increases, the likelihood of crashes increases, and this is consistent with previous studies [25]. However, median width provides separation between bi-directional traffic and tends to reduce crash frequency. This is also consistent with previous studies [26,27,28]. With respect to multilane roads, the number of lanes was significant in both total and FI crashes models. An increase in the number of lanes increases the capacity of the road and decreases the traffic density and tends to decrease crashes. Additionally, the presence of lighting reduces the likelihood of FI crashes, likely because most such crashes occur at night. Regarding two-lane two-way roads, it was found that AADT and segment’s operational speed are the only significant variables. As the operation speed of a segment increases, the likelihood of total and FI crashes increases. Lastly, it can be seen that the full SPFs provide a better fit of the data compared to the simple SPFs.
Table 4 shows the modeling results of the SPFs in the Eastern region. With respect to freeways, traffic volume and presence of lighting were significant for total, and FI crashes models in which the presence of lighting is negatively associated with total, and FI crashes. The percentage of cars driving over 140 km/h and driveway density are positively significant only for FI crashes. Regarding multilane roads, traffic volume, posted speed, and outer shoulder width were significant for both models. Curve density and percentage of vehicles driving over 140 km/h were significant for the total crashes model, and number of lanes and median barrier proportion were significant for FI crashes model. Outer shoulder width has a negative coefficient, which means it tends to decrease crash occurrences by providing clearance to signs, embankments, and recovery space for run-off road vehicles. Curve density measures number of curves along a segment length and its positive effect on crash frequency may be due to maneuver errant due to sudden change in concavity of curves or run off along road due to speed or lack of attention. As the proportion of median barrier increases, the number of fatal and injury crashes on multilane roads tend to decrease, and this is consistent with a previous study [29]. With respect to two-lane two-way roads, traffic volume and the percentage of heavy vehicles were statistically significant in both models. Both AADT and percent of heavy vehicles in SPF developed have positive coefficients. Both measure traffic exposure and tend to increase the crash frequency with increase in values of these variables. Lastly, it can be seen that the full SPFs outperforms the simple SPFs in all road classifications for this region.
Table 4.
Eastern-Specific Full SPFs for Total and FI Crashes on Freeway, multilane, and Two-lane Two-way Roads.
Table 5 presents the modeling results of the SPFs in the Makkah region. With respect to freeways, traffic volume, roadside barrier proportion, presence of lighting, and percent of heavy vehicle driving over 100 km/h were significant variables in both models, and driveway density was a significant variable in the total crashes model. In which traffic volume and percent of heavy vehicles with speeds over 100 km/h are positive significant variables. Trucks travelling at high speeds are considered a high risk, particularly for passenger cars willing to exit or enter a freeway because trucks are obliged to stay in the right lane in addition to occasional presence of rutting on that right lane. Regarding multilane roads, traffic volume, percent of heavy vehicles, and U-turn density were significant variables in both models with a positive association. However, posted speed and percentage of vehicles driving over 140 km/h were significant variables for total crashes model, and degree of curvature and segment’s operation speed were significant variables for FI crashes model. U-Turn density increases the number of conflicts per km and tends to increase expected crash frequency. Degree of curvature measures sharpness of horizontal curvature and its positive effect on crash frequency may be due to sight distance obstruction, maneuver risk along curve or run off along road due to speed or lack of attention. Regarding two-lane two-way roads, it was found that traffic volume, presence of lighting, and outer shoulder width were significant variables in both models. However, the segment’s operational speed was significant on the total crashes model, and percent of vehicles driving over 140 km/h was a significant variable in FI crashes model. Lastly, it can be seen that the full SPFs outperform the simple SPFs in all road classifications for the Makkah region.
Table 5.
Makkah-Specific Full SPFs for Total and FI Crashes on Freeway, multilane, and Two-lane Two-way Roads.
Table 6 shows the modeling results of the SPFs in the Aseer region. With respect to multilane roads, it was found that traffic volume, median width, and percent of heavy vehicle driving over 100 km/h were significant variables in both models, and inflection point density was a significant variable in total crashes model. Inflection point density measures number of concavity changes in horizontal curvature, and its positive effect on crash frequency may be due to sight distance obstruction, maneuver risk due to sudden change in concavity of curves or run off along road due to speed or lack of attention. Regarding two-lane two-way roads, traffic volume, inflection point density, median double marking, and tunnel density along curves were significant variables in both models, percent of heavy vehicles driving over 100 km/h was a significant variable in FI crashes model. Median double marking is a dummy variable, and it provides more separation between opposing traffic as compared to single marking. Tunnel Density along curves measure proportion of curve segment length covered by tunnel(s), and its positive effect on crash frequency may be due to sight distance obstruction and environment different than open two-lane two-way road environment. The walls provide additional obstruction along double curves (point of inflections) and it was observed that two-thirds of tunnels along curved segments have double curves. Lastly, it can be seen that the full SPFs outperforms the simple SPFs in all road classifications for the Aseer region.
Table 6.
Aseer-specific full SPFs for total and FI crashes on multilane and two-lane two-way roads.
Lastly, Table 7 shows the modeling results of the SPFs in the Tabuk region. Regarding multilane roads, it was found that degree of curvature and terrain were significant variables in both models. However, traffic volume and gas station density were significant on the total crashes model, and median barrier proportion was only significant on FI crashes model. Gas station entry and exits increase the number of conflict points and thus tend to increase crash frequency. Terrain was a dummy variable where the value of “1” indicates segment on mountainous terrain and a value of “0” indicates segment on level terrain. With respect to two-lane two-way, traffic volume, degree of curvature, and elevated road length were significant variables in both models. Elevated roads pose a driving risk especially at curves and tend to increase crash frequency. Tabuk experienced high crash occurrences along these elevated roads. In all cases, full SPFs outperform the simple SPFs in all road classifications for the Tabuk region.
Table 7.
Tabuk-specific full SPFs for total and FI crashes on multilane and two-lane two-way roads.
Our results indicate substantial heterogeneity in the determinants of crash frequency across the five study regions, which supports the use of region-specific SPFs. Models developed for different regions often retained different sets of statistically significant predictors (e.g., median width on Riyadh freeways, U-turn density in Makkah multilane roads, and tunnel/inflection-point effects in Aseer), and goodness-of-fit comparisons consistently favored locally fitted full SPFs over AADT-only (simple) models. These differences reflect underlying variations in topography, roadway design, traffic composition, and network function across regions (the study regions represent central, western, eastern, southern, and northern parts of the Kingdom), and imply that a single national SPF would risk masking locally important effects and reducing predictive accuracy for local safety management. Consequently, region-specific SPFs offer more accurate crash predictions and better guidance for targeted countermeasures and resource allocation. Lastly, hierarchical (multilevel) modeling represents a promising direction for future research. Such approaches would allow partial pooling of information across regions, thereby improving the stability of parameter estimates in regions with relatively limited data, while explicitly accounting for unobserved regional heterogeneity through region-level random effects.
6. Conclusions
This study represents a significant advancement in traffic safety research by developing 26 comprehensive SPF models tailored for intercity roads in Saudi Arabia. These models, designed for freeways, multilane highways, and two-lane two-way roads across five regions—Riyadh, Makkah, Eastern, Aseer, and Tabuk—utilize Negative Binomial regression to uncover critical factors influencing total and FI crashes. By using data from multiple sources spanning three years (2017–2019), this research provides a robust foundation for understanding region-specific crash predictors. A rigorous comparison between simple and full SPFs highlights the superior predictive power of the latter, reinforcing the importance of incorporating diverse roadway and traffic parameters.
Key findings underscore the profound impact of roadway characteristics on crash occurrences. For example, increased median width on freeway roads in Riyadh and greater outer shoulder width on multilane roads in the Eastern region are associated with reduced crash frequencies. Conversely, higher operational speeds on two-lane roads and increased U-turn density on multilane roads in Makkah exacerbate crash risks. Such region-specific insights into factors like lighting presence, degree of curvature, and tunnel density provide actionable intelligence for targeted interventions.
In conclusion, this study is considered one of the first studies at the kingdom level, which implemented the HSM approach, and it contributes to improving methods for identifying hotspots on intercity roads. It will also help to develop local crash modification factors using more accurate methods, which include SPFs. Beyond its implications for Saudi Arabia, the methodologies and findings serve as a replicable model for other regions worldwide, enabling data-driven strategies for enhancing road safety. This study is limited by the use of the negative binomial model; therefore, future studies may explore more advanced structures (e.g., random effects) to evaluate their suitability and performance. Moreover, since the analysis was conducted using data from only five regions, further research could assess the transferability of these SPFs to the remaining eight regions or develop calibration factors for all intercity roads across the kingdom.
Author Contributions
Conceptualization, S.A. and K.A.; methodology, S.A.; software, K.A.; validation, S.A. and K.A.; formal analysis, K.A.; investigation, S.A.; resources, S.A. and K.A.; data curation, S.A.; writing—original draft preparation, S.A.; writing—review and editing, K.A.; visualization, K.A.; supervision, S.A. and K.A.; project administration, S.A.; funding acquisition, S.A. All authors have read and agreed to the published version of the manuscript.
Funding
The authors would like to thank the National Transport Safety Center for providing financial and other support for this study. Also, we would like to thank the Ministry of Transport and Logistic Services for providing the data for this study. We also would like to thank the ongoing Research Funding program, (ORF-2025-018-2), King Saud University, Riyadh, Saudi Arabia, for funding this research.
Data Availability Statement
Data used in this study are not publicly available due to privacy or ethical restrictions.
Acknowledgments
The authors would like to thank the National Transport Safety Center for providing financial and other support for this study. Also, we would like to thank the Ministry of Transport and Logistic Services for providing the data for this study. We also would like to thank the ongoing Research Funding program, (ORF-2025-018-2), King Saud University, Riyadh, Saudi Arabia, for funding this research.
Conflicts of Interest
The authors declare no conflicts of interest.
Abbreviations
The following abbreviations are used in this manuscript:
| NB | Negative Binomial |
| HSM | Highway Safety Manual |
| FI | Fatal and Injury |
| KSA | Saudi Arabia |
| SPF | Safety Performance Function |
| CMF | Crash Modification Factor |
| AADT | Annual average daily traffic |
| NRSC | National Road Safety Center |
| MoTLS | Ministry of Transport and Logistic Services |
| MENA | the Middle East and North Africa |
| AIC | Akaike information criterion |
| COVID-19 | Corona Virus Disease 2019 |
References
- World Health Organization. Global Status Report on Road Safety 2018; World Health Organization: Geneva, Switzerland, 2019. [Google Scholar]
- Vision 2030 Annual Report. Annual Reports. 2024. Available online: https://www.vision2030.gov.sa/en/annual-reports (accessed on 24 May 2025).
- National Research Council (US); Transportation Research Board. Task Force on Development of the Highway Safety Manual, & Transportation Officials. Joint Task Force on the Highway Safety Manual; Highway Safety Manual (Volume 1); AASHTO: Washington, DC, USA, 2010. [Google Scholar]
- Srinivasan, R.; Bauer, K.M. Safety Performance Function Development Guide: Developing Jurisdiction-Specific SPFs; No. FHWA-SA-14-005; Office of Safety, Federal Highway Administration: Washington, DC, USA, 2013.
- Lu, J.; Haleem, K.; Alluri, P.; Gan, A.; Liu, K. Developing local safety performance functions versus calculating calibration factors for SafetyAnalyst applications: A Florida case study. Saf. Sci. 2014, 65, 93–105. [Google Scholar] [CrossRef]
- La Torre, F.; Domenichini, L.; Branzi, V.; Meocci, M.; Paliotto, A.; Tanzi, N. Transferability of the highway safety manual freeway model to EU countries. Accid. Anal. Prev. 2022, 178, 106852. [Google Scholar] [CrossRef] [PubMed]
- Abdel-Aty, M.A.; Lee, C.; Park, J.; Wang, J.H.; Abuzwidah, M.; Al-Arifi, S. Validation and Application of Highway Safety Manual (Part D) in Florida; No. BDK78-977-14; Florida Department of Transportation: Tallahassee, FL, USA, 2014.
- Abdel-Aty, M.A.; Lee, J.; Eluru, N.; Cai, Q.; Al Amili, S.; Alarifi, S. Enhancing and Generalizing the Two-Level Screening Approach Incorporating the Highway Safety Manual (HSM) Methods, Phase 2; Florida Department of Transportation: Tallahassee, FL, USA, 2016.
- Al-Deek, H.; Sandt, A.; Gamaleldin, G.; McCombs, J.; Blue, P. A Roadway Context Classification Approach for Developing Safety Performance Functions and Determining Traffic Operational Effects for Florida Intersections; Florida Department of Transportation: Tallahassee, FL, USA, 2020.
- Donnell, E.; Gayah, V.; Li, L. Regionalized Safety Performance Functions; No. FHWA-PA-2016-001-PSU WO 017, LTI; Pennsylvania Department of Transportation: Harrisburg, PA, USA, 2016.
- Khattak, A.; Chimba, D.; Richards, S.; Wali, B.; Chacha, W. Two-Lane Two-Way Intersection Calibration Factor; Tennessee Department of Transportation: Jackson, TN, USA, 2017.
- Khattak, A.; Ahmad, N.; Mohammadnazar, A.; Arvin, R. Safety Performance on Rural Multilane Roadways in Tennessee; Tennessee Department of Transportation: Jackson, TN, USA, 2021.
- Khattak, A.; Mohammadnazar, A.; Patwary, A.L.; Ahmad, N.; Haque, A.; Mahdinia, I. A Localized Safety Performance Functions Approach Accounting for “Within” Tennessee Variations on Freeways & Interchanges; No. RES2020-04; Tennessee Department of Transportation: Jackson, TN, USA, 2022.
- Tegge, R.A.; Jo, J.H.; Ouyang, Y. Development and Application of Safety Performance Functions for Illinois; ICT-10-066 UILU-ENG-2010-2006; Illinois Center for Transportation: Rantoul, IL, USA, 2010. [Google Scholar]
- Martz, P. Development of Safety Performance Functions for Undivided Rural Two-Lane Roadways. Master’s Thesis, University of Wisconsin, Madison, WI, USA, January 2018. [Google Scholar]
- La Torre, F.; Meocci, M.; Domenichini, L.; Branzi, V.; Tanzi, N.; Paliotto, A. Development of an accident prediction model for Italian freeways. Accid. Anal. Prev. 2019, 124, 1–11. [Google Scholar] [CrossRef] [PubMed]
- Garach, L.; Oña, J.D.; López, G.; Baena-Ruiz, L. Development of Safety Performance Functions for Spanish two-lane rural highways on flat terrain. Accid. Anal. Prev. 2016, 95, 250–265. [Google Scholar] [CrossRef] [PubMed]
- Jurewicz, C.; Steinmetz, L.; Turner, B. Australian National Risk Assessment Model. Austroads Research Report; AP-R451-14; ARRB Group: Sydney, Australia, 2014. [Google Scholar]
- Elagamy, S.R.; El-Badawy, S.M.; Shwaly, S.A.; Zidan, Z.M.; Shahdah, U.E. Segmentation effect on developing safety performance functions for rural arterial roads in Egypt. Innov. Infrastruct. Solut. 2020, 5, 64. [Google Scholar] [CrossRef]
- Asal, H.I.; Said, D.G. An approach for development of local safety performance functions for multi-lane rural divided highways in Egypt. Transp. Res. Rec. 2019, 2673, 510–521. [Google Scholar] [CrossRef]
- Kaaf, K.A.; Abdel-Aty, M. Transferability and calibration of Highway Safety Manual performance functions and development of new models for urban four-lane divided roads in Riyadh, Saudi Arabia. Transp. Res. Rec. 2015, 2515, 70–77. [Google Scholar] [CrossRef]
- Evans, J.D. Straightforward Statistics for the Behavioral Sciences; Brooks/Cole: Pacific Grove, CA, USA, 1996. [Google Scholar]
- Ivan, J.N.; Garder, P.E.; Deng, Z.; Zhang, C. The Effect of Segment Characteristics on the Severity of Head-On Crashes on Two-Lane Rural Highways; Connecticut Transportation Institute, University of Maine Department of Civil Engineering: Storrs, CT, USA, 2006. [Google Scholar]
- Alarifi, S.A.; Abdel-Aty, M.; Lee, J. A Bayesian multivariate hierarchical spatial joint model for predicting crash counts by crash type at intersections and segments along corridors. Accid. Anal. Prev. 2018, 119, 263–273. [Google Scholar] [CrossRef] [PubMed]
- Kockelman, K.; Bottom, J. Safety Impacts and Other Implications of Raised Speed Limits on High-Speed Roads; National Cooperative Research Program, Project 17-23; The National Academies Press: Washington, DC, USA, 2006. [Google Scholar]
- Abdel-Aty, M.A.; Radwan, A.E. Modeling traffic accident occurrence and involvement. Accid. Anal. Prev. 2000, 32, 633–642. [Google Scholar] [CrossRef] [PubMed]
- Miaou, S.P.; Bligh, R.; Lord, D. Developing median barrier installation guidelines: Abenefit/cost analysis using texas data. Presented at the 84th Transportation Research Board’s Annual Meeting, Washington, DC, USA, 9–13 January 2005. [Google Scholar]
- Das, D.K. Exploring the significance of road and traffic factors on traffic crashes in a South African city. Int. J. Transp. Sci. Technol. 2022, 12, 414–427. [Google Scholar] [CrossRef]
- Elvik, R. The safety value of guardrails and crash cushions: A meta-analysis of evidence from evaluation studies. Accid. Anal. Prev. 1995, 27, 523–549. [Google Scholar] [CrossRef]
Disclaimer/Publisher’s Note: The statements, opinions and data contained in all publications are solely those of the individual author(s) and contributor(s) and not of MDPI and/or the editor(s). MDPI and/or the editor(s) disclaim responsibility for any injury to people or property resulting from any ideas, methods, instructions or products referred to in the content. |
© 2025 by the authors. Licensee MDPI, Basel, Switzerland. This article is an open access article distributed under the terms and conditions of the Creative Commons Attribution (CC BY) license.