Abstract
This review examines data-driven road traffic safety modeling, aiming to provide a comprehensive overview of the state-of-the-art and persistent research gaps. The study is structured around data sources, influencing factors, reactive and proactive modeling approaches, and key challenges. Data sources, including crashes, trajectories, traffic, roadway geometry, and environmental data, are first reviewed in the context of reactive and proactive safety analysis. To address the substantial heterogeneity across studies, a vote-counting strategy is adopted to aggregate directional evidence reported in the literature. The synthesis indicates that traffic demand variables exhibit consistently positive associations with crash occurrence, while speed-related effects are strongly context-dependent. Road geometry and surface conditions have largely consistent directional impacts on safety outcomes. From a methodological perspective, reactive approaches remain dominant, while proactive approaches exhibit potential for early risk identification but remain insufficiently validated due to data quality constraints. In addition, empirical evidence on conflict–crash relationships is still limited. Notably, model performance varies substantially across safety tasks, with algorithm effectiveness primarily driven by data structure, outcome definition, and aggregation level, rather than by the intrinsic superiority of any single approach. Overall, this review highlights challenges related to data integration, spatio-temporal modeling, interpretability, and transferability, and provides practical guidance for model selection in operational road safety analysis.
1. Introduction
A global status report on road safety published by the World Health Organization (WHO) highlights a critical global challenge: approximately 1.3 million people die in road traffic crashes each year. Road crashes are the leading cause of death among children and young adults aged 5 to 29 years [1]. Without effective interventions, the WHO predicts that road traffic injuries will become the fifth leading cause of death worldwide by 2030. In the European Union (EU), road fatalities increased by 4% in 2022 compared to 2021, resulting in 20,678 deaths [2]. To address this challenge, the EU has implemented a Road Traffic Safety Action Plan aiming to reduce road fatalities by 50% by 2030, compared to 2019 [3].
The importance of road traffic safety has led to an increase in related research. The analysis in Figure 1 and Figure 2, which present data retrieved from the Scopus database, indicate this trend. The analysis was conducted by searching for the keyword “road safety” and “traffic safety” within the article titles, abstracts, and keywords, including publications from 1920 to the present. Figure 1 highlights the growing academic attention, particularly after 2015, driven by advancements in autonomous driving technologies and data-driven analytical methods. Figure 2 illustrates the geographical distribution of publications, highlighting the EU, China, and the United States as the most active regions in this research field.
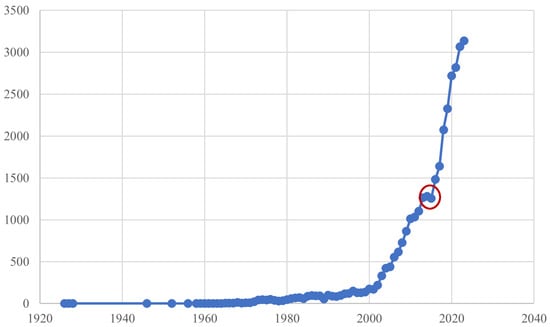
Figure 1.
The annual publications of traffic safety analysis.
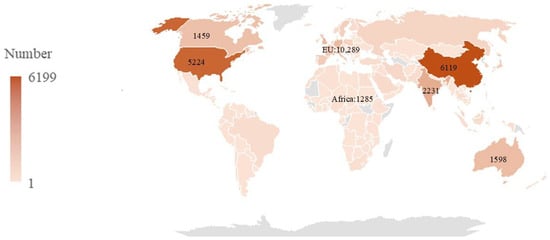
Figure 2.
Global distribution of road safety publications.
Road traffic safety research aims to reduce crash risks and their impacts through data-driven methodologies. These methodologies can be classified into reactive and proactive approaches. Reactive methods rely on historical crash data to identify influencing factors and to assess the effectiveness of implemented safety measures [4,5]. In contrast, proactive approaches employ real-time data, such as vehicle trajectories, to quantify interaction risks and predict potential conflicts before crashes occur [6,7]. Numerous literature reviews have emerged in recent years, focusing on primarily either reactive approaches [8,9,10,11,12] or proactive approaches [10,13,14,15]. Many of these studies also examine key influencing factors [8,16], providing valuable insights into specific aspects of road safety.
However, a major limitation of the existing literature is that reactive and proactive approaches are often reviewed separately, with emphasis placed on crash-based modeling, conflict-based analysis, or individual methodological paradigms in isolation [8,10,13,14,17]. As a result, the end-to-end research logic linking data acquisition, influencing factor identification, and safety modeling remain fragmented. Moreover, existing reviews tend to emphasize methodological comparisons while paying limited attention to how data characteristics, modeling objectives, and safety indicators jointly shape model performance and practical applicability. To address these gaps, this review aims to identify key challenges and to propose a unified analytical framework. The main contributions of this paper are as follows:
- A structured and comprehensive synthesis of road traffic safety modeling, including data acquisition, analysis of influencing factors, and both reactive and proactive modeling approaches.
- A classification and vote-counting strategy to evaluate key research topics and methodological trends in road traffic safety.
- A critical analysis of recent studies to identify methodological limitations and research gaps, along with potential directions for future research.
In contrast to prior narrative reviews, this study emphasizes consistency and divergence across studies by comparing data characteristics, modeling assumptions, and application contexts. The review is organized as follows. Section 2 provides an overview of the paper, with a focus on the scope and structure. Section 3 delves into diverse data sources and influencing factors. Section 4 examines reactive and proactive road safety analysis methods. The relationship between these two methods is also discussed. Section 5 identifies current research gaps and proposes potential solutions. Finally, Section 6 summarizes the key findings and contributions of this work.
2. Methodology
This study presents a comprehensive synthesis of representative publications on data-driven road traffic safety modeling, organized around a conceptual framework linking data sources, influencing factors, and safety modeling approaches. Figure 3 illustrates the literature identification and screening process adopted in this study, including retrieval, deduplication, and relevance-based screening. This process was designed to support the synthesis of influencing factors and safety modeling approaches.
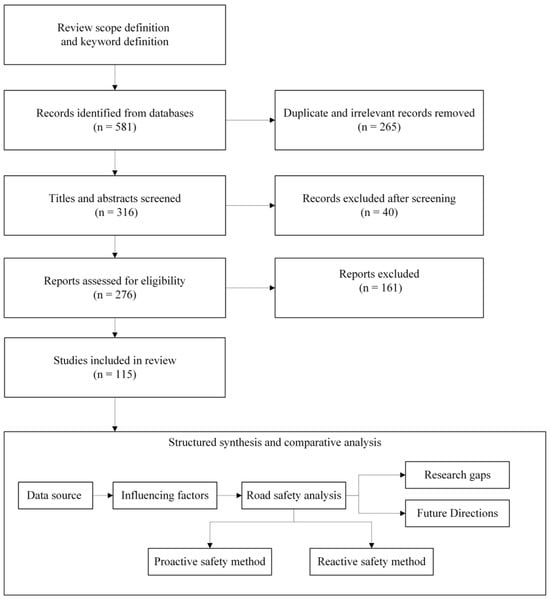
Figure 3.
Flow chart of literature review.
The review scope was defined around the topics of “road safety” and “traffic safety”. To ensure broad coverage of data-driven safety modeling research, search strings were constructed using combinations of keywords across multiple categories. Specifically, publications were retrieved using the following Boolean search query: (“road safety” OR “traffic safety”) AND (“crash” OR “conflict” OR “accident” OR “surrogate safety” OR “proactive” OR “reactive” OR “trajectory*”) AND (“machine learning” OR “deep learning” OR “data-driven”).
Relevant publications were retrieved from academic databases, including Web of Science (WoS), Scopus, IEEE Xplore, and Google Scholar, which was used as a supplementary search engine to enhance coverage. After retrieval, duplicate and obviously irrelevant records were identified and removed, resulting in 316 articles. The titles and abstracts were then screened to exclude studies not related to road traffic safety, leading to the removal of 40 records. The remaining articles were further assessed for eligibility based on predefined inclusion criteria. The inclusion criteria required for those studies:
- Journal impact factors exceeding 2.0.
- Journals ranked in Q1 or Q2 according to Scimago Journal & Country Rank.
- Studies were published after 2015.
Following the procedure shown in Figure 3, 115 papers were selected for an in-depth analysis.
3. Data Source
Road traffic safety modeling depends on the availability, quality, and characteristics of data sources. This section first examines data acquisition processes and data quality challenges in road traffic safety research, including trajectory-based and crash-based data. It then evaluates the key influencing factors that affect road traffic safety, which serve as the fundamental inputs for both modeling frameworks.
3.1. Data Acquisition Technologies
In road traffic safety research, reactive safety modeling primarily relies on crash data, which are typically obtained from police reports [18]. Although such data provide structured and standardized information, they are often affected by reporting delays and limited spatial or temporal coverage. By contrast, vehicle trajectory data capture the real-time behavior of road users and therefore play a central role in proactive safety modeling.
Traditional devices, such as loop detectors and GPS units, can capture macroscopic traffic information rather than detailed vehicle trajectories. Recently, researchers employed advanced sensing and data-processing technologies such as Closed-Circuit Television (CCTV), Unmanned Aerial Vehicles (UAVs), and computer vision (CV) algorithms. Object detection and tracking frameworks, such as YOLO (You Only Look Once) and SORT (Simple Online and Realtime Tracking), are widely adopted for extracting trajectories from video recordings. For instance, Liu et al. [19] proposed a composite framework integrating YOLOv4 with SORT for vehicle trajectory extraction, incorporating Kalman filters and Hungarian algorithms for object tracking, and K-Dimensional-Tree for trajectory reconstruction. Similarly, researchers from Queensland University of Technology [20] employed YOLOv3 and Deep SORT to achieve robust detection and tracking of road users. In addition, Abdel-Aty et al. [21] systematically reviewed the application of CV in traffic safety modeling, particularly in generating vehicle trajectories and evaluating Safety Surrogate Measures (SSMs). The study detailed advancements in object detection and tracking technologies, the use of temporal and spatial SSMs, and the potential of CV in real-time traffic safety analysis. Furthermore, researchers from RWTH Aachen University utilized UAVs to capture traffic videos across various traffic scenarios in Germany. By employing YOLO algorithms for vehicle detection and tracking, combined with trajectory smoothing techniques, they extracted accurate vehicle trajectories. This effort has created large-scale datasets, including scenarios such as highways [22], roundabouts [23] and highway entrances and exits [24]. These datasets enable detailed analysis of road user behavior and improve proactive risk prediction in traffic safety research.
3.2. Data Quality Challenges and Preprocessing Techniques
Despite significant advances in trajectory acquisition technologies, vehicle trajectory data often suffers from quality issues, particularly missing or incomplete observations caused by hardware limitations and sensing constraints. To address these gaps, Li et al. [25] proposed a multi-view learning method to impute missing values in traffic-related time series dat. They combined Long Short-Term Memory (LSTM), Support Vector Regression (SVR), and collaborative filtering to capture both local and global temporal-spatial variations. The final imputation values were aggregated using a kernel function. With the strong application of Generative Adversarial Networks (GANs) in data generation, Zhao et al. [26] addressed vehicle trajectory data imputation by proposing an imputation GANs. It integrates external data with latent information and employs a multi-objective loss function and adversarial learning framework. The model effectively handles consecutive missing data in trajectory datasets and demonstrates superior performance compared to baseline models. However, challenges remain, including privacy concerns and the operational stability of advanced algorithms such as GANs.
Beyond trajectory data, data quality challenges also affect crash-based safety modeling, where underreporting, reporting delays, and limited spatial or temporal coverage constrain the effectiveness of traditional crash databases. To address these limitations, researchers have explored supplementary data sources. In particular, user-generated content on social media has emerged as a promising alternative [27]. Social media platforms such as Twitter, Facebook and Sina Weibo (Chinese social media), generate large volumes of real-time, location-specific data that can be mined for crash-related information. For instance, Chen et al. [28] proposed a framework to detect and analyze traffic-related information from social media texts, focusing on microblogs from Sina Weibo. By transforming the task into a short text classification problem, they employed word embedding techniques and deep learning models, including Convolutional Neural Network (CNN), LSTM, and their combination (LSTM-CNN), to identify traffic incidents. Similarly, Ali et al. [29] proposed a framework that employ social media data for traffic crash detection and analysis. They combined Ontology and Latent Dirichlet Allocation (OLDA) for topic modeling and Bidirectional Long Short-Term Memory (Bi-LSTM) for classification. The proposed approach achieves high accuracy in identifying traffic-related events. This also demonstrates the potential of social media as a supplementary data source for traffic safety research. However, integrating social media data with structured crash reports presents several challenges. In particular, user-generated content often lacks reliability due to incomplete or inconsistent information.
3.3. Influencing Factors
This section examines the key influencing factors in road traffic safety, with particular focus on their interrelationships and underlying mechanisms. Figure 4 illustrates the distribution of factors commonly considered in road traffic safety studies. Traffic-related variables are the most frequently utilized, accounting for 46.7% of the cases, followed by road geometry factors (26.1%). Together, these two categories play a dominant role in shaping road safety outcomes. Other influencing factors include road user behavior (11.7%), weather conditions (7.2%), socio-economic and demographic characteristics (4.4%), and land-use attributes (3.9%).
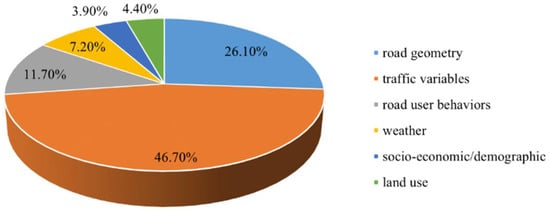
Figure 4.
The proportion of the influencing factors were used in the studies.
3.3.1. Traffic-Related and Functional Features
Given the substantial heterogeneity across studies, including differences in sample size, safety indicators, methodological design, and scenario settings, this review employs a vote-counting approach to capture overall directional tendencies rather than to estimate quantitative effect.
In this context, “articles” denote the number of studies included in the review, whereas “tests” refer to independent statistical analyses conducted under different traffic scenarios within individual studies. For instance, Zhang et al. [30] examined both day and night scenarios, and Katrakazas et al. [31] analyzed collision risks across two traffic environments: highways and intersections. Based on this framework, this section summarizes the effects of commonly examined traffic-related variables, such as traffic demand and operational characteristics, on road traffic safety outcomes.
As shown in Table 1, traffic volume emerges as the most frequently studied variable, with 68 articles and 75 independent tests examining its influence. All tests (100% support) indicate a positive correlation between traffic volume and traffic crashes. This finding aligns with the established understanding that Annual Average Daily Traffic (AADT) [32,33,34] and Average Daily Traffic (ADT) [35] are significant predictors of crash frequency and severity. Other related variables, such as the average hourly traffic for specific road segments [36], and varying time-based traffic volumes (weekly, daily, hourly) [37] are also found to be positively associated with crash occurrence. However, most of these studies are based on annual or daily average data, which may ignore the impact of short-term traffic fluctuations.

Table 1.
Vote-counting summary of traffic variables and safety impact.
Speed-related variables are the second most frequently studied variable, with 43 articles and 55 tests. Of these, 60% support a positive correlation between speed and traffic crashes, while 40% of the tests show a negative correlation, highlighting that the impact of speed on traffic safety is context dependent. While higher speeds on highways are generally associated with increased risks [38], lower speeds on rural roads can indicate poorly designed infrastructure, increasing the likelihood of crashes [39]. This highlights the need to analyze speed in conjunction with road types and geometric features to better understand its role in road safety.
The third most prevalent characteristic is traffic composition, especially the proportion of trucks. For example, Li et al. and Saha et al. [38,40] found that the proportion of trucks is negatively correlated with crashes, which may be due to the fact that truck drivers are more cautious or trucks play a stabilizing role in traffic flow. Acceleration and deceleration are also important variables, with lateral acceleration considered a key cause of crashes. 93% of the tests support a positive correlation between lateral acceleration and crash frequency [41,42] and conflicts [43]. In addition, temporal factors such as rush hour or weekends are generally positively correlated with crash risk, but 29% of the studies did not find a significant correlation. This indicates that the effect of temporal variables can differ across traffic environments and regions. Other factors like occupancy, headway, and traffic conditions [44,45] have also been shown to be related to road traffic risk.
3.3.2. Road Geometry
Table 2 summarizes the vote-counting results used in this section to examine key geometric factors and their relationships with road traffic safety. Firstly, lane length is the most frequently examined factor. According to the vote-counting results, 78% of studies show that shorter lane lengths are associated with reduced traffic risks. This may be because shorter lanes enhance the ability of drivers to anticipate road conditions, reducing risky behavior. Speed limits also play a significant role in traffic safety, with 76% of studies supporting their effectiveness in reducing collision rates. For example, Hosseinpour et al. [46] found that higher speed limits correlate with lower crash risks due to smoother traffic flow. However, in urban environments such as school zones and residential areas, lowering speed limits reduces crash risk [47]. These findings highlight the need to adapt speed limits to specific road environments and traffic conditions.
Table 2.
Vote-counting summary of road geometry and safety impact.
Regarding road facilities, studies have highlighted their significant influence on traffic safety. For instance, Islam et al. [42] found that signalized intersections are more likely to have conflicts than unsignalized intersections due to stop-and-go dynamics. Loo et al. [48] demonstrated that on roads with high pedestrian traffic, the installation of railings can reduce the occurrence of serious bus crashes. These findings highlight the need to design road facilities that align with specific traffic and environmental conditions, such as improved lighting and pedestrian protection.
The number of lanes is another critical factor, with 87.5% of studies reporting a negative correlation between increasing lanes and crash rates. This suggests that increased road capacity may improve traffic flow and reduce conflicts [42]. Similarly, lane width also shows a negative relationship (82%) with crash risks. However, Wang et al. [49] argued that the number and width of lanes do not have a significant impact on crash frequency. This difference may be related to differences in road type and traffic environment.
Roadway curvature has a positive correlation with crash risks. Gooch et al. [50] demonstrated that both horizontal and vertical curves increase the likelihood of crashes. This is because drivers find it harder to keep their vehicles stable on large-radius curves at high speeds. Similarly, on steep vertical curves (such as uphill and downhill sections), vehicles easily lose control or deviate from the lane. Additionally, gradients are explored in various studies. For example, Hou et al. [51] found that downhill gradients exhibit a significant positive correlation with crash rates, especially on long downhill sections. Conversely, uphill gradients show a negative correlation with crash rates, as vehicles tend to slow down on uphill slopes, reducing the likelihood of crashes.
Lastly, surface friction and surface conditions demonstrate a clear relationship with crash frequency. Specifically, all the reviewed studies show that lower surface friction [52] and poor road conditions [53] significantly increase risks. Improving road surface materials and regular maintenance are considered important strategies for reducing safety risk.
4. Road Safety Analysis
The choice of road safety modeling approaches is largely constrained by data characteristics, particularly their temporal resolution, spatial coverage, and level of aggregation. As discussed in Section 3, road traffic safety studies rely on datasets with different temporal and spatial resolutions, which influence the types of safety problems that can be analyzed. Aggregated crash data mainly support reactive safety analysis, where statistical or MLAs are applied to explain or predict crash frequency or severity based on historical observations and influencing factors. By contrast, high-resolution trajectory data enables proactive safety analysis by capturing detailed interactions among road users prior to crash occurrence. These data allow traffic conflicts and surrogate safety measures, such as time-to-collision (TTC) and post-encroachment time (PET), to be modeled.
Accordingly, Section 4 categorizes road traffic safety modeling approaches into reactive and proactive approaches. Reactive approaches address crash severity prediction (CSP), crash frequency prediction (CFP), and real-time crash prediction (RTCP), whereas proactive approaches focus on conflict prediction and risk assessment to identify potential safety issues before crashes occur. In addition, clarifying the relationship between traffic conflicts and crashes remains a key methodological challenge in road safety research.
As shown in Figure 5, a review of the existing literature indicates that most current road safety modeling studies still rely largely on reactive methods. Section 4 therefore provides an in-depth examination of representative analytical techniques used in both reactive and proactive approaches, highlighting their methodologies, practical applications, and key limitations.
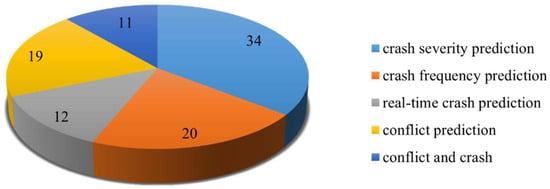
Figure 5.
The number of studies per safety modeling topic.
4.1. Reactive Road Traffic Safety Analysis
4.1.1. Traffic Crash Severity Prediction
CSP is a classification task, in which crashes are categorized into different severity levels. This section presents a vote-counting analysis of the methodologies employed in CSP studies, indicating the number of studies that support or oppose each algorithm. The results in Table 3 reveal that logit models are less frequently applied in CSP, due to their limitations in capturing nonlinear relationships and handling high-dimensional data. Therefore, researchers tend to use MLAs or hybrid approaches that combine traditional statistical models with MLAs. For instance, Bayesian models, which are known for their ability to address uncertainty and incorporate probabilistic reasoning, are being adopted under varying environmental conditions [54,55,56]. It is worth noting that all studies employing Bayesian methods reported positive results, resulting in a 100% support rate in the vote-counting analysis. However, the scalability of Bayesian models is limited by their reliance on prior assumptions and by the computational intensity required when processing large-scale datasets.
Table 3.
Vote-counting analysis of algorithms for CSP.
Tree-based MLAs, such as Classification and Regression Tree (CART) [63] and RF [58,62], are widely used for their ability to capture nonlinear relationships in complex features. While these models perform well in identifying variable importance, their performance in CSP is mixed. Vote-counting results in Table 3 indicate that 43% of studies support their use, while 57% of the studies found it to be ineffective, due to challenges in predicting rare crash events and sensitivity to imbalanced datasets. Additionally, tree-based methods can suffer from overfitting.
Boosting algorithms, such as Extreme Gradient Boosting (XGBoost), are effective in handling complex interactions between variables. For instance, Yang et al. [55] employed XGBoost for feature importance quantification and Bayesian analysis for CSP. Other boosting methods, like Gradient Boost Trees (GBT) [61], XGBoost [66], demonstrated superior performance in CSP. The vote-counting results indicate an 83% support rate for boosting methods, with a 17% opposing rate.
Deep learning algorithms (DLAs) outperformed most statistical methods and MLAs by effectively capturing heterogeneity in complex datasets. Some studies [55,62,67,68,69,70] employed different DLAs frameworks for CSP with enhanced accuracy. The vote-counting results suggest a consistent preference for DLAs within the reviewed studies, although these findings should be interpreted cautiously given differences in data scale, model validation strategies, and publication bias. Moreover, DLAs require large datasets for training, and their “black box” nature poses challenges in interpretability.
Despite improvements in predictive accuracy, data imbalance is a significant challenge, particularly in predicting rare crash events [5]. Researchers employ over-sampling techniques such as Synthetic Minority Oversampling Technique (SMOTE) and more advanced methods like GAN. For instance, Basso et al. [71] found that GANs are more effective than SMOTE in generating synthetic instances. Similarly, Li et al. [66] proposed a GAN framework integrated with XGBoost to balance data. While advancements in CSP modeling improved prediction accuracy and reliability, several challenges remain. Issues such as unobserved heterogeneity, model interpretability, transferability across regions, and data imbalance require further exploration.
The observed differences in algorithm performance for CSP can be largely attributed to the intrinsic characteristics of the CSP task. As a multi-class classification problem with highly imbalanced outcomes, CSP is particularly sensitive to data distribution, feature interactions, and model capacity which refers to a model’s ability to represent complex and nonlinear relationships among variables. Traditional logit models often struggle to capture complex nonlinear relationships and heterogeneity in crash mechanisms, which partly explains their lower support rates. In contrast, Bayesian and deep learning models are better suited to handling uncertainty and high-dimensional feature spaces, especially when sufficient data are available. However, the consistently positive results reported for these models should be interpreted with caution, as they are often evaluated on limited datasets or within specific contexts. In contrast, tree-based and boosting methods tend to exhibit more mixed performance, highlighting the trade-offs between model flexibility, robustness to data imbalance, and overfitting risk. Overall, model effectiveness is highly dependent on data characteristics and imbalance severity.
4.1.2. Traffic Crash Frequency Prediction
CFP can be regarded as a regression equation, which involves predicting the number of crashes over an extended period. Table 4 summarizes the vote-counting analysis of methodologies employed in CFP.
Table 4.
Vote-counting analysis of algorithms for CFP.
Crash data is over-dispersed, with variance exceeding the mean. Poisson models typically assume equal mean and variance. Therefore, their performance is limited when handling such data. In contrast, Negative Binomial (NB) models overcome this limitation by introducing an additional parameter to account for variance heterogeneity. Consequently, NB models have been frequently applied to examine relationships between road geometry, traffic variables, and environmental factors in CFP. The vote-counting results also indicate that 80% of studies support the use of NB models.
The second most commonly used class of methods consists of boosting algorithms, mainly because of their ability to capture non-linearity and spatio-temporal dynamics. To address the limitations in generalizability inherent in single MLAs, Zhang et al. [87] implemented ensemble machine learning algorithms (EMLs) to study three explanatory variables, including road geometry, traffic conditions, and management policies. Their findings revealed that averaging ensemble models outperformed two boosting EMLs in terms of predictive accuracy, generalization, and stability. Additionally, Yehia et al. [86] confirmed that boosting algorithms surpassed NB models in predicting urban crash frequency across different countries. Despite these advantages, vote-counting results highlight mixed performance, with 50% of studies supporting and 50% opposing their use. Limitations include higher computational costs and reduced interpretability compared to traditional statistical models.
The third most frequently used methods include Bayesian [40,83,91], SVM [4,34,90] and tree-based methods [41,88,89]. Fiorentini et al. [34] developed CFP models for two-lane rural, suburban, and urban roads in Italy using four MLAs: CART, Boosted Regression Tree, RF, and SVM. SVM was identified as the most promising for predicting fatal and injury crashes, highlighting the influence of traffic flow and intersection density on crash occurrence. Additionally, the deployment of DLAs in CFP is gaining more attention due to their high accuracy. Ren et al. [93] utilized LSTM to investigate the periodicity and regional correlation in crashes, while Ding et al. [92] introduced an augmented variational autoencoder method, achieving notable success in both prediction accuracy and interpretability. Vote-counting results show that tree-based models have a 50% support rate (3 supporting, 3 opposing), while both SVM and DLAs received 100% support. Although MLAs and DLAs demonstrate strong predictive capability by capturing nonlinear relationships, their limited explainability and context dependence often constrain their transferability across regions and road types.
The dominance of Negative Binomial models in crash frequency prediction reflects the fundamental characteristics of the CFP task. As CFP focuses on modeling aggregated crash counts over extended temporal and spatial units, the resulting data are typically over-dispersed and relatively low-dimensional, conditions under which NB models provide a statistically robust solution. In contrast, while MLAs and DLAs demonstrate strong predictive capability, their performance in CFP is more sensitive to data aggregation levels, sample size, and feature representation. This sensitivity partly explains the mixed vote-counting results observed for boosting and tree-based methods. Models such as SVM and DLAs tend to perform well when sufficient data and temporal structure are available, but their limited interpretability and higher computational demands constrain their widespread adoption in CFP studies. Overall, these findings suggest that CFP favors models that balance statistical adequacy, interpretability, and robustness to aggregation, rather than those optimized mainly for predictive accuracy.
4.1.3. Real-Time Traffic Crash Prediction
With the evolution of ITS and the rise of autonomous driving, there is a growing need for more detailed and fine-grained crash prediction in practical scenarios. RTCP meets this need by providing real-time insights into potential crash scenarios. The primary objective of RTCP is to quantify the likelihood of a crash within a specific timeframe on a given road segment [54]. Unlike CFP and CSP, RTCP requires high-granularity and real-time data, such as real-time traffic speed, conditions, and flow composition. Basso et al. [71] particularly emphasized the key role of traffic composition in RTCP. To address the time-series characteristics inherent in RTCP, computer scientists have proposed a specialized subset of traffic variables. For example, Zhou et al. [37] proposed a specialized subset of traffic variables, which includes distant trends, daily periods, and hourly closeness. This approach is inspired by real-time traffic flow prediction studies. For instance, Guo et al. [94] explored proximity, tendency, and periodicity using a spatial-temporal attention mechanism and GCN.
In terms of algorithm selection, MLAs have been widely used in RTCP, including Bayesian models, SVM, RF, and XGBoost. However, Theofilatos [89] compared the performance of various MLAs and DLAs and found that DLAs perform better when dealing with complex data patterns. In addition, RTCP places higher requirements on algorithms, especially in accurately capturing spatio-temporal dynamic correlations. Accordingly, Zhou et al. [37] proposed a multi-task time-varying graph convolutional network for minute-level collision risk prediction. This model can effectively capture instantaneous changes in traffic conditions and the dynamic correlations between regions, significantly improving the accuracy and real-time nature of the prediction. Building on this progress, subsequent models have integrated additional dimensions of spatio-temporal features to further enhance prediction performance. For instance, Wang et al. [95] proposed the Geographical and Semantic Temporal Network (GSNet), which captures the spatio-temporal correlations between regions by integrating geospatial and semantic spatio-temporal features. Extensive experiments on the New York and Chicago datasets demonstrated that GSNet has a significant advantage in prediction performance compared with other state-of-the-art methods.
In practical applications, RTCP faces significant data challenges, primarily due to the rarity of crash events, leading to class imbalance, data sparsity, and zero-inflated observations. These issues substantially affect model performance. To address this problem, the following main strategies have been proposed:
- Imbalanced classification algorithms: some studies [71,96,97,98] proposed to balance data through imbalanced classification algorithms. These methods effectively improve the prediction ability of model for minority events by increasing the weight of minority class samples or oversampling majority class samples.
- Weighted loss function: Wang et al. [95] proposed a weighted loss function for crash data, which aims to solve the zero-inflation problem within the data. This method significantly improves the prediction accuracy of the model by adjusting the weight of the loss function to pay more attention to crash events.
- Prior Knowledge-based Data Augmentation (PKDE): Zhou et al. [37] proposed an innovative strategy for training DLAs by transforming zeros to discriminative negative values. This method enhances the expressiveness of minority samples while preserving the authenticity of the data.
However, the effectiveness of these methods still depends on the specific application scenario and data characteristics, so further experimental and comparative studies are needed.
Unlike CFP and CSP, RTCP relies on high-frequency, fine-grained, and continuously evolving traffic data, which necessitates models capable of capturing complex temporal dependencies and dynamic spatial interactions. Traditional statistical models and MLAs often struggle to represent such rapidly changing patterns, whereas DLAs are better suited to this setting. Moreover, the real-time nature of RTCP amplifies these challenges, further motivating the use of specialized loss functions and data augmentation strategies. These characteristics help explain the superior performance of DLAs in RTCP. Importantly, effectiveness in this task depends more on the ability to model complex spatio-temporal data structures than on the inherent complexity of the algorithm itself.
4.2. Proactive Road Traffic Safety Analysis
4.2.1. Traffic Conflict Prediction
Traffic conflict prediction can traditionally be categorized into three types: statistical methods, MLAs and DLAs. A comparison of these three methods can be seen in Table 5. Traditional statistical methods, such as Linear Regression (LR) [99], typically treat conflict indicators as dependent variables and external factors as independent variables, particularly when the data are non-negative and discrete. However, these methods show clear limitations when dealing with large-scale, multi-dimensional datasets, such as limited flexibility and difficulty in capturing nonlinear relationships and complex interactions among variables.
Table 5.
Comparison of advantages and limitations of different approaches for traffic conflict prediction.
MLAs have become the mainstream choice for conflict prediction due to their ability to handle non-linear relationships and high-dimensional data. For example, Xie et al. [100] employed a Hidden Markov Model (HMM) for predicting traffic conflict at five-minute intervals, while considering the unobserved heterogeneity in traffic conditions. Stylianou and Dimitriou [101] developed a Bayesian model to explore the correlations between various factors and conflict likelihood. Orsini et al. [102] proposed a real-time safety assessment framework, using RF for variable quantification, SVM for classification, and Monte Carlo cross-validation for robustness. In addition, a comparative study [103] showed that RF outperforms other MLAs. Hu et al. [104] further validated the effectiveness of RF in short-term traffic state quantification and real-time safety assessment. However, the advantages and disadvantages of MLAs vary depending on the specific scenario. For example, although RF excel at handling nonlinear and high-dimensional data, they have limited ability to capture the dynamic correlations between variables.
DLAs have gained increasing application in conflict prediction in recent years because they can capture comprehensive features and achieve higher prediction accuracy. For example, Islam and Abdel-Aty [105] used a LSTM to perform secondary conflict prediction, considering the time-evolutionary characteristics of dynamic factors such as traffic density and speed changes. Formosa et al. [106] combined a Deep Neural Network (DNN) and a region-based convolutional network (R-CNN) for real-time traffic conflict prediction, demonstrating its adaptability in highly dynamic environments. However, DLAs also have certain limitations, including high computational costs and limited interpretability. To address these issues, attention mechanisms and explainable AI techniques, such as SHAP values and locally interpretable models, have been increasingly incorporated into DLAs to enhance model transparency.
4.2.2. Traffic Conflict Prediction Based on Trajectory
Trajectory data are fundamental to traffic conflict analysis, and vehicle trajectory prediction plays a crucial role in reducing collision probabilities [13,107]. Trajectory-based conflict detection typically involves two main steps. First, future trajectories are predicted by learning patterns from historical trajectory data. Subsequently, conflict indicators are computed based on the predicted trajectories to assess potential conflict risks. For instance, Cao et al. [108] developed a YOLOv5–DeepSORT-based vehicle trajectory extraction system that categorizes trajectories into left-turn, straight, and right-turn movements. They further proposed a multi-layer LSTM model tailored to each movement type to predict vehicle trajectories. Similarly, Sun et al. [109] introduced a vision-based traffic conflict detection framework based on trajectory prediction. Their approach applies hierarchical clustering using an improved fuzzy K-means algorithm with a modified Hausdorff distance, followed by encoding spatio-temporal characteristics through an HMM and a probabilistic model to estimate conflict likelihood.
The critical distinction between these approaches lies in their analytical scope. Specifically, direct conflict prediction focuses on estimating the frequency or severity of conflicts over future time horizons, often without explicitly examining the underlying behavioral mechanisms. In contrast, trajectory-based approaches integrate detailed motion information with lane geometry or other traffic parameters, enabling a more fine-grained analysis of conflict formation processes. For example, by examining changes in vehicle heading angles across different time intervals, trajectory-based methods can explicitly capture conflicts induced by lane-changing behaviors.
The methodological evolution observed in proactive road traffic safety analysis reflects an increasing emphasis on anticipating unsafe interactions before crashes occur. Traditional statistical methods provide interpretability when conflicts are modeled using aggregated indicators. However, their applicability becomes limited as data dimensionality and temporal resolution increase. Consequently, MLAs have gained prominence due to their ability to capture nonlinear relationships and heterogeneous influencing factors. More recently, deep learning and trajectory-based methods have emerged as dominant tools, as they enable fine-grained modeling of road user interactions and dynamic behavioral patterns. The growing reliance on trajectory data represents a fundamental shift from outcome-oriented safety assessment toward interaction-oriented risk prediction, allowing potential conflicts to be identified at an early stage.
4.3. Relationship Between Conflicts and Crashes
Traffic conflicts and traffic crashes are common indicators in road traffic safety evaluation. Traffic conflicts, characterized by their high frequency and easier availability, together with the frequency and severity of recorded crashes, serve as intuitive indicators of safety risk. The underlying mechanisms of traffic conflicts and crashes are closely related. Traffic conflicts are often considered as precursors or surrogate indicators of traffic crashes [110].
Two main categories of approaches have been used to model the relationship between traffic conflicts and crashes, distinguished by whether crash data are required [13]. The first type assumes a causal link between traffic conflict and crash, treating conflict as an independent variable and crash as a dependent one. Various statistical methods are employed here, including LR, Binary Logit, and Generalized Linear Regression (GLR). LR often uses a conflict-crash ratio, which is subject to variability due to weather and traffic conditions. For instance, Binary logit method [111] was employed to explore the relationship by quantifying traffic conflicts using a Crash Potential Index (CPI). However, given the complex nature of crash occurrence, traditional statistical methods may struggle to fully capture nonlinear relationships and interaction effects.
The second category focuses on interaction-based conflicts among road users. The crash risk can be calculated through probabilistic models. This approach typically does not rely on crash data for model training but instead uses crash records for validation purposes. Methods include Extreme Value Theory (EVT) [6,112,113,114] and the Lomax Distribution [115]. For instance, Fu et al. [6] proposed a multi-type Bayesian hierarchical extreme value modeling approach to estimate crash frequencies from different types of traffic conflicts. This study integrates multiple conflict types and considers unobserved extreme heterogeneity. Similarly, Hussain et al. [7] developed a hybrid modeling framework that combines MLAs and EVT to estimate crash risks from traffic conflicts. This approach replaces traditional sampling techniques, such as block maxima and peak-over-threshold, with six unsupervised machine learning anomaly detection algorithms for identifying extreme values. The hybrid models demonstrated superior accuracy and efficiency compared to traditional EVT methods. In particular, the Isolation Forest-based model performed best in reducing uncertainty in crash risk estimations. Within this framework, conflicts identified from trajectory data can be used to assess the likelihood of hazardous events.
Despite extensive efforts to model the relationship between traffic conflicts and crashes, establishing a stable and transferable linkage remains challenging. Approaches that directly model crashes as a function of conflict indicators rely on the assumption of a causal relationship, but their effectiveness is often constrained by data aggregation, unobserved heterogeneity, and nonlinear interactions among contributing factors. In contrast, probabilistic and extreme value–based approaches treat conflicts as manifestations of underlying crash risk and avoid direct dependence on crash frequency data, yet their validity is sensitive to threshold selection, conflict definition, and data quality. These methodological differences reflect a deeper gap between outcome-based and interaction-based safety assessment. Bridging this gap requires empirical validation of interaction-based safety assessments against observed crash outcomes, to examine whether conflict-based indicators can reliably reflect actual crash risk across different traffic scenarios.
5. Discussion
This review synthesizes data sources, influencing factors, and modeling approaches within a unified analytical framework, thereby revealing both consistent patterns and persistent gaps in current research. This integrated perspective differs from prior reviews by explicitly examining how data characteristics, influencing factors, and modeling objectives interact, rather than treating them as isolated components. By analyzing them jointly and using a vote-counting strategy, the review clarifies where current evidence is consistent, where it is weak, and how different modeling approaches behave across traffic conditions. This provides a more coherent view of the field and highlights several points that deserve further attention.
First, the analysis of influencing factors reveals consistent patterns across literature. For example, the strong association between traffic demand and crash occurrence is widely recognized, but this review shows that its effect depends on the surrounding context, such as road capacity, driving behavior, and geometric constraints. Similarly, geometric and environmental conditions affect safety not only as isolated variables but through their interaction with driver decisions and speed choice. These observations indicate that many existing modeling practices continue to overlook the combined influence of behavior, geometry, and environment, thereby limiting their explanatory power.
Second, there is an imbalance between reactive and proactive approaches. Reactive crash models remain dominant mainly because crash data are more accessible and the methods are well established. However, their limited ability to capture pre-crash dynamics reduces their usefulness for real-time safety management. At the same time, proactive methods based on trajectory and conflict data are promising but still limited by data quality and collection difficulties. The lack of models that can jointly use crash and conflict information shows that current research still treats short-term risk and long-term safety as separate problems, even though they are closely connected.
Data limitations are a further source of uncertainty. Missing trajectories, sensor instability, and imbalanced datasets often weaken the robustness of results. Although data augmentation and emerging sources such as social media provide possible solutions, their reliability varies strongly across contexts. This confirms that many safety models remain highly sensitive to data quality, highlighting the need for standardized preprocessing and uncertainty reporting.
Another challenge is the modeling of spatial and temporal dependencies. Many deep learning frameworks can capture such patterns based on time-series data. However, their performance often degrades when applied to new regions or road types. This indicates that contextual factors, such as land use and road design, are still insufficiently represented. Recent empirical evidence also shows that crash patterns are strongly shaped by context-specific geometric features [116]. As a result, model transferability remains limited, and predictions often cannot be generalized beyond the original study area.
Model interpretability is also becoming increasingly important. High-performance MLAs and DLAs tend to act as black boxes, which makes it difficult for engineers and authorities to use them for policy decisions. Recent applications of explainable AI tools such as SHAP [117] and LIME [118] show potential, but the field still lacks modeling strategies that combine accuracy with transparency. This gap is particularly relevant for safety analysis, where decisions must rely on clear causal reasoning rather than opaque correlations.
Overall, the review identifies four major and persistent research gaps:
- Data quality and integration: multi-source data remain difficult to combine consistently, and standardized processing pipelines are still missing.
- Spatio-temporal modeling: current approaches do not fully capture the contextual factors that shape risk across locations and time.
- Interpretability: many advanced models lack transparency, which limits their practical use.
- Transferability: most models are designed for specific environments and cannot be easily applied elsewhere.
6. Conclusions
This paper provides a comprehensive literature review on data-driven road traffic safety modeling, highlighting a clear shift from predominantly reactive analysis toward increasingly proactive approaches. It responds to an important gap in existing literature by integrating data sources, influencing factors, and analytical methodologies within a unified synthesis. The main contributions and findings of this review are summarized as follows.
First, this review provides a comprehensive overview of the road traffic safety modeling process, including data acquisition, influencing factor analysis, and methodological development. It examines how different types of data, including trajectory data, crash data, and supplementary sources, support both reactive and proactive safety models, and clarifies the distinctions and potential integration between these two modeling paradigms.
Second, this study develops a structured framework to classify and evaluate modeling methods used in road traffic safety research. By analyzing the frequency and application of influencing factors and analytical algorithms, the framework identifies common patterns across literature. In particular, vote-counting techniques are employed to summarize the directional consistency of both influencing factors and methodological performance across studies, providing a structured perspective on the strengths and limitations of existing variables and modeling approaches.
In addition, this review demonstrates that differences in algorithm performance across studies are primarily driven by task-specific data structures, outcome definitions, and imbalance severity, rather than by the intrinsic superiority of any single algorithmic approach. For instance, deep learning models tend to outperform traditional approaches in tasks such as real-time crash or conflict prediction, where high-dimensional spatio-temporal data and complex interactions dominate, whereas statistical models, such as negative binomial regression, remain more robust and interpretable for aggregated crash frequency analysis. These findings suggest that effective model selection in road traffic safety analysis should be guided by the characteristics of the safety task and data regime, rather than by predictive accuracy alone.
Based on the gaps and limitations identified through this review, future research could focus on several directions. First, studies are needed to calibrate and validate the relationships between traffic conflicts and crash outcomes across different scenarios, such as signalized intersections, unsignalized intersections, and rural highways, as these scenarios are characterized by distinct traffic dynamics and underlying risk mechanisms. Second, future studies should explore methods to link traffic conflicts with crash outcomes, particularly in situations where high-resolution pre-crash trajectory data are unavailable. Approaches based on crash reconstruction, vehicle dynamics, or simulation may help infer pre-crash interactions from crash reports, thereby supporting a more coherent integration of proactive and reactive safety assessment. Finally, future work should systematically examine how data resolution, observation windows, and data aggregation strategies influence model performance.
Overall, these findings indicate that advancing data-driven road traffic safety analysis requires not only methodological innovation, but also closer alignment between data characteristics, modeling objectives, and practical decision-making needs in real-world safety management.
Author Contributions
Conceptualization, M.L.; methodology, C.W., C.R. and N.F.; formal analysis, C.W.; investigation, C.W.; data curation, C.W.; writing—original draft preparation, C.W.; writing—review and editing, N.F. and C.R.; supervision, M.L.; project administration, M.L. All authors have read and agreed to the published version of the manuscript.
Funding
This work was supported by the European Union—NextGenerationEU under the National Recovery and Resilience Plan (PNRR), Spoke 7 “CCAM—Connected Networks and Smart Infrastructure” (Grant number: I53C22000720001).
Data Availability Statement
Not applicable.
Acknowledgments
During the major revision of this manuscript, the authors used ChatGPT (OpenAI, GPT-5.2) for generating and refining text to improve language clarity in responses to reviewers’ comments. The authors have reviewed and edited the output and take full responsibility for the content of this publication.
Conflicts of Interest
The authors declare no conflict of interest.
Abbreviations
The following abbreviations are used in this manuscript:
| AADT | Annual Average Daily Traffic |
| ADT | Average Daily Traffic |
| AI | Artificial Intelligence |
| Bi-LSTM | Bidirectional Long Short-Term Memory |
| CART | Classification and Regression Tree |
| CCTV | Closed-Circuit Television |
| CFP | Crash Frequency Prediction |
| CPI | Crash Potential Index |
| CNN | Convolutional Neural Network |
| CSP | Crash Severity Prediction |
| CV | Computer Vision |
| DLAs | Deep Learning Algorithms |
| DNN | Deep Neural Network |
| DTGN | Dynamic Temporal Graph Network |
| EML/EMLs | Ensemble Machine Learning (Methods) |
| EVT | Extreme Value Theory |
| GAN/GANs | Generative Adversarial Network(s) |
| GCN/GCNs | Graph Convolutional Network(s) |
| GLR | Generalized Linear Regression |
| GSNet | Geographical and Semantic Temporal Network |
| HMM | Hidden Markov Model |
| ITS | Intelligent Transportation System |
| KNN | K-Nearest Neighbor |
| LDA | Latent Dirichlet Allocation |
| LIME | Local Interpretable Model-Agnostic Explanations |
| LR | Linear Regression |
| LSTM | Long Short-Term Memory |
| MLA/MLAs | Machine Learning Algorithm(s) |
| NB | Negative Binomial |
| OLDA | Ontology-based Latent Dirichlet Allocation |
| PKDE | Prior Knowledge-based Data Enhancement |
| RF | Random Forest |
| RTCP | Real-Time Crash Prediction |
| R-CNN | Region-Based Convolutional Neural Network |
| SHAP | SHapley Additive exPlanations |
| SMOTE | Synthetic Minority Oversampling Technique |
| SORT | Simple Online and Realtime Tracking |
| SSMs | Safety Surrogate Measures |
| SVR | Support Vector Regression |
| SVM | Support Vector Machine |
| UAV | Unmanned Aerial Vehicle |
| WHO | World Health Organization |
| YOLO | You Only Look Once |
| XGBoost | Extreme Gradient Boosting |
References
- World Health Organization Global Status Report on Road Safety. 2023. Available online: https://www.who.int/teams/social-determinants-of-health/safety-and-mobility/global-status-report-on-road-safety-2023 (accessed on 25 November 2025).
- European Transport Safety Council 17th Annual Road Safety Performance Index (PIN Report). Available online: https://etsc.eu/17th-annual-road-safety-performance-index-pin-report/ (accessed on 25 November 2025).
- European Commission. Europe on the Move: Sustainable Mobility for Europe; Safe, Connected and Clean; European Commission: Brussels, Belgium, 2018. [Google Scholar]
- Basso, F.; Basso, L.J.; Bravo, F.; Pezoa, R. Real-Time Crash Prediction in an Urban Expressway Using Disaggregated Data. Transp. Res. Part C Emerg. Technol. 2018, 86, 202–219. [Google Scholar] [CrossRef]
- Fiorentini, N.; Losa, M. Handling Imbalanced Data in Road Crash Severity Prediction by Machine Learning Algorithms. Infrastructures 2020, 5, 61. [Google Scholar] [CrossRef]
- Fu, C.; Sayed, T.; Zheng, L. Multi-Type Bayesian Hierarchical Modeling of Traffic Conflict Extremes for Crash Estimation. Accid. Anal. Prev. 2021, 160, 106309. [Google Scholar] [CrossRef]
- Hussain, F.; Li, Y.; Arun, A.; Haque, M.M. A Hybrid Modelling Framework of Machine Learning and Extreme Value Theory for Crash Risk Estimation Using Traffic Conflicts. Anal. Methods Accid. Res. 2022, 36, 100248. [Google Scholar] [CrossRef]
- Ziakopoulos, A.; Yannis, G. A Review of Spatial Approaches in Road Safety. Accid. Anal. Prev. 2020, 135, 105323. [Google Scholar] [CrossRef]
- Silva, P.B.; Andrade, M.; Ferreira, S. Machine Learning Applied to Road Safety Modeling: A Systematic Literature Review. J. Traffic Transp. Eng. 2020, 7, 775–790. [Google Scholar] [CrossRef]
- Sheykhfard, A.; Haghighi, F.; Papadimitriou, E.; Van Gelder, P. Review and Assessment of Different Perspectives of Vehicle-Pedestrian Conflicts and Crashes: Passive and Active Analysis Approaches. J. Traffic Transp. Eng. 2021, 8, 681–702. [Google Scholar] [CrossRef]
- Shaik, M.E.; Islam, M.M.; Hossain, Q.S. A Review on Neural Network Techniques for the Prediction of Road Traffic Accident Severity. Asian Transp. Stud. 2021, 7, 100040. [Google Scholar] [CrossRef]
- Santos, K.; Dias, J.P.; Amado, C. A Literature Review of Machine Learning Algorithms for Crash Injury Severity Prediction. J. Saf. Res. 2022, 80, 254–269. [Google Scholar] [CrossRef]
- Zheng, L.; Sayed, T.; Mannering, F. Modeling Traffic Conflicts for Use in Road Safety Analysis: A Review of Analytic Methods and Future Directions. Anal. Methods Accid. Res. 2021, 29, 100142. [Google Scholar] [CrossRef]
- Zhu, S.Y.; Jiang, R.X.; Wang, H.; Zou, H.; Wang, P.; Qiu, J. Review of Research on Traffic Conflict Techniques. China J. Highw. Transp. 2020, 33, 15. [Google Scholar] [CrossRef]
- Hu, L.; Ou, J.; Huang, J.; Chen, Y.; Cao, D. A Review of Research on Traffic Conflicts Based on Intelligent Vehicles. IEEE Access 2020, 8, 24471–24483. [Google Scholar] [CrossRef]
- Sohail, A.; Cheema, M.A.; Ali, M.E.; Toosi, A.N.; Rakha, H.A. Data-Driven Approaches for Road Safety: A Comprehensive Systematic Literature Review. Saf. Sci. 2023, 158, 105949. [Google Scholar] [CrossRef]
- Ahmed, M.M.; Khan, M.N.; Das, A.; Dadvar, S.E. Global Lessons Learned from Naturalistic Driving Studies to Advance Traffic Safety and Operation Research: A Systematic Review. Accid. Anal. Prev. 2022, 167, 106568. [Google Scholar] [CrossRef]
- Zeng, Q.; Wang, Q.; Zhang, K.; Wong, S.C.; Xu, P. Analysis of the Injury Severity of Motor Vehicle–Pedestrian Crashes at Urban Intersections Using Spatiotemporal Logistic Regression Models. Accid. Anal. Prev. 2023, 189, 107119. [Google Scholar] [CrossRef]
- Liu, Z.; He, J.; Zhang, C.; Yan, X.; Wang, C.; Qiao, B. Vehicle Trajectory Extraction at the Exit Areas of Urban Freeways Based on a Novel Composite Algorithms Framework. J. Intell. Transp. Syst. 2023, 27, 295–313. [Google Scholar] [CrossRef]
- Arun, A.; Haque, M.M.; Washington, S.; Sayed, T.; Mannering, F. How Many Are Enough?: Investigating the Effectiveness of Multiple Conflict Indicators for Crash Frequency-by-Severity Estimation by Automated Traffic Conflict Analysis. Transp. Res. Part C Emerg. Technol. 2022, 138, 103653. [Google Scholar] [CrossRef]
- Abdel-Aty, M.; Wang, Z.; Zheng, O.; Abdelraouf, A. Advances and Applications of Computer Vision Techniques in Vehicle Trajectory Generation and Surrogate Traffic Safety Indicators. Accid. Anal. Prev. 2023, 191, 107191. [Google Scholar] [CrossRef] [PubMed]
- Krajewski, R.; Bock, J.; Kloeker, L.; Eckstein, L. The highD Dataset: A Drone Dataset of Naturalistic Vehicle Trajectories on German Highways for Validation of Highly Automated Driving Systems. In Proceedings of the 21st International Conference on Intelligent Transportation Systems (ITSC), Maui, HI, USA, 4–7 November 2018; pp. 2118–2125. [Google Scholar] [CrossRef]
- Krajewski, R.; Moers, T.; Bock, J.; Vater, L.; Eckstein, L. The rounD Dataset: A Drone Dataset of Road User Trajectories at Roundabouts in Germany. In Proceedings of the 23rd International Conference on Intelligent Transportation Systems (ITSC), Rhodes, Greece, 20–23 September 2020. [Google Scholar] [CrossRef]
- Moers, T.; Vater, L.; Krajewski, R.; Bock, J.; Zlocki, A.; Eckstein, L. The exiD Dataset: A Real-World Trajectory Dataset of Highly Interactive Highway Scenarios in Germany. In Proceedings of the IEEE Intelligent Vehicles Symposium (IV), Aachen, Germany, 4–9 June 2022; pp. 958–964. [Google Scholar] [CrossRef]
- Li, L.; Zhang, J.; Wang, Y.; Ran, B. Missing Value Imputation for Traffic-Related Time Series Data Based on a Multi-View Learning Method. IEEE Trans. Intell. Transp. Syst. 2019, 20, 2933–2943. [Google Scholar] [CrossRef]
- Zhao, D.; Zhang, Y.; Wang, W.; Hua, X.; Yang, M. Car-Following Trajectory Data Imputation with Adversarial Convolutional Neural Network. IET Intell. Transp. Syst. 2023, 17, 960–972. [Google Scholar] [CrossRef]
- Chang, H.; Li, L.; Huang, J.; Zhang, Q.; Chin, K.S. Tracking Traffic Congestion and Accidents Using Social Media Data: A Case Study of Shanghai. Accid. Anal. Prev. 2022, 169, 106618. [Google Scholar] [CrossRef] [PubMed]
- Chen, Y.; Lv, Y.; Wang, X.; Li, L.; Wang, F.Y. Detecting Traffic Information from Social Media Texts with Deep Learning Approaches. IEEE Trans. Intell. Transp. Syst. 2019, 20, 3049–3058. [Google Scholar] [CrossRef]
- Ali, F.; Ali, A.; Imran, M.; Naqvi, R.A.; Siddiqi, M.H.; Kwak, K.-S. Traffic Accident Detection and Condition Analysis Based on Social Networking Data. Accid. Anal. Prev. 2021, 151, 105973. [Google Scholar] [CrossRef]
- Zhang, Y.; Chen, Y.; Gu, X.; Sze, N.N.; Huang, J. A Proactive Crash Risk Prediction Framework for Lane-Changing Behavior Incorporating Individual Driving Styles. Accid. Anal. Prev. 2023, 188, 107072. [Google Scholar] [CrossRef]
- Katrakazas, C.; Quddus, M.; Chen, W.H. A New Integrated Collision Risk Assessment Methodology for Autonomous Vehicles. Accid. Anal. Prev. 2019, 127, 61–79. [Google Scholar] [CrossRef]
- Liu, J.; Khattak, A.J.; Wali, B. Do Safety Performance Functions Used for Predicting Crash Frequency Vary across Space? Applying Geographically Weighted Regressions to Account for Spatial Heterogeneity. Accid. Anal. Prev. 2017, 109, 132–142. [Google Scholar] [CrossRef]
- Zhang, P.; Wang, C.; Chen, F.; Cui, S.; Cheng, J.; Bo, W. A Random-Parameter Negative Binomial Model for Assessing Freeway Crash Frequency by Injury Severity: Daytime versus Nighttime. Sustainability 2022, 14, 9061. [Google Scholar] [CrossRef]
- Fiorentini, N.; Leandri, P.; Losa, M. Defining Machine Learning Algorithms as Accident Prediction Models for Italian Two-Lane Rural, Suburban, and Urban Roads. Int. J. Inj. Control Saf. Promot. 2022, 29, 450–462. [Google Scholar] [CrossRef]
- Ryder, B.; Dahlinger, A.; Gahr, B.; Zundritsch, P.; Wortmann, F.; Fleisch, E. Spatial Prediction of Traffic Accidents with Critical Driving Events—Insights from a Nationwide Field Study. Transp. Res. Part Policy Pract. 2019, 124, 611–626. [Google Scholar] [CrossRef]
- Li, J.; Wang, X. Hotspot Identification on Urban Arterials at the Meso Level. Accid. Anal. Prev. 2022, 169, 106632. [Google Scholar] [CrossRef] [PubMed]
- Zhou, Z.; Wang, Y.; Xie, X.; Chen, L.; Liu, H. RiskOracle: A Minute-Level Citywide Traffic Accident Forecasting Framework. Proc. AAAI Conf. Artif. Intell. 2020, 34, 1258–1265. [Google Scholar] [CrossRef]
- Li, J.; Wang, X.; Yang, X.; Zhang, Q.; Pan, H. Analyzing Freeway Safety Influencing Factors Using the CatBoost Model and Interpretable Machine-Learning Framework, SHAP. Transp. Res. Rec. 2023, 2678, 563–574. [Google Scholar] [CrossRef]
- Rahman, F.; Zhang, X.; Chen, M. Evaluating Effect of Operating Speed on Crashes of Rural Two-Lane Highways. J. Adv. Transp. 2023, 2023, 2882951. [Google Scholar] [CrossRef]
- Saha, D.; Alluri, P.; Gan, A.; Wu, W. Spatial Analysis of Macro-Level Bicycle Crashes Using the Class of Conditional Autoregressive Models. Accid. Anal. Prev. 2018, 118, 166–177. [Google Scholar] [CrossRef]
- Gu, Y.; Liu, D.; Arvin, R.; Khattak, A.J.; Han, L.D. Predicting Intersection Crash Frequency Using Connected Vehicle Data: A Framework for Geographical Random Forest. Accid. Anal. Prev. 2023, 179, 106880. [Google Scholar] [CrossRef]
- Islam, Z.; Abdel-Aty, M.; Anwari, N.; Islam, M.R. Understanding the Impact of Vehicle Dynamics, Geometric and Non-Geometric Roadway Attributes on Surrogate Safety Measure Using Connected Vehicle Data. Accid. Anal. Prev. 2023, 189, 107125. [Google Scholar] [CrossRef]
- Lu, J.; Grembek, O.; Hansen, M. Learning the Representation of Surrogate Safety Measures to Identify Traffic Conflict. Accid. Anal. Prev. 2022, 174, 106755. [Google Scholar] [CrossRef]
- Gore, N.; Chauhan, R.; Easa, S.; Arkatkar, S. Traffic Conflict Assessment Using Macroscopic Traffic Flow Variables: A Novel Framework for Real-Time Applications. Accid. Anal. Prev. 2023, 185, 107020. [Google Scholar] [CrossRef]
- Katrakazas, C.; Theofilatos, A.; Islam, M.A.; Papadimitriou, E.; Dimitriou, L.; Antoniou, C. Prediction of Rear-End Conflict Frequency Using Multiple-Location Traffic Parameters. Accid. Anal. Prev. 2021, 152, 106007. [Google Scholar] [CrossRef]
- Hosseinpour, M.; Yahaya, A.S.; Sadullah, A.F.; Ismail, N.; Ghadiri, S.M.R. Evaluating the Effects of Road Geometry, Environment, and Traffic Volume on Rollover Crashes. Transport 2016, 31, 221–232. [Google Scholar] [CrossRef]
- Mishra, A.; Rao, A.M.; Othayoth, D. A Review of Safety and Operational Impacts of Various Speed Limits. In International Conference on Transportation Planning and Implementation Methodologies for Developing Countries; Springer Nature: Singapore, 2024; Volume 434, pp. 487–497. [Google Scholar] [CrossRef]
- Loo, B.P.Y.; Fan, Z.; Lian, T.; Zhang, F. Using Computer Vision and Machine Learning to Identify Bus Safety Risk Factors. Accid. Anal. Prev. 2023, 185, 107017. [Google Scholar] [CrossRef]
- Wang, X.; Li, S.; Li, X.; Wang, Y.; Zeng, Q. Effects of Geometric Attributes of Horizontal and Sag Vertical Curve Combinations on Freeway Crash Frequency. Accid. Anal. Prev. 2023, 186, 107056. [Google Scholar] [CrossRef] [PubMed]
- Gooch, J.P.; Gayah, V.V.; Donnell, E.T. Quantifying the Safety Effects of Horizontal Curves on Two-Way, Two-Lane Rural Roads. Accid. Anal. Prev. 2016, 92, 71–81. [Google Scholar] [CrossRef] [PubMed]
- Hou, Q.; Huo, X.; Leng, J. A Correlated Random Parameters Tobit Model to Analyze the Safety Effects and Temporal Instability of Factors Affecting Crash Rates. Accid. Anal. Prev. 2020, 134, 105326. [Google Scholar] [CrossRef]
- Zhao, G.; Jiang, Y.; Li, S.; Tighe, S. Exploring Implicit Relationships between Pavement Surface Friction and Vehicle Crash Severity Using Interpretable Extreme Gradient Boosting Method. Can. J. Civ. Eng. 2022, 49, 1206–1219. [Google Scholar] [CrossRef]
- Malin, F.; Norros, I.; Innamaa, S. Accident Risk of Road and Weather Conditions on Different Road Types. Accid. Anal. Prev. 2019, 122, 181–188. [Google Scholar] [CrossRef]
- Wang, L.; Abdel-Aty, M.; Shi, Q.; Park, J. Real-Time Crash Prediction for Expressway Weaving Segments. Transp. Res. Part C Emerg. Technol. 2015, 61, 1–10. [Google Scholar] [CrossRef]
- Yang, Y.; Wang, K.; Yuan, Z.; Liu, D. Predicting Freeway Traffic Crash Severity Using XGBoost-Bayesian Network Model with Consideration of Features Interaction. J. Adv. Transp. 2022, 2022, 4257865. [Google Scholar] [CrossRef]
- Zong, F.; Chen, X.; Tang, J.; Yu, P.; Wu, T. Analyzing Traffic Crash Severity with Combination of Information Entropy and Bayesian Network. IEEE Access 2019, 7, 63288–63302. [Google Scholar] [CrossRef]
- Alnawmasi, N.; Ali, Y.; Yasmin, S. Exploring Temporal Instability Effects on Bicyclist Injury Severities Determinants for Intersection and Non-Intersection-Related Crashes. Accid. Anal. Prev. 2024, 194, 107339. [Google Scholar] [CrossRef]
- Islam, M.K.; Reza, I.; Gazder, U.; Akter, R.; Arifuzzaman, M.; Rahman, M.M. Predicting Road Crash Severity Using Classifier Models and Crash Hotspots. Appl. Sci. 2022, 12, 11354. [Google Scholar] [CrossRef]
- Jamal, A.; Zahid, M.; Rahman, M.T.; Al-Ahmadi, H.M.; Almoshaogeh, M.; Farooq, D.; Ahmad, M. Injury Severity Prediction of Traffic Crashes with Ensemble Machine Learning Techniques: A Comparative Study. Int. J. Inj. Contr. Saf. Promot. 2021, 28, 408–427. [Google Scholar] [CrossRef] [PubMed]
- Ren, Q.; Xu, M. Exploring Variations and Temporal Instability of Factors Affecting Driver Injury Severities between Different Vehicle Impact Locations under Adverse Road Surface Conditions. Anal. Methods Accid. Res. 2023, 40, 100305. [Google Scholar] [CrossRef]
- Elyassami, S.; Hamid, Y.; Habuza, T. Road Crashes Analysis and Prediction Using Gradient Boosted and Random Forest Trees. In Proceedings of the 6th IEEE Congress on Information Science and Technology (CiSt), Agadir-Essaouira, Morocco, 5–12 June 2021; pp. 520–525. [Google Scholar] [CrossRef]
- Rahim, M.A.; Hassan, H.M. A Deep Learning Based Traffic Crash Severity Prediction Framework. Accid. Anal. Prev. 2021, 154, 106090. [Google Scholar] [CrossRef] [PubMed]
- Wahab, L.; Jiang, H. Severity Prediction of Motorcycle Crashes with Machine Learning Methods. Int. J. Crashworthiness 2019, 25, 485–492. [Google Scholar] [CrossRef]
- Islam, M.; Patel, D.; Hasan, A.S.; Jalayer, M. An Exploratory Analysis of Two-Vehicle Crashes for Distracted Driving with a Mixed Approach: Machine Learning Algorithm with Unobserved Heterogeneity. J. Transp. Saf. Secur. 2024, 16, 709–745. [Google Scholar] [CrossRef]
- Kidando, E.; Kitali, A.E.; Kutela, B.; Ghorbanzadeh, M.; Karaer, A.; Koloushani, M.; Moses, R.; Ozguven, E.E.; Sando, T. Prediction of Vehicle Occupants Injury at Signalized Intersections Using Real-Time Traffic and Signal Data. Accid. Anal. Prev. 2021, 149, 105869. [Google Scholar] [CrossRef]
- Li, Y.; Yang, Z.; Xing, L.; Yuan, C.; Liu, F.; Wu, D.; Yang, H. Crash Injury Severity Prediction Considering Data Imbalance: A Wasserstein Generative Adversarial Network with Gradient Penalty Approach. Accid. Anal. Prev. 2023, 192, 107271. [Google Scholar] [CrossRef] [PubMed]
- Janstrup, K.H.; Kostic, B.; Møller, M.; Rodrigues, F.; Borysov, S.; Pereira, F.C. Predicting Injury-Severity for Cyclist Crashes Using Natural Language Processing and Neural Network Modelling. Saf. Sci. 2023, 164, 106153. [Google Scholar] [CrossRef]
- Kasasbeh, A.; Shabbar, R.; Santos, D. Crash Severity Prediction Using a Series of Artificial Neural Networks. In Proceedings of the IISE Annual Conference and Expo, Orlando, FL, USA, 19–22 May 2018; pp. 443–448. [Google Scholar]
- Khan, M.N.; Das, S.; Liu, J. Predicting Pedestrian-Involved Crash Severity Using Inception-v3 Deep Learning Model. Accid. Anal. Prev. 2024, 197, 107457. [Google Scholar] [CrossRef]
- Niyogisubizo, J.; Liao, L.; Sun, Q.; Nziyumva, E.; Wang, Y.; Luo, L.; Lai, S.; Murwanashyaka, E. Predicting Crash Injury Severity in Smart Cities: A Novel Computational Approach with Wide and Deep Learning Model. Int. J. Intell. Transp. Syst. Res. 2023, 21, 240–258. [Google Scholar] [CrossRef]
- Basso, F.; Pezoa, R.; Varas, M.; Villalobos, M. A Deep Learning Approach for Real-Time Crash Prediction Using Vehicle-by-Vehicle Data. Accid. Anal. Prev. 2021, 162, 106409. [Google Scholar] [CrossRef]
- Hall, T.; Tarko, A.P. Adequacy of Negative Binomial Models for Managing Safety on Rural Local Roads. Accid. Anal. Prev. 2019, 128, 148–158. [Google Scholar] [CrossRef]
- Ma, Z.; Zhang, H.; Chien, S.I.J.; Wang, J.; Dong, C. Predicting Expressway Crash Frequency Using a Random Effect Negative Binomial Model: A Case Study in China. Accid. Anal. Prev. 2017, 98, 214–222. [Google Scholar] [CrossRef] [PubMed]
- Mahmud, A.; Gayah, V.V.; Paleti, R. Estimation of Crash Type Frequency Accounting for Misclassification in Crash Data. Accid. Anal. Prev. 2023, 184, 106998. [Google Scholar] [CrossRef]
- Sze, N.N.; Su, J.; Bai, L. Exposure to Pedestrian Crash Based on Household Survey Data: Effect of Trip Purpose. Accid. Anal. Prev. 2019, 128, 17–24. [Google Scholar] [CrossRef]
- Tang, H.; Gayah, V.V.; Donnell, E.T. Evaluating the Predictive Power of an SPF for Two-Lane Rural Roads with Random Parameters on out-of-Sample Observations. Accid. Anal. Prev. 2019, 132, 105275. [Google Scholar] [CrossRef] [PubMed]
- Wang, X.; Tang, D.; Pei, S.; Li, P.; Yu, R.; Xie, K. Transferability of Urban Arterial Safety Performance Functions between Shanghai and Guangzhou, China. J. Transp. Eng. Part Syst. 2022, 148, 04021110. [Google Scholar] [CrossRef]
- Wang, X.; Pu, H.Q.; Li, X.; Yan, Y.; Yao, J. A New GNB Model of Crash Frequency for Freeway Sharp Horizontal Curve Based on Interactive Influence of Explanatory Variables. J. Adv. Transp. 2018, 2018, 8973581. [Google Scholar] [CrossRef]
- Yuan, J.; Abdel-Aty, M.; Fu, J.; Wu, Y.; Yue, L.; Eluru, N. Developing Safety Performance Functions for Freeways at Different Aggregation Levels Using Multi-State Microscopic Traffic Detector Data. Accid. Anal. Prev. 2021, 151, 105984. [Google Scholar] [CrossRef]
- Zhang, H.; Li, S.; Wu, C.; Zhang, Q.; Wang, Y. Predicting Crash Frequency for Urban Expressway Considering Collision Types Using Real-Time Traffic Data. J. Adv. Transp. 2020, 2020, 8523818. [Google Scholar] [CrossRef]
- Mahmoud, N.; Abdel-Aty, M.; Abdelraouf, A. The Impact of Target Speed on Pedestrian, Bike, and Speeding Crash Frequencies. Accid. Anal. Prev. 2023, 192, 107263. [Google Scholar] [CrossRef]
- Rolison, J.J.; Regev, S.; Moutari, S.; Feeney, A. What Are the Factors That Contribute to Road Accidents? An Assessment of Law Enforcement Views, Ordinary Drivers’ Opinions, and Road Accident Records. Accid. Anal. Prev. 2018, 115, 11–24. [Google Scholar] [CrossRef]
- Zeng, Q.; Sun, J.; Wen, H. Bayesian Hierarchical Modeling Monthly Crash Counts on Freeway Segments with Temporal Correlation. J. Adv. Transp. 2017, 2017, 5391054. [Google Scholar] [CrossRef]
- Zhu, T.; Qin, D.; Jia, W. Examining the Associations between Urban Bus Drivers’ Rule Violations and Crash Frequency Using Observational Data. Accid. Anal. Prev. 2023, 187, 107074. [Google Scholar] [CrossRef]
- Wu, Y.W.; Hsu, T.P. Mid-Term Prediction of at-Fault Crash Driver Frequency Using Fusion Deep Learning with City-Level Traffic Violation Data. Accid. Anal. Prev. 2021, 150, 105910. [Google Scholar] [CrossRef] [PubMed]
- Yehia, A.; Wang, X.; Feng, M.; Yang, X.; Gong, J.; Zhu, Z. Applicability of Boosting Techniques in Calibrating Safety Performance Functions for Freeways. Accid. Anal. Prev. 2021, 159, 106193. [Google Scholar] [CrossRef] [PubMed]
- Zhang, X.; Waller, S.T.; Jiang, P. An Ensemble Machine Learning-Based Modeling Framework for Analysis of Traffic Crash Frequency. Comput.-Aided Civ. Infrastruct. Eng. 2020, 35, 258–276. [Google Scholar] [CrossRef]
- Lin, L.; Wang, Q.; Sadek, A.W. A Novel Variable Selection Method Based on Frequent Pattern Tree for Real-Time Traffic Accident Risk Prediction. Transp. Res. Part C Emerg. Technol. 2015, 55, 444–459. [Google Scholar] [CrossRef]
- Theofilatos, A. Incorporating Real-Time Traffic and Weather Data to Explore Road Accident Likelihood and Severity in Urban Arterials. J. Saf. Res. 2017, 61, 9–21. [Google Scholar] [CrossRef]
- Elassad, Z.E.A.; Mousannif, H.; Moatassime, H.A. A Real-Time Crash Prediction Fusion Framework: An Imbalance-Aware Strategy for Collision Avoidance Systems. Transp. Res. Part C Emerg. Technol. 2020, 118, 102708. [Google Scholar] [CrossRef]
- Cui, H.; Xie, K. An Accelerated Hierarchical Bayesian Crash Frequency Model with Accommodation of Spatiotemporal Interactions. Accid. Anal. Prev. 2021, 153, 106018. [Google Scholar] [CrossRef]
- Ding, H.; Lu, Y.; Sze, N.N.; Antoniou, C.; Guo, Y. A Crash Feature-Based Allocation Method for Boundary Crash Problem in Spatial Analysis of Bicycle Crashes. Anal. Methods Accid. Res. 2023, 37, 100251. [Google Scholar] [CrossRef]
- Ren, H.; Song, Y.; Wang, J.; Hu, Y.; Lei, J. A Deep Learning Approach to the Citywide Traffic Accident Risk Prediction. In Proceedings of the 21st International Conference on Intelligent Transportation Systems (ITSC), Maui, HI, USA, 4–7 November 2018; pp. 3346–3351. [Google Scholar] [CrossRef]
- Guo, S.; Lin, Y.; Feng, N.; Song, C.; Wan, H. Attention Based Spatial-Temporal Graph Convolutional Net-works for Traffic Flow Forecasting. Proc. AAAI Conf. Artif. Intell. 2019, 33, 922–929. [Google Scholar] [CrossRef]
- Wang, B.; Lin, Y.; Guo, S.; Wan, H. GSNet: Learning Spatial-Temporal Correlations from Geographical and Semantic Aspects for Traffic Accident Risk Forecasting. Proc. AAAI Conf. Artif. Intell. 2021, 35, 4402–4409. [Google Scholar] [CrossRef]
- Cai, L.; Janowicz, K.; Mai, G.; Yan, B.; Zhu, R. Traffic Transformer: Capturing the Continuity and Periodicity of Time Series for Traffic Forecasting. Trans. GIS 2020, 24, 736–755. [Google Scholar] [CrossRef]
- Man, C.K.; Quddus, M.; Theofilatos, A. Transfer Learning for Spatio-Temporal Transferability of Real-Time Crash Prediction Models. Accid. Anal. Prev. 2022, 165, 106511. [Google Scholar] [CrossRef] [PubMed]
- Peng, Y.; Li, C.; Wang, K.; Gao, Z.; Yu, R. Examining Imbalanced Classification Algorithms in Predicting Real-Time Traffic Crash Risk. Accid. Anal. Prev. 2020, 144, 105610. [Google Scholar] [CrossRef] [PubMed]
- Essa, M.; Sayed, T. Traffic Conflict Models to Evaluate the Safety of Signalized Intersections at the Cycle Level. Transp. Res. Part C Emerg. Technol. 2018, 89, 289–302. [Google Scholar] [CrossRef]
- Xie, K.; Yang, D.; Ozbay, K.; Yang, H. Use of Real-World Connected Vehicle Data in Identifying High-Risk Locations Based on a New Surrogate Safety Measure. Accid. Anal. Prev. 2019, 125, 311–319. [Google Scholar] [CrossRef]
- Stylianou, K.; Dimitriou, L. Analysis of Rear-End Conflicts in Urban Networks Using Bayesian Networks. Transp. Res. Rec. 2018, 2672, 302–312. [Google Scholar] [CrossRef]
- Orsini, F.; Gecchele, G.; Rossi, R.; Gastaldi, M. A Conflict-Based Approach for Real-Time Road Safety Analysis: Comparative Evaluation with Crash-Based Models. Accid. Anal. Prev. 2021, 161, 106382. [Google Scholar] [CrossRef]
- Katrakazas, C.; Quddus, M.; Chen, W.H. A Simulation Study of Predicting Real-Time Conflict-Prone Traffic Conditions. IEEE Trans. Intell. Transp. Syst. 2018, 19, 3196–3207. [Google Scholar] [CrossRef]
- Hu, Y.; Li, Y.; Huang, H.; Lee, J.; Yuan, C.; Zou, G. A High-Resolution Trajectory Data Driven Method for Real-Time Evaluation of Traffic Safety. Accid. Anal. Prev. 2022, 165, 106503. [Google Scholar] [CrossRef]
- Islam, Z.; Abdel-Aty, M. Traffic Conflict Prediction Using Connected Vehicle Data. Anal. Methods Accid. Res. 2023, 39, 100275. [Google Scholar] [CrossRef]
- Formosa, N.; Quddus, M.; Ison, S.; Abdel-Aty, M.; Yuan, J. Predicting Real-Time Traffic Conflicts Using Deep Learning. Accid. Anal. Prev. 2020, 136, 105429. [Google Scholar] [CrossRef]
- Jia, C.; Ma, J. Conditional Temporal GAN for Intent-Aware Vessel Trajectory Prediction in the Precautionary Area. Eng. Appl. Artif. Intell. 2023, 126, 106776. [Google Scholar] [CrossRef]
- Cao, Q.; Zhao, Z.; Zeng, Q.; Wang, Z.; Long, K. Real-Time Vehicle Trajectory Prediction for Traffic Conflict Detection at Unsignalized Intersections. J. Adv. Transp. 2021, 2021, 8453726. [Google Scholar] [CrossRef]
- Sun, Z.; Chen, Y.; Wang, P.; Fang, S.; Tang, B. Vision-Based Traffic Conflict Detection Using Trajectory Learning and Prediction. IEEE Access 2021, 9, 34558–34569. [Google Scholar] [CrossRef]
- Davis, G.A.; Hourdos, J.; Xiong, H.; Chatterjee, I. Outline for a Causal Model of Traffic Conflicts and Crashes. Accid. Anal. Prev. 2011, 43, 1907–1919. [Google Scholar] [CrossRef] [PubMed]
- Zhao, P.; Lee, C. Assessing Rear-End Collision Risk of Cars and Heavy Vehicles on Freeways Using a Surrogate Safety Measure. Accid. Anal. Prev. 2018, 113, 149–158. [Google Scholar] [CrossRef]
- Ali, Y.; Washington, S.; Haque, M.M. Estimating Real-Time Crash Risk at Signalized Intersections: A Bayesian Generalized Extreme Value Approach. Saf. Sci. 2023, 164, 106181. [Google Scholar] [CrossRef]
- Nazir, F.; Ali, Y.; Sharma, A.; Zheng, Z.; Haque, M.M. Car-Following Crash Risk Analysis in a Connected Environment: A Bayesian Non-Stationary Generalised Extreme Value Model. Anal. Methods Accid. Res. 2023, 39, 100278. [Google Scholar] [CrossRef]
- Ali, Y.; Haque, M.M.; Mannering, F. Assessing Traffic Conflict/Crash Relationships with Extreme Value Theory: Recent Developments and Future Directions for Connected and Autonomous Vehicle and Highway Safety Research. Anal. Methods Accid. Res. 2023, 39, 100276. [Google Scholar] [CrossRef]
- Tarko, A.P. Maximum Likelihood Method of Estimating the Conflict-Crash Relationship. Accid. Anal. Prev. 2023, 179, 106875. [Google Scholar] [CrossRef]
- Fiorentini, N.; Losa, M. Developing Safety Performance Functions to Inform Transport Policies on Urban Two-Lane Roads. Res. Transp. Bus. Manag. 2025, 60, 101357. [Google Scholar] [CrossRef]
- Cai, Q.; Abdel-Aty, M.; Zheng, O.; Wu, Y. Applying Machine Learning and Google Street View to Explore Effects of Drivers’ Visual Environment on Traffic Safety. Transp. Res. Part C Emerg. Technol. 2022, 135, 103541. [Google Scholar] [CrossRef]
- Lee, J.Y.; Kwak, J.I.; Oh, Y.K.; Kim, S. Quantifying Incident Impacts and Identifying Influential Features in Urban Traffic Networks. Transp. B 2023, 11, 279–300. [Google Scholar] [CrossRef]
Disclaimer/Publisher’s Note: The statements, opinions and data contained in all publications are solely those of the individual author(s) and contributor(s) and not of MDPI and/or the editor(s). MDPI and/or the editor(s) disclaim responsibility for any injury to people or property resulting from any ideas, methods, instructions or products referred to in the content. |
© 2025 by the authors. Licensee MDPI, Basel, Switzerland. This article is an open access article distributed under the terms and conditions of the Creative Commons Attribution (CC BY) license.