Abstract
Accurate discharge measurement in irrigation channels is critical for improving water use efficiency and optimizing water allocation. To investigate the controlling factors of sediment deposition and its influence on the stage–discharge relationship, controlled experiments were conducted in a rectangular glass flume. Sediment concentration (4–16 kg/m3), bed slope (0.0005–0.002), and discharge (15–45 L/s) were systematically varied, and longitudinal deposition thickness and corresponding water stages were measured. Results indicate that sediment concentration is the dominant factor controlling deposition thickness, exhibiting a downstream-decreasing influence, with pronounced differences upstream and convergence downstream. Bed slope and discharge mitigate deposition by enhancing near-bed hydraulics; upstream deposition thickness decreased by approximately 35% and 23% as slope increased from 0.0005 to 0.002 and discharge increased from 15 to 45 L/s, respectively, with the regulatory effect diminishing along the flow direction. Three-dimensional response analysis revealed a compound “concentration-dominated and hydraulically regulated” mechanism: under low-discharge, low-slope, and high-concentration conditions, the ratio of deposition thickness to measured water depth (hd/h) exceeded 15%, whereas it decreased below 5% under high-discharge, high-slope, and low-concentration conditions. Sediment deposition elevated the overall water stage by approximately 3–4% and caused systematic overestimation of stage-based discharge, with errors reaching 31.4% under low-discharge and high-concentration conditions and decreasing to 4.94% under high-discharge and steep-slope conditions. These findings provide quantitative evidence for discharge measurement and stage–discharge relationship calibration in sediment-laden open channels.
1. Introduction
Accurate discharge measurement in open-channel irrigation systems is essential for agricultural water management, including water allocation, efficiency assessment, operational scheduling, and performance evaluation of irrigation districts. Irrigation water conveyance and distribution systems are increasingly being upgraded through water-saving rehabilitation and modernization projects, which has led to stricter requirements on discharge measurement accuracy, real-time monitoring, and fine-grained hydraulic control in open-channel networks [1,2,3]. Despite these improvements, sediment deposition remains a persistent and widespread problem. Siltation reduces the effective flow area, increases upstream stage, and shifts stage–discharge relationships, which ultimately undermines the accuracy and stability of flow measurement systems that rely on stage observations [4,5,6,7].
Sediment transport and deposition processes in irrigation canals are governed by a set of coupled hydraulic and morphological interactions. Numerous studies have shown that long-term sedimentation can reduce the conveyance capacity of open channels by 30% to 40%, seriously degrading irrigation performance and increasing maintenance costs [8,9,10]. Non-equilibrium sediment transport theories further indicate that deposition patterns are strongly affected by spatially varying flow conditions and sediment supply, often displaying pronounced upstream aggradation followed by downstream attenuation as sediment availability decreases and near-bed turbulence weakens [11,12,13,14]. These morphological changes directly alter hydraulic parameters such as flow area, hydraulic radius, and energy slope, leading to noticeable rating shifts in stage–discharge curves [15,16,17,18]. Recent hydrodynamic research has revealed that sediment-induced changes in bed topography modify near-bed turbulence, shear stress distributions, and vertical velocity structures. These changes further influence sediment entrainment and suspension capacity [19,20]. Meanwhile, flow discharge and channel slope regulate the amount of hydraulic energy available for sediment transport, controlling the balance between deposition and erosion [21,22,23]. These findings collectively highlight that deposition thickness is shaped by the combined effects of sediment supply (concentration), hydraulic forcing (discharge), and channel morphology (slope), rather than by any single factor alone. However, despite extensive research on sediment transport and channel hydraulics, a systematic understanding of how sediment concentration, flow discharge, and channel slope jointly determine deposition thickness, longitudinal accumulation patterns, and their subsequent effects on stage–discharge relationships is still lacking. Most existing studies examine these factors in isolation, do not quantify their nonlinear interactions, or neglect the feedback loop between deposition geometry and discharge estimation errors [24,25]. As irrigation districts increasingly rely on real-time water-stage sensors and intelligent flow monitoring devices, neglecting the dynamic evolution of channel bed geometry can introduce persistent errors into automated control systems and digital-twin models. In addition, modern flow measurement technologies, including radar-based and ultrasonic stage–discharge meters, typically assume a fixed cross-sectional geometry during their calibration process. However, empirical evidence has shown that even small variations in bed elevation, such as 5 percent to 10 percent of the flow depth, can significantly distort discharge estimates, particularly under low-flow and high-sediment conditions. Such biases can accumulate across large-scale water delivery systems, resulting in substantial deviations between planned and delivered water volumes.
Given these scientific and practical challenges, it is necessary to investigate the multi-factor coupling mechanism governing sediment deposition and to evaluate its hydraulic impacts on the stage–discharge relationship. Recent multi-factor laboratory studies and field analyses (e.g., [18,24]) have begun to examine how discharge, slope, and sediment supply interact to distort rating curves in mobile-bed channels. However, these works typically focus either on the evolution of bed aggradation patterns or on shifts in stage–discharge relationships, and rarely combine detailed longitudinal mapping of deposition thickness with direct quantification of discharge error in irrigation-type channels. Controlled laboratory experiments in simplified geometries therefore provide a useful complement, allowing the contributions of key parameters to be isolated, the spatial variability of deposition patterns to be measured systematically, and process-based data to be obtained for rating-curve correction under sediment-laden conditions.
To address this gap, the present study conducted controlled glass-flume experiments to systematically examine the combined influences of sediment concentration, discharge, and channel slope on longitudinal deposition thickness and associated water-stage variations. By quantifying the three-factor interaction mechanism and evaluating its implications for stage–discharge estimation, this work aims to clarify the hydraulic consequences of sediment accumulation and provide quantitative guidance for rating-curve correction and flow measurement in sediment-laden irrigation systems. Compared with previous laboratory and field investigations in which sediment concentration, flow discharge, and channel slope were usually analyzed separately, the present work provides an integrated experimental assessment of their combined influence on longitudinal deposition thickness and water stage. The dataset links deposition patterns with hydraulic and sediment-transport indices, such as Shields and Rouse numbers, and clarifies how variations in flow energy and sediment supply are translated into measurable changes in deposition thickness and flow depth. By explicitly quantifying the relationship between the relative deposition thickness hd/h and discharge overestimation, this study connects sediment-transport processes with rating-curve performance and flow-measurement practice in irrigation channels. These contributions extend previous research, which rarely considered the three control factors jointly or evaluated their implications for stage–discharge estimation in a controlled experimental setting.
2. Materials and Methods
2.1. Experimental Setup
The experiments were carried out in a 30 m long, 0.60 m wide, and 0.80 m high rectangular glass flume constructed for this study at the Hydraulics Laboratory of Shihezi University. The flume was manufactured by Beijing Sinfotek Technology Co., Ltd. (Beijing, China). The general layout of the flume, including the adjustable-slope frame, sediment-feeding apparatus, and longitudinal measurement sections, follows standard practice in laboratory open-channel studies, whereas the specific combination of operating conditions and instrumentation was designed to meet the objectives of this study (Figure 1).
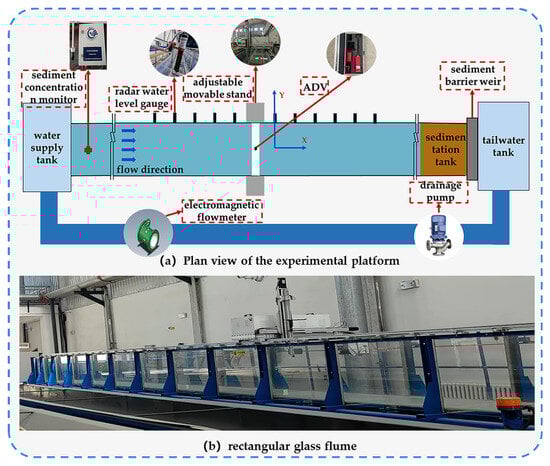
Figure 1.
Experimental setup for sediment-laden flow tests in a rectangular glass flume: (a) plan view of the experimental platform; (b) photograph of the rectangular glass flume. In panel (a), X denotes the streamwise direction (along the flow direction), and Y denotes the transverse direction (across the channel width).
2.2. Experimental Conditions and Design
To simulate typical sediment-laden flow conditions in irrigation channels, combinations of four discharges (15, 25, 35, and 45 L/s), four bed slopes (0.0005, 0.001, 0.0015, and 0.002), and four sediment concentrations (4, 8, 12, and 16 kg/m3) were designed, resulting in a total of 64 sediment-laden test conditions. In addition, clear-water control experiments covering discharges from 15 to 45 L/s were performed under a slope of 0.001, yielding 68 test groups in total.
Prior to each run, a pre-flushing procedure was conducted to stabilize the bed and flow conditions. The tailgate and discharge controller were adjusted to keep free-surface fluctuations within ±2 mm. Sediment was then added to the supply tank and mixed thoroughly to obtain a uniform inflow concentration. In Figure 2, Figure 3 and Figure 4, longitudinal and stage-related profiles are shown as discrete measurement points (symbols), and neighboring points are connected by straight line segments for visual clarity; no analytical curve fitting was applied. During each run, a radar level sensor and an electromagnetic flowmeter were used to continuously record the water stage (h) and discharge (Qd). A run time of 60 min was selected to allow substantial deposition while maintaining feasible experimental throughput; thus, the measured deposition patterns represent a late-stage, quasi-steady configuration rather than a fully developed morphodynamic equilibrium. After each run, the flow was stopped, the flume was drained, and the deposition thickness (hd) was surveyed along the flume using a steel ruler. Before the formal experiments, the radar stage sensor and the electromagnetic flowmeter were calibrated against manual ruler readings and volumetric tank measurements. Based on the manufacturer specifications and the calibration tests, the stage-measurement accuracy is better than ±1 mm, and the accuracy of discharge measurements is better than ±2%. For each hydraulic condition, repeated readings were taken to confirm that the stage and discharge fluctuations remained within ±2 mm and ±2%, respectively. The sediment feeder was adjusted and tested so that the prescribed sediment concentration was maintained within approximately ±3% of the target value. Due to limitations in water supply and experimental time, only one run was conducted for each combination of discharge, slope, and sediment concentration; therefore, the reported values of hd, h, and εQ correspond to single realizations under controlled laboratory conditions. Long-term cyclic processes (e.g., seasonal flood events, repeated flushing, and progressive consolidation of the deposited layer) were not addressed in this experimental design.
2.3. Hydraulic and Sediment Transport Parameters
To elucidate the dynamic mechanisms governing sediment deposition, several key hydraulic and sediment transport parameters were computed under each experimental condition, including cross-sectional mean velocity, bed shear stress, friction velocity, dimensionless transport indices, and settling flux.
2.3.1. Basic Hydraulic Parameters
For a rectangular cross-section, the cross-sectional mean velocity () was determined using the effective flow depth (heff) as:
where Qd is the discharge, B is the channel width, and heff is the effective flow depth (heff); h denotes the measured water stage and hd denotes the local deposition thickness.
The bed shear stress (τb) was calculated by:
where ρ is the water density, g is gravitational acceleration, R is the hydraulic radius, and S is the bed slope.
The friction velocity (u∗) was derived from the shear stress as:
representing the near-bed turbulence intensity and particle entrainment capacity. These hydraulic parameters follow standard definitions in open-channel hydraulics and have been widely used in laboratory flume studies [26,27,28,29,30].
2.3.2. Dimensionless Sediment Transport Indices
The Shields number (θ50) and Rouse number (R50) were introduced to evaluate the sediment transport and suspension potential:
where ρs is the sediment density (2650 kg/m3), d50 is the median particle diameter (118.2 μm in this study), κ is the von Kármán constant (0.41), and ws is the effective settling velocity. The sediment used in all tests consisted of non-cohesive, silica-based particles with a unimodal grain-size distribution spanning fine silt to very fine sand; detailed grain-size statistics (D10, D25, D50, D75, D90, D97 and σg) are summarized in Section 2.3.4 and Table 1. The Shields number reflects the incipient motion condition of bed particles, whereas the Rouse number characterizes the vertical suspension capacity.

Table 1.
Basic grain-size statistics of the experimental sediment.
2.3.3. Settling and Deposition Parameters
The settling velocity (ws) was not measured directly and is treated as an effective estimate. The Rouse number R50 was computed from Equation (5) using ws and the measured friction velocity u∗ for each condition. Here, ws represents an estimated settling velocity derived from the measured grain-size statistics of the sediment (Table 1) using a standard settling-velocity formulation under clear-water properties. Because ws was not measured in situ and may be influenced by turbulence and concentration effects, it is interpreted as an effective (apparent) settling velocity for forming R50 rather than as an independently measured parameter. In the present study, D50 was used as the representative grain size for estimating ws. Accordingly, ws should be interpreted as a model-derived effective settling velocity rather than an independent measurement. Within the tested range of flows and concentrations, ws varied only weakly, with an average value of about 1.0 × 10⁻² m/s. The sediment settling flux (Js) was computed as:
where Cm is the sediment mass concentration, representing the rate of particle deposition relative to sediment supply strength.
2.3.4. Sediment Type and Grain-Size Distribution
The sediment used in all experiments consisted of non-cohesive, silica-based particles. The grain-size distribution of the test material was measured using a laser diffraction particle size analyzer (volume-based output). The median grain size was D50 = 118.2 μm, with volume-based percentiles D10 = 7.3 μm, D25 = 57.1 μm, D75 = 179.4 μm, D90 = 242.9 μm, and D97 = 306.8 μm. The volume-weighted mean diameters were D(3,2) = 18.3 μm and D(4,3) = 124.4 μm, and the span of the distribution was 2.0. To quantify sediment sorting, the geometric standard deviation (sorting coefficient) was computed as σg = √(D84/D16), where D16 = 29.6 μm and D84 = 212.8 μm were obtained from the percentile table of the laser-diffraction report, yielding σg = 2.7. These grain-size statistics are summarized in Table 1. In the subsequent analysis, D50 (denoted as d50 in Equations (4) and (5)) is adopted as a representative grain size for computing dimensionless indices such as the Shields and Rouse numbers, while the full grain-size distribution is retained to verify the validity of this simplification for the present sediment.
3. Results and Analysis
Before presenting the deposition patterns, it is useful to outline the typical measurement uncertainties. The longitudinal deposition thickness hd was read with a steel ruler whose smallest division was 1 mm; repeated readings at fixed points indicated an uncertainty of approximately ±1 mm. For hd values between 1 and 3 cm, this corresponds to a relative uncertainty of about 3–10%. Combined with the ±1 mm uncertainty in measured water stage h, the relative uncertainty of the ratio hd/h is generally within 3–10% and is dominated by the uncertainty of hd. The discharge measurements have an accuracy better than ±2%, so the propagated uncertainty in the discharge error εQ is typically within 3–10%, depending on the local value of hd/h. The trend analyses in Section 3.1, Section 3.2 and Section 3.3 therefore focus on systematic variations that are significantly larger than these uncertainty bounds.
3.1. Deposition Response Characteristics Under Single-Factor Conditions
3.1.1. Deposition Characteristics Under Varying Sediment Concentrations
Under the condition of Qd = 25 L/s and S = 0.001, the longitudinal distribution of sediment deposition thickness (hd) exhibited a monotonic decrease along the channel (Figure 2a). At x = 1 m, the corresponding hd values for sediment concentrations of 4, 8, 12, and 16 kg/m3 were 1.52, 2.20, 2.68, and 2.95 cm, respectively, indicating that higher concentration substantially increased the initial deposition near the inlet. As shown in Figure 2b, the difference in deposition thickness (Δhd) between concentrations was most pronounced at the upstream section and gradually converged downstream, suggesting that the influence of concentration on deposition was mainly concentrated near the inlet region.

Figure 2.
Longitudinal distribution of sediment deposition thickness hd for different sediment concentrations at Qd = 25 L/s and S = 0.001 (a), and corresponding differences in deposition thickness Δhd between concentrations along the channel (b).
This “initial enhancement–downstream convergence” pattern can be interpreted in terms of hydrodynamic and sedimentation parameters (Table 2). The mean velocity () ranged from 0.276 to 0.310 m/s, while the bed shear stress (τb) varied slightly between 1.319 and 1.481 Pa. The friction velocity (u∗) remained nearly constant at 0.0363–0.0385 m/s, implying comparable near-bed hydraulic conditions among concentrations. Consequently, the settling velocity (ws) was treated as approximately constant across concentrations, with a representative value of 1.01 × 10⁻² m/s. The settling flux (Js) increased almost linearly with sediment concentration: for C = 4, 8, 12, and 16 kg/m3, Js values were 0.0402, 0.0805, 0.1207, and 0.1610 kg·m−2·s−1, respectively. Because the imposed sediment concentration was maintained within ±3% of the target value during each run, Js can be treated as approximately constant for a given concentration level; therefore, the longitudinal attenuation of hd was primarily controlled by sediment transport and resuspension rather than by changes in ws.
Table 2.
Hydrodynamic and sediment-transport parameters and settling flux under different sediment concentrations (Qd = 25 L/s, S = 0.001).
In addition, the Shields number (θ50) decreased from 0.774 to 0.689 as the concentration increased, whereas the Rouse number (R50) increased from 0.637 to 0.675, indicating a slightly stronger settling tendency (i.e., weaker suspension) at higher concentrations; which is consistent with the faster downstream convergence of deposition-thickness differences.
3.1.2. Deposition Characteristics Under Varying Bed Slopes
For identical discharge and concentration, the sediment deposition thickness decreased with increasing slope and showed a monotonic downstream attenuation (Figure 3a). At x = 1 m, hd values for S = 0.0005, 0.001, 0.0015, and 0.002 were 2.74, 2.20, 1.94, and 1.78 cm, respectively. The difference in deposition thickness caused by a slope increment of ΔS = 0.0005 was most evident at the upstream section (−0.54, −0.26, and −0.16 cm) and rapidly diminished downstream, converging to less than −0.04 cm at x = 15 m (Figure 3b). This indicates that the suppressing effect of slope on deposition weakened along the flow direction, following a “significant upstream difference–downstream convergence” pattern.

Figure 3.
Longitudinal distribution of sediment deposition thickness hd for different bed slopes at Qd = 25 L/s and C = 8 kg/m3 (a), and differences in deposition thickness Δhd caused by a slope increment of ΔS = 0.0005 along the channel (b).
According to Table 3, as the slope increased from 0.0005 to 0.002, near-bed forces and sediment transport capacity were markedly enhanced. The mean velocity rose from 0.274 to 0.320 m/s, τb from 0.745 to 2.559 Pa, and u∗ from 0.0273 to 0.0506 m/s. The Shields number increased from 0.389 to 1.338, while the Rouse number decreased from 0.899 to 0.485. The settling velocity (ws) was treated as approximately constant, with a representative value of 1.01 × 10⁻² m/s; therefore, the settling flux (Js) remained approximately 0.0805 kg·m−2·s−1 for C = 8 kg/m3 across the tested slopes. Thus, the slope effect did not alter the settling process itself but instead reduced deposition through enhanced bed shear stress and friction velocity, which promoted particle entrainment and resuspension.
Table 3.
Key Hydraulic and Sediment Transport Parameters and Settling Flux under Different Slopes (Qd = 25 L/s, C = 8 kg/m3).
3.1.3. Deposition Characteristics Under Varying Discharges
At constant sediment concentration and slope, the deposition thickness decreased with increasing discharge and displayed a monotonic attenuation downstream (Figure 4a). At x = 1 m, hd values corresponding to Qd = 15, 25, 35, and 45 L/s were 2.48, 2.20, 2.03, and 1.92 cm, respectively. The thickness differences (Δhd) induced by a 10 L/s increment were −0.28, −0.17, and −0.11 cm at x = 1 m, but declined to −0.06, −0.04, and −0.03 cm at x = 15 m, indicating that the marginal effect of discharge weakened downstream.

Figure 4.
Longitudinal distribution of sediment deposition thickness hd for different discharges at S = 0.001 and C = 8 kg/m3 (a), and differences in deposition thickness Δhd induced by a 10 L/s increase in discharge along the channel (b).
As summarized in Table 4, increasing discharge from 15 to 45 L/s simultaneously strengthened near-bed hydrodynamics and sediment transport capacity. The mean velocity increased from 0.202 to 0.419 m/s, τb from 1.216 to 1.758 Pa, and u∗ from 0.0349 to 0.0419 m/s. Correspondingly, θ50 rose from 0.636 to 0.919, while R50 decreased from 0.704 to 0.585. The settling velocity (ws) was treated as approximately constant at 1.01 × 10⁻² m/s, and Js remained approximately 0.0805 kg·m−2·s−1 for C = 8 kg/m3 across the tested discharges. Therefore, the discharge effect primarily acted through enhanced bed shear stress and turbulence intensity, reducing net deposition without changing the settling flux.
Table 4.
Key Hydraulic and Sediment Transport Parameters and Settling Flux under Different Flow Rates (S = 0.001, C = 8 kg/m3).
3.2. Deposition Distribution Characteristics Under the Combined Effects of Three Factors
The individual effects of sediment concentration, slope, and discharge revealed that concentration predominantly determines the supply of suspended particles, whereas slope and discharge jointly regulate the hydrodynamic capacity for entrainment and transport. The three-dimensional response surface (Figure 5) illustrates a nonlinear coupling behavior characterized by a “concentration-dominated and hydraulically regulated” mechanism. At the interaction level, concentration and slope exhibited an antagonistic relationship of “increased sediment supply–enhanced scouring suppression”, while concentration and discharge showed a competition between “deposition intensification–erosion enhancement”. The interaction between slope and discharge was significant at low slopes but weakened under steep-slope conditions. Overall, the visual sensitivity analysis implied by the response surface provides a qualitative indication that once concentration is fixed, variations in slope produce slightly stronger changes in hd than comparable variations in discharge, especially at mild slopes. We performed a response-surface regression with interaction terms and reported the corresponding ANOVA results (model F-value, p-value, and R2 statistics). These additions quantify the relative and interacting effects of C, Qd, and S on hd and are provided in Section 3.2. For example, near the inlet at x = 1 m and C = 8 kg/m3, increasing the bed slope from 0.0005 to 0.002 reduced the hd from 2.74 cm to 1.78 cm (a decrease of about 35%), whereas increasing the discharge from 15 L/s to 45 L/s at S = 0.001 reduced the hd from 2.48 cm to 1.92 cm (about 23%), illustrating the relatively stronger influence of slope within the tested range.
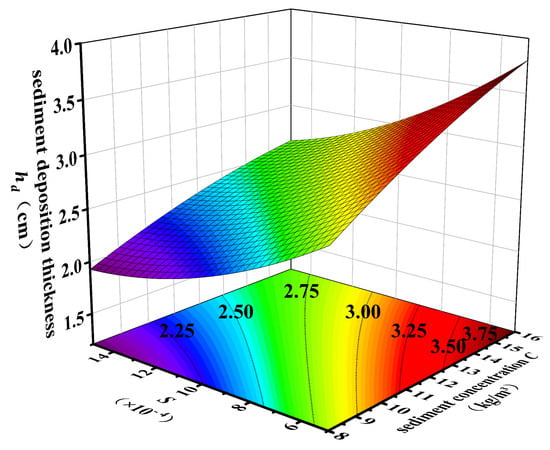
Figure 5.
Three-dimensional response surface of reach-averaged deposition thickness as a function of bed slope S and sediment concentration C (at a representative discharge, Qd held constant in the visualization).
Overall, the response surface indicates that the maximum deposition occurred under low-discharge, small-slope, and high-concentration conditions, while the minimum thickness (<1 cm) appeared under high-discharge, large-slope, and low-concentration conditions. The settling flux (Js) was primarily controlled by concentration and remained nearly invariant with slope and discharge, confirming that concentration dictates the sediment supply, whereas hydrodynamic parameters govern resuspension and downstream transport.
To quantify the coupled effects among bed slope (S, factor A), sediment concentration (C, factor B), and discharge (Qd, factor D) implied by the response surfaces in Figure 5, a second-order response-surface model was fitted using the reach-averaged deposition thickness as the response variable (Y = ). The overall model was highly significant (F = 1482.66, p < 0.0001). All three main effects were significant (F = 6021.51 for S; F = 4583.91 for C; F = 2043.13 for Qd; all p < 0.0001). The two-way interactions were also significant (S × C: F = 97.55, p < 0.0001; S × Qd: F = 43.35, p = 0.0003; C × Qd: F = 33.19, p = 0.0007). Quadratic terms were also significant (S2: F = 360.99; C2: F = 68.95; Qd2: F = 94.30; all p < 0.0001). The model showed excellent predictive performance (R2 = 0.9995, adjusted R2 = 0.9988, predicted R2 = 0.9916) and a high signal-to-noise ratio (Adeq Precision = 133.96).
3.3. Sediment Deposition–Stage Relationship and Discharge-Estimation Error
Sediment deposition modifies the cross-sectional geometry and flow conveyance by reducing the effective flow depth and wetted area, which increases the measured water stage. As shown in Figure 6, under S = 0.001, the water stage increased monotonically with sediment concentration. For Qd = 15 L/s, the water stage rose from 0.145 m to 0.152 m (a 4.83% increase); for Qd = 25 L/s, from 0.166 m to 0.172 m (3.62% increase). At higher discharges (35 and 45 L/s), the baseline levels increased to 0.179–0.185 m and 0.196–0.201 m, respectively, but the relative increase remained around 3–4%, indicating that concentration primarily controlled the rise of water stage, while discharge determined the baseline elevation. The effective flow depth decreased notably with increasing deposition; for example, at Qd = 15 L/s, the inlet effective depth decreased from 0.130 m at C = 4 kg/m3 to 0.117 m at C = 16 kg/m3 (a 10.3% reduction), demonstrating that deposition reduces the conveyance capacity by narrowing the effective cross-section.
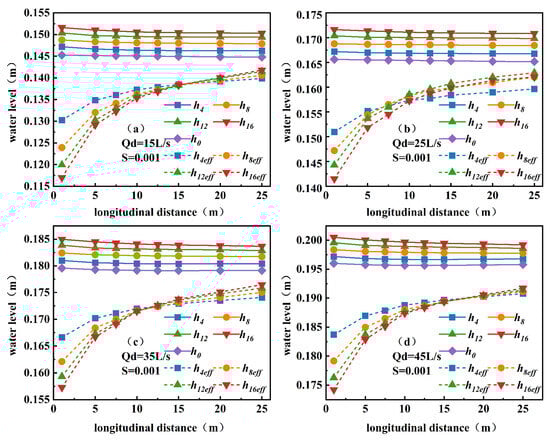
Figure 6.
Longitudinal variations of measured water stage h and effective flow depth heff under different sediment concentrations (C = 0, 4, 8, 12, and 16 kg/m3) at S = 0.001. Panels (a–d) correspond to Qd = 15, 25, 35, and 45 L/s, respectively. Solid lines denote h, and dashed lines denote heff.
Deposition not only elevated the total water stage but also affected the accuracy of radar-based stage–discharge measurements. Such instruments typically estimate discharge using measured stage (h) and an established rating curve or Manning equation. When a deposited layer of thickness (hd) is present, the effective flow depth can be expressed as:
In Equations (7) and (8), h denotes the measured water stage and hd denotes the local deposition thickness, both measured at x = 5 m where the radar sensor was installed. If the rating curve is not adjusted to account for hd, the discharge will be systematically overestimated, causing an upward bias in the measured stage–discharge relationship (Figure 7).
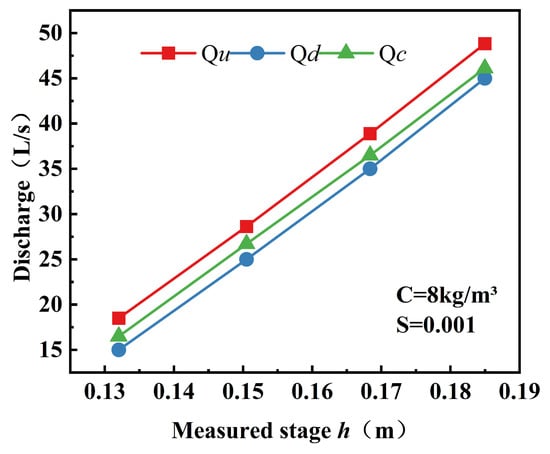
Figure 7.
Comparison of stage-based discharge estimates with the reference discharge (Qd) measured by the electromagnetic flowmeter, with and without water-level correction (C = 8 kg/m3, S = 0.001). Qu denotes the uncorrected discharge estimated from the stage–discharge relation using h, and Qc denotes the corrected discharge estimated using the effective depth heff.
For a rectangular cross-section, the relative discharge overestimation can be expressed as:
where Qu denotes the discharge estimated from the measured stage h using the uncorrected cross-section (i.e., deposition ignored), and Qc denotes the discharge estimated using the effective depth heff = h−hd. A and R are the wetted area and hydraulic radius, respectively. Across the present experiments, sediment concentrations of 4–16 kg/m3 produced deposition thicknesses of 0.81–2.67 cm. At the radar section (x = 5 m), these conditions increased the measured water stage relative to the corresponding clear-water stage by 0.002–0.004 m; representative cases are summarized in Table 5. The corresponding discharge overestimation ranged from 8.03% to 31.40% at x = 5 m, decreasing to 8.99–14.66% at x = 15 m as deposition thinned. Under high-discharge (45 L/s) and steep-slope (0.002) conditions, the error reduced further to 4.94–6.90%. Overall, uncorrected rating curves caused systematic overestimation of 4.94–31.40% under sediment-laden conditions, with the magnitude positively correlated with the relative thickness ratio (hd/h). Therefore, dynamic correction of rating curves or the substitution of effective depth (heff) is essential to maintain measurement accuracy in sediment-laden flows.
Table 5.
Comparison of water-level correction, deposition thickness, and discharge overestimation at different longitudinal locations under representative test conditions.
The overall results indicate that without cross-sectional correction, the radar-based stage–discharge meter systematically overestimates discharge under sediment-laden conditions. For the present rectangular flume and within the tested range, cases with hd/h below approximately 10% produced εQ values smaller than about 15%, whereas cases with hd/h above 10% yielded εQ values exceeding 15%. Across the dataset, εQ increased approximately linearly with hd/h as the deposited layer thickened. In this study, the radar meter exhibited a systematic overestimation of approximately 4.94–31.40% under sediment-laden conditions without cross-sectional correction. For canals with similar geometry and operating conditions, hd/h > 10% can be used as a tentative warning indicator of rating-curve distortion. Once this level is exceeded, correction based on measured or estimated hd (or using heff = h − hd) is recommended. However, the exact threshold is expected to depend on channel cross-section, roughness, and flow regime, and should be recalibrated when applying the method to other systems. It should be emphasized that the error estimates reported here were derived using the Manning equation assuming steady, quasi-uniform open-channel flow and a constant roughness coefficient for each run. The discharge overestimation εQ reported in this study was computed using the Manning-based procedure with a constant roughness for each test, so the uncertainty of εQ mainly originates from measurement uncertainties in stage (h), deposited thickness (hd), and slope (S), rather than from resistance variability. For the Manning formulation Q∝AR2/3S1/2, a first-order error propagation gives:
where A and R are functions of the effective flow depth heff = h−hd for the rectangular cross-section. Given the consistent instruments and protocols across runs, the relative uncertainty in εQ is expected to be smaller than the observed εQ range (on the order of 10–30% in the most depositional cases). Because replicate runs were not performed for each condition, run-to-run variability could not be quantified; thus, the uncertainty estimate should be interpreted as an instrument-based bound rather than a statistical confidence interval.
With roughness held constant, εQ primarily reflects the geometric contraction of the effective cross-section caused by deposition. Potential contributions from changes in energy slope and effective roughness could not be isolated from the present data. In real channels with pronounced local bed forms, spatially varying roughness, or unsteady flows, additional biases may arise due to changes in energy slope and roughness, so that the actual discharge error can differ from the values reported here. Real irrigation canals may contain debris such as aquatic weeds, plant residues, plastic fragments, organic matter, or twigs. Such materials can locally obstruct the cross-section, modify near-surface turbulence, and introduce additional resistance that is not represented in the present controlled experiments. In practice, routine debris removal and site-specific calibration of stage–discharge relations are recommended, especially during high-sediment seasons when both deposition and debris occurrence can be frequent. The present results therefore provide a lower-bound estimate of the error associated with geometric changes alone, which can be complemented by site-specific assessments of roughness variation in engineering applications. Representative post-run photographs of the bed surface at x = 2, 8, and 15 m are provided in Figure 8. The downstream evolution of the depositional morphology is consistent with the longitudinal trend in hd measurements.
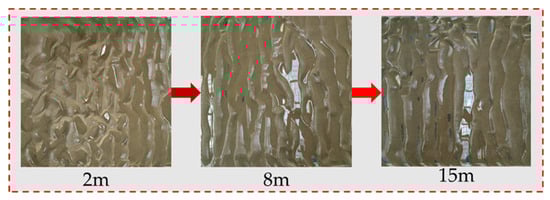
Figure 8.
Photographs illustrating upstream-dominant deposition and downstream reduction at x = 2, 8, and 15 m (Qd = 25 L/s, S = 0.001, C = 12 kg/m3). Red arrows indicate the downstream direction.
4. Discussion
The experimental findings provide new insights into how sediment deposition modifies the hydraulic characteristics and stage–discharge relationship in irrigation channels. The results demonstrated that sediment concentration is the dominant control factor of deposition thickness, while slope and discharge play secondary but compensating roles through hydraulic regulation. This “concentration-dominated–hydraulically regulated” mechanism is consistent with previous observations in sediment-laden open-channel flows, where sediment supply governs the magnitude of bed aggradation, and flow energy determines its spatial extent [31,32]. The pattern of “initial enhancement–downstream convergence” observed in this study further validates the upstream dominance of sediment accumulation reported by emphasizing the importance of sediment availability and local turbulence intensity in shaping longitudinal deposition profiles. Previous laboratory and field investigations have typically examined either longitudinal patterns of bed aggradation [33,34,35] or the distortion of rating curves in morphodynamically active rivers [35,36] in isolation, and have rarely combined detailed deposition mapping with a direct quantification of discharge error in a single, internally consistent dataset. In contrast, the present experiments link multi-factor longitudinal measurements of deposition thickness to stage–discharge overestimation, thereby providing an integrated, process-based framework that clarifies how a concentration-dominated, hydraulically regulated mechanism translates into rating-curve bias in irrigation channels.
In relation to previous studies on sedimentation in irrigation canals and rivers, the present experiments provide three main advances. First, the combined influences of sediment concentration, discharge, and bed slope on longitudinal deposition thickness are quantified in a single, internally consistent dataset, which allows the nonlinear interaction among these factors to be evaluated, rather than treating them in isolation. Second, the analysis explicitly links deposition patterns to dimensionless indices that are widely used in sediment-transport studies, thereby offering a process-based interpretation that can be compared with other laboratory and field results. Third, by relating the relative deposition thickness hd/h to discharge overestimation, the study translates morphodynamic changes into concrete implications for rating-curve calibration and flow measurement in irrigation channels. These advances complement earlier work that mainly focused on either sediment transport capacity or rating-curve uncertainty, but rarely considered the feedback between them.
Although the experiments were conducted in an idealized straight rectangular flume with a uniform sand bed and hydraulically smooth walls, the main response patterns identified in this study have broader relevance for natural irrigation canals. Many lined and unlined canals operate within similar ranges of flow depth, Froude number, and fine-sediment size, so that the dominance of sediment concentration, the compensating roles of slope and discharge, and the dependence of discharge overestimation on hd/h are expected to remain valid. Nevertheless, the absolute values of deposition thickness and error will depend on local geometry, roughness, and sediment composition. The flume results should therefore be used as process-based benchmarks for interpreting and calibrating rating curves in field channels, rather than as direct one-to-one predictions of bed evolution at specific sites. In particular, cohesive sediments in field canals may exhibit different erosion thresholds and consolidation behavior, so that the quantitative values reported in this study should be interpreted with caution when clay-rich beds are present.
The analysis also revealed that neglecting the presence of sediment deposition introduces systematic bias in discharge estimation. Similar overestimation phenomena have been noted in radar- or ultrasonic-based stage–discharge systems when the effective cross-section is altered by sedimentation [37,38,39]. In the present study, the ratio of deposition thickness to water depth (hd/h) was found to be a key determinant of error magnitude, with εQ increasing nearly linearly with hd/h within the tested range. In this particular flume, all cases with hd/h greater than about 10% produced discharge overestimations exceeding 15%, and the bias reached up to 31.4% under high-concentration, low-discharge conditions. This empirically derived threshold should be regarded as specific to the present geometry and hydraulic regime, and used as a reference value rather than a universal constant. These results quantitatively confirm that sediment-induced geometric changes directly affect hydraulic rating accuracy, particularly in low-flow regimes where backwater and deposition effects are intensified. From an engineering perspective, these findings have significant implications for the calibration and maintenance of flow measurement systems in sediment-laden channels. Although the experiments were conducted in a smooth rectangular glass flume under controlled combinations of sediment concentration, bed slope, and discharge, the identified mechanism, characterized by upstream focused aggradation that reduces the effective flow area and shifts the stage discharge curve upward, is expected to be relevant to many lined or low roughness irrigation canals where deposition tends to concentrate in the upstream reach. Nevertheless, quantitative indicators such as the magnitude of hd/h and the associated discharge error εQ should be interpreted as site specific reference values rather than universal constants and require recalibration for channels with different cross-sectional shapes, roughness conditions, or sediment properties. The study suggests that traditional static rating curves are insufficient to represent the time-varying geometry of channels affected by sedimentation. Instead, adaptive correction strategies—such as dynamically updating the effective flow area or applying an effective water depth (heff = h − hd)—should be implemented to maintain measurement reliability. In practical applications, the use of the effective flow depth heff = h − hd does not necessarily require the continuous real-time monitoring of bed elevation. In many irrigation districts, bed profiles can be obtained from periodic cross-sectional surveys using conventional staff measurements, total stations, sonar, or drone-based photogrammetry. The present results then provide quantitative thresholds of hd/h for deciding when rating curves need to be updated and how large the expected discharge bias may be. For canals where continuous monitoring is required, occasional bed surveys combined with high-frequency water-level records can be used to recalibrate rating curves at suitable intervals. The development of robust sensors for direct, automated tracking of sediment thickness would be highly valuable, but lies beyond the scope of the present experimental study. Such approaches align with modern digital-twin irrigation systems, where real-time monitoring and model coupling are essential for precise water scheduling. Beyond immediate applications, this study highlights the need to further explore the feedback processes between sediment deposition, flow resistance, and turbulence modulation. A further limitation of the present study is that only the quasi-steady state after 60 min of continuous operation was examined for each test condition. The temporal evolution of deposition thickness and the consolidation of the deposited layer, which can modify hydraulic resistance and erosion thresholds over longer time scales, were not resolved. These aspects require dedicated long-term monitoring or numerical modeling and should be investigated in future work. Future research should incorporate high-resolution velocity field measurements or numerical modeling based on two-phase flow theory to reveal how suspended sediment influences near-bed shear stress and velocity dip phenomena. Moreover, long-term channel monitoring under natural sediment supply conditions would help validate the scaling of laboratory results to field environments and support the development of universal correction models for sediment-affected discharge estimation.
In summary, the coupling among sediment concentration, flow discharge, and bed slope governs both the spatial distribution of deposition and its hydraulic implications. Considering sediment-induced changes in cross-sectional geometry is therefore essential for improving the accuracy and stability of discharge measurements in irrigation and sediment-laden river systems.
5. Conclusions
This study systematically conducted sediment-laden flow experiments in a rectangular glass flume under various combinations of sediment concentration (4–16 kg/m3), bed slope (0.0005–0.002), and discharge (15–45 L/s), revealing the mechanism by which channel siltation thickness influences the stage–discharge relationship. The results demonstrate that sediment concentration is the dominant factor controlling deposition thickness, exhibiting a longitudinal distribution pattern of “upstream enhancement–downstream convergence”. In contrast, slope and discharge suppress deposition by enhancing bed shear stress and friction velocity, reducing upstream deposition thickness by approximately 35% and 23%, respectively. The coupling of these three factors forms a composite “concentration-dominated and hydraulically regulated” response mechanism, manifesting as the most significant deposition under combined conditions of low discharge, mild slope, and high concentration (deposition thickness/water depth > 15%), and the least deposition (<5%) under high discharge, steep slope, and low concentration conditions. Sediment deposition not only caused an overall water stage rise of approximately 3–4% but also led to systematic overestimation in discharge derived from radar-based stage measurements due to the reduced effective flow area. The overestimation error reached up to 31.40% under low-discharge and high-concentration conditions, and remained at 4.94% even under high-discharge and steep-slope scenarios. The error level was positively correlated with the relative deposition thickness (hd/h), exceeding 15% when hd/h > 10%. Therefore, to ensure accurate discharge measurement in sediment-laden environments, it is essential to dynamically calibrate the rating curve based on the actual distribution of sedimentation or to use the effective water depth (heff = h − hd) for calculation, thereby supporting the need for precise water measurement and intelligent irrigation scheduling in canal systems.
Author Contributions
Conceptualization, J.J.; methodology, L.N. and J.J.; software, L.N.; validation, L.N., J.J. and Y.M.; formal analysis, L.N.; investigation, L.N., X.L. and Z.W.; resources, J.J.; data curation, L.N.; writing—original draft preparation, L.N.; writing—review and editing, J.J., Y.M., X.L. and Z.W.; visualization, L.N.; supervision, J.J.; project administration, J.J.; funding acquisition, J.J. All authors have read and agreed to the published version of the manuscript.
Funding
This work was supported by the following funding programs: (1) The Xinjiang “Tianshan Talents” Youth Science and Technology Innovation Program (Project No. 2024TSYCCX0111); (2) The Key Science and Technology Program for Tackling Critical Problems in Priority Areas of the Xinjiang Production and Construction Corps (Project No. 2023AB060); (3) The Talent Development Program of the 8th Division of XPCC and Shihezi City (Project No. 2025SF02); (4) The Youth Doctoral Program of Xinjiang Uyghur Autonomous Region ‘Tianchi Elite’ Introduction Plan (Project No. CZ002353); (5) The High Level Talent Research Launch Project of Shihezi University (Project No. RCZK202402).
Institutional Review Board Statement
Not applicable.
Informed Consent Statement
Not applicable.
Data Availability Statement
The experimental data that support the findings of this study (including velocity profiles, hydraulic conditions, and derived model parameters) are available from the corresponding author upon reasonable request. Any restrictions related to data sharing, if applicable, are described in the manuscript.
Conflicts of Interest
The authors declare no conflicts of interest.
References
- Abdellatif, G.; Gaafar, I.; Van Der Vat, M.; Hellegers, P.; El-Naggar, H.E.D.; de Miguel Garcia, A.; Seijger, C. Impact of irrigation modernization and high Aswan Dam inflow on Nile water system efficiency and water reuse in Egypt. Agric. Water Manag. 2025, 316, 109576. [Google Scholar] [CrossRef]
- Chauhan, M.K.; Ram, S. Rehabilitation of canal irrigation schemes in India: A qualitative analysis. Water Policy 2023, 25, 59–68. [Google Scholar] [CrossRef]
- Arifjanov, A.; Samiyev, L.; Xoshimov, S.; Shaymardanov, S.; Tadjiboyev, S. Transport capacity of flow in earthline channels. E3S Web Conf. 2023, 401, 01020. [Google Scholar] [CrossRef]
- Alemi, M.; Pêgo, J.P.; Okhravi, S.; Maia, R. Numerical Analysis of Flow Structure Evolution during Scour Hole Development: A Case Study of a Pile-Supported Pier with Partially Buried Pile Cap. Modelling 2024, 5, 884–900. [Google Scholar] [CrossRef]
- Reitan, T.; Petersen-Øverleir, A. Dynamic rating curve assessment in unstable rivers using Ornstein-Uhlenbeck processes. Water Resour. Res. 2011, 47, W02524. [Google Scholar] [CrossRef]
- Peng, H.; Fok, H.S.; Gong, J.; Wang, L. Improving Stage–Discharge Relation in The Mekong River Estuary by Remotely Sensed Long-Period Ocean Tides. Remote Sens. 2020, 12, 3648. [Google Scholar] [CrossRef]
- Fu, S.H.; Zhou, M.L.; Xu, W.L.; Wei, W.R.; Wang, G.G. Local hydraulic jump effects on sediment deposition in open-channel flume experiments. J. Hydrodyn. 2023, 35, 268–277. [Google Scholar] [CrossRef]
- Elmilady, H.M.S.M.A.; Van Der Wegen, M.; Roelvink, D.; Van Der Spek, A. Modeling the Morphodynamic Response of Estuarine Intertidal Shoals to Sea-Level Rise. J. Geophys. Res. Earth Surf. 2022, 127, e2021JF006152. [Google Scholar] [CrossRef]
- Trevisson, M.; Eiff, O. Fine-Sediment Erosion and Sediment-Ribbon Morphodynamics in Coarse-Grained Immobile Beds. Water Resour. Res. 2022, 58, e2021WR031837. [Google Scholar] [CrossRef]
- Ma, L.; Sui, L. Analysis of Sediment Distribution in a Typical Irrigation District Along the Lower Yellow River. Appl. Mech. Mater. 2012, 212–213, 78–82. [Google Scholar] [CrossRef]
- Gui, Z.; Shan, Y.; Li, C.; Sun, S.; Liu, C. Turbulence and sediment deposition in a channel with floating vegetation. J. Hydrol. 2024, 641, 131829. [Google Scholar] [CrossRef]
- Shi, H.; Wang, Y.; Chen, F.; Zhang, Y.; Meng, T. Study on a differential pressure microflow sensor on microfluidic chip. Measurement 2023, 221, 113576. [Google Scholar] [CrossRef]
- Mondal, K.; Chaudhuri, S.; Das, V.K.; Debnath, K.; Mazumder, B.S. Evolution of bed-forms due to associated wave turbulence over a sloping sand bed similar to shoaling zone of sea coast—An experimental approach. Ocean Eng. 2024, 303, 117778. [Google Scholar] [CrossRef]
- Aksoy, H.; Safari, M.J.S.; Unal, N.E.; Mohammadi, M. Velocity-based analysis of sediment incipient deposition in rigid boundary open channels. Water Sci. Technol. 2017, 76, 2535–2543. [Google Scholar] [CrossRef]
- Ibragimov, I.A.; Juraev, U.A.; Inomov, D.I. Hydromorphological dependences of the meandring riverbed forms in the lower course of the Amudarya river. IOP Conf. Ser. Earth Environ. Sci. 2022, 949, 012090. [Google Scholar] [CrossRef]
- Liu, L.; Luo, W.; Zhang, L.; Ming, B.; Li, M.; Jiang, J. Analysis of the evolution pattern and causes of downstream gigantic hydraulic projects. J. Water Clim. Change 2022, 13, 1936–1950. [Google Scholar] [CrossRef]
- Garcia-Estève, C.; Caniven, Y.; Cattin, R.; Dominguez, S.; Sylvain, R. Morphotectonic Evolution of an Alluvial Fan: Results of a Joint Analog and Numerical Modeling Approach. Geosciences 2021, 11, 412. [Google Scholar] [CrossRef]
- Pasch, S.; Leister, R.; Gatti, D.; Örlü, R.; Frohnapfel, B.; Kriegseis, J. Measurements in a Turbulent Channel Flow by Means of an LDV Profile Sensor. Flow Turbul. Combust. 2024, 113, 195–213. [Google Scholar] [CrossRef]
- Biegowski, J.; Pietrzak, M.; Radosz, I.; Kaczmarek, L.M. Modelling of Granular Sediment Transport in Steady Flow over a Mobile Sloped Bed. Water 2024, 16, 2022. [Google Scholar] [CrossRef]
- Sahu, S.N.; Hossain, S.; Sen, S.; Ghoshal, K. Sediment transport in ice-covered channel under non-equilibrium condition. Environ. Earth Sci. 2024, 83, 315. [Google Scholar] [CrossRef]
- Moradi, S.; Noshahri, A.G.; Barati, R.; Esmaili, K.; Atashi, V. Experimental study of crump weir for sediment transport and flow measurement in sediment-laden rivers. Sci. Rep. 2025, 15, 15852. [Google Scholar] [CrossRef] [PubMed]
- Sullivan, S.N.; Miller, J.R.; Huffman, C.L. Application of Chemostratigraphic Methods to Floodplain Alluvial Deposits within the Big Harris Creek Basin, North Carolina. Geosciences 2022, 12, 187. [Google Scholar] [CrossRef]
- Selim, T.; Hesham, M.; Elkiki, M. Effect of sediment transport on flow characteristics in non-prismatic compound channels. Ain Shams Eng. J. 2022, 13, 101771. [Google Scholar] [CrossRef]
- Fan, N.; Zhong, Q.; Nie, R.; Liu, X. Interaction of various-sized particles in river flow. Sci. Rep. 2023, 13, 10503. [Google Scholar] [CrossRef] [PubMed]
- Escauriaza, C.; González, C.; Williams, M.E.; Brevis, W. Models of bed-load transport across scales: Turbulence signature from grain motion to sediment flux. Stoch. Environ. Res. Risk Assess. 2023, 37, 1039–1052. [Google Scholar] [CrossRef]
- Wang, P.; Yuan, J.; Wang, M.; Wang, M. Sediment vibration characteristics based on accelerometer measurements. Sci. Rep. 2023, 13, 1205. [Google Scholar] [CrossRef] [PubMed]
- Jha, S.; Chaudhuri, S.; Bera, D.; Das, V.K.; Debnath, K.; Mazumder, B.S. Size distributions of different sediment mixtures associated with near-bed turbulence over an abruptly sloping bed. J. Hydrol. 2025, 662, 134076. [Google Scholar] [CrossRef]
- Riaz, M.Z.B.; Iqbal, U.; Zain, H.; Yang, S.Q.; Sivakumar, M.; Ji, R.; Anjum, M.N. Influence of Vertical Force on Shields’ Curve and Its Extension in Rapidly Varied Flow. Water 2024, 16, 2960. [Google Scholar] [CrossRef]
- Gulduren, S.S.; Ellingson, J.M.; Viducich, J.M.; Sharp, K.V.; Grant, G.E.; Selker, J.S. A Novel Approach to Managing Riverine Sediment Deposition in Sand Dam Reservoirs. Hydrol. Process. 2025, 39, e70287. [Google Scholar] [CrossRef]
- Kwon, S.; Passalacqua, P.; Nghiem, J.A.; Lamb, M.P. Mixing Patterns of River Deltas Obtained From Remotely Sensed Rouse Number. J. Geophys. Res.-Earth Surf. 2025, 130, e2024JF008077. [Google Scholar] [CrossRef]
- Andiese, V.W.; Oktavia, S.R.; Amaliah, T. Study of Sedimentation Rate at Irrigation Area Baluase Sigi Biromaru Regency as a Watershed Damage Identification. IOP Conf. Ser. Earth Environ. Sci. 2023, 1157, 012052. [Google Scholar] [CrossRef]
- Zhang, J.; Shang, Y.; Liu, J.; Lu, J.; Wei, S.; Wan, Z.; Luo, Q.; Chen, C.; Tong, L.; Wang, Q.; et al. Optimisation of reservoir operation mode to improve sediment transport capacity of silt-laden rivers. J. Hydrol. 2021, 594, 125951. [Google Scholar] [CrossRef]
- Gurmu, Z.A.; Ritzema, H.; de Fraiture, C.; Ayana, M. Hydrodynamic modelling to develop design and operational options for sedimentation reduction in irrigation schemes, Ethiopia. J. Hydrol.-Reg. Stud. 2024, 53, 101816. [Google Scholar] [CrossRef]
- Zhang, W.; Jia, X.; Wang, Y. Experimental Investigation of Hydraulic Characteristics for Open Channel Gates. Water 2024, 16, 3717. [Google Scholar] [CrossRef]
- van Denderen, R.P.; Schielen, R.M.; Paarlberg, A.J.; Reneerkens, M.; Augustijn, D.C. Analyzing natural bed-level dynamics to mitigate the morphological impact of river interventions. River Res. Appl. 2024, 40, 735–746. [Google Scholar] [CrossRef]
- Tunio, I.A.; Kumar, L.; Memon, S.A.; Mahessar, A.A.; Kandhir, A.W. Sediment transport dynamics during a super flood: A case study of the 2010 super flood at the Guddu Barrage on the Indus River. Int. J. Sediment Res. 2024, 39, 683–701. [Google Scholar] [CrossRef]
- Mall, N.; Gell, P.; Kattel, G.R.; Gadd, P.; Zawadzki, A. Multiproxy approach to track changes in the ecological condition of wetlands in the Gunbower Forest, a Ramsar site. Mar. Freshw. Res. 2022, 73, 1196–1211. [Google Scholar] [CrossRef]
- Xu, C.; Tian, J.; Wang, G.; Lian, H.; Wang, R.; Hu, X. Numerical Analysis of Water–Sediment Flow Fields within the Intake Structure of Pumping Station under Different Hydraulic Conditions. Water 2024, 16, 779. [Google Scholar] [CrossRef]
- Pasupuleti, L.N.; Timbadiya, P.V.; Patel, P.L. Flow fields around tandem and staggered piers on a mobile bed. Int. J. Sediment Res. 2022, 37, 737–753. [Google Scholar] [CrossRef]
Disclaimer/Publisher’s Note: The statements, opinions and data contained in all publications are solely those of the individual author(s) and contributor(s) and not of MDPI and/or the editor(s). MDPI and/or the editor(s) disclaim responsibility for any injury to people or property resulting from any ideas, methods, instructions or products referred to in the content. |
© 2025 by the authors. Licensee MDPI, Basel, Switzerland. This article is an open access article distributed under the terms and conditions of the Creative Commons Attribution (CC BY) license.