Abstract
Chronic kidney disease (CKD) is a progressive pathology characterized by gradual function loss. It is accompanied by complications including cardiovascular disorders. This study involves 4-h electrocardiographic records from the Telemetric and Holter ECG Warehouse (THEW) project database to analyze the dynamics in heart rate variability (HRV) indices of 51 patients with CKD. It proposes three algorithms to process long-term electrocardiography records: QRS complex and R-wave detection, premature ventricular contraction (PVC) identification, and tachograms. PVCs were analyzed with the consideration of the changes occurring before, during, and after hemodialysis, especially during the interdialytic period. The hour with the highest PVCs occurrence was identified and used to assess HRV fluctuations and segmented into 5 min blocks with a 0.77 min overlap, yielding a dynamic HRV vector, one for each of seven HRV indices selected to evaluate autonomic nervous system balance. R-wave and PVC identification resulted in 97.53% and 85.83% positive predictive values, respectively. PVCs’ prevalence and HRV changes’ relationship in 48 h records could relate to cardiovascular risk. The stratification of hemodialysis patients into three distinct PVC patterns (p < 0.001) identified two clinically significant high-risk subgroups: Class 1, indicative of electrical instability, and Class 3, of advanced autonomic dysfunction, demonstrating divergent arrhythmogenic mechanisms with direct implications for risk stratification.
1. Introduction
Chronic kidney disease (CKD) progresses with renal dysfunction and systemic complications, including cardiorenal syndrome (CRS), which is a bidirectional heart–kidney interaction in which mutual dysfunction drives cardiovascular risk and disrupts the autonomic nervous system (ANS) balance, which is critical for physiological regulation and adaptive capacity [1,2].
This autonomic imbalance heightens susceptibility to arrhythmias, particularly under physiological stress, creating a vicious cycle of cardiorenal deterioration [3,4,5]. It can be understood as an out-of-balance dynamic control system in which the sympathetic nervous system acts as a “stuck accelerator” and the parasympathetic nervous system functions as a “weak brake”, leading to inefficient operation and the progressive wearing of the system.
In advanced CKD (stage 5), hemodialysis—performed thrice weekly (3–5 h/session)—corrects fluid/chemical imbalances but triggers triphasic autonomic dysfunction: pre-dialysis sympathetic hyperactivity, intradialytic fluid shift-induced sympathetic surges, and post-dialysis sympathetic predominance with parasympathetic suppression [6,7,8,9]. HRV is a useful tool for assessing the activity and balance between the sympathetic and parasympathetic branches of the ANS [10].
Heart rate variability (HRV) is assessed via multidomain metrics: time-domain indices (SDNN for total variability, RMSSD for parasympathetic activity), frequency-domain ratios (LF/HF reflecting sympathetic–parasympathetic balance), and non-linear Poincaré parameters (SD1 for parasympathetic tone, SD2 for autonomic interplay), collectively quantifying ANS dynamics [11,12].
The HRV measurement duration is tailored to study either short-term (2–5 min) records that capture baseline autonomic activity under controlled conditions or long-term 24-to-48 h recordings that reveal circadian rhythms. A dynamic windowed analysis tracks transient ANS triggered via the interactions with physiological stressors [13,14].
A high HRV reflects a flexible and balanced ANS associated with better cardiovascular health, lower stress, and greater capacity for adaptation and recovery [15]. On the other hand, a reduced HRV usually indicates autonomic dysfunction, the predominance of sympathetic tone, and less adaptability, factors related to chronic stress, cardiovascular diseases, and a higher risk of complications [16].
HRV in CKD patients undergoing hemodialysis is analyzed to understand the status of the ANS and its possible relationship with cardiovascular complications [17]. Hemodialysis patients exhibit chronic autonomic imbalance (reduced HRV indices), marked by pre-dialysis sympathetic dominance (reduced RMSSD/HF, elevated LF/HF), intradialytic parasympathetic suppression (reduced SDNN), and partial post-dialysis recovery (elevated HF/RMSSD, reduced LF/HF), yet persistent dysregulation elevates arrhythmia risk fourfold during the post-session critical period [18,19,20,21].
Arrhythmias associated with hemodialysis represent one of the main causes of mortality, with a particularly high incidence of premature ventricular contractions (PVCs) observed in almost all patients [22,23]. These alterations of the normal heart rhythm not only reflect a state of electrical instability but also impact HRV indices. Patients with frequent PVCs exhibit reduced SDNN/RMSSD and elevated LF/HF ratios, reflecting heightened sympathetic dominance and parasympathetic suppression—a dysregulation that synergizes with hemodialysis-induced autonomic dysfunction to amplify arrhythmogenic risk [24].
This study aimed to characterize the 48 h dynamics of HRV indices among 51 end-stage renal disease (ESRD) patients undergoing hemodialysis, with a focus on autonomic perturbations triggered via the dialysis cycle. By analyzing HRV fluctuations before, during, and after hemodialysis—critical phases of autonomic stress—we evaluated how arrhythmogenic triggers, particularly PVCs, correlate with transient declines in HRV metrics (e.g., SDNN, RMSSD, LF/HF ratio). A novel emphasis was placed on the interdialytic period, an understudied interval at which cardiovascular vulnerability may persist due to residual autonomic instability. The work further stratified patients by PVC temporal patterns (e.g., clustered vs. uniform distributions) and identified hourly “risk windows” marked with PVC surges and HRV suppression. These findings aim to advance risk stratification frameworks by linking the arrhythmic burden to autonomic dysfunction.
2. Materials and Methods
2.1. Database and Population
The E-HOL-12-0051-016 database, developed by the Telemetric and Holter ECG Warehouse (THEW) project [25], represents a valuable tool for advanced research in electrocardiography (ECG). This database includes long-term 12-lead Holter recordings obtained continuously for 48 h, with a sampling frequency of 1000 Hz, ensuring the standards required for HRV analysis from patients at different stages of hemodialysis treatment: before, during, and after. The study, conducted between February 2009 and June 2010, included a total of 51 adult patients (≥40 years). Informed consent was obtained from all participants, ensuring ethical participation in the study. Inclusion criteria required a confirmed diagnosis of ESRD with dependence on maintenance hemodialysis while excluding individuals with non-cardiac terminal illnesses or an inability to adhere to monitoring protocols. Patients in this cohort are classified as high-risk due to their heightened susceptibility to ventricular arrhythmias, dialysis-induced electrolyte imbalances (e.g., hyperkalemia), and ANS dysfunction. These factors, compounded by the hemodynamic stress of recurrent dialysis sessions, create a pro-arrhythmic environment that significantly elevates their risk of sudden death.
Additionally, this database includes annotation files by experts, which specify the type of heartbeat detected and highlight events such as PVCs, facilitating detailed studies on arrhythmias. To access this information, generally intended for academic and scientific research, it is necessary to register on the project portal and accept the terms of use. After the approval of the application, the data are available for download following the guidelines established on the platform. This process ensures ethical and responsible handling of the information contained in the database.
2.2. QRS and R-Wave Identification
Each ECG recording is made up of 12 leads. Due to the sampling frequency, a total of 172 million samples for 48 h of data were analyzed. Each record is stored in ISHNE format. The file header is used to obtain the parameters of the sample rate, resolution, and total size of the record; then, the time vector is calculated. From the annotation file, the indices corresponding to the location of normal heartbeats (code 78 ASCII) and PVCs (code 86 ASCII) were extracted and stored.
For the processing of the recordings, an ECG lead was selected, giving priority to the one in which the R-wave of the QRS complex presents the greatest positive deflection. The chosen lead in 78.4% (40 records) of the cases was V6, and the rest was DII. The analysis was carried out in one-hour blocks, composed of 3.6 million samples and segmented into blocks of 5 min made up of 300,000 samples, with an overlap of 0.77 min. As a result, 14 blocks that cover the entire record of one hour were obtained.
The validation of the algorithm, designed to identify the R-wave in the ECG, was carried out using performance metrics such as the positive predictive value (PPV), sensitivity, and F-score (precision measure for the test). The hour with the highest heart rate from the 48 h ECG recording was selected for this validation since this period represents the greatest challenge for the algorithm due to the presence of various artifacts, especially those of mechanical origin.
For the identification of the QRS complex, the process began with a preprocessing stage, in which a bandpass filter with cut-off frequencies between 0.5 Hz and 30 Hz was applied. Next, to isolate and highlight the QRS complexes the discrete wavelet transform (DWT) was applied. In this step, the previously filtered ECG signal was broken down into multiple levels of resolution using the mother wavelet order 4 Daubechies (db4). The DWT divides the signal into two types of coefficients: approximation coefficients and detail coefficients; the latter captures the high-frequency components associated with QRS complexes. To focus specifically on these, the signal using the level 2 detail coefficients was reconstructed.
In the final stage of the algorithm, the detection of the R-wave peaks in the reconstructed signal emphasizing the QRS complexes was carried out. This process included three steps: first, an adaptive threshold was calculated based on the standard deviation of the reconstructed signal, multiplied by a factor of 0.9, which allows small peaks or residual noise to be ruled out. Next, the peaks that exceed this threshold were identified, and finally, a minimum distance between peaks of 500 samples (equivalent to 0.5 s for a sampling rate of 1000 Hz) was established, which avoids the detection of multiple peaks within the same QRS complex, thus obtaining the locations of the peaks of the R-wave.
2.3. PVC Identification
In each of the 14 blocks segmented above, the continuous wavelet transform (CWT) was applied to decompose the ECG signal into different frequency scales, thus obtaining a matrix of coefficients of 153 by 300,000. The 153 values associate the coefficients with frequency values covering a range from 0.0115 Hz to 434.12 Hz. Then, a specific frequency band (2.6–3.2 Hz) was selected, in which the PVCs were proposed to be found, through a logic mask. Subsequently, the accumulated energy in this band was calculated, adding the absolute values of the wavelet coefficients at each instant of time, which yielded an amplitude vector. For the identification of PVCs, an adaptive threshold was established, defined as 40% of the maximum value of the amplitude vector, thus allowing only the most significant events to be detected. Finally, the peaks in the energy signal (amplitude vector) were identified, considering only those that exceed the threshold, which allows for determining the temporal locations of the possible PVCs within the ECG recording.
2.4. Patterns of the Presence of PVCs
The evaluation of the dynamics of the PVCs was based on the quantification of their occurrence by one-hour intervals, using the Lown classification system as a reference. According to this criterion, arrhythmias were classified as grade 1, corresponding to isolated PVCs with less than 30 events per hour, and grade 2, associated with frequent PVCs with more than 30 events per hour. To estimate the risk related to the appearance of arrhythmias, a categorization system was used; the higher the grade, the higher the risk.
To identify patterns in the distribution of PVCs throughout the 48 h recording, a histogram, as an analysis tool, was used. This graph allows the occurrence of PVCs to be visualized in hourly intervals, which facilitates the detection of key moments in which there was an increase in the occurrence of these events. Additionally, the start and end times of hemodialysis were included in the graphical representation to evaluate possible temporal associations.
Under the hypothesis that an increase in the number of PVCs during an hourly interval could be related to a higher cardiovascular risk, the hour with the highest occurrence of PVCs identified in the histogram was selected as a period of interest for a more detailed analysis. In this specific period, the 7 HRV indices were calculated in 5 min blocks. Finally, the dynamics of both study variables (PVCs and HRV indices) as a possible instrument for a new risk stratification proposal in the described population were studied.
2.5. Tachogram
The algorithm started by obtaining the series of RR intervals from the positions of the QRS complexes in each of the 14 blocks, calculating the time difference between consecutive beats and discarding the extreme values to avoid problems at the edges of the record. A moving average was then applied with a window size of 10 samples, allowing the series to be smoothed out and a stable reference for anomaly detection to be generated. The absolute deviation of each RR interval from this average was then measured, quantifying fluctuations that may indicate the presence of ectopic beats or artifacts. To determine which values are abnormal, an adaptive threshold was established, defined as 90% of the standard deviation of the RR series, so that any heartbeat whose deviation exceeds this limit was marked as ectopic. Once these abnormal beats were identified, they were corrected via interpolation: if the ectopic beat was the first in the series, it was replaced with the next valid value; if it was the last, it was replaced with the previous one; and if it was in an intermediate position, it was interpolated using the average of the nearest neighboring values that were not ectopic.
2.6. Heart Rate Variability Indices
For the selection of HRV indices aimed at analyzing the dynamic behavior of the ANS, the indices that allowed the evaluation of both global activity and the interactions between the sympathetic and parasympathetic branches were chosen. Indices were calculated in the 5 min segments of the 14 blocks previously segmented, following the recommendations established by the Task Force of the European Society of Cardiology and the North American Society of Pacing and Electrophysiology [11]. This procedure generated a total of 672 analysis blocks for each patient in a 48 h recording period. The dynamic vector of the HRV is a proposed methodology that allows the temporal evolution of indices to be analyzed by dividing a continuous record into segments or blocks of time. It aims to capture the variability and adaptability of the ANS at different times, providing a more detailed view of its regulation.
To perform the analysis of the ANS, HRV indices from three domains were selected: temporal, frequency, and non-linear. In the time domain, the SDNN and the RMSSD were included. In the frequency domain, the Welch periodogram method was used to determine the LF (low frequency, 0.04–0.15 Hz) and HF (high frequency, 0.15–0.4 Hz) frequency bands, and the LF/HF ratio was used as an indicator of the autonomic balance between both branches of the ANS. Finally, in the nonlinear domain, the indices derived from the Poincaré analysis were also included, SD1 and SD2. The corresponding Equations (1)–(5) and clinical implications of each index are described in Table 1.

Table 1.
HRV indices. Equations, description, and clinical significance.
The data obtained from the HRV indices were organized in a 7 × 48 matrix, where each row corresponded to one of the 7 HRV indices calculated per patient, and each column represents one hour of the 48 h record. Each value in the matrix represented the hourly value of a specific index, derived from the arithmetic mean of the 14 blocks of 5 min corresponding to that hour.
2.7. Statistical Analysis
The statistical analysis to compare the groups that result from the stratification of the population (at least three groups) was performed using a one-way ANOVA to evaluate whether there were significant differences between the means or medians of the groups. To start, two fundamental assumptions were verified; first, the normality of the data in each group was evaluated using the Shapiro–Wilk test. Second, the homogeneity of variances was verified using the Levene test. Based on these results, the type of test to be applied was decided; if both assumptions were met, a one-way ANOVA was used as a parametric test (Fisher) to determine differences between the means; if any of the assumptions were not met, the Kruskal–Wallis test was chosen, a non-parametric alternative that evaluates differences between the medians.
The equations and steps detailed in Section 2.2, Section 2.3 and Section 2.5 are consolidated in Table 2. This table provides a structured overview of the key equations governing each algorithm. By centralizing these equations, Table 2 serves as a reference to clarify the interdependencies and implementation specifics of the signal processing workflows described in the preceding sections.
Table 2.
Implemented algorithms and the corresponding equations to the steps of each one. 1. QRS and R-wave identification. 2. PVCs identification. 3. Tachogram.
3. Results
For this study, the sample consisted of 21 women (mean age: 61 ± 8.9 years) and 30 men (mean age: 59 ± 13.7 years), using sex as the only classification variable.
3.1. QRS and R-Wave Identification
The algorithm identifies, on average, 108,814 beats out of a total of 110,289 labeled. This yields an average PPV value for 51 patients of 97.53 ± 0.05%. The sensitivity has an average value of 98.73 ± 1.40%. Finally, for the F-score an average value of 0.98 ± 0.01 is obtained. An example of QRS and R identification, and of the reconstructed signal are shown in Figure 1.
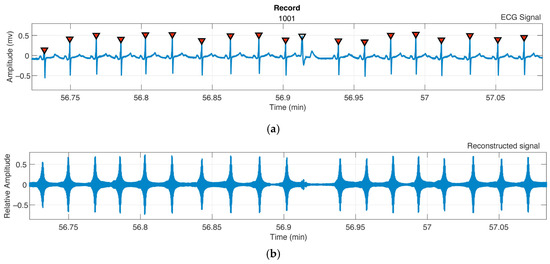
Figure 1.
Patient 1001, QRS, and R-wave algorithm identification from the ECG signal. (a) R-wave database labels (red dots), algorithm identification (black triangles). (b) Reconstructed signal after DWT using level 2 of detail coefficients and their match to QRS complexes.
3.2. PVC Identification
The prominence values of the identified peaks determined the presence of PVCs, Figure 2b; Figure 2a shows the ECG recording with the PVCs labels from the database for patient 1023.
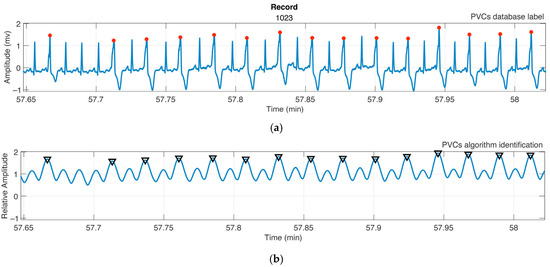
Figure 2.
Patient 1023; Graphical analysis of PVC identification with the proposed algorithm. (a) ECG signal; from the database annotation file, the PVCs (red dots) are identified. (b) The black triangle corresponds to the peak whose prominence value satisfies Equation (15) and identify a PVC. Relative amplitude corresponds to energy contributions from the PVCs-associated frequency band.
3.3. Patterns of the Presence of PVCs
The analysis of the occurrence of PVCs for the 51 patients revealed three distinct patterns. The classification into three groups grounds in methodological considerations to ensure a robust subset of 24 records with unambiguous PVCs patterns, which was analyzed to minimize noise and enhance physiological relevance; gender balance (four men/four women per group) was enforced to mitigate confounding and improve generalizability; and the analysis focused on the hour of peak PVCs activity to prioritize clinically significant arrhythmic burden.
Class 1 (Biphasic Peaks Post-Dialysis): Patients exhibited two PVC peaks separated by 6–12 h after hemodialysis, showing a delayed or biphasic physiological response. Figure 3a shows patient F1008 as an example of the identified pattern. This group is made up of patients F1001, F1008, F1017, F1020, M1014, M1022, M1023, and M1041, where F indicates female, and M is male. This group shows the highest occurrence of PVCs among the three classes analyzed, with a total of 2597 PVCs.
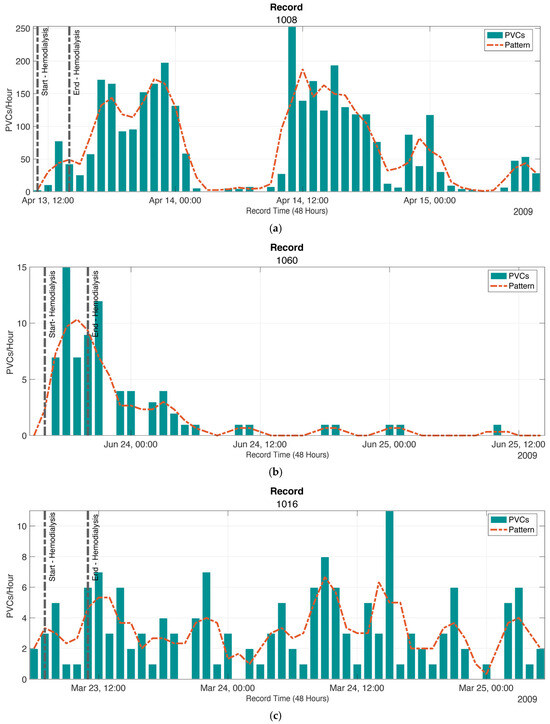
Figure 3.
The distribution and patterns of PVCs in three classes were analyzed. (a) Class 1 has the highest prevalence, with 2597 PVCs at the hour of highest occurrence. Example of the pattern proposed for Class 1 using patient F1008. (b) In Class 2, the PVCs are grouped in a single peak region, with a total of 820 PVCs at the hour of highest occurrence. Example of the pattern for Class 2 with patient F1060. (c) In Class 3, the PVCs have a lower prevalence, with 362 at the hour of highest occurrence the PVCs are distributed over the 48 h. Example of the pattern for Class 3 with patient M1016. The patterns for the three classes are described using a running average, with a window size of 4 points.
Class 2 (Acute Peak During/Post-Dialysis): A single PVC cluster during or immediately after dialysis implies acute stress from the procedure itself, such as rapid fluid shifts, transient ischemia, or sympathetic activation. Figure 3b uses patient F1060 as an example of the identified pattern. This group is composed of patients F1005, F1015, F1035, F1060, M1007, M1030, M1049, and M1051. In this class, a total of 820 PVCs were found.
Class 3 (Uniform PVC Distribution): Evenly distributed PVCs over 48 h indicate chronic arrhythmogenic factors unrelated to dialysis timing. Figure 3c uses patient M1016 as an example of the identified pattern. This group comprises patients F1013, F1028, F1029, F1044, M1002, M1016, M1018 and M1046. For this class, a total of 362 PVCs were found.
The validation of the algorithm designed to identify PVCs in the ECG records was carried out using the same performance metrics described in Section 3.1, as seen in Table 3. An average PPV value in the 24 patients of 85.83 ± 12.88% was obtained. The sensitivity obtained an average value of 80.95 ± 17.38%. Finally, for the F-score, an average value of 0.8495 ± 0.1193 was obtained.
Table 3.
Metrics to validate the PVC identification algorithm.
3.4. Tachogram
The tachogram was calculated by segmenting each hour of the recording into 5 min blocks. Figure 4 shows the artifact detection and correction process. The blue line represents the original RR interval signal, which includes anomalous variations due to artifacts. These anomalies are visible as sharp peaks (maximum or minimum values) that disrupt the regularity of the heart rhythm.
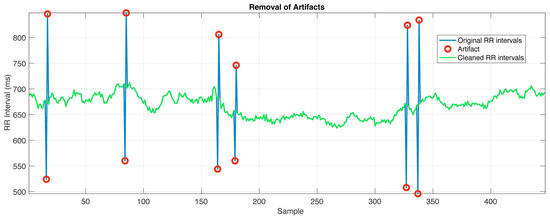
Figure 4.
Patient 1051; 5 min segment, composed of approximately 450 samples. Artifacts, which are mostly identified PVCs, are corrected by replacing them with the average of the nearest valid intervals, ensuring a continuous and physiologically plausible signal for HRV analysis.
The red circles are artifacts that correspond to RR intervals that exceed the threshold defined in the analysis based on the deviation from the moving average. The green line is the processed RR interval that represents the corrected signal, where the artifacts have been replaced with averaged values using the closest valid RR intervals. The correction restores the physiological continuity of the signal, removing the anomalous peaks while maintaining the general characteristics of the autonomic dynamics, needed to calculate the HRV indices correctly.
3.5. HRV Indices
Regarding temporal indices, Figure 5a shows the results for patient F1020 (Class 1) and describes the changes in the SDNN index (blue line) with notable variations over time, as the RMSSD index (red line) over the 48 h; marking the beginning and end of the hemodialysis session vertical dotted lines were added. Figure 5b shows the changes over the 48 h of recording for the LF/HF ratio, also for patient F1020, where the beginning and end of the hemodialysis session are vertical dotted lines. In Figure 5c, for patient F1017, changes in HRV are seen due to hemodialysis. Even though, in the interdialytic period, similar changes and decreases were observed, they were not reported extensively.
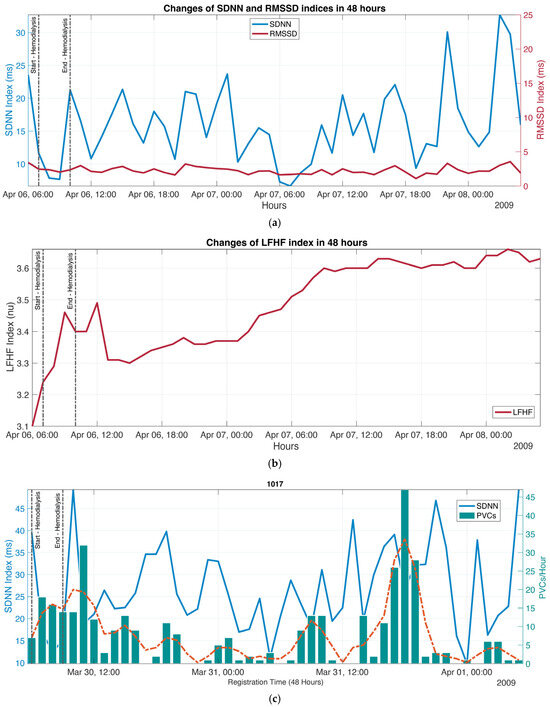
Figure 5.
Changes in HRV indices over 48 h in patient F1020. (a) In the domain of time, the blue line represents the SDNN index (left scale), and the red line represents the RMSSD index (right scale). The dotted vertical lines indicate the start and end of the hemodialysis session. More pronounced variability is seen in SDNN compared to RMSSD. (b) The red line represents the evolution of the LF/HF index over time. A progressive increase in the LF/HF index is observed. (c) Patient 1017, hourly distribution of PVCs, and changes in overall variability (SDNN index). The analysis does not show a clear pattern directly relating PVC presence with HRV.
After the three groups in Section 3.3 were established, the hypothesis that the hour with the highest number of PVCs would correspond to the period of greatest risk was taken up again, and the HRV indices calculated in blocks of 5 min were selected, considering women and men separately.
The purpose of this stage was to determine whether the stratification of patients based on the behavior of the PVCs during the 48 h of recording can be associated with a higher risk based on the decrease in HRV indices. For Classes 1, 2, and 3, a dynamic HRV vector was constructed, composed of 14 elements corresponding to the analyses carried out in blocks of 5 min with an overlap of 0.77 min. The analysis results corresponding to the group of women were concentrated in Table 4 and for men in Table 5. These dynamic vectors describe the behavior of the indices during the analyzed hour, which, in this proposal, focuses on analyzing the changes in the HRV indices in the hour with the largest number of PVCs of the 48 h record.
Table 4.
Stratification of the population for women for the three proposed classes. Calculation of the seven HRV indices proposed in 5 min blocks during the 1-h block in which more PVCs are presented.
Table 5.
Stratification of the population for men for the three proposed classes. Calculation of the seven HRV indices proposed in 5 min blocks during the 1 h block in which more PVCs are presented.
The seven HRV indices proposed can differentiate, with statistical significance, the three classes analyzed. The mean values for Class 1 are SDNN = 22.63 ms, RMSSD = 6.87 ms, LF = 421.35 ms2, HF = 91.58 ms2, LF/HF ratio = 3.52, SD1 = 4.86 ms, and SD2 = 31.56 ms.
For Class 2, the average values are SDNN = 25.72 ms, RMSSD = 5.39 ms, LF = 177.70 ms2, HF = 66.33 ms2, the LF/HF ratio = 2.68, SD1 = 3.82 ms, and SD2 = 36.13 ms.
For Class 3, the mean values are SDNN = 13.91 ms, RMSSD = 4.82 ms, LF = 175.26 ms2, HF = 70.59 ms2, LF/HF ratio = 2.54, SD1 = 3.12 ms, and SD2 = 19.32 ms.
A statistically significant difference was found among the three classes, denotating that the dynamic vectors describing the behavior of each class contribute to the characterization of the presence of PVCs for each pattern. These patterns can help stratify patients to improve their monitoring and possibly their treatment.
4. Discussion
In this database [25], four patient recordings did not reach 48 h, and several included artifact-laden segments, visually identifiable but unlabeled. Although QRS and PVC labeling was reviewed by an independent cardiologist to minimize bias, the absence of reference standards or published comparative methods limits the generalizability of the findings, emphasizing the need for future validation studies using standardized protocols.
The QRS complex identification algorithm balances decomposition, coefficient handling, and reconstruction [26]. It reconstructs ECG signals to retain only QRS-related information and, when applied in 5 min blocks, achieved a PPV value of 97.53 ± 0.05% for R-wave identification—comparable to other studies reporting 99.68% using similar techniques in different databases [26,27]. The algorithm’s structure supports adaptive thresholding and resists heart rate variations and artifacts, making it suitable for long-term ECG recordings.
The algorithm’s moderate computational complexity enables processing of a 48 h record in about 13.1 min—an acceptable time for retrospective studies. The db4 wavelet’s properties optimize spectral decomposition for QRS complex morphology. However, using only the lead with the highest R-wave amplitude, though optimal under ideal conditions, reduces its generalizability in multichannel recordings or low-amplitude signals. Since the analyzed data correspond to patients with low physical activity, motion artifacts are minimized. As shown in Figure 1b, time-frequency tools could complement this method for improved PVC identification.
PVC identification using the CWT leverages time-frequency resolution to capture non-stationary signal features. The 2.6–3.2 Hz band was selected in line with previous findings linking arrhythmias to mid-frequency components between 0 and 4 Hz [28]. This range excludes low-frequency drift and high-frequency muscle noise. A dynamic threshold (40% of the maximum amplitude vector) adjusts to signal variability, avoiding fixed threshold limitations. Energy from wavelet coefficients is transformed into a one-dimensional vector for spike analysis. Using spike prominence (Figure 2b) enhances noise resistance but does not account for morphology variability. As PVCs differ across and within patients, from broad, high-amplitude complexes to narrower, asymmetric beats, detection remains challenging. Even so, the algorithm achieved a PPV of 85.83%, which is competitive with more complex systems that report 92.47% and 93.18% using expert systems and deep learning on other databases [29,30].
The correction of artifacts in RR intervals is crucial for HRV analysis reliability. The method employed—a moving average with an amplitude threshold—offers a simple and effective solution. However, performance depends on careful parameter tuning; too low a threshold yields false positives, while too high risks omitting significant artifacts. The use of neighbor-based averaging ensures continuity but is less accurate at signals extremes. Advanced interpolation techniques could improve performance in these edge cases.
Dividing an hour into fourteen 5 min blocks for HRV analysis provides a finer resolution and aligns with Task Force recommendations [11]. This method improves the detection of intra-hour autonomic fluctuations, which are not reflected in hourly averages. It also allows the identification of critical periods needing closer attention, as suggested in earlier work [14].
Histograms of PVCs over 48 h recordings reveal that hemodialysis significantly impacts autonomic regulation and cardiac electrical stability [7,8,9]. SDNN drops during dialysis while PVCs’ occurrence increases. Post-hemodialysis, SDNN partially recovers though PVCs persist, indicating residual instability. During the interdialytic period, SDNN remains low and PVCs decrease, but late increases in PVCs signal renewed instability, as seen in the green bars and orange trendline. These findings underscore the autonomic vulnerability of this period.
Stratifying patients by PVC occurrence revealed that lower HRV often coincides with a higher number of PVCs, supporting the hypothesis that reduced HRV is a marker of electrical instability and arrhythmic risk [18,19,21]. This was especially apparent during the interdialytic period, where autonomic imbalance and insufficient heightened vulnerability to arrythmias.
The analysis of the 14 blocks (B1-B14) of HRV in the three classes for female patients reveals differences in the patterns of autonomic regulation over time. Class 1 has the highest overall variability (highest SDNN) and highest sympathetic activity (highest LF). Class 2 has lower HRV values overall, suggesting lower autonomic regulation. Class 3 shows the lowest overall variability, with lower SDNN and SD2, suggesting lower autonomic adaptation capacity. Changes in the dynamic HRV vector reveal fluctuations in SDNN and RMSSD; in Class 1, these values vary significantly between blocks, suggesting a higher dynamic autonomic response, while in Class 2 and Class 3, they are more stable but with lower values, suggesting lower flexibility of the autonomic nervous system. In the frequency domain, Class 1 shows a sympathetic predominance (elevated LF) with peaks in B3 and B9, while Classes 2 and 3 have lower LF and HF values, indicating a lower autonomic activation in general. Finally, the LF/HF ratio for Class 1 has the highest ratio, indicating a sympathetic predominance. Classes 2 and 3 present a lower and more stable ratio, which may reflect a lower autonomic activity. The differences between classes are significant (p < 0.001), indicating that HRV dynamics are different among groups. When analyzing the data from the male group, it is observed that Class 1 has significantly higher HRV values, while Class 2 and Class 3 show lower values. However, Class 3 has a lower RMSSD and HF, suggesting a greater decrease in parasympathetic tone. The differences between Class 2 and Class 3 are less marked in SDNN and LF, but RMSSD and SD1 are much lower in Class 3, indicating lower parasympathetic regulation. Again, there are significant differences in all indices among the three classes (p < 0.001).
Despite fewer PVCs, Class 3 reduced HRV may indicate a worse prognosis. Low HRV is associated with an increased risk of cardiac mortality, arrhythmias susceptibility, and adverse cardiovascular outcomes [31]. The diminished autonomic adaptability of the ANS can reduce the heart’s functional capacity to respond to physiological stress, increasing cardiovascular risk in the long term [32].
This new stratification highlights how autonomic patterns influence the electrical stability and arrhythmia risk. By correlating HRV metrics to PVCs’ occurrence, it becomes possible to understand the impact of autonomic imbalance contribution to electrical instability.
Determining which class presents the highest risk requires further analysis. If the presence of PVCs is considered the main indicator, Class 1 would be the riskiest, as a high incidence of PVCs is closely linked to a higher risk of complex arrhythmias, electrical instability, and adverse cardiovascular events. However, it is also reasonable to argue that Class 3 could represent a higher risk due to lower HRV indices, suggesting a limited adaptive capacity of the ANS. Although this group shows the lowest number of PVCs, this does not necessarily imply a lower cardiovascular risk. On the contrary, a reduced HRV may be a marker of a compromised autonomic system that can less respond to stressful stimuli, thus increasing the likelihood of serious events.
Regarding the limitations, some recordings were incomplete or affected by unlabeled artifacts. The PVC detection method depends on morphology and may misclassify beats due to high inter-patient variability. Only one ECG lead was used, limiting applicability to multichannel recordings. The algorithm’s performance is sensitive to parameter tuning and may not generalize to populations with high physical activity. Finally, with the lack of other works from the literature that report the identification of characteristic points using the same database, validation remains limited.
This study presents a robust, wavelet-based algorithm for QRS and PVC detection in long-term ECGs, achieving high precision (>85% inPVCs and >97% in QRS) with moderate computational demands. Time-frequency analysis effectively identifies arrhythmic patterns, and HRV stratification reveals critical autonomic trends associated with hemodialysis. The proposed dynamic vector analysis enhances temporal resolution and captures fluctuations missed by hourly averages. While Class 1 is characterized by a sympathetic predominance and a high occurrence of PVCs, Class 3 is notable for a markedly reduced HRV, reflecting advanced autonomic dysfunction. Both classes can be considered high risk, but each is so from different perspectives and depending on the clinical context in which they are analyzed.
5. Conclusions
The stratification of the study population into classes with specific HRV and PVC patterns allowed the identification of critical risk periods, particularly during the interdialytic period. Class 1, with a high incidence of PVCs, underlines the risk associated with electrical instability, while Class 3, with markedly low HRV indices, suggests severe involvement of the ANS and a reduced adaptive capacity. Both represent distinct but significant cardiovascular risks, emphasizing the need for a contextualized clinical assessment.
This study reinforces the importance of combining advanced technologies for QRS and arrhythmia identification, artifact detection, and correction with a stratified and personalized analysis of HRV and PVCs. These approaches allow for an accurate identification of critical periods, guiding timely therapeutic interventions and reducing cardiovascular risk in vulnerable patients. The integration of these tools into clinical practice and their application to broader populations represent the next steps toward more precise and adaptive medicine.
Author Contributions
Conceptualization, G.V.-M., F.J.R.-B. and L.L.-S.; methodology, G.V.-M., F.J.R.-B. and L.L.-S.; software, G.V.-M.; validation, G.V.-M., F.J.R.-B. and L.L.-S.; formal analysis, G.V.-M., F.J.R.-B. and L.L.-S.; investigation, L.L.-S. and G.V.-M.; resources, A.V.-H. and L.L.-S.; data curation, G.V.-M.; writing—original draft preparation, G.V.-M., F.J.R.-B., J.G.-M., A.V.-H., C.A.-S. and L.L.-S.; writing—review and editing, G.V.-M., F.J.R.-B., J.G.-M., A.V.-H., C.A.-S. and L.L.-S.; visualization, G.V.-M., F.J.R.-B. and L.L.-S.; supervision, J.G.-M., C.A.-S. and L.L.-S. All authors have read and agreed to the published version of the manuscript.
Funding
This research received no external funding.
Institutional Review Board Statement
Not applicable.
Informed Consent Statement
Not applicable.
Data Availability Statement
Data are available upon request from the authors of this article.
Conflicts of Interest
The authors declare no conflicts of interest.
Abbreviations
The following abbreviations are used in this manuscript:
| ECG | Electrocardiography |
| CKD | Chronic kidney disease |
| PVCs | Premature ventricular contractions |
| ANS | Autonomous nervous system |
| LF | Low frequency |
| HF | High frequency |
| LF/HF | Ratio between both bands |
| SDNN | Standard deviation of RR intervals |
| RMSSD | Square root of the mean square differences between consecutive RR intervals |
| SD1 | Poincaré SD1 Index |
| SD2 | Poincaré SD2 Index |
| THEW | Telemetric and Holter ECG Warehouse project |
| DWT | Discrete wavelet transform |
| CWT | Continuous wavelet transform |
| db4 | Wavelet order 4 Daubechies |
| PPV | Positive predictive value |
| F-Score | Precision measure for the test |
| ID Px | Patient identification number |
| SD | Standard deviation |
References
- Ronco, C.; McCullough, P.; Anker, S.D.; Anand, I.; Aspromonte, N.; Bagshaw, S.M.; Bellomo, R.; Berl, T.; Bobek, I.; Cruz, D.N.; et al. Cardio-renal syndromes: Report from the consensus conference of the acute dialysis quality initiative. Eur. Heart J. 2010, 31, 703–711. [Google Scholar] [CrossRef] [PubMed]
- Quarti-Trevano, F.; Seravalle, G.; Dell’Oro, R.; Mancia, G.; Grassi, G. Autonomic Cardiovascular Alterations in Chronic Kidney Disease: Effects of Dialysis, Kidney Transplantation, and Renal Denervation. Curr. Hypertens. Rep. 2021, 23, 10. [Google Scholar] [CrossRef] [PubMed]
- Chávez-Iñiguez, J.S.; Sánchez-Villaseca, S.J.; García-Macías, L.A. Síndrome cardiorrenal: Clasificación, fisiopatología, diagnóstico y tratamiento. Una revisión de las publicaciones médicas. Arch. Cardiol. Mex. 2021, 92, 253–263. [Google Scholar] [CrossRef]
- Roig Minguell, E. Utilidad clínica de los marcadores neurohormonales en la insuficiencia cardíaca. Rev. Esp. Cardiol. 2004, 57, 347–356. [Google Scholar] [CrossRef] [PubMed]
- Seibert, E.; Zohles, K.; Ulrich, C.; Kluttig, A.; Nuding, S.; Kors, J.A.; Swenne, C.A.; Werdan, K.; Fiedler, R.; Girndt, M. Association between autonomic nervous dysfunction and cellular inflammation in end-stage renal disease. BMC Cardiovasc. Disord. 2016, 16, 210. [Google Scholar] [CrossRef]
- Sahin, M.; Kayatas, M.; Urun, Y.; Sennaroglu, E.; Akdur, S. Performing only one cardiovascular reflex test has a high positive predictive value for diagnosing autonomic neuropathy in patients with chronic renal failure on hemodialysis. Ren. Fail. 2006, 28, 383–387. [Google Scholar] [CrossRef]
- Masuo, K.; Lambert, G.W.; Esler, M.D.; Rakugi, H.; Ogihara, T.; Schlaich, M.P. The role of sympathetic nervous activity in renal injury and end-stage renal disease. Hypertens. Res. 2010, 33, 521–528. [Google Scholar] [CrossRef]
- Calvo, C.; Maule, S.; Mecca, F.; Quadri, R.; Martina, G.; Perin, P.C. The influence of autonomic neuropathy on hypotension during hemodialysis. Clin. Auton. Res. 2002, 12, 84–87. [Google Scholar] [CrossRef]
- Rubinger, D.; Backenroth, R.; Sapoznikov, D. Sympathetic nervous system function and dysfunction in chronic hemodialysis patients. Semin. Dial. 2013, 26, 333–343. [Google Scholar] [CrossRef]
- Sztajzel, J. Heart rate variability: A noninvasive electrocardiographic method to measure the autonomic nervous system. Swiss Med. Wkly. 2004, 134, 514–522. [Google Scholar]
- Task Force of the European Society of Cardiology and the North American Society of Pacing and Electrophysiology. Heart rate variability: Standards of measurement, physiological interpretation and clinical use. Circulation 1996, 93, 1043–1065. [Google Scholar] [CrossRef]
- Hoshi, R.A.; Pastre, C.M.; Vanderlei, L.C.M.; Godoy, M.F. Poincaré plot indexes of heart rate variability: Relationships with other nonlinear variables. Auton. Neurosci. 2013, 177, 271–274. [Google Scholar] [CrossRef]
- Shaffer, F.; Ginsberg, J.P. An Overview of Heart Rate Variability Metrics and Norms. Front. Public. Health 2017, 5, 258. [Google Scholar] [CrossRef]
- Zhang, H.; Zhu, M.; Zheng, Y.; Li, G. Toward Capturing Momentary Changes of Heart Rate Variability by a Dynamic Analysis Method. PLoS ONE 2015, 10, e0133148. [Google Scholar] [CrossRef] [PubMed][Green Version]
- Dantas, E.M.; Kemp, A.H.; Andreão, R.V.; da Silva, V.J.D.; Brunoni, A.R.; Hoshi, R.A.; Bensenor, I.M.; Lotufo, P.A.; Ribeiro, A.L.P.; Mill, J.G. Reference values for short-term resting-state heart rate variability in healthy adults: Results from the Brazilian Longitudinal Study of Adult Health-ELSA-Brasil study. Psychophysiology 2018, 55, e13052. [Google Scholar] [CrossRef]
- Zeid, S.; Buch, G.; Velmeden, D.; Söhne, J.; Schulz, A.; Schuch, A.; Tröbs, S.-O.; Heidorn, M.W.; Müller, F.; Strauch, K.; et al. Heart rate variability: Reference values and role for clinical profile and mortality in individuals with heart failure. Clin. Res. Cardiol. 2024, 113, 1317–1330. [Google Scholar] [CrossRef] [PubMed]
- Yang, L.; Zhao, Y.; Qiao, B.; Wang, Y.; Zhang, L.; Cui, T.; Fu, P. Heart Rate Variability and Prognosis in Hemodialysis Patients: A Meta-Analysis. Blood Purif. 2021, 50, 298–308. [Google Scholar] [CrossRef] [PubMed]
- Jhen, R.-N.; Wang, P.-C.; Chang, Y.-M.; Kao, J.-L.; Wu, E.C.-H.; Shiao, C.-C. The Clinical Significance and Application of Heart Rate Variability in Dialysis Patients: A Narrative Review. Biomedicines 2024, 12, 1547. [Google Scholar] [CrossRef]
- Chen, S.-C.; Huang, J.-C.; Tsai, Y.-C.; Mai, R.N.H.-C.; Chen, R.N.J.-H.; Kuo, P.-L.; Chang, J.-M.; Hwang, S.-J.; Chen, H.-C. Heart Rate Variability Change Before and After Hemodialysis is Associated with Overall and Cardiovascular Mortality in Hemodialysis. Sci. Rep. 2016, 6, 20597. [Google Scholar] [CrossRef][Green Version]
- Santoro, A.; Mancini, E.; London, G.; Mercadal, L.; Fessy, H.; Perrone, B.; Cagnoli, L.; Grandi, E.; Severi, S.; Cavalcanti, S. Patients with complex arrhythmias during and after haemodialysis suffer from different regimens of potassium removal. Nephrol. Dial. Transplant. 2008, 23, 1415–1421. [Google Scholar] [CrossRef]
- Thio, C.H.M.; van Roon, A.M.; Lefrandt, J.D.; Gansevoort, R.T.; Snieder, H. Heart Rate Variability and Its Relation to Chronic Kidney Disease: Results from the PREVEND Study. Psychosom. Med. 2018, 80, 307–316. [Google Scholar] [CrossRef] [PubMed]
- Rantanen, J.M.; Riahi, S.; Schmidt, E.B.; Johansen, M.B.; Søgaard, P.; Christensen, J.H. Arrhythmias in Patients on Maintenance Dialysis: A Cross-sectional Study. Am. J. Kidney Dis. 2020, 75, 214–224. [Google Scholar] [CrossRef] [PubMed]
- Bozbas, H.; Atar, I.; Yildirir, A.; Ozgul, A.; Uyar, M.; Ozdemir, N.; Muderrisoglu, H.; Ozin, B. Prevalence and predictors of arrhythmia in end stage renal disease patients on hemodialysis. Ren. Fail. 2007, 29, 331–339. [Google Scholar] [CrossRef]
- Dong, Y.; Li, X.; Zheng, W.; Man, Y.; Liu, J.; Yu, P.; Zhang, F.; Yang, B.; Cao, K. Prevalence and heart rate variability characteristics of premature ventricular contractions detected by 24-hour Holter among outpatients with palpitations in China: A cross-sectional study. BMJ Open 2022, 12, e059337. [Google Scholar] [CrossRef]
- Telemetric and ECG Holter Warehouse Project. Available online: https://thew-project.org/index.htm (accessed on 7 December 2024).
- Martinek, R.; Ladrova, M.; Sidikova, M.; Jaros, R.; Behbehani, K.; Kahankova, R.; Kawala-Sterniuk, A. Advanced Bioelectrical Signal Processing Methods: Past, Present and Future Approach—Part I: Cardiac Signals. Sensors 2021, 21, 5186. [Google Scholar] [CrossRef] [PubMed]
- Malik, J.; Soliman, E.Z.; Wu, H.-T. An adaptive QRS detection algorithm for ultra-long-term ECG recordings. J. Electrocardiol. 2020, 60, 165–171. [Google Scholar] [CrossRef]
- Sharmila, V.; Reddy, K.A. Identification of Premature Ventricular Cycles of Electrocardiogram Using Discrete Cosine Transform-Teager Energy Operator Model. J. Med. Eng. 2015, 2015. [Google Scholar] [CrossRef][Green Version]
- Kaya, Y. Classification of PVC Beat in ECG Using Basic Temporal Features. Balk. J. Electr. Comput. Eng. 2018, 6, 78–82. [Google Scholar] [CrossRef]
- Cai, Z.; Wang, T.; Shen, Y.; Xing, Y.; Yan, R.; Li, J.; Liu, C. Robust PVC Identification by Fusing Expert System and Deep Learning. Biosensors 2022, 12, 185. [Google Scholar] [CrossRef]
- Fang, S.-C.; Wu, Y.-L.; Tsai, P.-S. Heart Rate Variability and Risk of All-Cause Death and Cardiovascular Events in Patients With Cardiovascular Disease: A Meta-Analysis of Cohort Studies. Biol. Res. Nurs. 2020, 22, 45–56. [Google Scholar] [CrossRef]
- Mccraty, R.; Shaffer, F. Heart Rate Variability: New Perspectives on Physiological Mechanisms, Assessment of Self-regulatory Capacity, and Health Risk. Glob. Adv. Health Med. 2015, 4, 46–61. [Google Scholar] [CrossRef] [PubMed]
Disclaimer/Publisher’s Note: The statements, opinions and data contained in all publications are solely those of the individual author(s) and contributor(s) and not of MDPI and/or the editor(s). MDPI and/or the editor(s) disclaim responsibility for any injury to people or property resulting from any ideas, methods, instructions or products referred to in the content. |
© 2025 by the authors. Licensee MDPI, Basel, Switzerland. This article is an open access article distributed under the terms and conditions of the Creative Commons Attribution (CC BY) license (https://creativecommons.org/licenses/by/4.0/).