Abstract
Featured Application
This study proposes a lightweight method to enhance the spatial resolution of gridded temperature data, thereby improving the accuracy of numerical weather prediction and meteorological monitoring.
Abstract
Temperature data, as a key meteorological parameter, holds an indispensable position in meteorological research and social management. High-resolution data can significantly enhance these tasks, whether it is accurate climate prediction or the prevention of meteorological disasters. Unfortunately, due to economic or geographical factors, among others, some regions are unable to obtain detailed temperature data, which is a concern for researchers. This study proposes a ResNet-based model aimed at high-resolution reconstruction of 2 m temperature data. In this study, we utilized the ERA5 dataset and applied the method to the South China region (SC). The paper constructs a neural network architecture that integrates a sub-pixel convolution module with a residual structure, which can effectively capture regional temperature characteristics and achieve high-precision data reconstruction. Compared with traditional interpolation methods, this method is more accurate, reduces the initial parameter settings, and lowers the risk of excessive human intervention. Moreover, it is not restricted by the super-resolution ratio. In this paper, experiments with 2× and 4× super-resolution were conducted, respectively. These outcomes indicate that the neural network model presented in this article is a promising approach for generating high-resolution climate data, which holds significant importance for climate research and related applications.
1. Introduction
As key data for meteorological research and social governance, the value of temperature data should not be overlooked. For an extended period, meteorological organizations have always regarded the collection of temperature data as a crucial task. This is because possessing comprehensive and detailed temperature data plays a decisive role in delving deeper into meteorological phenomena, enabling effective weather forecasting and early warning systems, and optimizing social governance [,,,]. The accumulation and analysis of temperature data not only provides a robust foundation for meteorological studies but also lays the foundation for the harmonious development of society.
With the advancement of technology, various methods for collecting temperature data have emerged. Meteorological organizations have attempted to use Automatic Weather Stations (AWS) [,] or satellite technology (e.g., remote sensing, GPS, etc.) []. However, the data collected by these methods have fixed and relatively long intervals. Therefore, collecting temperature data through ground observation stations remains the most direct and reliable method [,]. Meteorological organizations, while relying on this method, also must face some challenges: the distribution of observations is not uniform. This issue can lead to data gaps or biases. As of now, China has established an integrated meteorological observation system comprising over 70,000 ground-based automatic meteorological stations, 236 units of the new generation of weather radars, and seven operational Fengyun meteorological satellites in orbit []. Despite the success of this system, China still faces the challenge of unevenly distributed observation stations. As shown in Figure 1, most observation stations are located in economically developed or densely populated regions, such as coastal areas and the central part of the country. In contrast, the western and northern regions have a limited number of stations. This distribution pattern inevitably leads to inconsistent data density, which may introduce new challenges in subsequent climate prediction or research efforts.
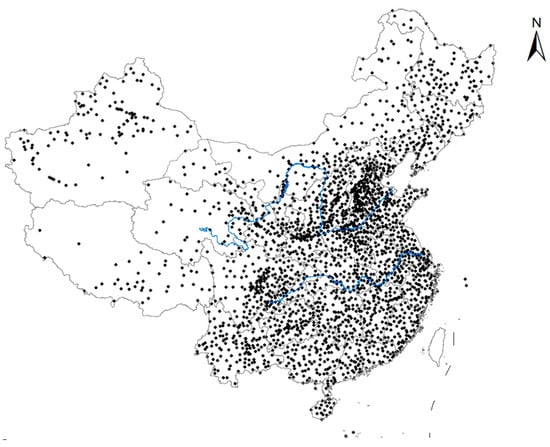
Figure 1.
Distribution of national ground meteorological stations in China [].
To address the issue of insufficiently refined data, in addition to using numerical simulation to obtain high spatiotemporal resolution output data [,], numerous studies have attempted to perform super-resolution (SR) operations on low-resolution (LR) data to generate high-resolution (HR) data. Traditional methods primarily rely on interpolation techniques, with optimal interpolation (OI) [] being the most used. OI combines actual values with physical laws to calculate theoretical values, but as a linear interpolation method, it cannot handle nonlinear data, nor can it incorporate temporal information. Subsequent researchers have proposed bicubic and bilinear interpolation [], which are polynomial interpolation methods that offer better scalability and adaptability. A significant advantage of interpolation methods is that they do not require a large amount of data for training, but they often result in over-smoothed outcomes and blurred edges.
With the advancement of deep learning, research in image SR has also yielded numerous outcomes [,,], and the technology has become increasingly sophisticated. An increasing number of researchers are attempting to employ neural networks to address the issues. In 2018, Vandal [] utilized a Super-Resolution Convolutional Neural Network (SRCNN) for SR operations on rainfall data, achieving a resolution of 0.125° (12.5 km) through upsampling. In 2020, Ping proposed an Ocean Data Reconstruction (ODRE) model, which is an SR model encompassing multi-scale feature extraction and multi-reception field mapping referred to as the ODRE model []. In 2022, Khoo introduced Spectral Normalization (SN) to improve the Generative Adversarial Networks (GANs) architecture, enhancing the quality of real-time analysis and data transmission delays and improving the model’s performance in SR of sea surface temperature (SST) data []. Jiang proposed a method to enhance the resolution of near-surface climate models using the Fourier Neural Operator (FNO) []. The study introduced the Clausius–Clapeyron equation, incorporating physical constraint loss to better constrain the relationship between state variables. Ultimately, experiments demonstrated that FNO also exhibited comparable performance to deep learning models. In addition to the correlation between regional temperatures, Wang proposed the T_INRI model, integrating temporal scale information into feature information []. The research is based on Time-aware Implicit Neural Representation, which calculates the four surrounding true values by position weighting for unknown values, eliminating data discontinuity issues in the process of generating high-resolution data. In 2024, Fanelli proposed a deep learning model called dilated Adaptive Deep Residual Network for Super-Resolution (dADR-SR) for SR operations on SST datasets []. The dADR-SR leverages convolutional layers with different dilation factors to capture features at various scales while incorporating Adaptive Residual Blocks (ARBs) within the model, allowing for self-adjustment of feature representation and enhancing the model’s response to input data. Subsequently, researchers aimed to refine the details and quality of low-resolution images using the diffractive model, employing the SR3 model and ResDiff architecture to improve the spatial resolution of meteorological data []. The model integrates convolutional filters that simulate finite difference schemes to accurately capture the learning of physical processes. However, the model is sensitive to data noise, especially when the quality of LR data is poor.
The contribution of this paper is the construction of a ResNet-Subpixel neural network, which takes LR data of varying sizes as its input and outputs HR data reconstructed through super-resolution, thereby enhancing the effective resolution and detailed information of the data. In traditional numerical models, the time step and the interval lengths of spatial coordinates are limited by the Courant–Friedrichs–Lewy (CFL) condition [,,]. According to the CFL expression:
where is the Courant number (a dimensionless constant), and is the constant velocity magnitude. Therefore, when the longitudinal and latitudinal resolutions are doubled, the temporal resolution must also be doubled. When the numerical model is used to obtain an output with twice the original spatial resolution, the computational cost increases by a factor of (as the resolution doubles in longitude, latitude, and time). By using the proposed super-resolution framework, resolution enhancement is achieved through the proposed framework based on the low-resolution output from the numerical model. In this case, the computational cost of the numerical model is reduced to 1/8. The network ensures the effective resolution and detail of the data while requiring less time and computational resources compared to traditional numerical models. The model performs well on LR data with different downsampling, which enhances its versatility. Comparisons with traditional interpolation methods for expanding information are made to argue the advantages of machine learning methods for temperature data in meteorological applications.
The structure of the remainder of this paper is as follows: Section 2 provides a brief introduction to our dataset; Section 3 details the methodology for SR reconstruction of temperature data; Section 4 presents the experimental results and discusses the feasibility and effectiveness of the proposed method; Section 5 concludes the study and discusses potential directions for future research.
2. Data
The data employed in this study were obtained from the European Centre for Medium-Range Weather Forecasts (ECMWF) Re-Analysis v5 (ERA5) dataset, a publicly accessible resource. ERA5 offers high-resolution reanalysis data of global weather and climate variables spanning from 1950 to the present, covering atmospheric, terrestrial, and marine climate parameters []. This dataset provides comprehensive climatic information, which holds substantial value for climate research and predictive modeling [,,,]. The temperature data employed in this study were extracted from the ERA5 hourly dataset on single levels, covering the period from 1940 to the present []. This dataset features a spatial resolution of 0.25° × 0.25°, equivalent to an approximate interval of 25 km. Specifically, the study utilized the 2 m temperature parameter, which denotes the air temperature at 2 m above the surface of land, ocean, or inland water bodies. This parameter is derived through interpolation between the lowest model level and the Earth’s surface, incorporating the physical conditions of the atmosphere.
In the experiment, we conducted downsampling on the original dataset to generate LR data, which was utilized as the input for the model. The temperature data spanning from 1 January 2023 to 31 December 2023 were designated as the training set, while the dataset covering 1 January 2020 to 31 December 2020 was used as the validation set. The region is characterized by a subtropical monsoon climate, with high temperatures typically occurring from June to August and low temperatures prevailing from December to February of the following year. The 2 m temperature data used in the experiment indicate an average annual temperature of ; July is the hottest month, averaging , and January is the coldest month, averaging . The dataset features a temporal interval of 1 h and consists of a total of 17,520 data samples. To ensure that the downsampling maintains spatial alignment between the LR data and the original data for subsequent model training, we employed specific downsampling window sizes (2 × 2 or 4 × 4 pixels) to calculate the value of the data points within each window. During the downsampling process, boundary data points that do not form a complete window were excluded. This method aims to retain key information from the original dataset while reducing its resolution to facilitate model training and analysis. Our ultimate goal is for the model to generate super-resolution reconstruction data for the region spanning latitudes from 16.25° N to 40° N and longitudes 100° E to 123.75° E, utilizing LR data of varying sizes. The outcomes are illustrated in Figure 2.
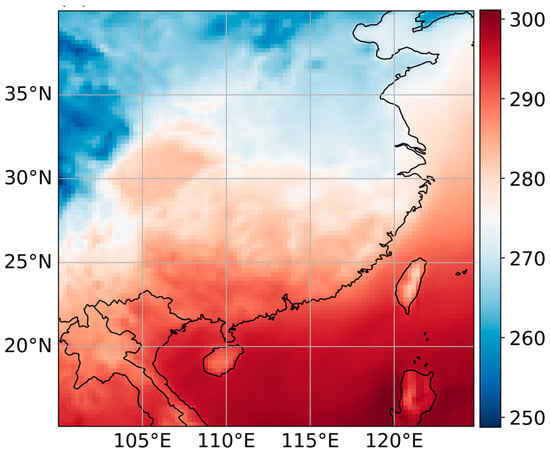
Figure 2.
Display of the results of the SR data.
3. Method
3.1. Sub-Pixel Convolution
Super-resolution reconstruction of images has been a work of great interest []. Sub-pixel convolution is a technique commonly used in image processing, particularly in SR reconstruction, and has achieved significant results in target detection, image segmentation, and high-resolution reconstruction of images and videos in the field of computer vision (CV) [,,]. During the image data acquisition process in photography and other fields, images are discretized. Due to the limitations of hardware devices such as photoreactive elements, a single pixel typically represents the color of a certain area. The finer pixels that are not recorded between two adjacent pixels are referred to as sub-pixels. SR operations are often described as the process of obtaining these unknown sub-pixels. In neural network models, upsampling methods are commonly used to restore or interpolate LR images []. The upsampling process typically involves uniform interpolation within a specified receptive field using specific methods such as Max Pooling or Average Pooling, which are entirely composite mathematical computation operations, as shown in Figure 3.
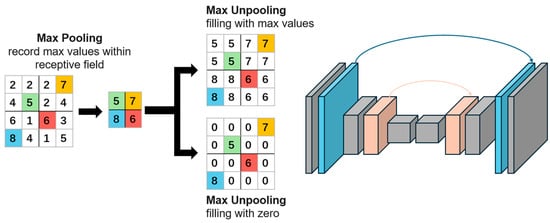
Figure 3.
Correspond pairs of downsampling and upsampling layers.
Contrary to upsampling operations, sub-pixel convolution effectively harnesses the information from low-resolution images when generating high-resolution images, as it can learn weight parameters during the model training process. Studies have posited that zero-padding the receptive field during the upsampling process is an ineffective practice [], with the singular blank data being not only invalid information but also potentially detrimental to model training and gradient optimization for LR data of size . Sub-pixel Convolution differs from mere upsampling processes in that it does not directly generate HR data through interpolation or similar methods; instead, it obtains the HR data by rearranging the feature matrices within the model’s hidden layers. As shown in Figure 4, the model initially derives a feature matrix with channels and subsequently employs periodic shuffling to produce HR data of size . The mathematical expression is as follows:
where represents the original data, and denotes the HR data output by the model. refers to the shuffling operation, which is the model’s process of padding the feature values. Specifically, in sub-pixel convolution, LR pixels are regarded as an area of size . During upsampling, the model utilizes the features it has learned to fill this area, adjusting the output of the final convolutional layer to
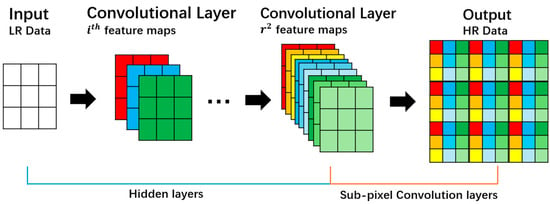
Figure 4.
Sub-pixel convolution process.
In this context, represents the Batch Size; denotes the number of channels; are the dimensions of the LR data size; is the upscale factor. The model training process continuously adjusts feature parameters and padding methods, making the deconvolution process not entirely compliant with mathematical procedures. This approach addresses the issue of excessive hyperparameters and overt human intervention in some upsampling methods.
3.2. ResNet
Convolutional Neural Networks (CNNs) have long been a significant class of models in the field of machine learning. Since LeCun et al. introduced the method of extracting feature maps from data using convolutional kernels [], CNNs have been widely applied in image recognition, object classification, and natural language processing [,,]. With in-depth research in the field of machine learning and the support of computer hardware devices, researchers have attempted to use CNNs with more complex structures and greater depths. However, simply increasing the depth of a CNN does not necessarily enhance model performance []; on the contrary, overly complex structures and a large number of parameters can sometimes affect the training efficiency of the model. Consequently, researchers have begun to focus on whether newly added layers (blocks) effectively improve the performance of neural networks.
Building on the rationale, He introduced ResNet []. In general, when the depth of a CNN reaches a certain level, the training error no longer decreases but instead increases, a phenomenon we refer to as vanishing or exploding gradients. Within CNN, feature matrices are processed through convolutional layers to extract feature information and then passed through activation functions to enhance the model’s nonlinear expression capabilities. The process of repeatedly applying convolutions completes the training. For a network composed of layers, the first layers can be described as follows:
where denotes the convolution operation; and represent the weight and bias parameters of the -th layer, respectively; denotes the input data; and is the activation function. The specific structure is illustrated in Figure 5a. It can be observed that the data on this layer are derived from the convolution of the data from the previous layer. When an inappropriate weight or activation function is used, the continuous propagation through multiple convolutional layers may lead to a degradation problem in the network (such as vanishing and exploding gradients).
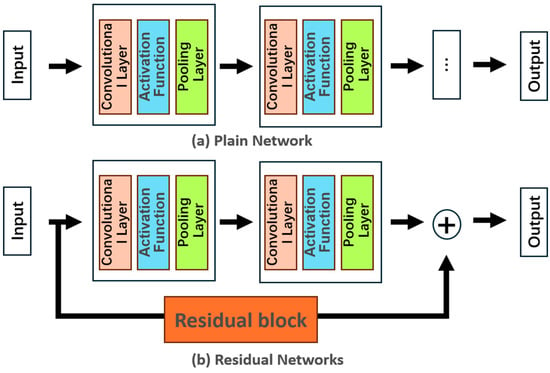
Figure 5.
(a) Plain network; (b) residual networks. The residual block may contain zero or more convolution kernels.
Residual structures were introduced to address the issue of network degradation that arises with the increase in model depth. By designing residual blocks to establish skip connections between feature matrices of different layers, the problem of inappropriate weight parameters being amplified during transmission is reduced. This can be articulated as follows:
where denotes a residual block. Traditional CNNs have attempted to model the nonlinear mapping between the input data and the corresponding output through the stacking of multiple convolutional layers. During the actual training process, this identity mapping is challenging to learn, and the pursuit of this mapping through an excessive number of convolutional layers often leads to the network degradation problem. ResNet does not directly learn this mapping but instead focuses on the difference between the input and output, achieving an identity mapping through alternative structural means []. In ResNet, the problem is reformulated as , where the identity mapping is explicitly integrated into the network architecture. This transformation shifts the focus to learning the residual , which simplifies the optimization process and enhances the network’s ability to model complex functions []. This approach makes it easier to find the mapping function compared to traditional CNNs. Moreover, it achieves the same effect with a model that is less deep and less complex, as shown in Figure 5b.
In this study, we constructed a model that combines sub-pixel convolution with ResNet networks for the SR reconstruction of temperature data, referred to as SR-ResNet. During the experimental process, we first downsampled the actual ground temperature data (100 × 100, 0.25°) to a certain ratio to obtain LR data as model input. After that, multiple residual blocks were used to learn and extract features from the data, generating corresponding feature maps. These feature maps were then input into the Upscaling Block, which expands them to -sized feature maps according to the SR ratio, followed by periodic shuffling to obtain the SR results. The specific process is shown in Figure 6a.
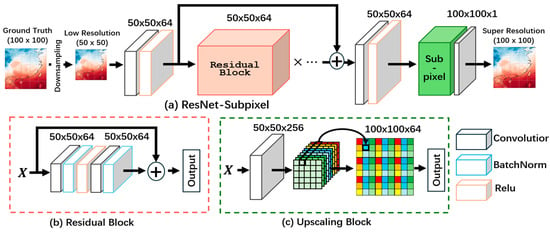
Figure 6.
(a) ResNet-Subpixel (2×) structure and experimental flow, containing some residual Bblocks. (b) Residual block containing 2 convolutional layers, 2 BatchNorm layers, and an activation function Relu. (c) Upscaling Block.
4. Experiments and Results
The aim of the study was to perform SR reconstruction on temperature data in the SC region with a spatial resolution of 0.25° × 0.25°. To validate the model’s capability in this regard, we conducted multiple experiments for verification. To assess the model’s performance in SR reconstruction of temperature data at different scales, we subjected the original data to downsampling operations by factors of 2 and 4, resulting in LR data with spatial resolutions of 0.5° × 0.5° and 1° × 1°, respectively, as shown in Figure 7. In terms of network performance evaluation, the study employed a variety of metrics to compare the differences between the SR results and the original data . In the experiments, we conducted tests on data with resolutions of 0.5° × 0.5° and 1° × 1° to evaluate the performance of two types of SR tasks: (1) the model performance for SR at a specific moment; (2) the model performance for SR over a period. Additionally, we compare the results of SR reconstruction using CNN with those obtained using traditional methods (such as bilinear interpolation).

Figure 7.
Example temperature fields (shaded color) from the original dataset at 0.25° × 0.25° (a); low-resolution dataset at 0.5° × 0.5° (b); and low-resolution dataset at 1° × 1° (c).
Initially, we utilized commonly employed evaluation metrics in the fields of machine learning and computer vision, namely Root Mean Square Error (), Mean Absolute Error (), Mean Absolute Percentage Error (), correlation coefficient (), Peak Signal-to-Noise Ratio (), and structural similarity ():
where is the total number of the samples (when a single moment case ); is the total number of pixels in one sample; and denote the -th pixel at the -th moment in the original results and the SR data, respectively; and are the mean values of and at the -th moment, respectively. , , and are commonly used metrics for evaluating model performance [,,]. They provide a direct representation of the model’s performance, allowing us to clearly understand the deviation between the temperature data reconstructed by the model and the actual temperatures, including the magnitude of the deviation and whether the SR data are generally higher or lower than the actual values. However, relying on a single evaluation metric can lead to errors in assessment, as such metrics may be sensitive to outliers, amplify relative errors, or ignore the direction of errors. By integrating multiple metrics, a more comprehensive evaluation of model performance can be achieved. This approach helps to mitigate the shortcomings of individual metrics and provides a more holistic view of the model’s capabilities and accuracy. is not a measure of the deviation between SR results and original data but is used to assess the degree of linear correlation between the two, typically calculated using the Pearson correlation coefficient []. It reflects the correlation between the model’s output and the true values. is an objective criterion for evaluating images and is often used to calculate the visualization error of two images and to measure the degree of distortion of an image []. Max is a constant indicating the maximum possible pixel value of the image. is a measure of the similarity of two images, mainly used to detect the similarity of two images of the same size or to detect the degree of distortion of an image. The algorithm is based on comparing the brightness, contrast, and structure of two images and weighing these three elements []. and represent the average brightness of images and ; denote the standard deviation (contrast), respectively; denotes the covariance between and (structural).
4.1. Two-Times Downsampling (0.5° × 0.5° LR Data)
We performed an experiment on LR data (0.5° × 0.5°) generated through downsampling of original data by a factor of 2. As illustrated in Figure 6, our deep learning model processes 50 × 50 inputs to generate outputs at 100 × 100 resolution, effectively achieving a 2× super-resolution reconstruction. As shown in Figure 8, the model converged after approximately 70 epochs of training at a resolution of 0.5° × 0.5°, with the loss dropping to a low and stable state. Figure 9 and Figure 10 display the SR reconstruction of 2 m temperature data for a single moment (31 December 2020—23:00) and the average for the entire year of 2020 in the validation dataset, respectively. In the first instance, we can observe the specifics of LR data, SR data, and true data. The second column presents the differences among the three types of temperature data. Through these differences, we can directly observe and analyze the discrepancies between each observation point (pixel) in the region, including whether there are severe deviations in different areas and the direction of these deviations.
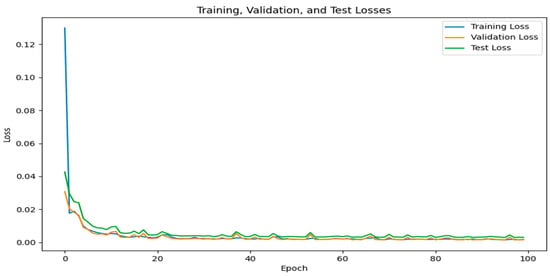
Figure 8.
Model training results at 0.5° × 0.5° resolution.
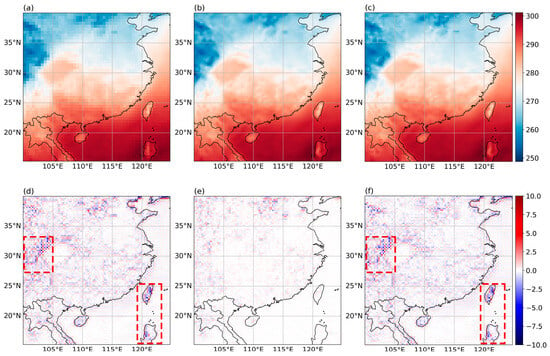
Figure 9.
SR results for a single moment at a resolution of 0.5° × 0.5°: (a) LR temperature data; (b) SR temperature data; (c) true surface temperature data; (d) comparison between true data and LR data; (e) comparison between true data and SR data; (f) comparison between SR data and LR data. The areas where the LR data differs greatly from the SR data and the real data are indicated by the red dotted line.
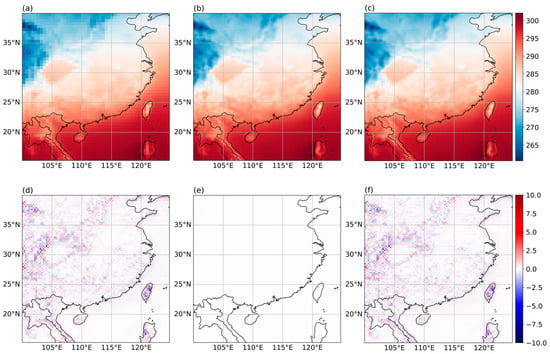
Figure 10.
SR results for the average moment at a resolution of 0.5° × 0.5°: (a) LR temperature data; (b) SR temperature data; (c) true surface temperature data; (d) comparison between true data and LR data; (e) comparison between true data and SR data; (f) comparison between SR data and LR data.
Upon comparison, we deem the model’s SR reconstruction performance to be excellent at a resolution of 0.5° × 0.5°. The differences between SR data and true data at a single moment (Figure 9e) are relatively small, with deviations occurring only in inland areas. However, these deviations are distributed uniformly and have small magnitudes, without any large-scale regions showing a consistent temperature bias that is either too high or too low. We consider this to be within the normal range of errors. The model has effectively captured the temperature variation characteristics within the region, demonstrating good performance in the SR reconstruction of temperature data for this area. Comparing the differences between true data and LR data (Figure 9d) with the differences between SR data and LR data (Figure 9f), it can be observed that the overall patterns are quite similar, with the main deviation areas and directions being consistent between the two images (the areas designated by the red dotted lines in Figure 9d,f).
Figure 10 illustrates the average SR performance of temperature data over the year 2020, where the model demonstrates an excellent overall performance. It is noticeable that the gap between the SR data and the actual data is significantly smaller over extended periods. We hypothesize that this is because minor errors at individual moments are averaged out, leading to an improved overall performance when considering the data over a longer time frame.
4.2. Fout-Times Downsampling (1° × 1° LR Data)
To investigate the model’s performance in SR reconstruction at different scales, we performed a 4× downsampling operation on the original data to obtain LR data with a resolution of 1° × 1°; the experimental flow is shown in Figure 11. As shown in Figure 12, compared to the 0.5° × 0.5° dataset, this dataset converged more slowly, taking approximately 85 epochs. Like the previous set of experiments, Figure 13 and Figure 14 show the SR reconstruction results for the same moment. Whether comparing results at a single moment or average moments, the differences between SR data and LR data, as well as between true data and LR data, exhibit a certain degree of similarity. This indicates that our model still possesses the capability to perform SR reconstruction work even after a 4× downsampling. However, it must be acknowledged that as the downsampling factor increases, the model’s performance declines. The specific manifestation is that the data reconstructed from the 1° × 1° dataset appears significantly smoother, indicating that more detailed information is lost during the SR reconstruction process. Additionally, the differences between SR data and LR data (Figure 13e) show an overall trend of overestimation, with an increase in the magnitude of deviation.
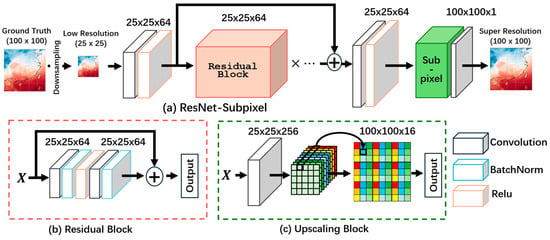
Figure 11.
(a) ResNet-Subpixel (4×) structure and experimental flow, containing some residual blocks. (b) Residual block containing 2 convolutional layers, 2 BatchNorm layers, and an activation function Relu. (c) Upscaling Block.
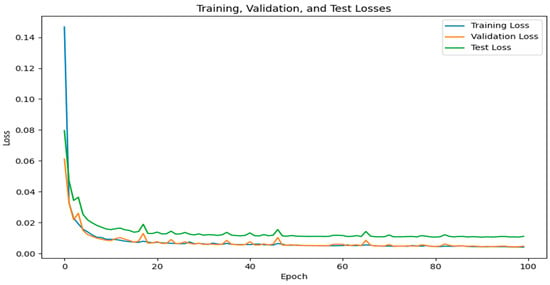
Figure 12.
Model training results at 1° × 1° resolution.
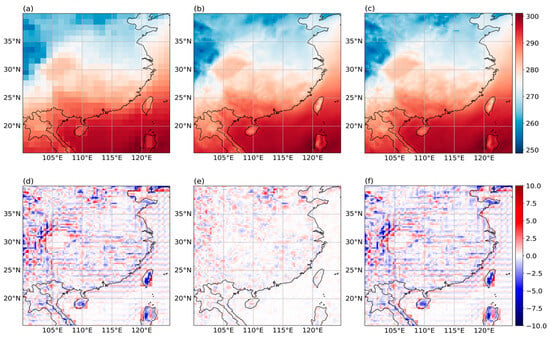
Figure 13.
SR results for a single moment at a resolution of 1° × 1°: (a) LR temperature data; (b) SR temperature data; (c) true surface temperature data; (d) comparison between true data and LR data; (e) comparison between true data and SR data; (f) comparison between SR data and LR data.
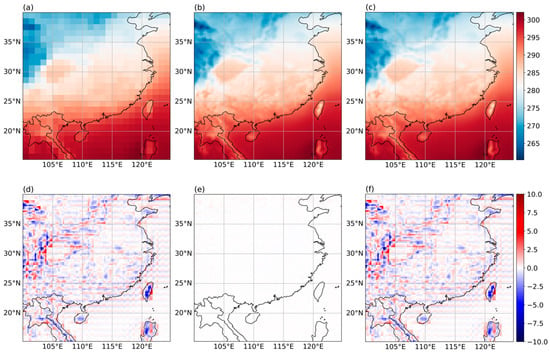
Figure 14.
SR results for the average moment at a resolution of 1° × 1°: (a) LR temperature data; (b) SR temperature data; (c) true surface temperature data; (d) comparison between true data and LR data; (e) comparison between true data and SR data; (f) comparison between SR data and LR data.
Table 1 presents the performance of two types of SR tasks (single or average moment) using different downsampling methods (2× and 4×) in the experiment. Comparative analysis shows that the 4× model achieves lower scores than the 2× model on all performance metrics. It is evident that the average results over a long period are superior to the SR reconstruction at a single moment, and this holds true for both 2× and 4× downsampling. The SR results exhibit a strong correlation with the actual data, regardless of whether the downsampling is by a factor of 2 or 4.

Table 1.
Error estimations of the model under different data conditions.
4.3. Ablation Experiment
To evaluate the impact of residual blocks on model performance, we conducted a series of ablation studies. Using 0.5° × 0.5° LR data as input, we compared architectures containing 2, 4, and 8 residual blocks. A CNN without residual blocks was included for comparative analysis; Figure 15 shows the CNN framework.

Figure 15.
The CNN framework.
Table 2 summarizes model performance under different frameworks. The results indicate that residual blocks yield significant performance gains over CNN architecture. Notably, the 8-residual blocks framework achieves optimal performance metrics. We believe that residual blocks help preserve detailed information in low-level structures, such as high- or low-temperature points and edges of temperature variations caused by topographical changes. By combining these details with high-level semantic information through skip connections, the model’s performance is enhanced. Residual blocks also improve the training efficiency of the model. As shown in Figure 16, under identical training data, the CNN required approximately 125 epochs to achieve convergence, while ResNet-Subpixel converged significantly faster. This acceleration can be attributed to the skip connections offering the model a favorable training state, smoothing the optimization process, and preventing the redundant relearning of features, thereby improving parameter efficiency.

Table 2.
Error estimations of the model under different frameworks.
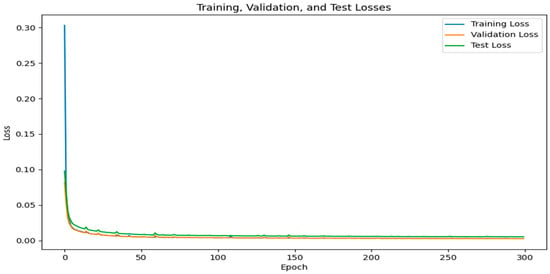
Figure 16.
CNN training results at 0.5° × 0.5° resolution.
4.4. Discussion
The experiment also compared the performance of the traditional interpolation method: bilinear interpolation at a resolution of 0.5° × 0.5°, as shown in Figure 17. The comparative analysis demonstrates that bilinear interpolation is markedly inferior to our proposed method, whether evaluated as a single moment or an average moment. Specifically, bilinear interpolation shows higher error magnitudes and a more concentrated distribution of error points. It is worth noting that bilinear interpolation performs particularly poorly in mountainous areas or at the edges of land and sea. We attribute this to the fact that bilinear interpolation only considers the correlation of neighboring points during the calculation process without adequately accounting for the impact of topography on temperature variations. This results in a smoothing effect on the reconstructed data. Comparing the SR data in Figure 9 and Figure 10 reveals that the temperature field reconstructed by bilinear interpolation is overly smooth, leading to the loss of information. Furthermore, a comparison between Figure 17c,d demonstrates that both the error magnitudes and the density of error points are reduced at an average moment compared to those at a single moment. This observation further corroborates the earlier hypothesis that minor random errors inherent in individual moments tend to cancel each other out when averaged over time, ultimately leading to improved overall performance.
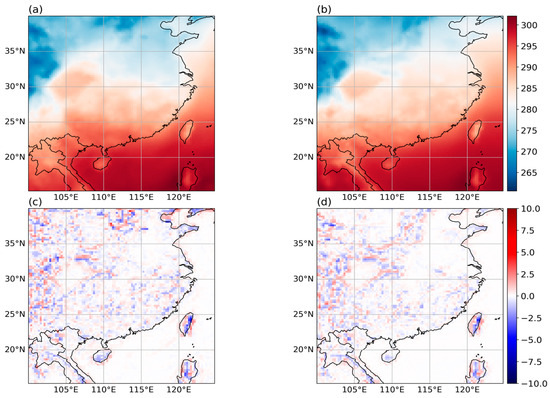
Figure 17.
SR results for bilinear interpolation between single and average moments: (a) SR data for a single moment; (b) SR data for the average moment; (c) comparison between true data and SR data for a single moment; (d) comparison between true data and SR data for the average moment.
The overview of the performances of traditional methods related to the super-resolution reconstruction of temperature data is shown in Table 3, as well as the performance of ResNet-Subpixel. Comparison results show that our method achieves the best performance on all indicators. Notably, ResNet-Subpixel has shown a significant improvement in RMSE in this SR task. Compared with traditional logistic regression or interpolation methods, our approach has enhanced RSME by approximately 49.67%. Additionally, the high PSNR values are noteworthy. According to the PSNR benchmark [], values exceeding 40 dB indicate high-fidelity reconstruction. Our method achieves a PSNR of 58.89 dB, which can be regarded as a high-quality super-resolution reconstruction.

Table 3.
The , and of different SR methods.
5. Conclusions
We presented a model that combines sub-pixel convolution with ResNet architecture to perform super-resolution reconstruction on temperature data in the SC region. By inputting training data obtained from downsampling real 2 m temperature data into the model, the model learns to extract temperature characteristics within the corresponding area. Diverging from traditional upsampling approaches in conventional CNNs, the model employs a special periodic shuffling mechanism to learn the numerical positions and weights within the padded feature maps. This process effectively utilizes the feature information learned from the deep structure of the model and reduces the impact of researchers’ subjective influences due to excessive hyperparameter settings, thereby enhancing the model’s performance in SR tasks.
After conducting multiple rounds of super-resolution experiments with varying dimensions, the results demonstrate that the model has successfully extracted temperature-related feature information from the SC region, thereby achieving excellent performance. Both the statistical outcomes derived from the evaluation coefficients and the intuitive analysis of the comparison charts post-super-resolution underscore the model’s superior capabilities. It is noteworthy that as the time steps for super-resolution reconstruction data increase, the impact of minor errors also gradually diminishes. This is specifically manifested as small deviations that may exist for a particular observation point at a single moment, but on average, these minor deviations have little effect on the results, and the model performance improves. Moreover, compared to the over-smoothing issues encountered in traditional interpolation methods, this model is significantly capable of preserving more detailed information in temperature data.
This study has once again demonstrated that the use of CNN for the super-resolution reconstruction of temperature data is feasible and advantageous. In fact, we have identified numerous issues and aspects that require further research and development. Building upon the findings of this study, our future research directions are divided into two main areas:
- Further enhancing the model’s precision in super-resolution tasks. It is widely acknowledged that meteorological data within the same region are correlated [,,,], such as temperatures at different altitudes, wind fields, and atmospheric humidity. By incorporating multiple feature parameters to describe a more detailed temperature field, the model can extract and learn details that are difficult to discern from single temperature data, thereby yielding more refined SR results.
- In the field of research concerning the super-resolution reconstruction of meteorological data, the reliability of the model’s generalizability has always been a matter of concern [,,,]. In our future work, we will further discuss the generalizability of the model, with the verification process divided into two parts. Firstly, we will conduct super-resolution experiments using the model on temperature data from different regions, which is also the issue of greatest concern to most researchers. In the selection of regions, we anticipate filtering based on three criteria: the same latitude, the same longitude, and similar topographical conditions. Beyond investigating the generalizability of the model, we will further discuss potential influencing factors. Secondly, within the same region, we will use the model to perform super-resolution reconstruction on different meteorological data to evaluate its effectiveness. As mentioned previously, meteorological data exhibit physical correlations. Can the model learn this correlation by extracting feature information from the temperature field? Using a model trained on temperature data for the super-resolution reconfiguration task of humidity data, we believe this is an interesting question that merits further research.
Author Contributions
Conceptualization, H.K., Y.W. and C.-S.W.; methodology, Z.L., H.K., Y.W. and C.-S.W.; software, Z.L. and C.-S.W.; validation, Z.L. and H.K.; formal analysis, Z.L., H.K. and C.-S.W.; investigation, Z.L., H.K. and Y.W.; resources, Y.W., C.-S.W. and Y.D.; data curation, Z.L., H.K. and C.-S.W.; writing—original draft preparation, Z.L.; writing—review and editing, Z.L., H.K. and Y.D.; visualization, Z.L. and C.-S.W.; supervision, H.K.; project administration, H.K. and Y.W.; funding acquisition, Y.W. and P.W. All authors have read and agreed to the published version of the manuscript.
Funding
The National Key R&D Program of China under contract No. 2022YFC3003804 and JSPS KAKENHI Grant Number 24K01140.
Institutional Review Board Statement
Not applicable.
Informed Consent Statement
Not applicable.
Data Availability Statement
The data presented in this study are available on request from the corresponding author.
Acknowledgments
The authors gratefully acknowledge the European Centre for Medium-Range Weather Forecasts (ECMWF) for providing the ERA5 reanalysis data, which were invaluable to this research.
Conflicts of Interest
The authors declare no conflicts of interest.
References
- Hsiang, S.M.; Burke, M. Climate, conflict, and social stability: What does the evidence say? Clim. Change 2014, 123, 39–55. [Google Scholar] [CrossRef]
- Raymond, C.; Horton, R.M.; Zscheischler, J.; Martius, O.; AghaKouchak, A.; Balch, J.; Bowen, S.G.; Camargo, S.J.; Hess, J.; Kornhuber, K.; et al. Understanding and managing connected extreme events. Nat. Clim. Change 2020, 10, 611–621. [Google Scholar] [CrossRef]
- Morss, R.E.; Wilhelmi, O.V.; Meehl, G.A.; Dilling, L. Improving societal outcomes of extreme weather in a changing climate: An integrated perspective. Annu. Rev. Environ. Resour. 2011, 36, 1–25. [Google Scholar] [CrossRef]
- Riebsame, W.E.; Diaz, H.F.; Moses, T.; Price, M. The social burden of weather and climate hazards. Bull. Am. Meteorol. Soc. 1986, 67, 1378–1388. [Google Scholar] [CrossRef]
- Nsabagwa, M.; Byamukama, M.; Kondela, E.; Otim, J.S. Towards a robust and affordable Automatic Weather Station. Dev. Eng. 2019, 4, 100040. [Google Scholar] [CrossRef]
- Munandar, A.; Fakhrurroja, H.; Rizqyawan, M.I.; Pratama, R.P.; Wibowo, J.W.; Anto, I.A.F. Design of real-time weather monitoring system based on mobile application using automatic weather station. In Proceedings of the 2017 2nd International Conference on Automation, Cognitive Science, Optics, Micro Electro-Mechanical System, and Information Technology (ICACOMIT), Jakarta, Indonesia, 23–24 October 2017; IEEE: Piscataway, NJ, USA; pp. 44–47. [Google Scholar]
- Gutman, S.I.; Benjamin, S.G. The role of ground-based GPS meteorological observations in numerical weather prediction. GPS Solut. 2001, 4, 16–24. [Google Scholar] [CrossRef]
- Beltrami, H. On the relationship between ground temperature histories and meteorological records: A report on the Pomquet station. Glob. Planet. Change 2001, 29, 327–348. [Google Scholar] [CrossRef]
- National Research Council; Division on Earth, Life Studies; Board on Atmospheric Sciences; Committee on Developing Mesoscale Meteorological Observational Capabilities to Meet Multiple National Needs. Observing Weather and Climate from the Ground Up: A Nationwide Network of Networks; National Academies Press: Washington, DC, USA, 2009. [Google Scholar]
- China Meteorological Administration: China Has Basically Built the World’s Largest Comprehensive Meteorological Observation System. Available online: https://www.cma.gov.cn/ztbd/2022zt/20220929/2022092605/202209/t20220929_5113153.html (accessed on 15 December 2024).
- Monthly Station Observation Data Set of Meteorological Elements in China. Available online: https://www.resdc.cn/data.aspx?DATAID=349 (accessed on 27 December 2024).
- Du, Y.; Zhang, Q.; Chen, Y.L.; Zhao, Y.; Wang, X. Numerical simulations of spatial distributions and diurnal variations of low-level jets in China during early summer. J. Clim. 2014, 27, 5747–5767. [Google Scholar] [CrossRef]
- Kong, H.; Zhang, Q.; Du, Y.; Zhang, F. Characteristics of coastal low-level jets over Beibu Gulf, China, during the early warm season. J. Geophys. Res. Atmos. 2020, 125, e2019JD031918. [Google Scholar] [CrossRef]
- Charney, J.G.; Fjörtoft, R.; Neumann, J.V. Numerical integration of the barotropic vorticity equation. Tellus 1950, 2, 237–254. [Google Scholar] [CrossRef]
- Han, D. Comparison of Commonly Used Image Interpolation Methods. In Proceedings of the 2nd International Conference on Computer Science and Electronics Engineering (ICCSEE 2013); Atlantis Press: Paris, France, 2013; pp. 1556–1559. [Google Scholar]
- Bretherton, F.P.; Davis, R.E.; Fandry, C.B. A technique for objective analysis and design of oceanographic experiments applied to MODE-73. In Deep Sea Research and Oceanographic Abstracts; Elsevier: Amsterdam, The Netherlands, 1976; Volume 23, pp. 559–582. [Google Scholar]
- Farsiu, S.; Robinson, D.; Elad, M.; Milanfar, P. Advances and challenges in super-resolution. Int. J. Imaging Syst. Technol. 2004, 14, 47–57. [Google Scholar] [CrossRef]
- Park, S.C.; Park, M.K.; Kang, M.G. Super-resolution image reconstruction: A technical overview. IEEE Signal Process. Mag. 2003, 20, 21–36. [Google Scholar] [CrossRef]
- Vandal, T.; Kodra, E.; Ganguly, S.; Michaelis, A.; Nemani, R.; Ganguly, A.R. Generating high resolution climate change projections through single image super-resolution: An abridged version. In Proceedings of the International Joint Conferences on Artificial Intelligence Organization, Stockholm, Sweden, 13–19 July 2018. [Google Scholar]
- Ping, B.; Su, F.; Han, X.; Meng, Y. Applications of deep learning-based super-resolution for sea surface temperature reconstruction. IEEE J. Sel. Top. Appl. Earth Obs. Remote Sens. 2020, 14, 887–896. [Google Scholar] [CrossRef]
- Khoo, J.J.D.; Lim, K.H.; Pang, P.K. Deep learning super resolution of sea surface temperature on South China Sea. In Proceedings of the the 2022 International Conference on Green Energy, Computing and Sustainable Technology (GECOST), Miri Sarawak, Malaysia, 26–28 October 2022; IEEE: Piscataway, NJ, USA; pp. 176–180. [Google Scholar]
- Jiang, P.; Yang, Z.; Wang, J.; Huang, C.; Xue, P.; Chakraborty, T.C.; Chen, X.; Qian, Y. Efficient Super-Resolution of Near-Surface Climate Modeling Using the Fourier Neural Operator. J. Adv. Model. Earth Syst. 2023, 15, e2023MS003800. [Google Scholar] [CrossRef]
- Wang, Y.; Karimi, H.A.; Jia, X. Continuous Super-Resolution of Climate Data Using Time-aware Implicit Neural Representation. Preprints 2023. [Google Scholar] [CrossRef]
- Fanelli, C.; Ciani, D.; Pisano, A.; Buongiorno Nardelli, B. Deep learning for the super resolution of Mediterranean sea surface temperature fields. Ocean Sci. 2024, 20, 1035–1050. [Google Scholar] [CrossRef]
- Martinů, J.; Šimánek, P. Enhancing Weather Predictions: Super-Resolution via Deep Diffusion Models. arXiv 2024, arXiv:2406.04099. [Google Scholar]
- Schneider, K.; Kolomenskiy, D.; Deriaz, E. Is the CFL condition sufficient? Some remarks. In The Courant–Friedrichs–Lewy (CFL) Condition: 80 Years After Its Discovery; Birkhäuser Boston: Boston, MA, USA, 2013; pp. 139–146. [Google Scholar]
- Skamarock, W.C.; Klemp, J.B.; Dudhia, J.; Gill, D.O.; Liu, Z.; Berner, J.; Wang, W.; Powers, J.G.; Duda, M.G.; Barker, D.M.; et al. A Description of the Advanced Research WRF Model Version 4; National Center for Atmospheric Research: Boulder, CO, USA, 2019. [Google Scholar]
- Courant, R.; Friedrichs, K.; Lewy, H. Über die partiellen Differenzengleichungen der mathematischen Physik. Math. Ann. 1928, 100, 32–74. [Google Scholar] [CrossRef]
- Wu, G.; Lv, P.; Mao, Y.; Wang, K. ERA5 precipitation over China: Better relative hourly and daily distribution than absolute values. J. Clim. 2024, 37, 1581–1596. [Google Scholar] [CrossRef]
- Hersbach, H.; Bell, B.; Berrisford, P.; Hirahara, S.; Horányi, A.; Muñoz-Sabater, J.; Nicolas, J.; Peubey, C.; Radu, R.; Schepers, D.; et al. The ERA5 global reanalysis. Q. J. R. Meteorol. Soc. 2020, 146, 1999–2049. [Google Scholar] [CrossRef]
- Jiang, Q.; Li, W.; Fan, Z.; He, X.; Sun, W.; Chen, S.; Wen, J.; Gao, J.; Wang, J. Evaluation of the ERA5 reanalysis precipitation dataset over Chinese Mainland. J. Hydrol. 2021, 595, 125660. [Google Scholar] [CrossRef]
- Muñoz-Sabater, J.; Dutra, E.; Agustí-Panareda, A.; Albergel, C.; Arduini, G.; Balsamo, G.; Boussetta, S.; Choulga, M.; Harrigan, S.; Hersbach, H.; et al. ERA5-Land: A state-of-the-art global reanalysis dataset for land applications. Earth Syst. Sci. Data 2021, 13, 4349–4383. [Google Scholar] [CrossRef]
- Lavers, D.A.; Simmons, A.; Vamborg, F.; Rodwell, M.J. An evaluation of ERA5 precipitation for climate monitoring. Q. J. R. Meteorol. Soc. 2022, 148, 3152–3165. [Google Scholar] [CrossRef]
- ERA5 Hourly Data on Single Levels from 1940 to Present. Available online: https://cds.climate.copernicus.eu/datasets/reanalysis-era5-single-levels?tab=download (accessed on 12 September 2024).
- Wu, Z.; Chen, K.; Ji, P.; Zhao, H.; Sun, X. MSFFT-Net: A multi-scale feature fusion transformer network for underwater image enhancement. J. Vis. Commun. Image Represent. 2025, 107, 104355. [Google Scholar] [CrossRef]
- He, D.; Shi, Q.; Xue, J.; Atkinson, P.M.; Liu, X. Very fine spatial resolution urban land cover mapping using an explicable sub-pixel mapping network based on learnable spatial correlation. Remote Sens. Environ. 2023, 299, 113884. [Google Scholar] [CrossRef]
- Talab, M.A.; Awang, S.; Najim, S.A.D.M. Super-low resolution face recognition using integrated efficient sub-pixel convolutional neural network (ESPCN) and convolutional neural network (CNN). In Proceedings of the 2019 IEEE International Conference on Automatic Control and Intelligent Systems (I2CACIS), Selangor, Malaysia, 29 June 2019; IEEE: Piscataway, NJ, USA; pp. 331–335. [Google Scholar]
- He, D.; Zhong, Y.; Wang, X.; Zhang, L. Deep convolutional neural network framework for subpixel mapping. IEEE Trans. Geosci. Remote Sens. 2020, 59, 9518–9539. [Google Scholar] [CrossRef]
- Dong, C.; Loy, C.C.; He, K.; Tang, X. Image Super-Resolution Using Deep Convolutional Networks. IEEE Trans. Pattern Anal. Mach. Intell. 2015, 38, 295–307. [Google Scholar] [CrossRef]
- Shi, W.; Caballero, J.; Huszár, F.; Totz, J.; Aitken, A.P.; Bishop, R.; Rueckert, D.; Wang, Z. Real-time single image and video super-resolution using an efficient sub-pixel convolutional neural network. In Proceedings of the IEEE Conference on Computer Vision and Pattern Recognition, Las Vegas, NV, USA, 27–30 June 2016; pp. 1874–1883. [Google Scholar]
- LeCun, Y.; Touresky, D.; Hinton, G.; Sejnowski, T. A theoretical framework for back-propagation. In Proceedings of the 1988 Connectionist Models Summer School; Morgan Kaufmann: Burlington, MA, USA, June 1988; Volume 1, pp. 21–28. [Google Scholar]
- Kaur, G.; Sinha, R.; Tiwari, P.K.; Yadav, S.K.; Pandey, P.; Raj, R.; Vashisth, A.; Rakhra, M. Face mask recognition system using CNN model. Neurosci. Inform. 2022, 2, 100035. [Google Scholar] [CrossRef]
- Lu, J.; Tan, L.; Jiang, H. Review on convolutional neural network (CNN) applied to plant leaf disease classification. Agriculture 2021, 11, 707. [Google Scholar] [CrossRef]
- Yin, W.; Kann, K.; Yu, M.; Schütze, H. Comparative study of CNN and RNN for natural language processing. arXiv 2017, arXiv:1702.01923. [Google Scholar]
- Anumol, C.S. Advancements in CNN Architectures for Computer Vision: A Comprehensive Review. In Proceedings of the 2023 Annual International Conference on Emerging Research Areas: International Conference on Intelligent Systems (AICERA/ICIS), Kanjirapally, India, 16–18 November 2023; IEEE: Piscataway, NJ, USA; pp. 1–7. [Google Scholar]
- He, K.; Zhang, X.; Ren, S.; Sun, J. Deep residual learning for image recognition. In Proceedings of the IEEE Conference on Computer Vision and Pattern Recognition, Las Vegas, NV, USA, 27–30 June 2016; pp. 770–778. [Google Scholar]
- He, K.; Zhang, X.; Ren, S.; Sun, J. Identity mappings in deep residual networks. In Proceedings of the Computer Vision–ECCV 2016: 14th European Conference, Amsterdam, The Netherlands, 11–14 October 2016; Part IV 14. Springer International Publishing: Cham, Switzerland, 2016; pp. 630–645. [Google Scholar]
- Liu, C.; Wang, J.; Wang, J.; Yarahmadi, A. Accurate modeling of crude oil and brine interfacial tension via robust machine learning approaches. Sci. Rep. 2024, 14, 28800. [Google Scholar] [CrossRef] [PubMed]
- Wang, Q.; Shen, C.; Tang, C.; Guo, Z.; Wu, F.; Yang, W. Machine learning-based forecasting of ground surface settlement induced by metro shield tunneling construction. Sci. Rep. 2024, 14, 31795. [Google Scholar] [CrossRef] [PubMed]
- Yu, D.; Kong, H.; Leung, J.C.H.; Chan, P.W.; Fong, C.; Wang, Y.; Zhang, B. A 1D Convolutional Neural Network (1D-CNN) Temporal Filter for Atmospheric Variability: Reducing the Sensitivity of Filtering Accuracy to Missing Data Points. Appl. Sci. 2024, 14, 6289. [Google Scholar] [CrossRef]
- Pearson, K. VII. Mathematical contributions to the theory of evolution.—III. Regression, heredity, and panmixia. Philosophical Transactions of the Royal Society of London. Ser. A Contain. Pap. A Math. Phys. Character 1896, 187, 253–318. [Google Scholar]
- Huynh-Thu, Q.; Ghanbari, M. Scope of validity of PSNR in image/video quality assessment. Electron. Lett. 2008, 44, 800–801. [Google Scholar] [CrossRef]
- Wang, Z.; Bovik, A.C.; Sheikh, H.R.; Simoncelli, E.P. Image quality assessment: From error visibility to structural similarity. IEEE Trans. Image Process. 2004, 13, 600–612. [Google Scholar] [CrossRef]
- Agbo, E.P.; Edet, C.O. Meteorological analysis of the relationship between climatic parameters: Understanding the dynamics of the troposphere. Theor. Appl. Climatol. 2022, 150, 1677–1698. [Google Scholar] [CrossRef]
- Zhao, S.; Wu, L.; Xiang, Y.; Dong, J.; Li, Z.; Liu, X.; Tang, Z.; Wang, H.; Wang, X.; An, J.; et al. Coupling meteorological stations data and satellite data for prediction of global solar radiation with machine learning models. Renew. Energy 2022, 198, 1049–1064. [Google Scholar] [CrossRef]
- Polanco-Martínez, J.M.; Fernández-Macho, J.; Medina-Elizalde, M. Dynamic wavelet correlation analysis for multivariate climate time series. Sci. Rep. 2020, 10, 21277. [Google Scholar] [CrossRef]
- Ukhurebor, K.E.; Azi, S.O.; Aigbe, U.O.; Onyancha, R.B.; Emegha, J.O. Analyzing the uncertainties between reanalysis meteorological data and ground measured meteorological data. Measurement 2020, 165, 108110. [Google Scholar] [CrossRef]
- Kukreja, V.; Solanki, V.; Baliyan, A.; Jain, V. WeatherNet: Transfer learning-based weather recognition model. In Proceedings of the 2022 International Conference on Emerging Smart Computing and Informatics (ESCI), Pune, India, 9–11 March 2022; pp. 1–5. [Google Scholar]
- Pal, S.K.; Dutta, D. Transfer Learning in Weather Prediction: Why, How, and What Should. J. Comput. Cogn. Eng. 2024, 3, 324–347. [Google Scholar] [CrossRef]
- Ho, J.; Jain, A.; Abbeel, P. Denoising diffusion probabilistic models. Adv. Neural Inf. Process. Syst. 2020, 33, 6840–6851. [Google Scholar]
Disclaimer/Publisher’s Note: The statements, opinions and data contained in all publications are solely those of the individual author(s) and contributor(s) and not of MDPI and/or the editor(s). MDPI and/or the editor(s) disclaim responsibility for any injury to people or property resulting from any ideas, methods, instructions or products referred to in the content. |
© 2025 by the authors. Licensee MDPI, Basel, Switzerland. This article is an open access article distributed under the terms and conditions of the Creative Commons Attribution (CC BY) license (https://creativecommons.org/licenses/by/4.0/).