1. Introduction
Artificial intelligence, particularly large language models (LLMs), is an important topic in the computer industry at present. Despite the numerous fears and dogmas surrounding AI, it is certain that it has become integral to our life. This paper focuses on a specific area within AI development: open-source models. While open-source software is well-defined, the concept of open-source AI remains ambiguous and subject to interpretation. The term has been applied to various models with different levels of accessibility, ranging from those with publicly available code and weights to models that impose limitations on use and distribution through restrictive licenses. There is considerable debate on whether this type of technology should be universally accessible. Our aim was to investigate whether the open-source community is actively contributing to the field, regardless of differing philosophical convictions. Due to their substantial computational requirements, running LLMs on personal computers was previously impractical. However, the development of increasingly compact versions with impressive capabilities is leading to a significant transformation. It is now feasible to run your own model, provided it is sufficiently small, on a home computer’s graphics processing unit (GPU), even if the GPU is several years old [
1].
In the field of LLMs, the open-source community relies heavily on the willingness of large corporations to release their models in the open-source domain. This transition is understandably hindered by challenges from competitive markets, as well as the high barrier to entry, given that developing such models requires a significant investment in both time and money [
1,
2].
Recent advancements in open-source models have significantly reduced the performance gap between them and proprietary models. Manchanda et al. [
3] demonstrated that open-source models achieve comparable results to closed models on many benchmarks and project that they may reach or exceed proprietary performance in the near future. Similarly, Epoch AI [
4] estimates that open-source models currently lag behind proprietary models by approximately 15 months. However, they anticipate that this disparity will continue to diminish over time.
The distinction between open and proprietary models has significant implications for AI governance. Models with publicly available weights foster broader research collaboration and enable modifications tailored to specific tasks. In contrast, proprietary models remain restricted to large corporations, which can leverage private datasets and advanced infrastructure to drive innovation. While open-source contributions enable iterative improvements, concerns persist regarding their potential misuse and security risks. Proprietary models, on the other hand, offer controlled environments but lack the transparency needed for independent audits and bias mitigation.
To clarify these distinctions, it is useful to categorize AI models based on accessibility and use. Fully open-source models provide unrestricted access to code, weights, and documentation, allowing for modification and redistribution. In practice, however, no major AI company has released models that include all training data alongside model weights. Another group consists of models with publicly available weights, which allow for fine-tuning and adaptation but do not disclose training processes or datasets. Mistral and Llama models fall into this category, offering weight access while retaining proprietary datasets. In contrast, proprietary models remain fully closed, typically accessible only through APIs or enterprise licenses. GPT-4, Claude, and Gemini exemplify this category, where users can interact with the system but lack control over its implementation.
Proponents of closed source argue that unrestricted availability of OSMs could pose significant risks if misused, enabling the creation of tools that are potentially harmful to society. However, arguments in support of OSMs highlight the importance of transparency and fostering innovation to allow for broader scrutiny of model behavior. Additionally, the incremental improvement of open models would allow for participation in the incremental development of guardrails for these models. Regardless of where readers fall on the spectrum, there is value in supporting these opinions and ideas with data-driven analysis.
With the release of multiple OSMs, the need for objective metrics to evaluate their performance has become increasingly important. In response, the open-source community has developed various metrics to assess performance across different task domains, such as mathematics, logic, and medicine. Hugging Face (
https://huggingface.co/, accessed on 1 March 2025) has emerged as the primary platform where the open-source community shares contributions, including models, datasets, and methods. It also serves as a hub for benchmarking models and facilitating research.
This study examines the influence of open AI development by analyzing contributions made to publicly available models. The objective is to quantify the impact of community modifications and to determine whether open AI models continue to evolve through collaborative efforts. The analysis also explores patterns in model development and adoption, offering insights into the broader trends shaping AI research. Understanding these dynamics is essential for industry leaders, researchers, and policymakers seeking to navigate the future of AI openness. Accordingly, we identified the following research questions:
Does the open-source community influence the development of LLM models?
Is it possible to quantify this impact in terms of performance?
Can we observe patterns and trends for possible future directions?
2. Literature Review
Due to its continuous growth, Hugging Face has emerged as the leading platform for sharing machine learning (ML) and artificial intelligence (AI) models, resulting in increasing levels of complexity. A relational database called HFCommunity was established to facilitate the analysis and resolution of this issue [
5].
Castaño et al. [
6] conducted research with a similar goal, focusing on temporal changes on Hugging Face. They examined various trends, including fluctuations in user count, models, commits, and overall platform activities. Additionally, they analysed model maintenance, and categorised them into two groups. They used all Hugging Face data accessible via the HF Hub, in addition to the HFCommunity database established by [
5]. However, their study overlooked the influence of Hugging Face on the AI community.
The article by Patel et al. [
1] highlights the significance of the open-source AI community and explains its rapid growth in the wake of major industry leaders like Google, Microsoft, and OpenAI. A significant milestone in this area was the release of the Llama model, and the open-source community promptly recognised the possibilities and potential involved in this release.
Fine-tuning has become a critical strategy for adapting large language models (LLMs) to specific tasks while leveraging the extensive knowledge embedded in pre-trained models. Numerous studies on open-source language models have proposed a parameter-efficient approach to fine-tuning, which greatly reduces the computational resources required when adapting the model to a specific task, making fine-tuning more accessible to larger number of people. Fine-tuning is especially prominent in the Hugging Face ecosystem, where models can be adapted for diverse applications with minimal overhead [
7].
In addition to fine-tuning, merging models has gained attention as a technique for integrating the capabilities of multiple models for broader applicability. Wang et al. [
8] systematically explored strategies for effectively merging large language models, highlighting the potential for combining complementary models to address complex tasks. Hugging Face serves as a central hub for this practice, providing tools to combine checkpoints and enable cross-model functionality.
The article [
9] examines the security risks associated with open-source AI. A much higher number of repositories with high vulnerabilities were found compared to those with low vulnerabilities, particularly in root repositories. This emphasises the importance of ensuring the security of the technology in order to facilitate its utilisation.
In a recent paper [
10], the authors analysed the transparency of Hugging Face’s pre-trained models regarding database usage and licenses. The analysis revealed that there is often a lack of transparency regarding the training datasets, inherent biases, and licensing details in pre-trained models. Additionally, this research identified numerous potential licensing conflicts involving client projects. Of the 159,132 models analysed, merely 14 percent of these models clearly identified their datasets with specific tags. A detailed examination of a statistically significant sample comprising 389 of the most frequently downloaded models showed that 61 percent documented their training data in some form.
4. Results
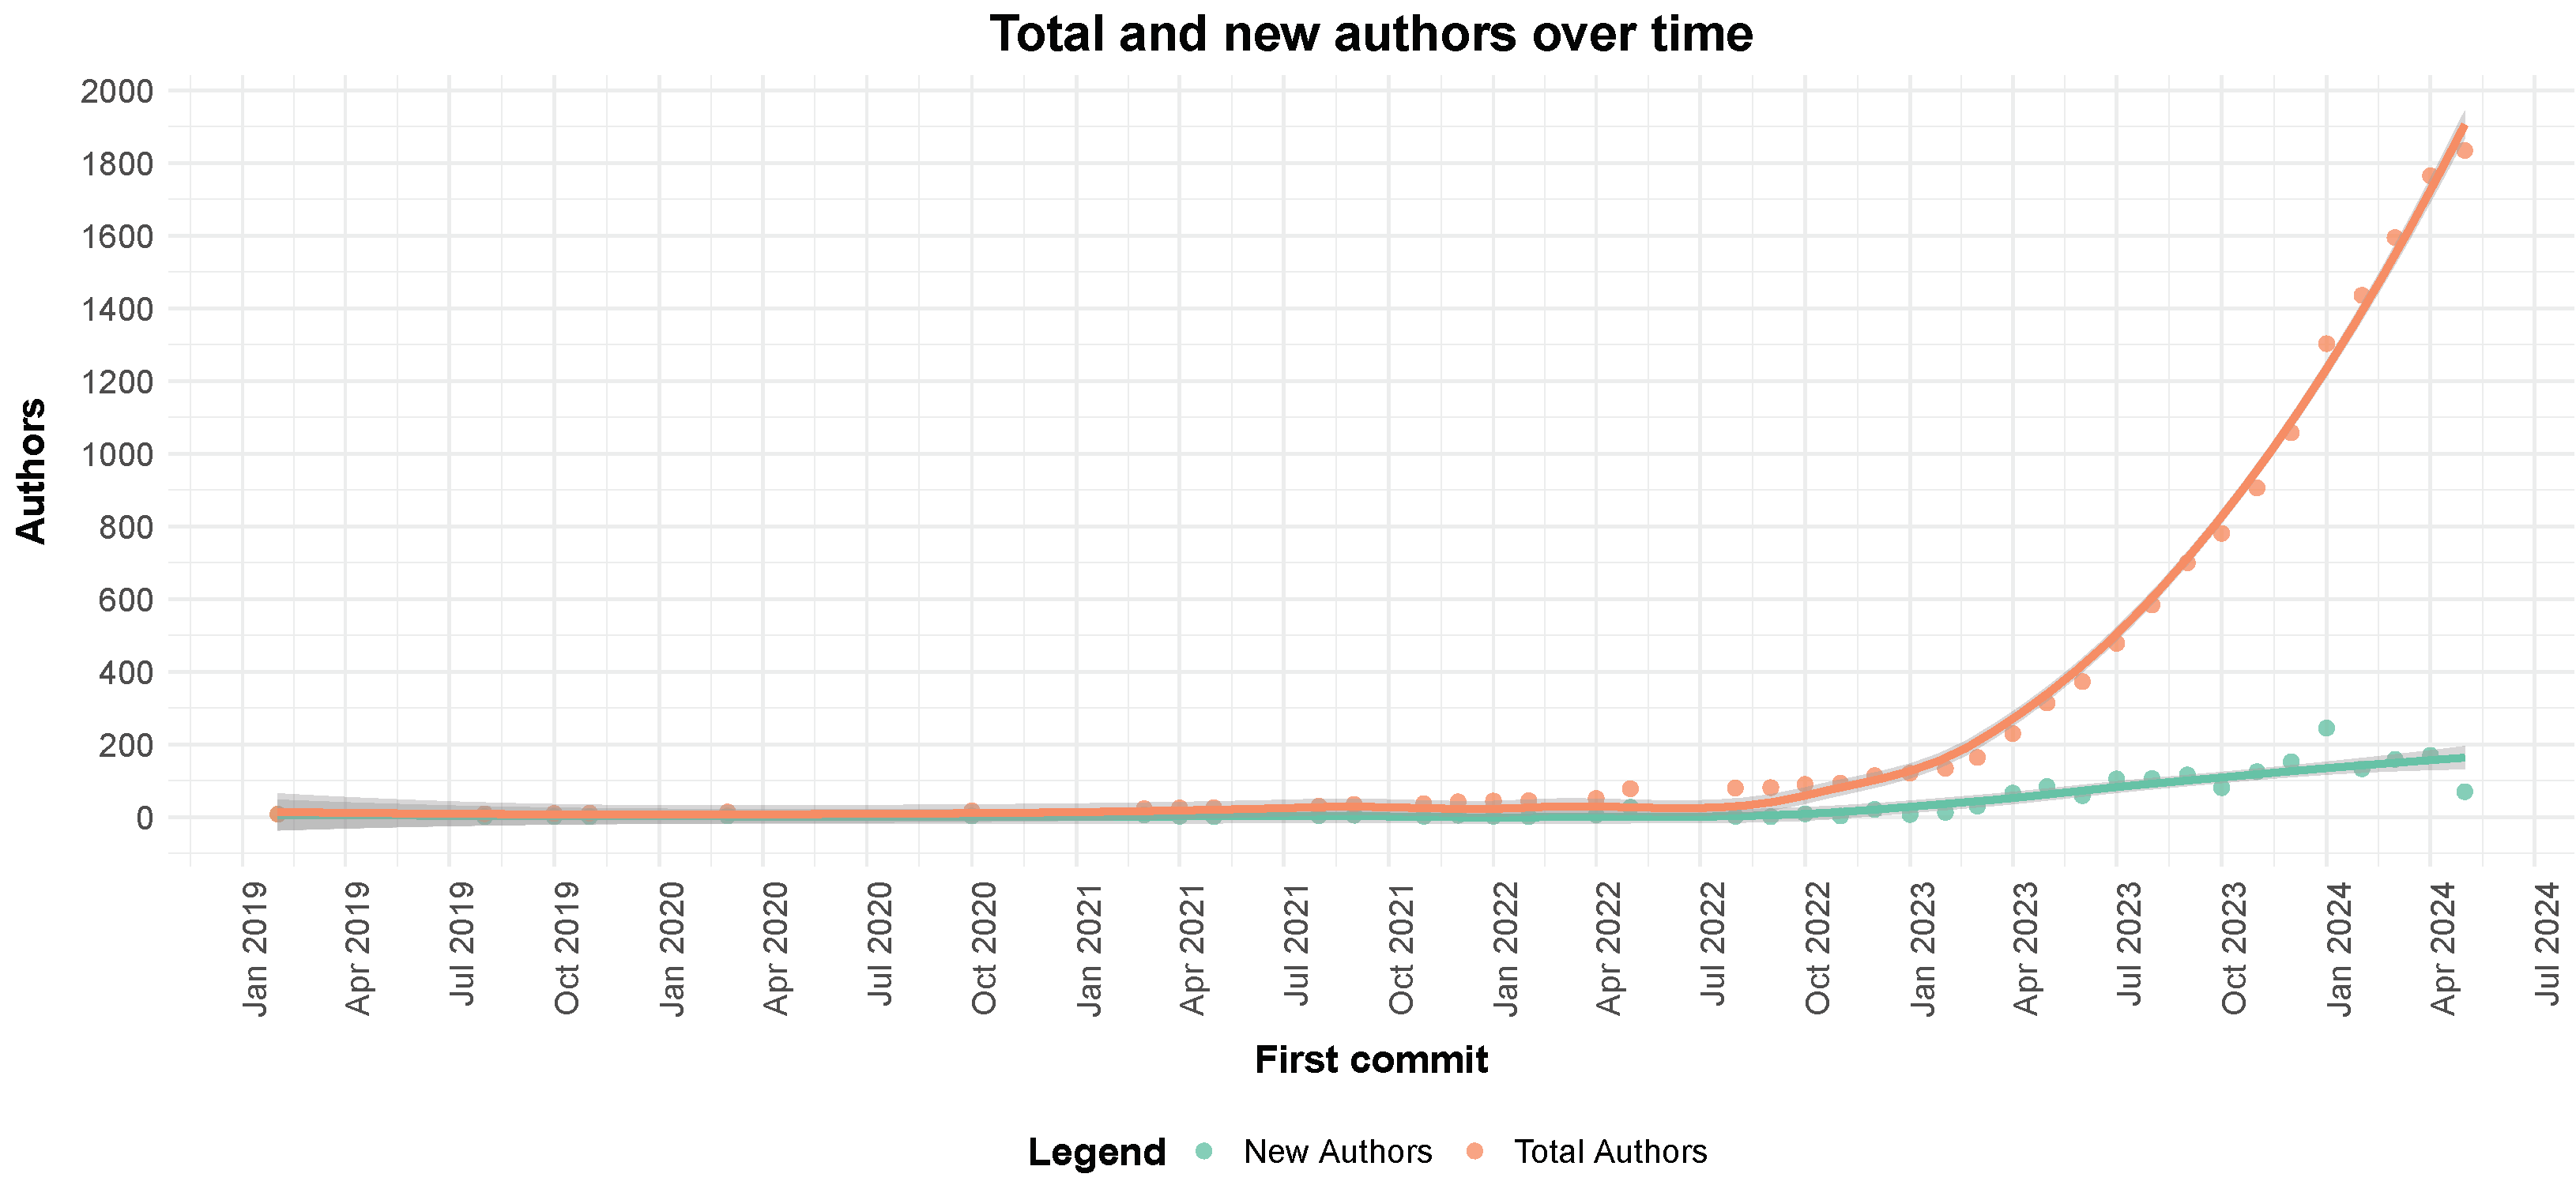
The results clearly demonstrate the rapid expansion of the open-source community in artificial intelligence, evidenced both by the number of authors and models. As for the number of authors, we cannot claim that the total number of users on Hugging Face follows the same trend, but it is clear that this area is becoming increasingly competitive as more and more distinct users appear on the leaderboard each day. As we can see in
Figure 1, the total number of users and new authors has been rapidly increasing per day. Since mid 2023, both have shown a linear increase, indicating that the LLM leaderboard is following the same trend as the Hugging Face platform, as analysed by Castaño et al. [
6] in their research.
The distribution of repositories among authors in
Figure 2 and
Figure 3 shows that the activity of authors is far from a normal distribution. The histogram shows a highly right-skewed distribution, where out of a total of 1829 authors, the top 10 users were responsible for 8% of the total models, while the top 200 contributed to around 50% of the total models. This concentration of users within a small circle raises concerns about the diversity and inclusivity within the community. It also reflects Price’s law, which states that most of the work is typically performed by a small fraction of the workforce.
Despite the significant increase in contributors, their collaboration is at a sub-optimal level. As shown in
Figure 3, a large number of repositories are created and maintained by a single profile. The distribution is highly skewed toward individual contributions, suggesting a lack of coordinated efforts that include several contributors. This pattern represents the challenges faced by collaborative networks within this community, primarily due to technological difficulties. Additionally, it is common for models to be published by smaller research teams that are frequently attributed to a single individual or profile. Even when models are the product of team effort, these teams are often closed and do not foster open collaboration, which limits the flow of ideas and expertise within the community. While publishing models on platforms like Hugging Face facilitate some level of collaboration, it often involves individuals or teams working independently rather than collectively coordinating efforts. Based on the findings, it would be beneficial to concentrate on promoting more integrated and collaborative approaches to enhance the potential and expand the boundaries of the open-source community.
We were particularly interested in the types of models represented on the leaderboard. Hugging Face categorises models into five types: pre-trained, continually pre-trained, fine-tuned on domain-specific datasets, chat models, and base merges and merges.
Figure 4 highlights trends in model types over time. The prevailing pattern indicates a constant yet uneven increase in the number of newly released models. It is evident that there have been no instances of unknown types in recent months. This suggests that the open-source community is increasingly adopting a more rigorous and professional approach. The fine-tuned models and chat models seem to represent a larger proportion of the models. However, it is important to note that the dataset represents models submitted for the leaderboard benchmark testing and not the whole Hugging Face ecosystem. This suggests that the sample includes models for which the authors believed they could compete with the best-performing models on the platform. Therefore, it can be reasonably assumed that the models in the sample are competitive in terms of performance. Mergers, a relatively recent trend appears to be growing in popularity. This demonstrates a need within the community for more sophisticated and proficient models. As stated in the literature review, combining models can yield impressive results since each model specialises in specific tasks. The rationale behind merging these models is to create more comprehensive models.
In addition to analysing model types, we examined different model architectures.
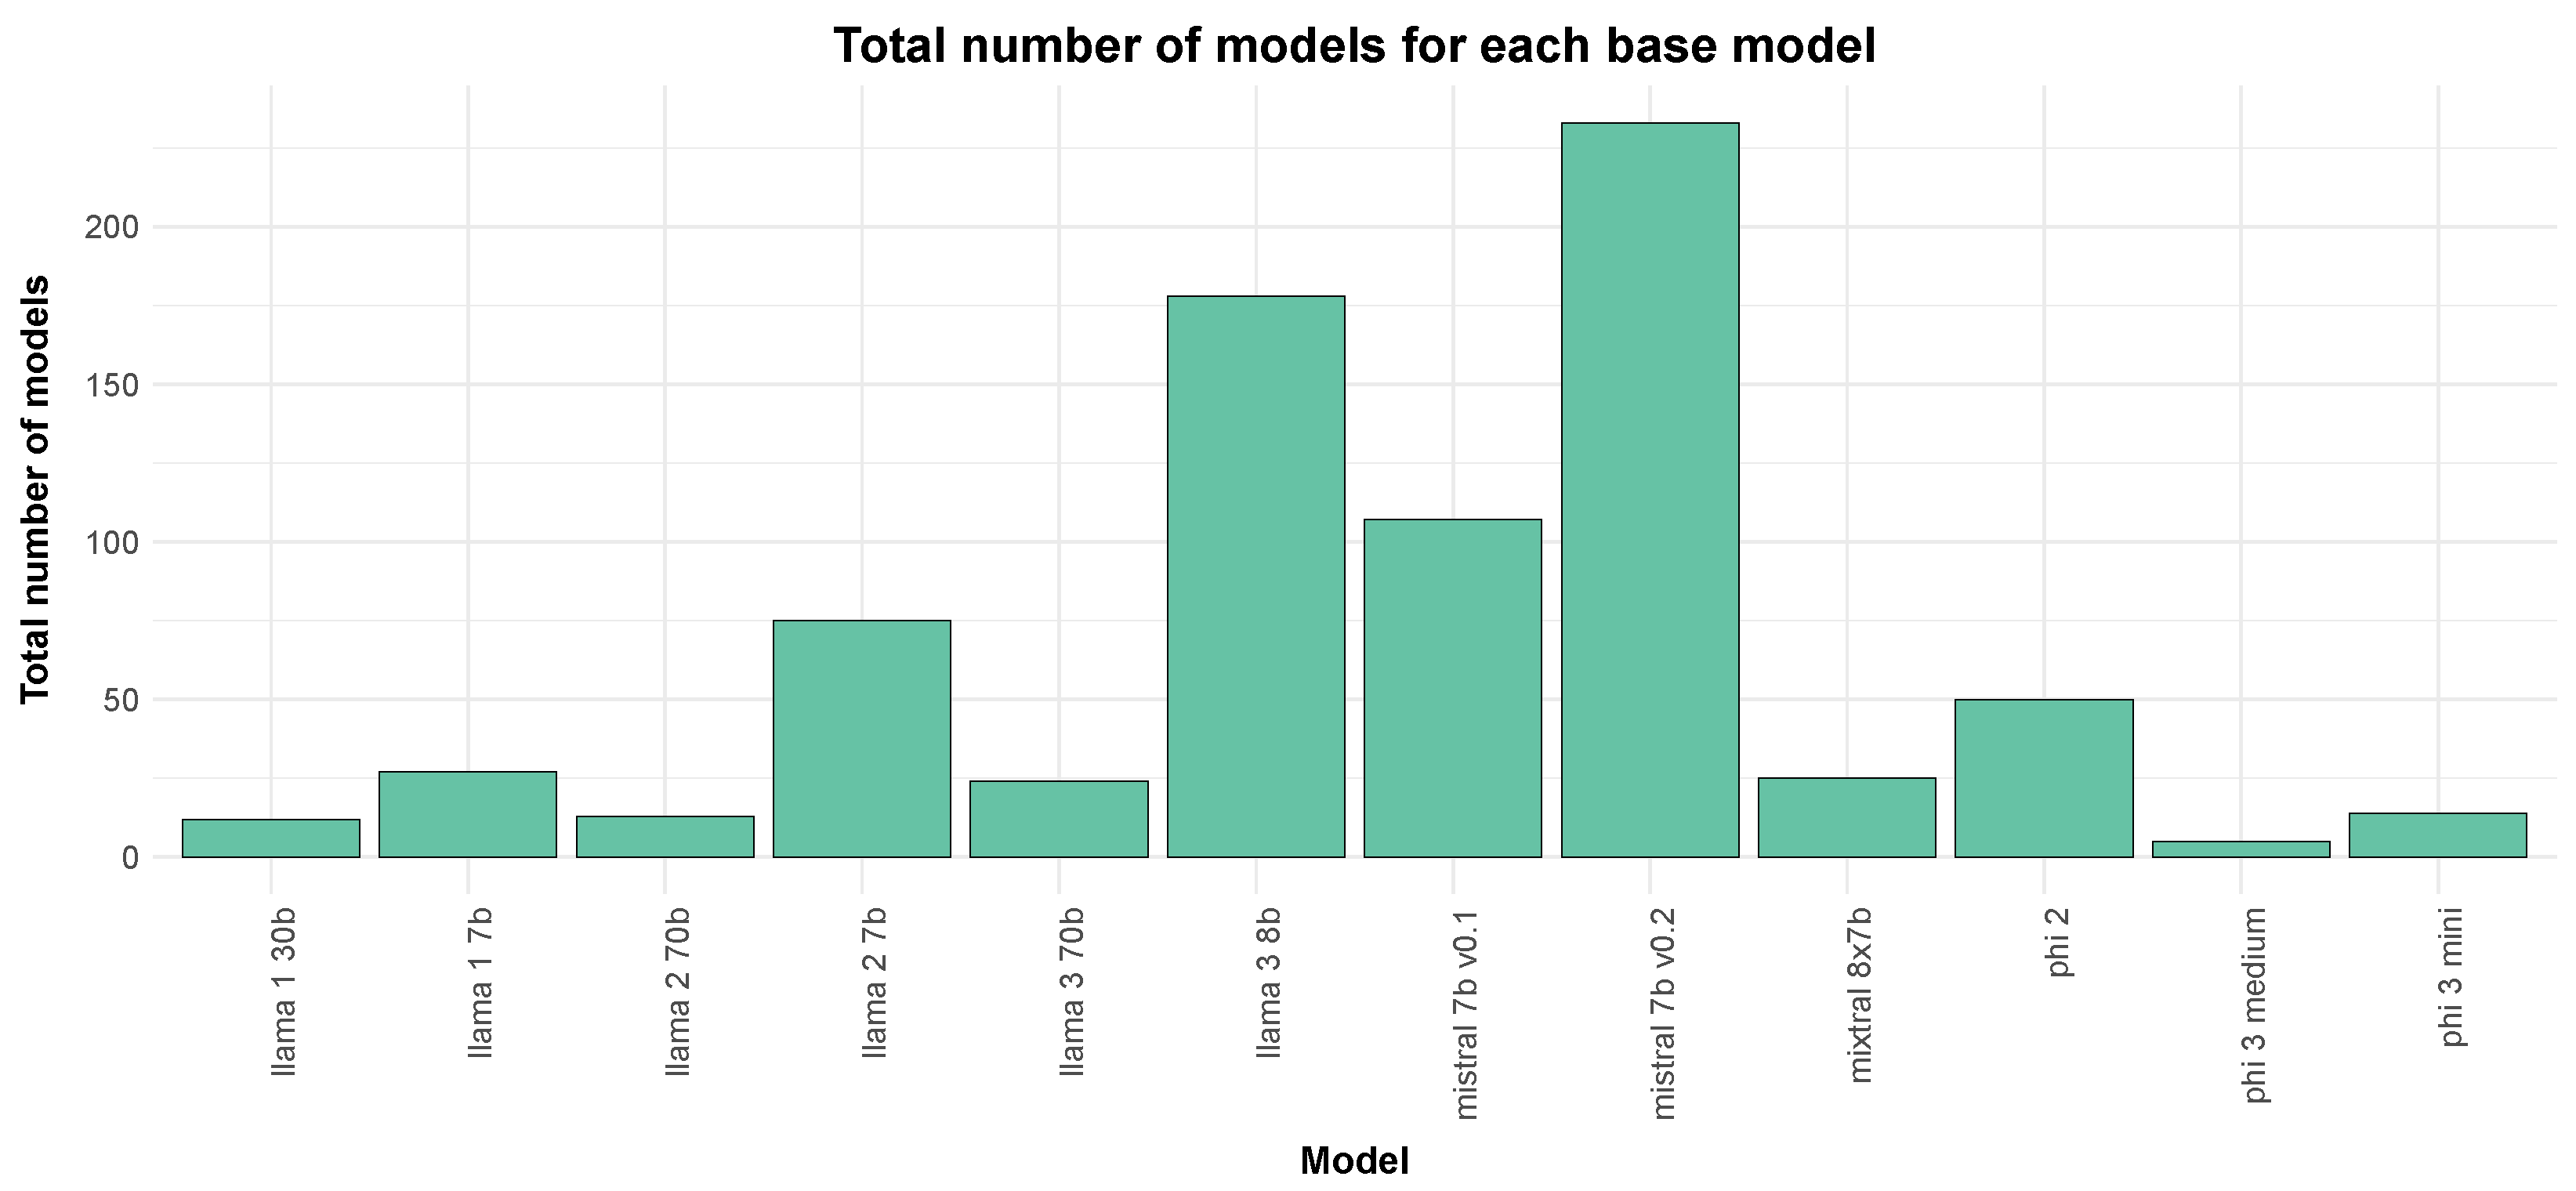
Figure 5 illustrates the weekly distribution of each important model architecture. Nine architectures were selected based on the frequency of occurrences: Gemma, GPT-2, Mistral, Opt, Phi, GPT-NeoX, Llama, Mixtral, and Qwen2. All architectures that contributed to a minimum of 5 percent of models were picked, and the remainder were categorised as ‘other’. Our analysis also considered significant model releases from the respective companies, as the introduction of new models can significantly impact the popularity of their architectures. This is particularly true for the most prominent architectures such as Llama and Mistral as shown in
Figure 6. The leaderboards include over 300 models that specify Mistral as the base model and over 200 that specify Llama3. Interestingly, when there is a new release from a popular source, a large portion of the experimental focus switches to the newly released model. However, not all releases trigger the same shift. The popularity of the source seems to play a large part in determining which model families tend to shift the experimentation in their favor. The Llama and Mistral models produced the largest shifts in popularity, while model families like Gemma and Phi received comparatively minor attention.
Table 5 presents the distribution of model licenses in the open-source ecosystem, showing the number of models under each license and their respective percentage of the total dataset of models on the leaderboard. The table also categorizes the models based on their licensing permissions for commercial, academic, and personal use. Apache 2.0 is the most prevalent license, covering 39% of the models, allowing for full commercial and academic use without restrictions. A significant portion (7.87%) falls under CC-BY-NC-4.0, which restricts commercial use while permitting academic and personal applications. Additionally, MIT and Llama model licenses also represent a sizable fraction, indicating a preference for permissive licensing within the community. Notably, certain models such as Llama2, Llama3, and Gemma have limited commercial use, requiring explicit permissions or compliance with specific conditions. A substantial portion of models (35.4%) are categorized under “Unknown License”. These models either do not specify their licensing terms or lack clearly defined usage permissions on the platform. This ambiguity raises concerns about their accessibility, compliance, and potential legal limitations, particularly for commercial applications where clear licensing is crucial. The high percentage of models with undefined licenses suggests a need for greater transparency and standardization in the ecosystem to ensure clarity for developers, researchers, and organizations looking to use these models.The table highlights the interplay between licensing choices and the broader accessibility of models, suggesting that while many models are open-source, their usage conditions vary significantly.
The availability of metadata and training data has shifted over time, reflecting both improvements in transparency and persistent challenges in open AI development. While the number of models with clearly defined licensing and benchmark scores has increased, critical details such as training datasets and fine-tuning methodologies remain inconsistently reported. Our analysis found that a substantial portion of models lack explicit licensing terms (labeled “Unknown License”), suggesting gaps in documentation that could affect the usability of these models for different stakeholders. Additionally, while major contributors like Meta and Mistral provide access to model weights, they do not disclose full training datasets, limiting the reproducibility of results and independent verification of biases. This indicates that while accessibility has improved in some respects, full transparency regarding data provenance and usage remains an unresolved issue.
It is important to note that an increase in the number of models on the platform does not necessarily indicate progress, but rather an increase in popularity. After examining the distribution of various model types, we attempted to assess their performance over time, based on the average score across the six benchmarks stated in the methodology. This is depicted in
Figure 7, which presents two aspects. The first aspect is the change in the average benchmark score for each model type over time. The individual dots denote the performance of a specific model, and a smooth line was added to indicate the average performance of the group that the model belongs to at a given time, making it easier to observe the temporal variations for a specific model type. It is evident that most categories improved their benchmark scores over time. Currently, the majority of the dots are clustered in the upper section of the y-axis, within an accuracy range of 60 to 80 percent. The smoothed results exhibit a similar trend. However, the one exception is the ’base mergers and mergers’ category, which failed to achieve a significant rise in score. This may be due to its relatively recent introduction and its initial high position compared to others.
The visualisation in
Figure 7, illustrates the cumulative quantity of models for each model type over time. Unsurprisingly, fine-tuned models constitute the majority, since this represents the most straightforward approach to model development. Pre-trained models are relatively few because developing a competitive model from scratch is extremely difficult as it requires superior data and advanced hardware resources typically available only to large corporations. Interestingly, the number of merged models is rapidly approaching that of chat models, despite their increase, beginning in 2024.
Being at the top of the leaderboard is often highlighted, but it does not tell the whole story. Models of various sizes occupy positions across the leaderboard, with many impressive achievements found in the lower ranks of the absolute benchmark scores. Therefore, the impact of model size on its popularity was examined next.
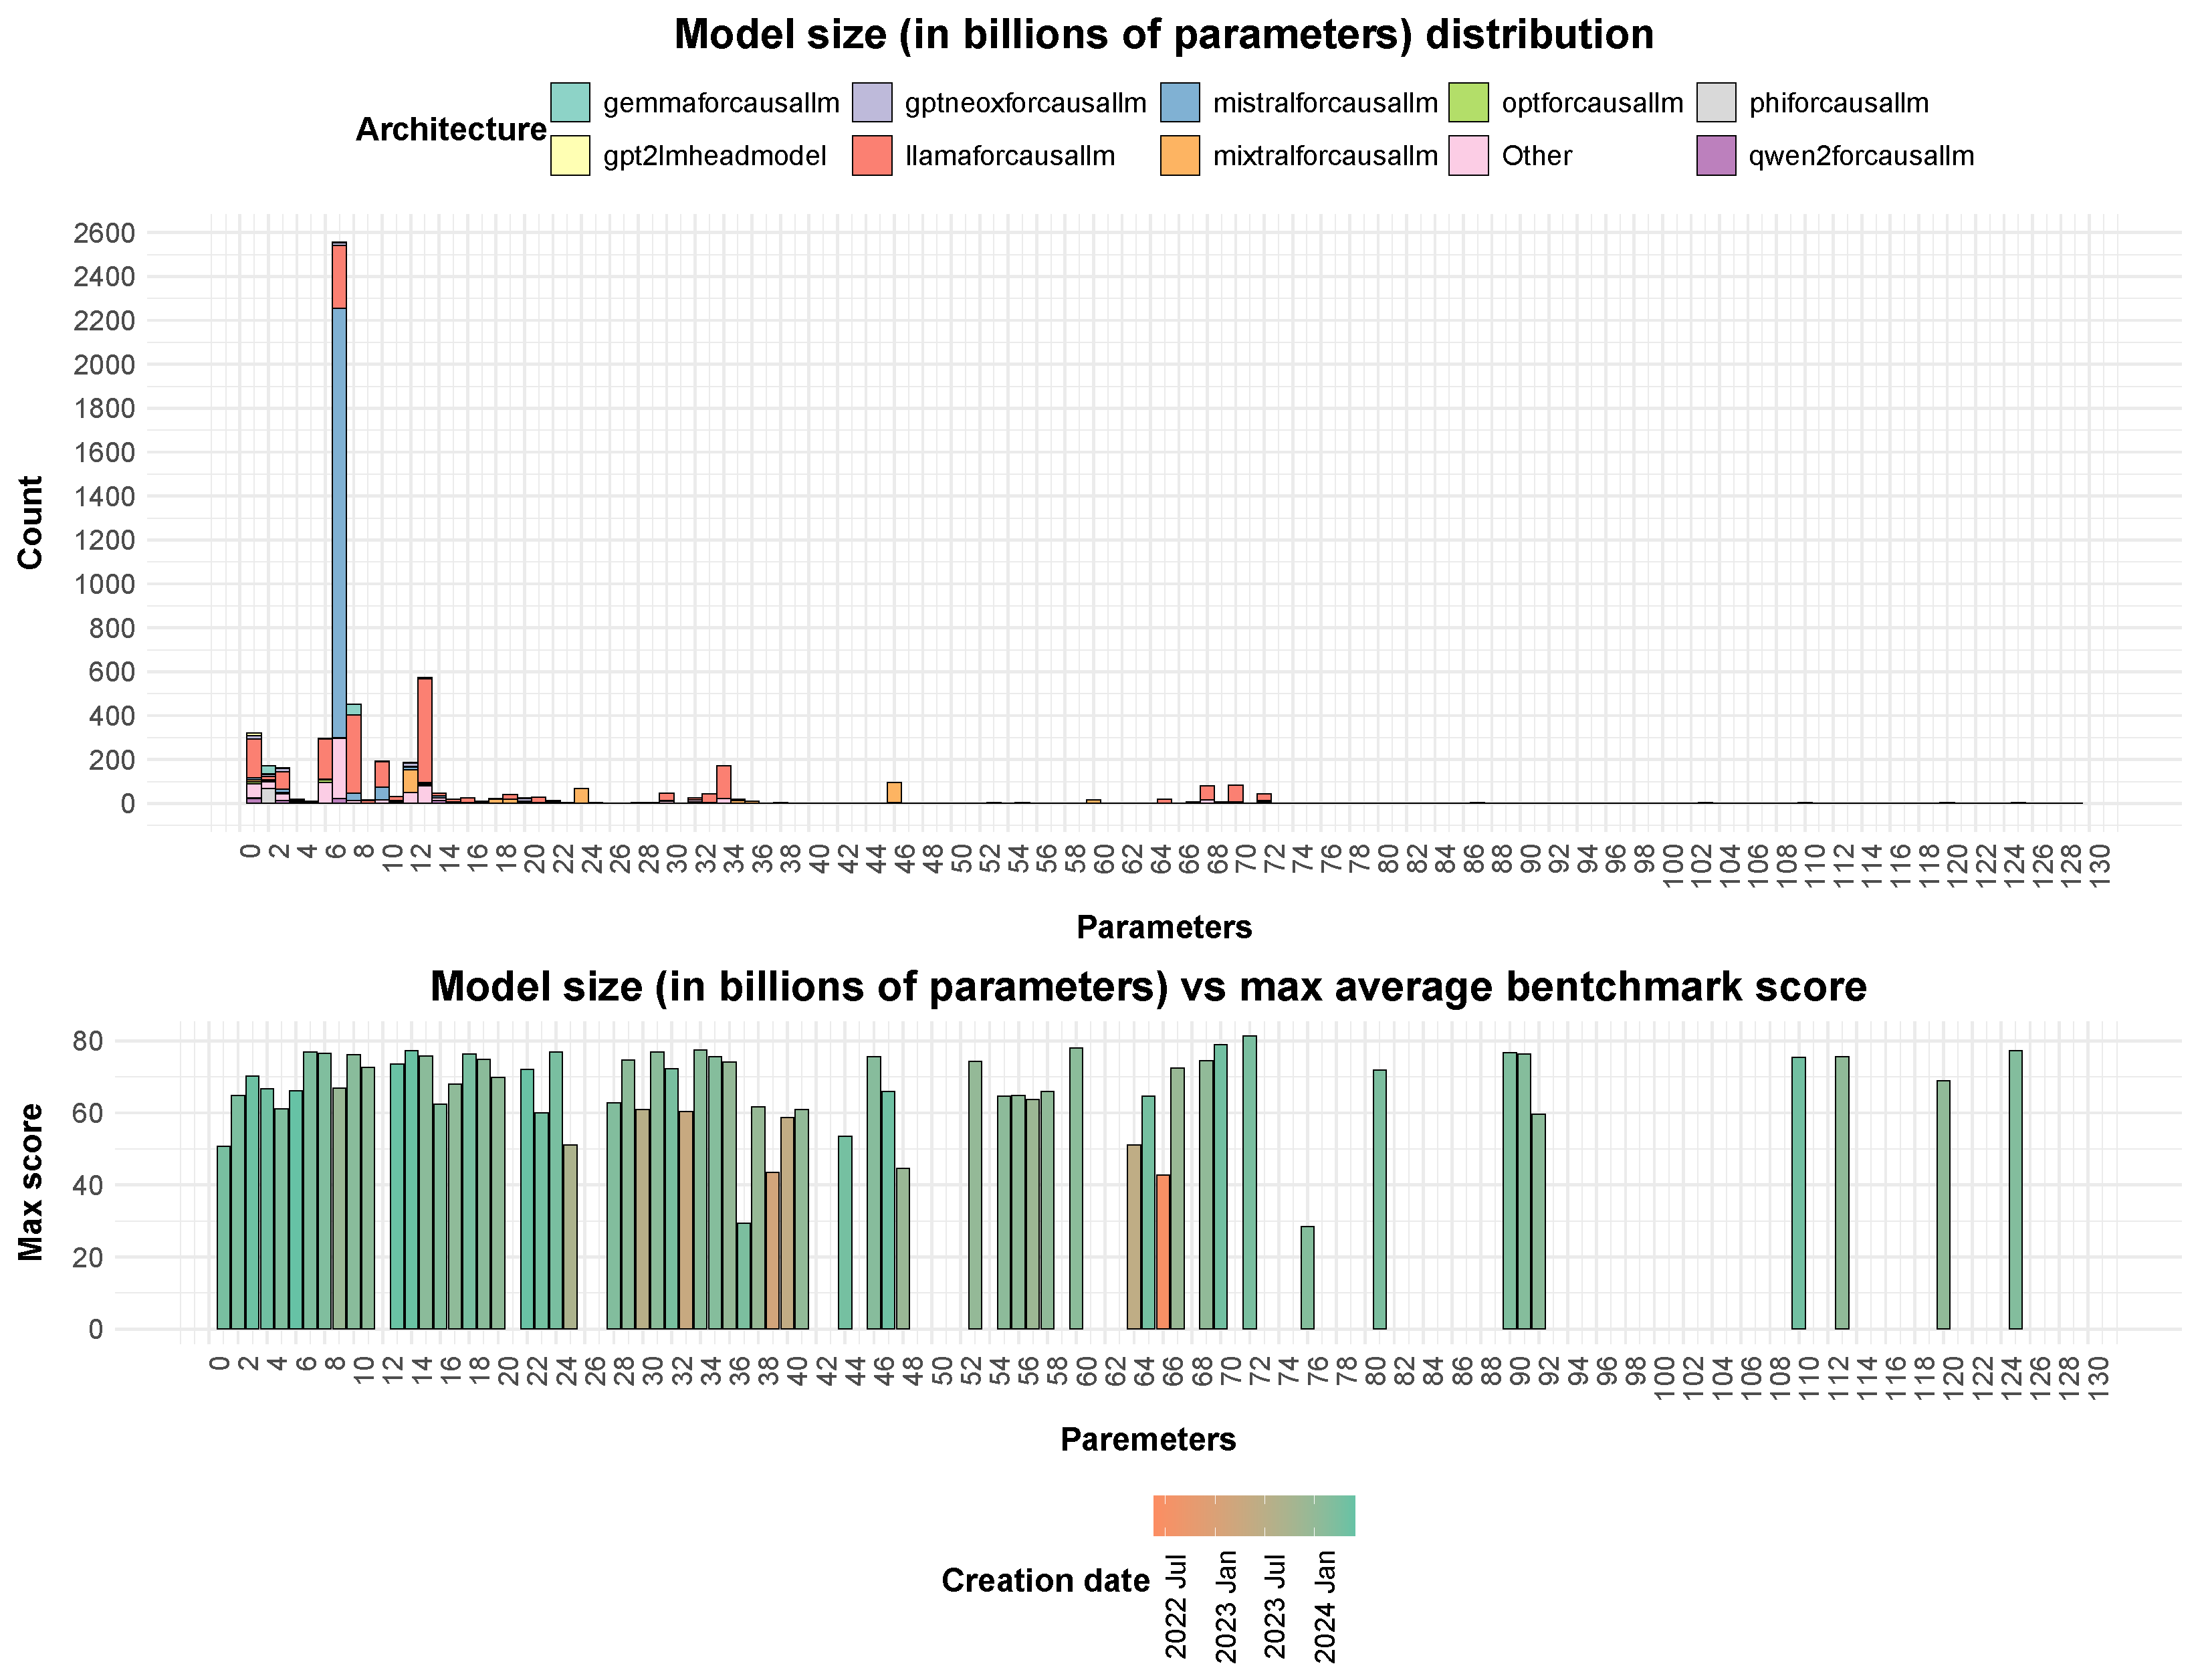
Figure 8 illustrates the distribution of models based on the number of parameters, with bars colour-coded according to model architecture. The data suggests that most of the models have less than twenty billion parameters, which indicates that smaller models are favored. This pattern could be attributed to the users’ ability to run the models on local machines, as well as the ease of adapting them using free resources provided by services like Google Colab [
18] and Kaggle [
19]. Although a limited number of models exceed 100 billion parameters, they would not be visible on the histogram because of the substantial quantity of models with fewer than 20 billion parameters.
An interesting observation can be made in the second part of the figure, which highlights the best-performing model in each size category. Larger models do not significantly outperform smaller models. Some of the highest-performing models with fewer than 20 billion parameters achieve results comparable to larger and more sophisticated models. This is particularly true for the latest models, coloured light green.
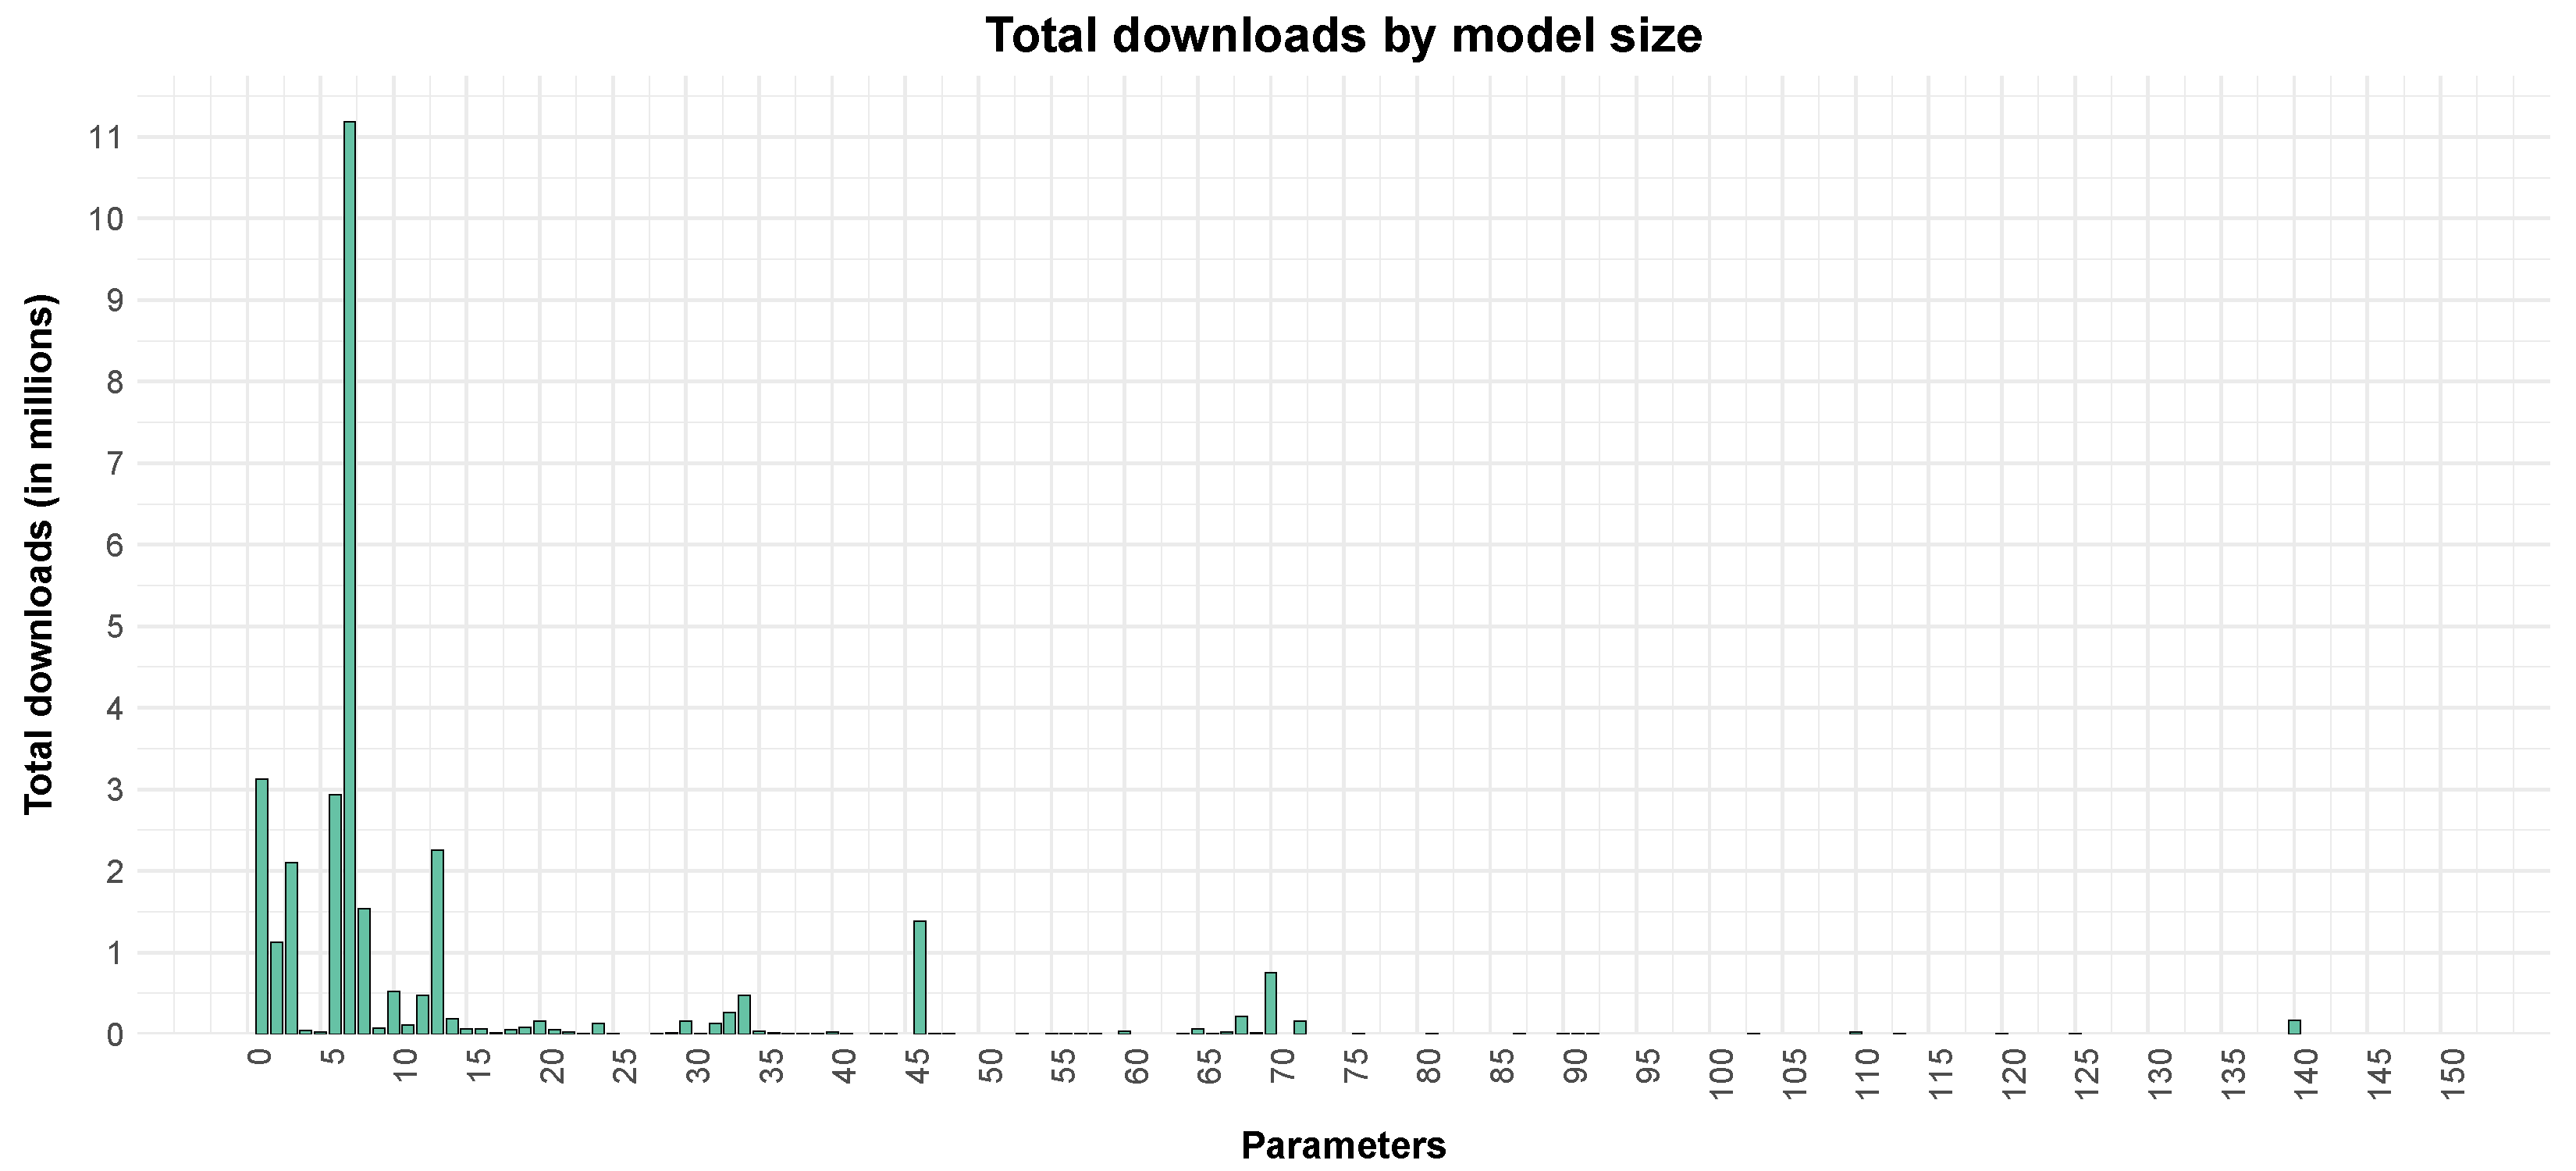
The distribution between model sizes is similar to the total number of downloads. Approximately 85% of all downloads are distributed among small models with at most 15 billion parameters, as can be seen in
Figure 9. This supports the hypothesis that the open-source community mainly interacts with the models that they can use in a local setting.
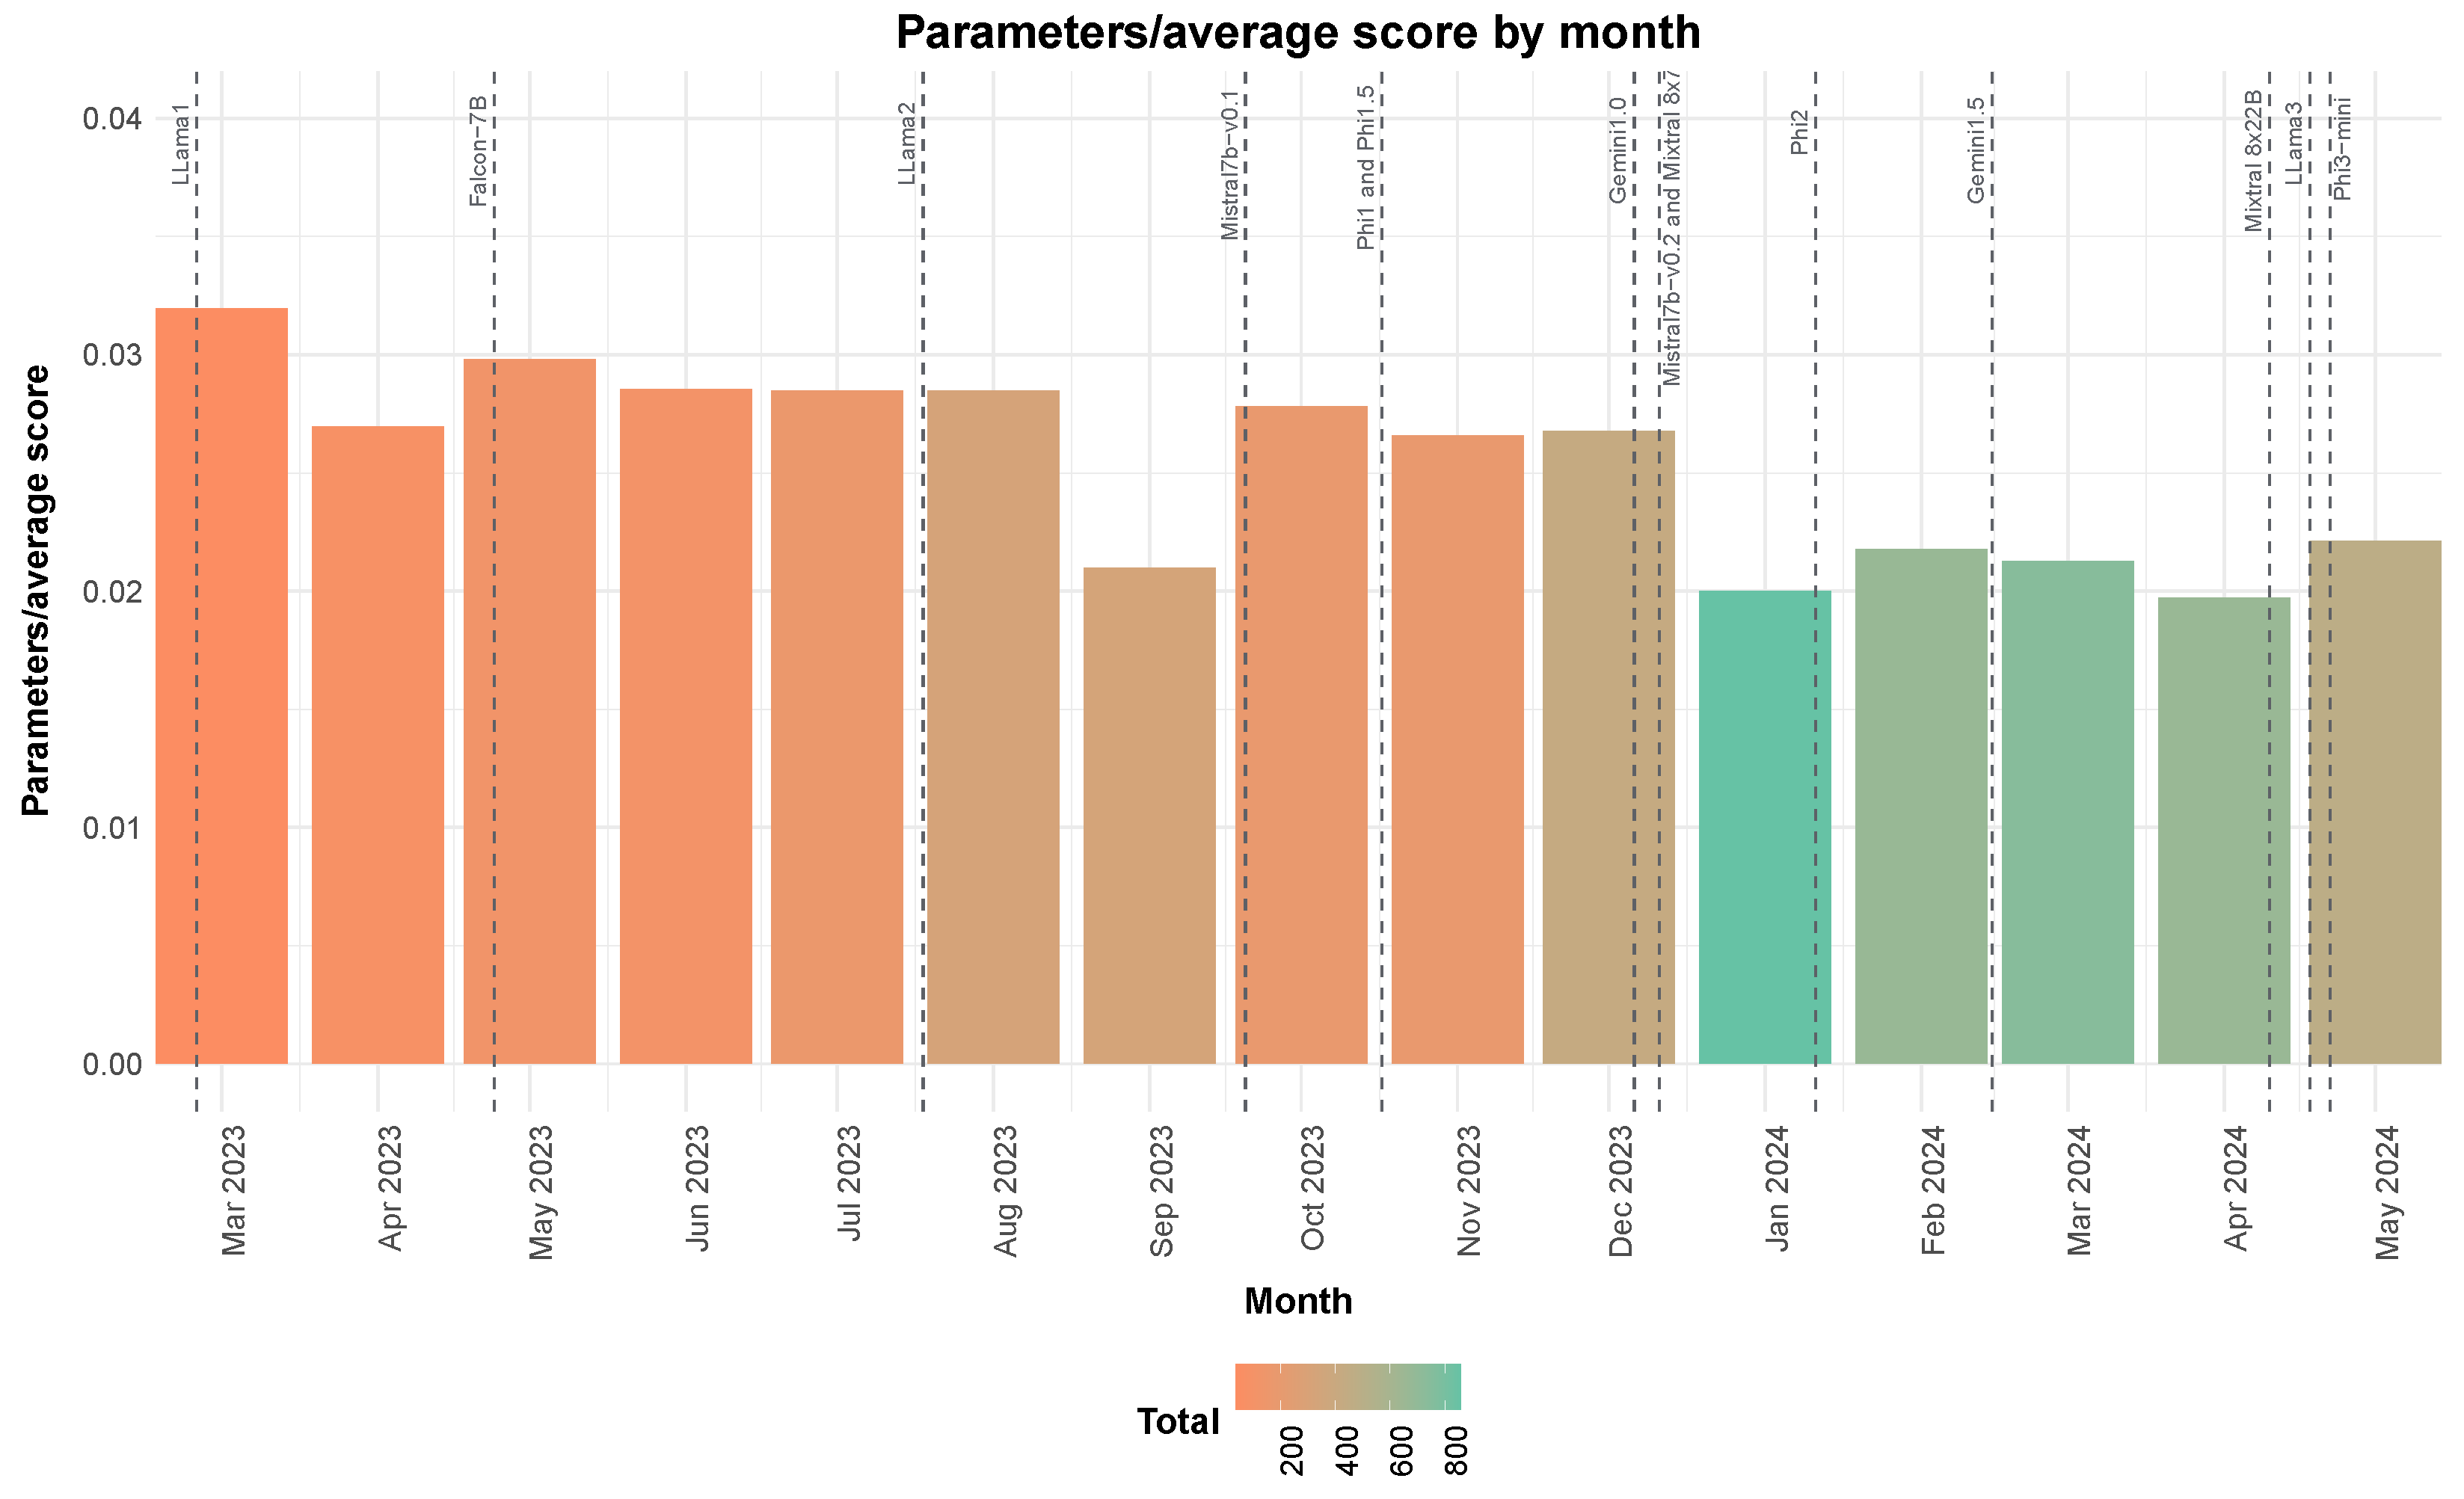
Figure 10 illustrates the number of parameters needed to achieve a given performance level, normalised by the average benchmark score for the best model uploaded in a given month. This information was used to assess how the capabilities of the models increase with time. The color gradient in the chart represents the total number of models uploaded during each time span. The analysis shows a progressive decrease in the average size of models required to achieve the same performance, indicating that comparable or superior scores are now achievable with smaller models. While this trend reflects the community’s attempt to improve the released models, it is largely a consequence of well-resourced groups developing better base models that serve as a basis for further experimentation. This is encouraging for the open-source community, as high-performance models are becoming increasingly accessible to people without large amounts of computing resources.
The most challenging task was measuring Hugging Face’s contributions to advancing the AI field, particularly the impact of individuals focused on enhancing existing base models rather than creating new ones from scratch. Given that the base model data of fine tunes are available for most leaderboard entries, we aimed to evaluate how significantly these contributors improved the most popular models through fine-tuning and other optimisation techniques. This analysis highlights the crucial role that community contributions play in refining and advancing AI capabilities, even when starting from pre-existing foundational models. Merges were excluded from this analysis because it was not possible to attribute specific contributions to the enhancement of the model. Often, merges did not include the base models or included only one. Additionally, some merged models were created from other merged models, with the same base model appearing in multiple merge steps, making it difficult to assess the improvement to specific base models.
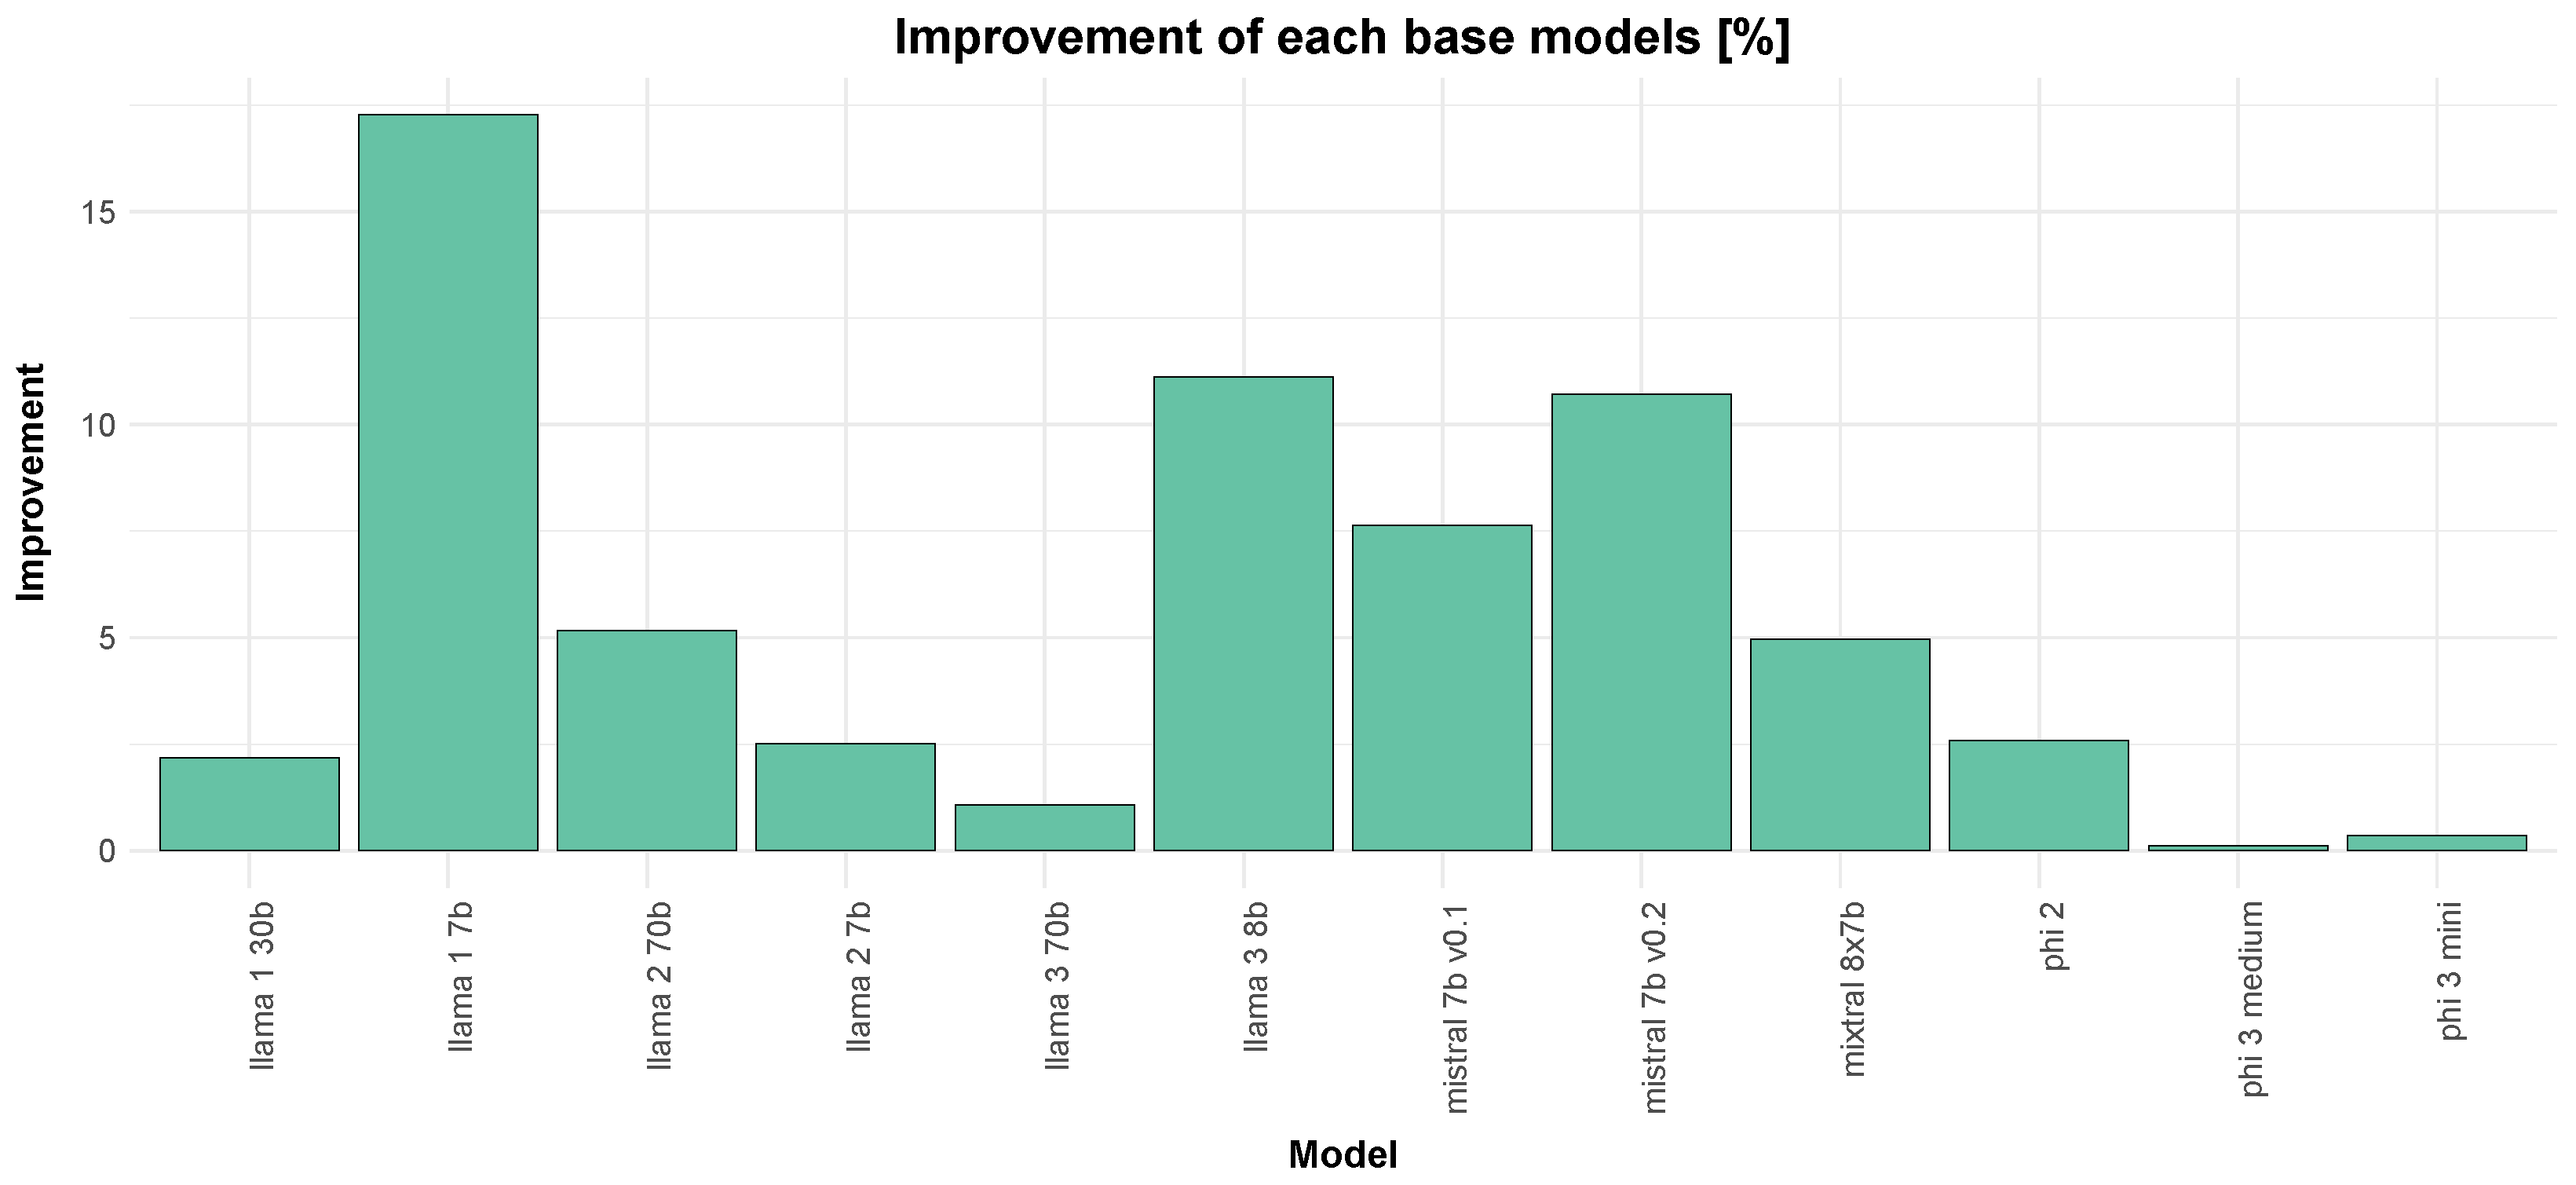
Based on
Figure 11, the total percentage improvement of each base model was analysed. Notably, Llama1 (7b parameters) and Mistral 7b parameters show the highest percentage improvements, demonstrating significant community engagement and successful fine-tuning efforts. In contrast, models like Phi 3 show minimal improvements, suggesting they may already be highly optimised, less susceptible, or less appealing for further fine-tuning by the community. When compared with
Figure 6, we can observe that the models with the highest improvements, such as Llama and Mistral, also have a substantial number of models derived from them. This correlation suggests that the community’s focus on these models has led to a higher number of derivative models and to significant performance enhancements. This highlights the synergistic effect. where popular base models attract more contributors, leading to more refined and optimised versions.
Interestingly, while Mistral and Llama3 have seen significant improvements and much experimentation, Llama1 shows the most improvement despite having a relatively lower number of models built upon it. This phenomenon could be attributed to several factors. Firstly, Llama1 might have been an early model that laid the groundwork for subsequent models, making it a foundational base model with much to improve on. Secondly, the community might have identified specific areas for improvement in Llama1 that were more straightforward to address, leading to substantial enhancements with fewer derivative models. Additionally, the model is older and at that time the community was still evolving, which reflects the amount of derivative work. However, in relative terms, it still represented a significant portion of all the models uploaded at that time.
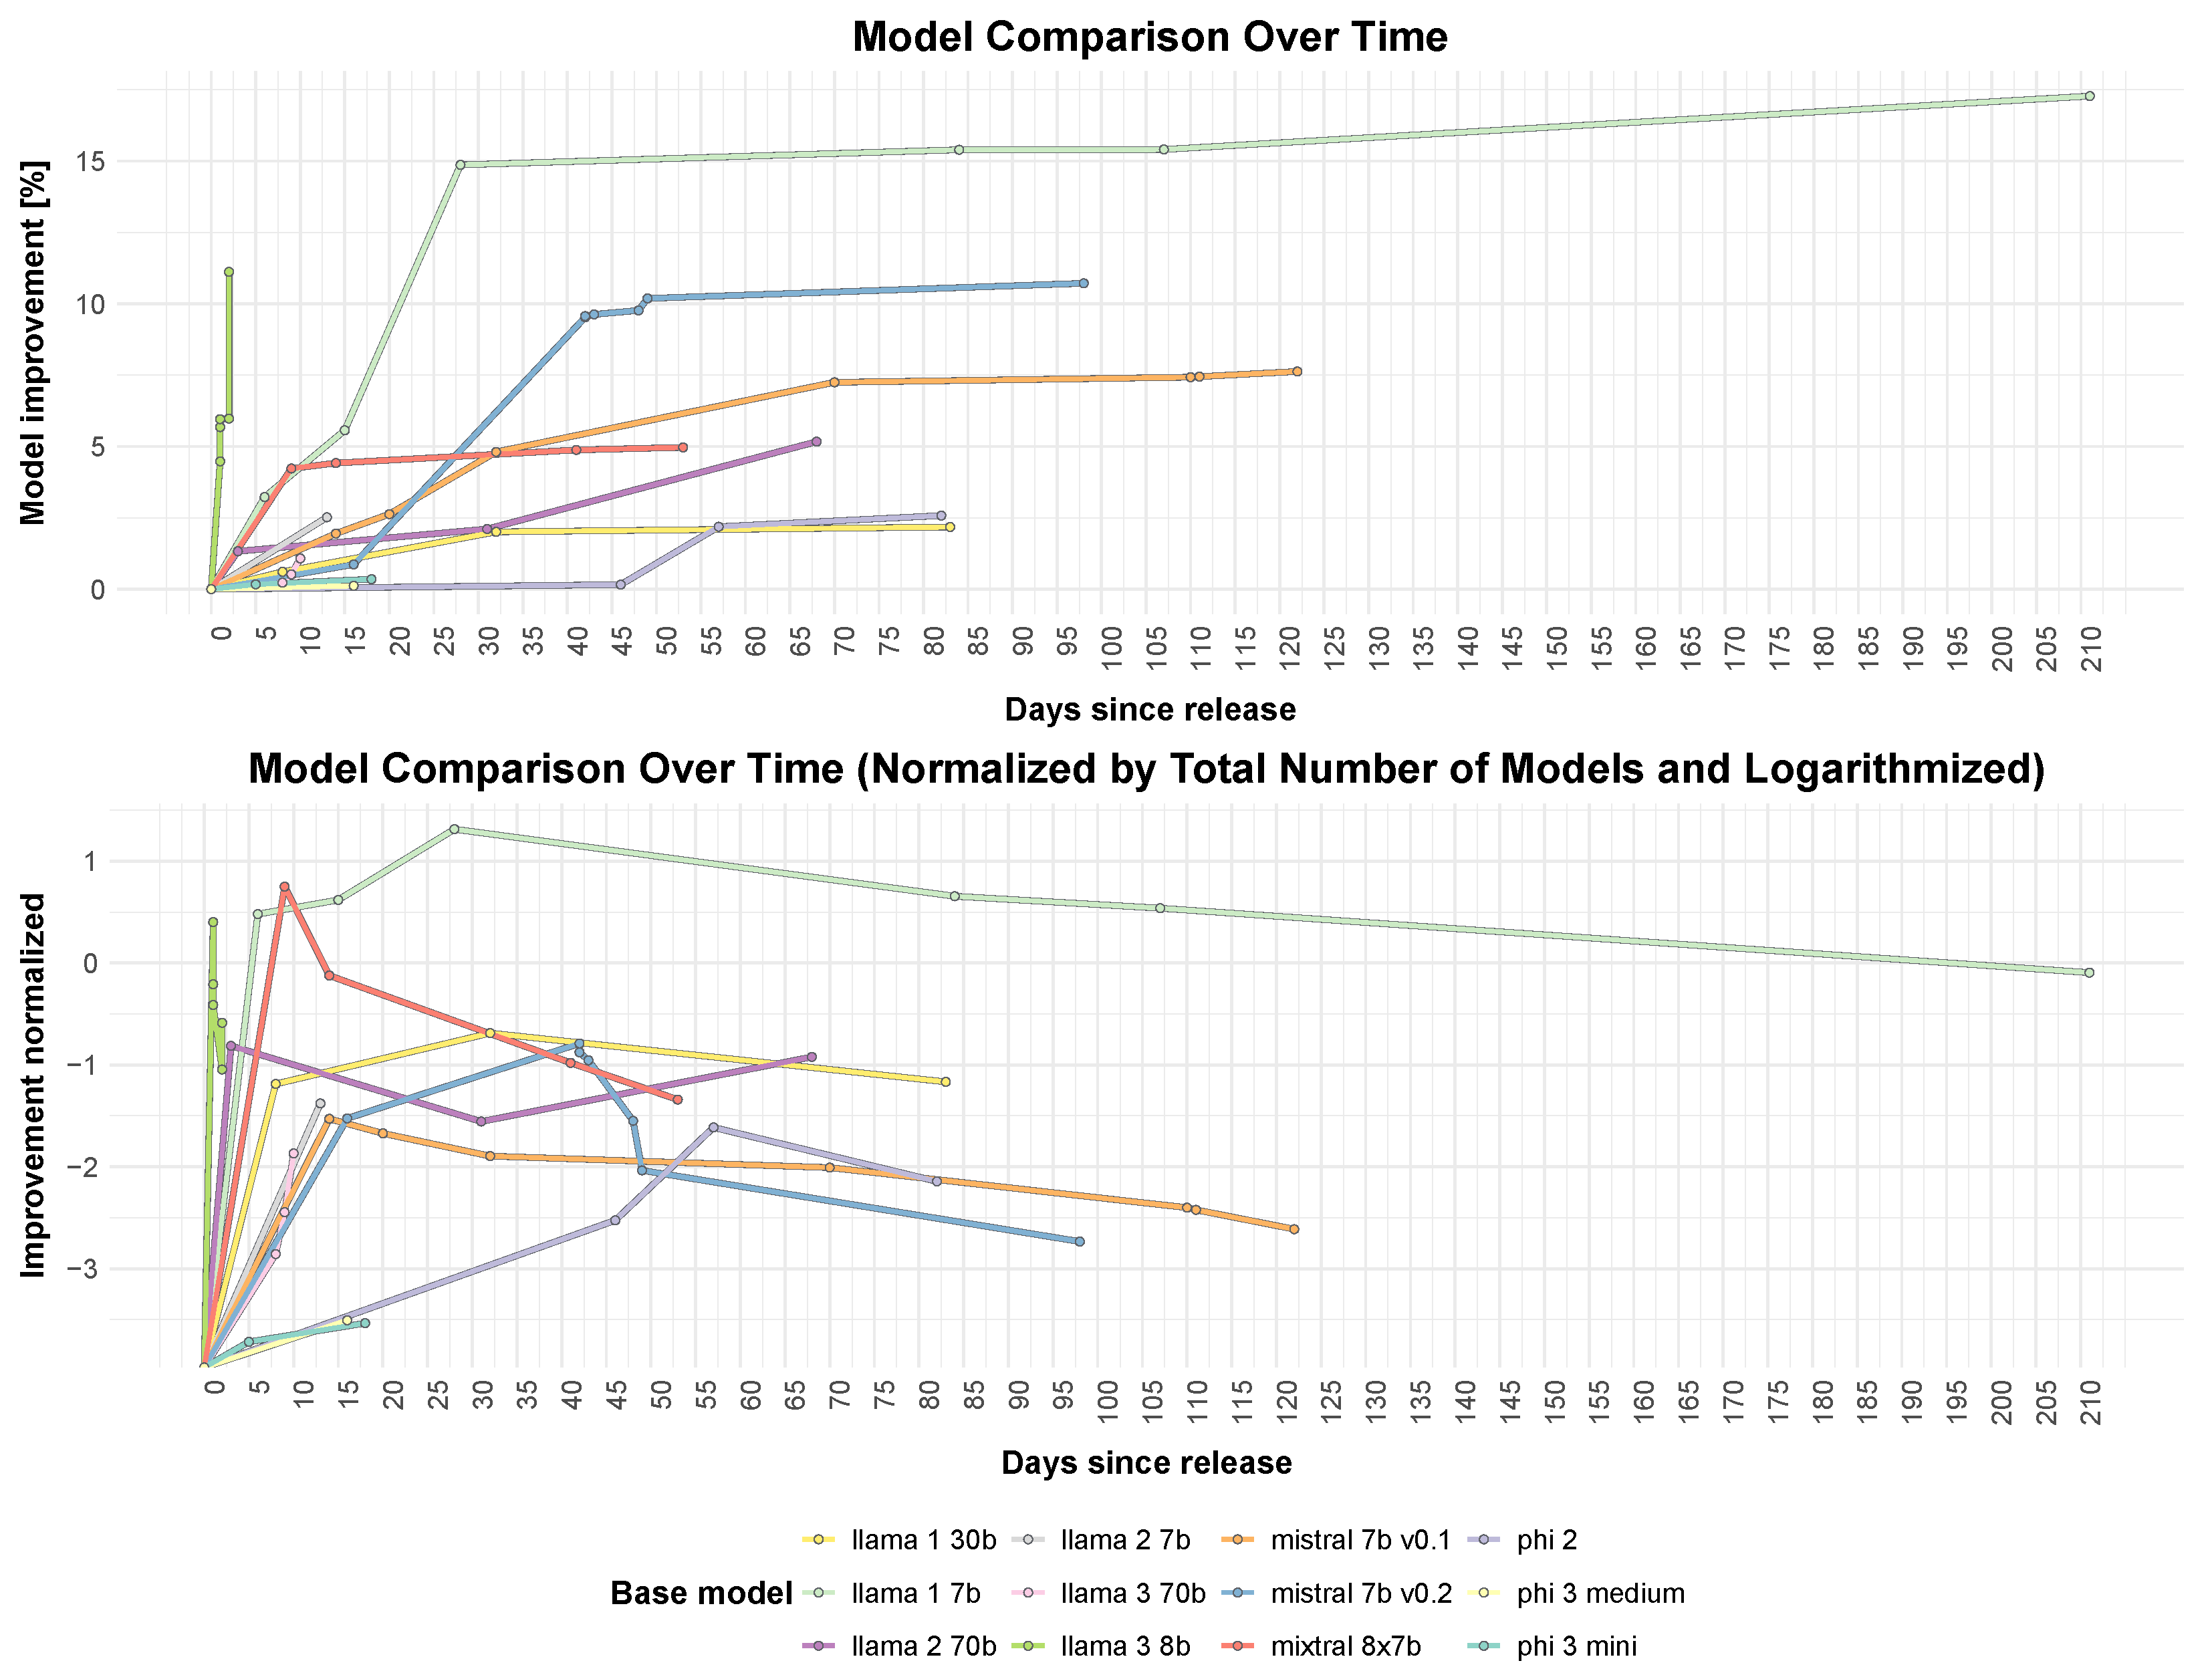
We then extracted the models released by Meta, Microsoft, and Mistral AI and identified all incremental upgrades that used these models as their base model and were subsequently fine-tuned to achieve improved average scores on benchmarks. Additionally, we incorporated the number of days elapsed since the release of the base model, as illustrated in
Figure 12. In the top section, we denote all the incremental increases to the models. In the bottom section, the same incremental improvements are presented, but normalized using the logarithm of the number of derivative models of the base model. This normalization is necessary to adjust for the varying popularity of base models and their differing levels of community engagement. A simple linear scaling would intuitively over-represent improvements for widely adopted models while under-representing those with fewer derivative models. Logarithmic scaling provides a more balanced comparison by accounting for diminishing returns, since initial fine-tuning efforts often yield substantial gains, but further improvements become progressively harder as models reach maturity. Several observations can be made here. For example, Llama3, featuring 8 billion parameters, experienced an enhancement above 10 percent within just a few days post release. This was likely influenced by the immense excitement that preceded its release to the public. According to the normalized trend, the community seems to exhaust most beneficial approaches in about one month after the release of a model. The exploitation does not stop after that point, but the improvements slow down. Mistral 7 billion and Llama1 were sustained and enhanced for an extended period following their release, with an approximate 15 percent enhancement during this period. This indicates that these models remain valuable and relevant to the community, with ongoing efforts to boost their performance. Furthermore, the excitement and anticipation surrounding the release of new models can drive rapid initial improvements, underscoring the importance of community engagement and the hype cycle in the open source AI ecosystem.
The data also highlights differences in the trainability of these models compared to, for example, phi models, which are relatively small and likely optimised to their fullest extent by Microsoft, or larger models that may exceed the resources available to most open-source contributors.
5. Discussion
The ongoing debate about the openness of AI models is critically important, as the implications of adopting either extreme—completely closed or fully open—are profound. When addressing decisions of such significance, it is crucial to consider as many factors as possible. This paper aims to contribute to the discussion by offering insights through a data-driven approach. While we strive to maintain objectivity in interpreting the results, some conclusions are clear and are thus emphasized.
Our findings indicate that the open-source community is expanding rapidly, attracting talent from across the world. This influx of contributors plays a vital role in enhancing existing models and ensuring stable development in the future. Furthermore, the open-source community serves as a significant source of new ideas and approaches, which private enterprises can access freely. However, the openness of AI also introduces ethical challenges. Open-access models can be misused for harmful applications such as misinformation campaigns, cyberattacks, or deepfake generation. Additionally, bias in training data may be reinforced without strict oversight, potentially leading to unfair outcomes in sensitive applications. That said, open-source development allows for greater transparency, enabling researchers to detect and mitigate biases more effectively than in closed systems.
Businesses that develop proprietary AI models often focus on safeguarding intellectual property to maintain a competitive edge. We argue that traditional business models for proprietary software may not fully align with the unique characteristics of AI. A key distinction is the inability of the general public to privately run these models. Consequently, the future of AI development may lean toward a software-as-a-service (SaaS) model, where enterprises generate revenue from usage while benefiting from innovations originating in the open-source community.
Policymakers must navigate the dual challenge of preventing misuse while fostering innovation and competition. Unlike proprietary AI, which can enforce access controls, open-source models exist beyond the jurisdiction of any single entity, complicating regulatory efforts. Instead of imposing heavy restrictions that could stifle progress, a more balanced approach may involve community-driven safeguards and responsible disclosure practices to mitigate risks while keeping AI development open and accessible. The data highlight that open-source AI is rapidly expanding, reinforcing the need for structured AI governance to ensure that this growth remains beneficial and sustainable.
However, outside of academia, the usage permissions of the models remain a factor in determining the practical accessibility of open models. While many models are released under permissive licenses such as Apache 2.0 and MIT, a significant number impose restrictions on commercial use, limiting their broader adoption. Furthermore, a large portion of models on Hugging Face lack clearly defined licensing terms, creating legal uncertainties for businesses. This variation suggests that licensing choices influence how AI models are shared and used, but their broader impact remains uncertain. Future work should explore whether different licensing approaches affect innovation, accessibility, and ethical concerns, as well as how they shape interactions between open-source contributors and industry stakeholders.
Additionally, our analysis shows that most open models are derived from a few dominant base models, such as Mistral and Llama. This suggests that community efforts tend to concentrate around specific architectures, potentially limiting diversity in model development. Further research should investigate whether this trend results from technical advantages, community momentum, or other factors such as licensing conditions or corporate involvement.
Beyond governance and licensing, benchmarking remains an important aspect of evaluating AI progress. The Hugging Face leaderboard provides valuable insights into model performance, but future studies should assess whether these benchmarks accurately reflect real-world applications. Additionally, pairing this dataset with scientific literature could enable a deeper understanding of how novel AI methods emerge, evolve, and influence the broader research community.
Our analysis demonstrates that the open-source AI community is actively shaping model development, with measurable contributions to performance improvements and model diversity. At the same time, licensing constraints and governance challenges continue to influence how these models are adopted and used. These factors define the landscape of open AI, highlighting both its strengths and limitations.


