Article

Three-Dimensional Magnetic Inversion with Mixed Lp Norm Regularization for Constraining the Crustal Architecture of Mesozoic Volcanic Arc in the Northern South China Sea

1
Key Laboratory of Intraplate Volcanoes and Earthquakes (China University of Geosciences, Beijing), Ministry of Education, Beijing 100083, China
2
School of Geophysics and Information Technology, China University of Geosciences (Beijing), Beijing 100083, China
3
State Key Laboratory of Geological Processes and Mineral Resources, China University of Geosciences, Beijing 100083, China
*
Author to whom correspondence should be addressed.
Appl. Sci. 2025, 15(5), 2791; https://doi.org/10.3390/app15052791
Submission received: 24 December 2024 / Revised: 28 February 2025 / Accepted: 1 March 2025 / Published: 5 March 2025
(This article belongs to the Section Earth Sciences)

Abstract

:
The high-magnetic anomaly belt in the northern slope of the South China Sea has long been associated with a Mesozoic volcanic arc. However, its crustal architecture remains unclear, limiting the understanding of its geological implications. We assembled high-resolution reduced-to-the-pole aeromagnetic anomaly data around the northern South China Sea and then applied the 3-D magnetic inversion method based on mixed Lp norm regularization, with the constraint of multiple deep seismic reflection profiling data, to obtain high-resolution 3-D crustal susceptibility model. Our model confirms that the high-magnetic anomaly belt is caused by deep-seated magnetic bodies, which, supported by borehole and seismic data, are identified as a Mesozoic volcanic arc. We found that the Mesozoic volcanic arc described by high susceptibility bodies extends northeastward from the Dongsha Rise to Taiwan Island and primarily distributes within the depth range of 20~28 km. Our findings provide important constraints for understanding the pre-Cenozoic tectonic evolution of the northern South China Sea.

1. Introduction

The South China Sea (SCS), one of the largest marginal seas in the Western Pacific, is situated at the junction of the Eurasian, Pacific, and Indochina plates (Figure 1). Its periphery exhibits three distinct types of continental margins: extensional margins to the north and south, a shear margin to the west, and a subduction margin to the east. Since the Mesozoic Era, the SCS has transitioned from an active margin to a passive one, with rifting likely initiated on pre-existing subduction systems, followed by continental margin rifting, basin expansion, oceanic crust formation, subduction cessation, and continental collision during the Cenozoic [1]. Understanding the pre-Cenozoic tectonic architecture is essential for elucidating the evolution of the northern SCS. However, questions surrounding Mesozoic subduction zones and pre-Cenozoic structures in the northern SCS remain unresolved, primarily due to limited surface and subsurface evidence.
In recent years, numerous studies integrating gravity, magnetic, seismic, and drilling data have revealed the complexity of the crust in the northern SCS. A long-standing debate exists regarding whether a Mesozoic oceanic crust is present in the region or if the area represents a highly stretched continental crust [1,2,3]. The northern continental margin of the SCS, including the shelf-slope region and the ocean–continent transition zone, has widely observed high-velocity layers in the lower crust, with seismic P-wave velocities ranging from 7.0 to 7.6 km/s [4,5,6,7]. Multiple deep seismic reflection profiles reveal high-velocity layers co-located with Moho discontinuities [8,9,10,11]. Concurrently, a series of northwest-dipping reflection signals found in the crust of the northern SCS are considered to be low-angle subduction-type thrust faults developed within the pre-Cenozoic granite basement. Additionally, petrochemical analyses of rock and mineral samples have confirmed the occurrence of large-scale Mesozoic tectonic movements in the northern SCS. The observed enrichment of fluid–mobile elements, including cesium (Cs), potassium (K), and lead (Pb), in granitic and dioritic rocks provide compelling evidence for the involvement of subduction-zone fluids, supporting the interpretation that these rocks originated in a subduction-related hydrothermal setting [12,13,14].
Figure 1. Tectonic map of the SCS and adjacent regions. ①: [15]; ②: [16]; ③ and ⑤: [9]; ④: [17]; ⑥: [18]; ⑦ and ⑧: [10]; ⑨: [19]; ⑩: [11]; ⑪, ⑫, and ⑬: [4]; ⑭: [20]; ⑮: [7]. PHR: Penghu Rise; TXNB: Taixinan Basin; DSR: Dongsha Rise; CSD: Chaoshan Depression; YTA: Yitong Ansha. The Speculated volcanic arc (yellow line) follows [8]. Black rectangular box represents the extent of the study area (Figure 2).
Applsci 15 02791 g001
The aeromagnetic data of the northern SCS reveal a high-magnetic anomaly belt extending from the northwestern sub-basin edge through the Dongsha Rise and Taiwan Strait to the western Taiwan margin, with peak magnetic anomalies ranging from 60 to 200 nT. The origin of the high-magnetic anomaly belt in the northern SCS (Figure 2) remains a subject of ongoing debate, but most researchers believe it corresponds to a volcanic arc formed by magmatic processes related to Late Mesozoic subduction [8,21,22]. Zhou et al. (2006), Min et al. (2010), and Wu et al. (2011) [8,21,22] utilized combined magnetic anomaly and gravity data to delineate the possible planar locations of the volcanic arc and Mesozoic subduction zone in the northern SCS. They suggested this Mesozoic subduction zone extends along the northern continental slope of the SCS from the southwestern margin of Taiwan Island via the southwestern depression of Taiwan and the southern part of the Chaoshan Depression to Yitong-Ansha islands. Zhou et al. (2006) [8] conducted a comprehensive analysis of both gravity and magnetic anomalies around the northern SCS and proposed that the subduction may have been caused by the Mesozoic Pacific plate subducting beneath the South China continent. The subduction zone extends from the southwestern Japan–Ryukyu Islands–Taiwan region southward to the Borneo and Palawan regions and from the Meratus Belt in southeastern Borneo to the Woyla Belt in Sumatra. The subduction zone in the northern SCS originally extended from the Baiyun Depression via the Dongsha Rise northeastward to the western part of Taiwan. Hu et al. (2008) [23] analyzed the seismic reflection profile DPSR2002 crossing the Baiyun Depression (Figure 1, profile ②), performed the joint inversion of magnetic and gravity data, and proposed that the high-magnetic anomaly belt corresponds to volcanic rocks at depths of 2.5 to 10 km, with a density of 2.65 g/cm3 and a magnetization strength of 0.7 A/m, which are products of a concealed oceanic crust subduction zone. Li et al. (2018) [24] performed 2-D magnetic modeling along the OBS profile crossing the Dongsha Rise, concluding that the high-magnetic anomaly belt is associated with the root of a volcanic arc located at a depth of 18–24 km within the lower crust. These geophysical features are typically associated with subduction-related volcanic activity and mantle intrusion during continental rifting. Thus, investigating volcanic arc (subduction zone) distribution and morphology using high-magnetic anomaly belts becomes crucial for understanding the pre-Cenozoic tectonic evolution of the SCS. However, these studies mainly rely on regional magnetic anomaly characteristics and 2-D magnetic models for local places and lack the 3-D exhibition of the crustal magnetism model, limiting the comprehensive understanding of the Mesozoic volcanic arc.
Figure 2. The RTP aeromagnetic anomaly map around the northern SCS (digitized from [25]). ZHU I D: Zhu I depression; PHR: Penghu Rise; TXNB: Taixinan Basin; DSR: Dongsha Rise; CSD: Chaoshan Depression; YTA: Yitong Ansha. Black lines represent the 0 m isobath. White lines outline the depressions.
Applsci 15 02791 g002
Three-dimensional magnetic inversion is a primary technique for revealing the 3-D magnetism structure in the subsurface and has been widely applied in fields such as deep tectonic studies and resource exploration [13,14,26,27]. The 3-D magnetic inversion method based on the mixed Lp norm regularization (hereinafter referred to as mixed Lp norm inversion) is a recently developed technique [28,29]. Compared to conventional single norm regularization inversion methods, this technique offers the advantages of more accurately delineating source boundaries, focusing on the source morphology, and providing physical–property values that are closer to the true characteristics of the source. We first investigated the mixed Lp norm inversion method. Then, using high-resolution reduction-to-the-pole (RTP) aeromagnetic anomaly data around the northern SCS, we constructed a reliable 3-D susceptibility model of the crust through magnetic 3-D mixed Lp norm inversion with the constraint of multiple deep seismic reflection profiling data. Based on the resultant model, we analyzed the crustal architecture of the Mesozoic volcanic arc, and discuss its implication on the pre-Cenozoic tectonic evolution of the SCS.

2. Mixed Lp Norm Regularization for 3-D Magnetic Inversion

2.1. Methodology

The mixed Lp norm regularization algorithm employed in this paper was proposed by Fournier and Oldenburg (2019) [30]. It replaces the regularization term in the traditional Tikhonov regularization (L2 norm) objective function with the norms p x , y , z , s ∈ {0, 1, 2}. These norms control the regularization term and play a crucial role in determining the final model’s features. Typically, the objective function ϕ m of the inverse problem can be expressed by the following formulation:
min m ϕ m = ϕ d + β ϕ m
where ϕ d denotes the data fitting term, ϕ m represents the regularization term, and β is the regularization parameter that balances the two.
Assuming that the noise contained in the observed data follows an independent Gaussian distribution, the data fitting term ϕd is typically expressed in the following mathematical form:
ϕ d = i = 1 N d i p r e d d i o b s σ i 2
where d i o b s represents observed data, d i p r e d represents calculated magnetic anomalies caused by the inversion model, and σ i represents their uncertainties.
Among these, ϕ m is the regularization term of the objective function, which plays a critical role in determining the characteristics of the final model. In the mixed Lp norm inversion, p x , y , z , s can take the independent values of 0, 1, or 2. The regularization term is as follows:
ϕ m = j = s , x , y , z α j V f j m p j d V
where:
f s = m , f x = m x , f y = m y , f z = m z
The discrete form of the formula is expressed as follows:
ϕ m = α s V s m p s p s + j = x , y , z α j V j G j m p j p j
where V s , V x , V y and V z are diagonal matrices corresponding to the “volumes” of the cells used in discretizing the problem, and G x , G y , and G z are the discrete gradient operators. By employing various mixed norms for model regularization, the mixed Lp norm inversion method yields a range of solutions. This approach highlights the inherent multiplicity of solutions in the inversion process and mitigates the risk of over-interpretation that may arise from considering only a single solution.
The data experiments with the method mentioned above indicate that when sparse norms (L0, L1) are applied to the model vector m , an issue of dependence on the upper limit of physical properties arises. Conversely, when sparse norms are applied to the model gradient m , a “staircase” effect is observed. The former leads to the physical–property values of the anomaly body in the inversion approaching the upper limit, while the latter causes the anomaly body to exhibit horizontal or vertical boundaries. To address these issues, Sun and Wei (2021) [28] further refined this method based on the work of Fournier and Oldenburg (2019) [30]. The regularization term in the objective function of the mixed Lp norm inversion consists of four components, as follows:
ϕ m = α s f s m p d v + j = x , y , z α j f j m q d v  
The discrete form of the formula is as follows:
ϕ m = α s W s m p p + j = x , y , z α j W j j m j q q
where f is defined as in Equation (4).
The parameters α s and α j are weighting coefficients that control sparsity and smoothness, while p and q are the norm exponents that regulate the smoothness of the model’s small-scale features and gradients, respectively. W s and W j are weight matrices used to adjust the model’s depth and other structural characteristics.
The method of Sun and Wei (2021) [28] employs two norms, p and q , to control the model m and its gradient m , respectively. When p = q = 1   o r   2 , it simplifies to conventional L1 and L2 norm regularized inversion. However, solving the inverse problem using mixed Lp norm in the regularization (especially for p < 1) is computationally challenging. This method uses the Lawson formulation for the Lp norm and solves the optimization problem with the Iterative Reweighted Least Squares algorithm [30]. The algorithm consists of two stages: we first solve the L2 norm problem, and then we switch to the desired suite of Lp norm. It is assumed that the globally convex L2 norm regularized inversion is a good approximation of the true solution. The β parameter in Equation (1) is controlled by a cooling schedule that starts with a high value and is successively decreased until ϕ d is minimized. There is one value of p for each term in the objective function. Stage 2 starts from the solution obtained in Stage 1 and solves the inverse problem for the specified ps, px, py, and pz values. To handle the large changes in the value of the regularization function when the p-value is changed, the method continuously readjusts the gradients in the Gauss–Newton solution to ensure that each component of the regularization contributes to the final solution. An indicator function allows us to evaluate our success in finding a solution in which components of the objective function are equally influential. According to experimental results, when using the L02 norms, the mixed Lp norm inversion does not encounter issues of bound dependence and staircase effects [28]. Compared to conventional L1 and L2 norm inversions, the mixed Lp norm inversion provides more focused results with clearer boundaries. However, the selection of the optimal mixed norm requires empirical tests to determine the best choice in practical applications.

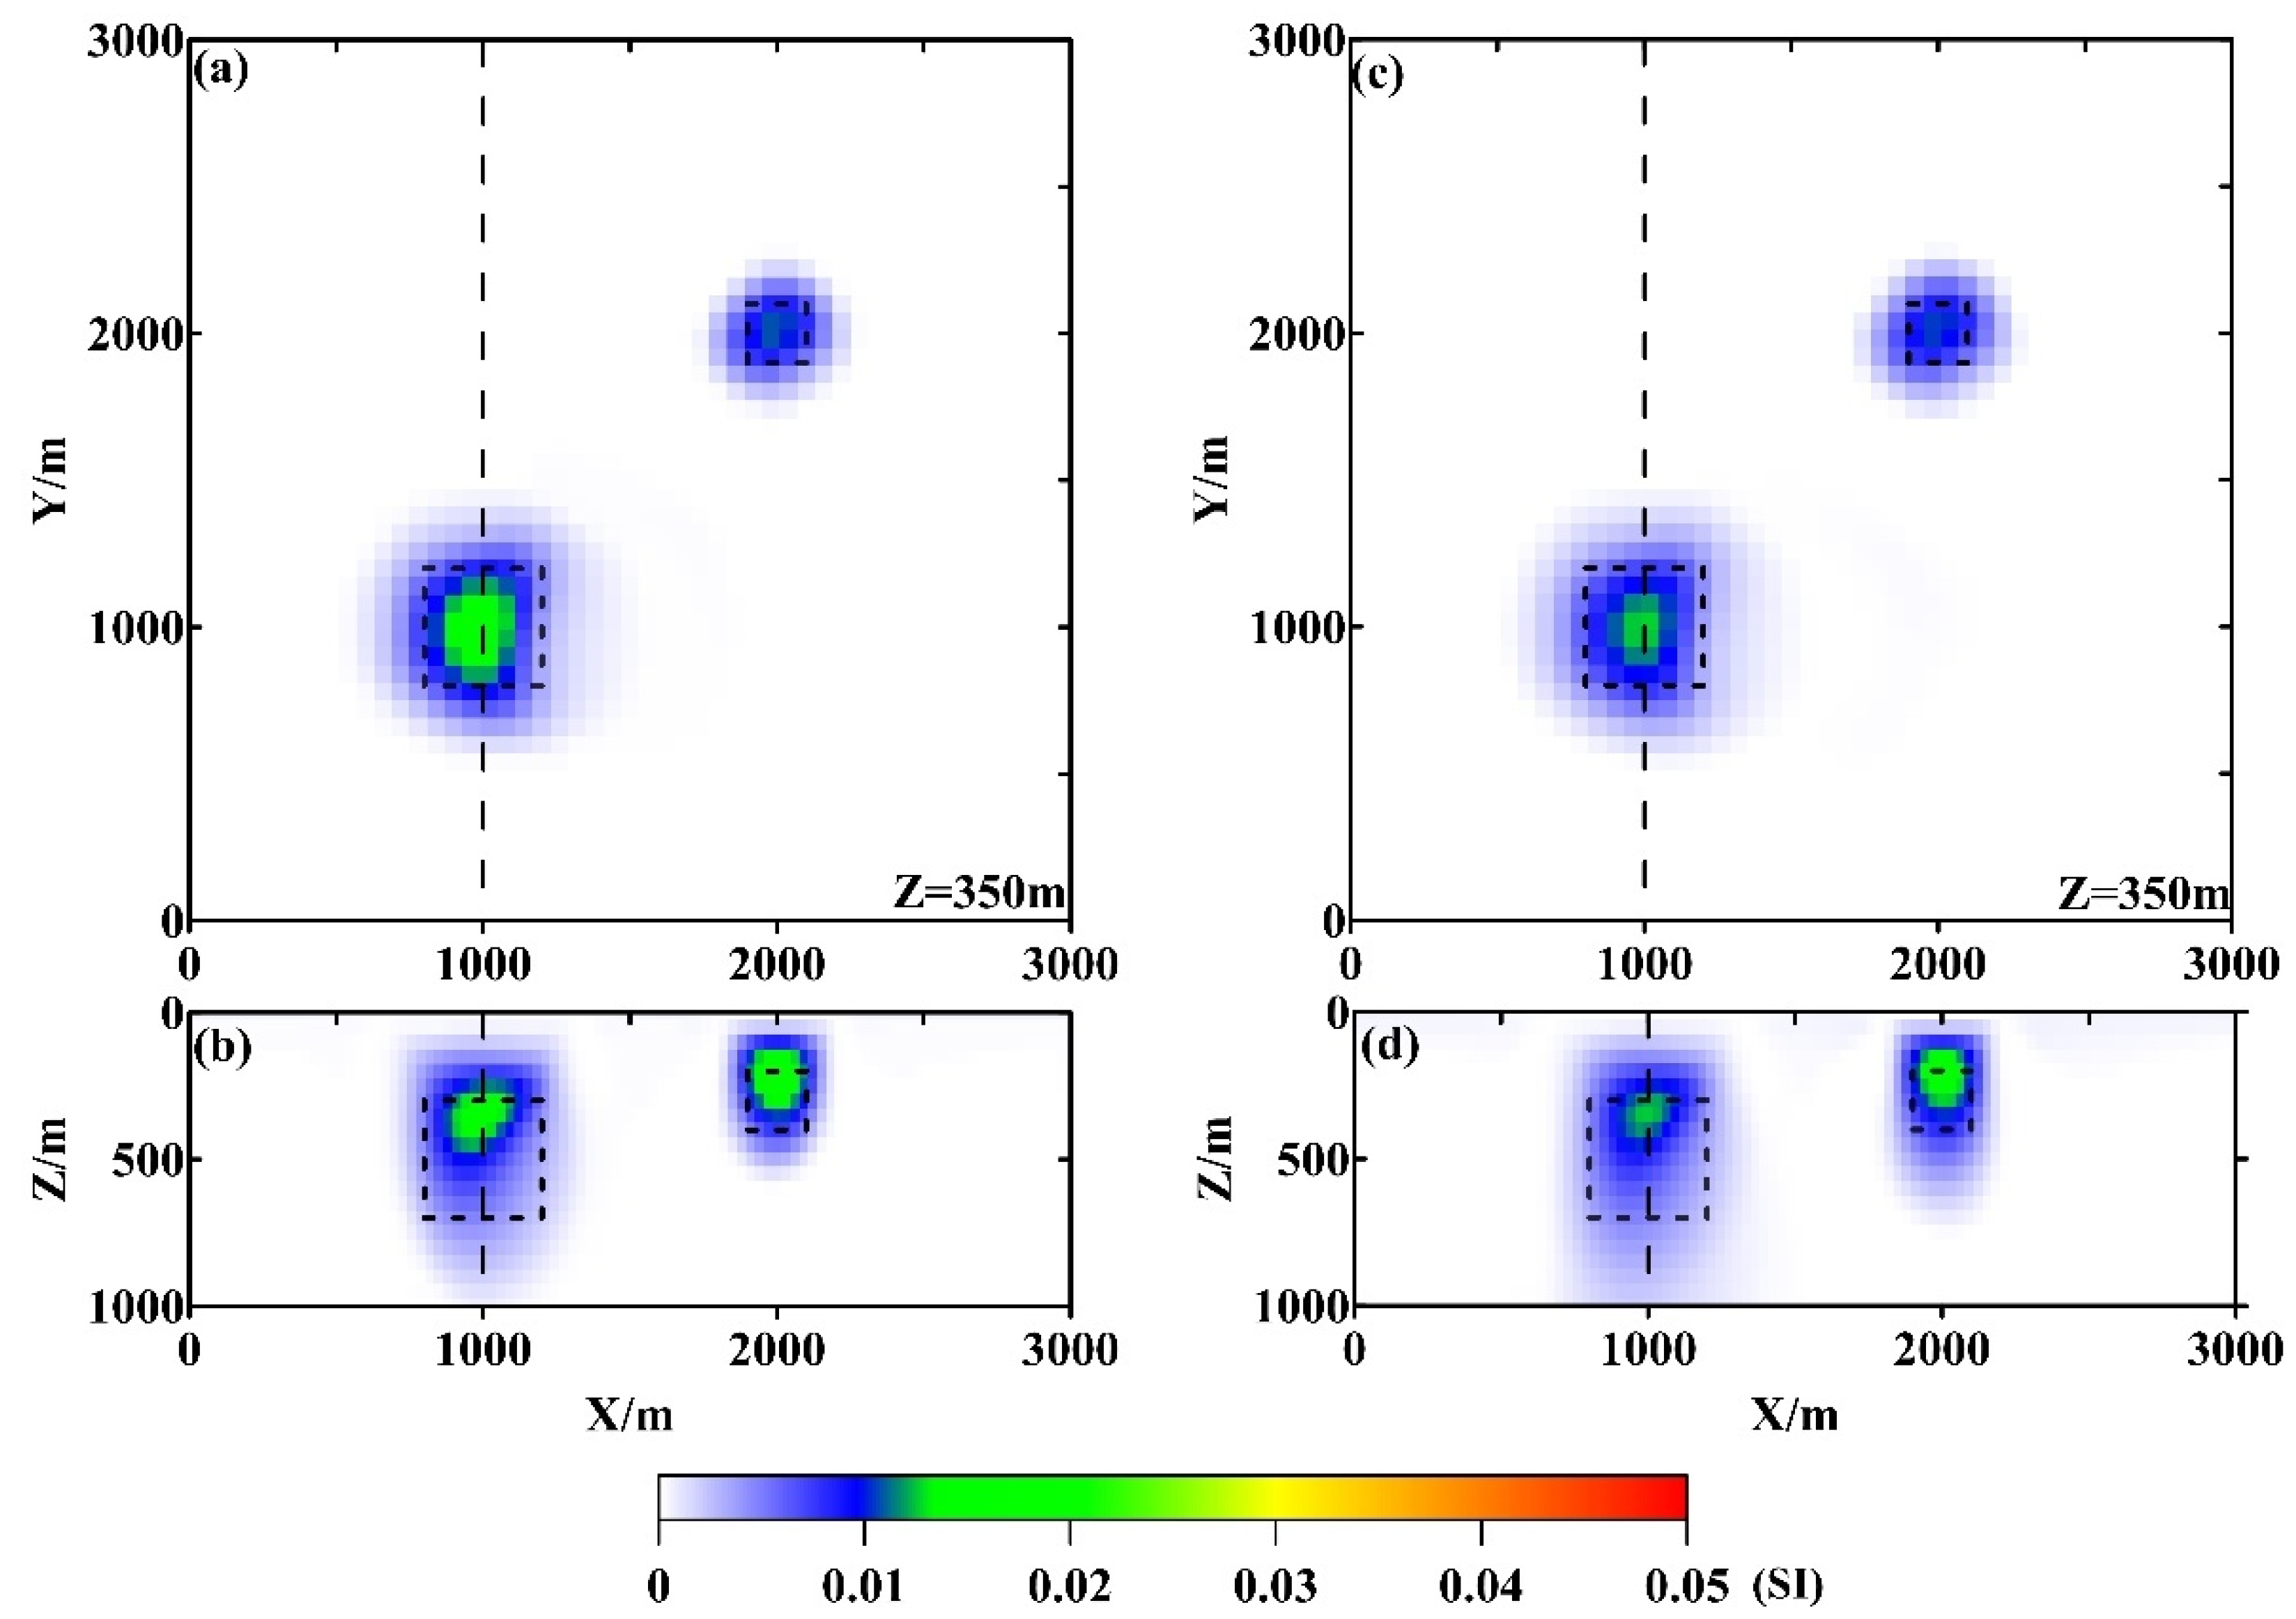
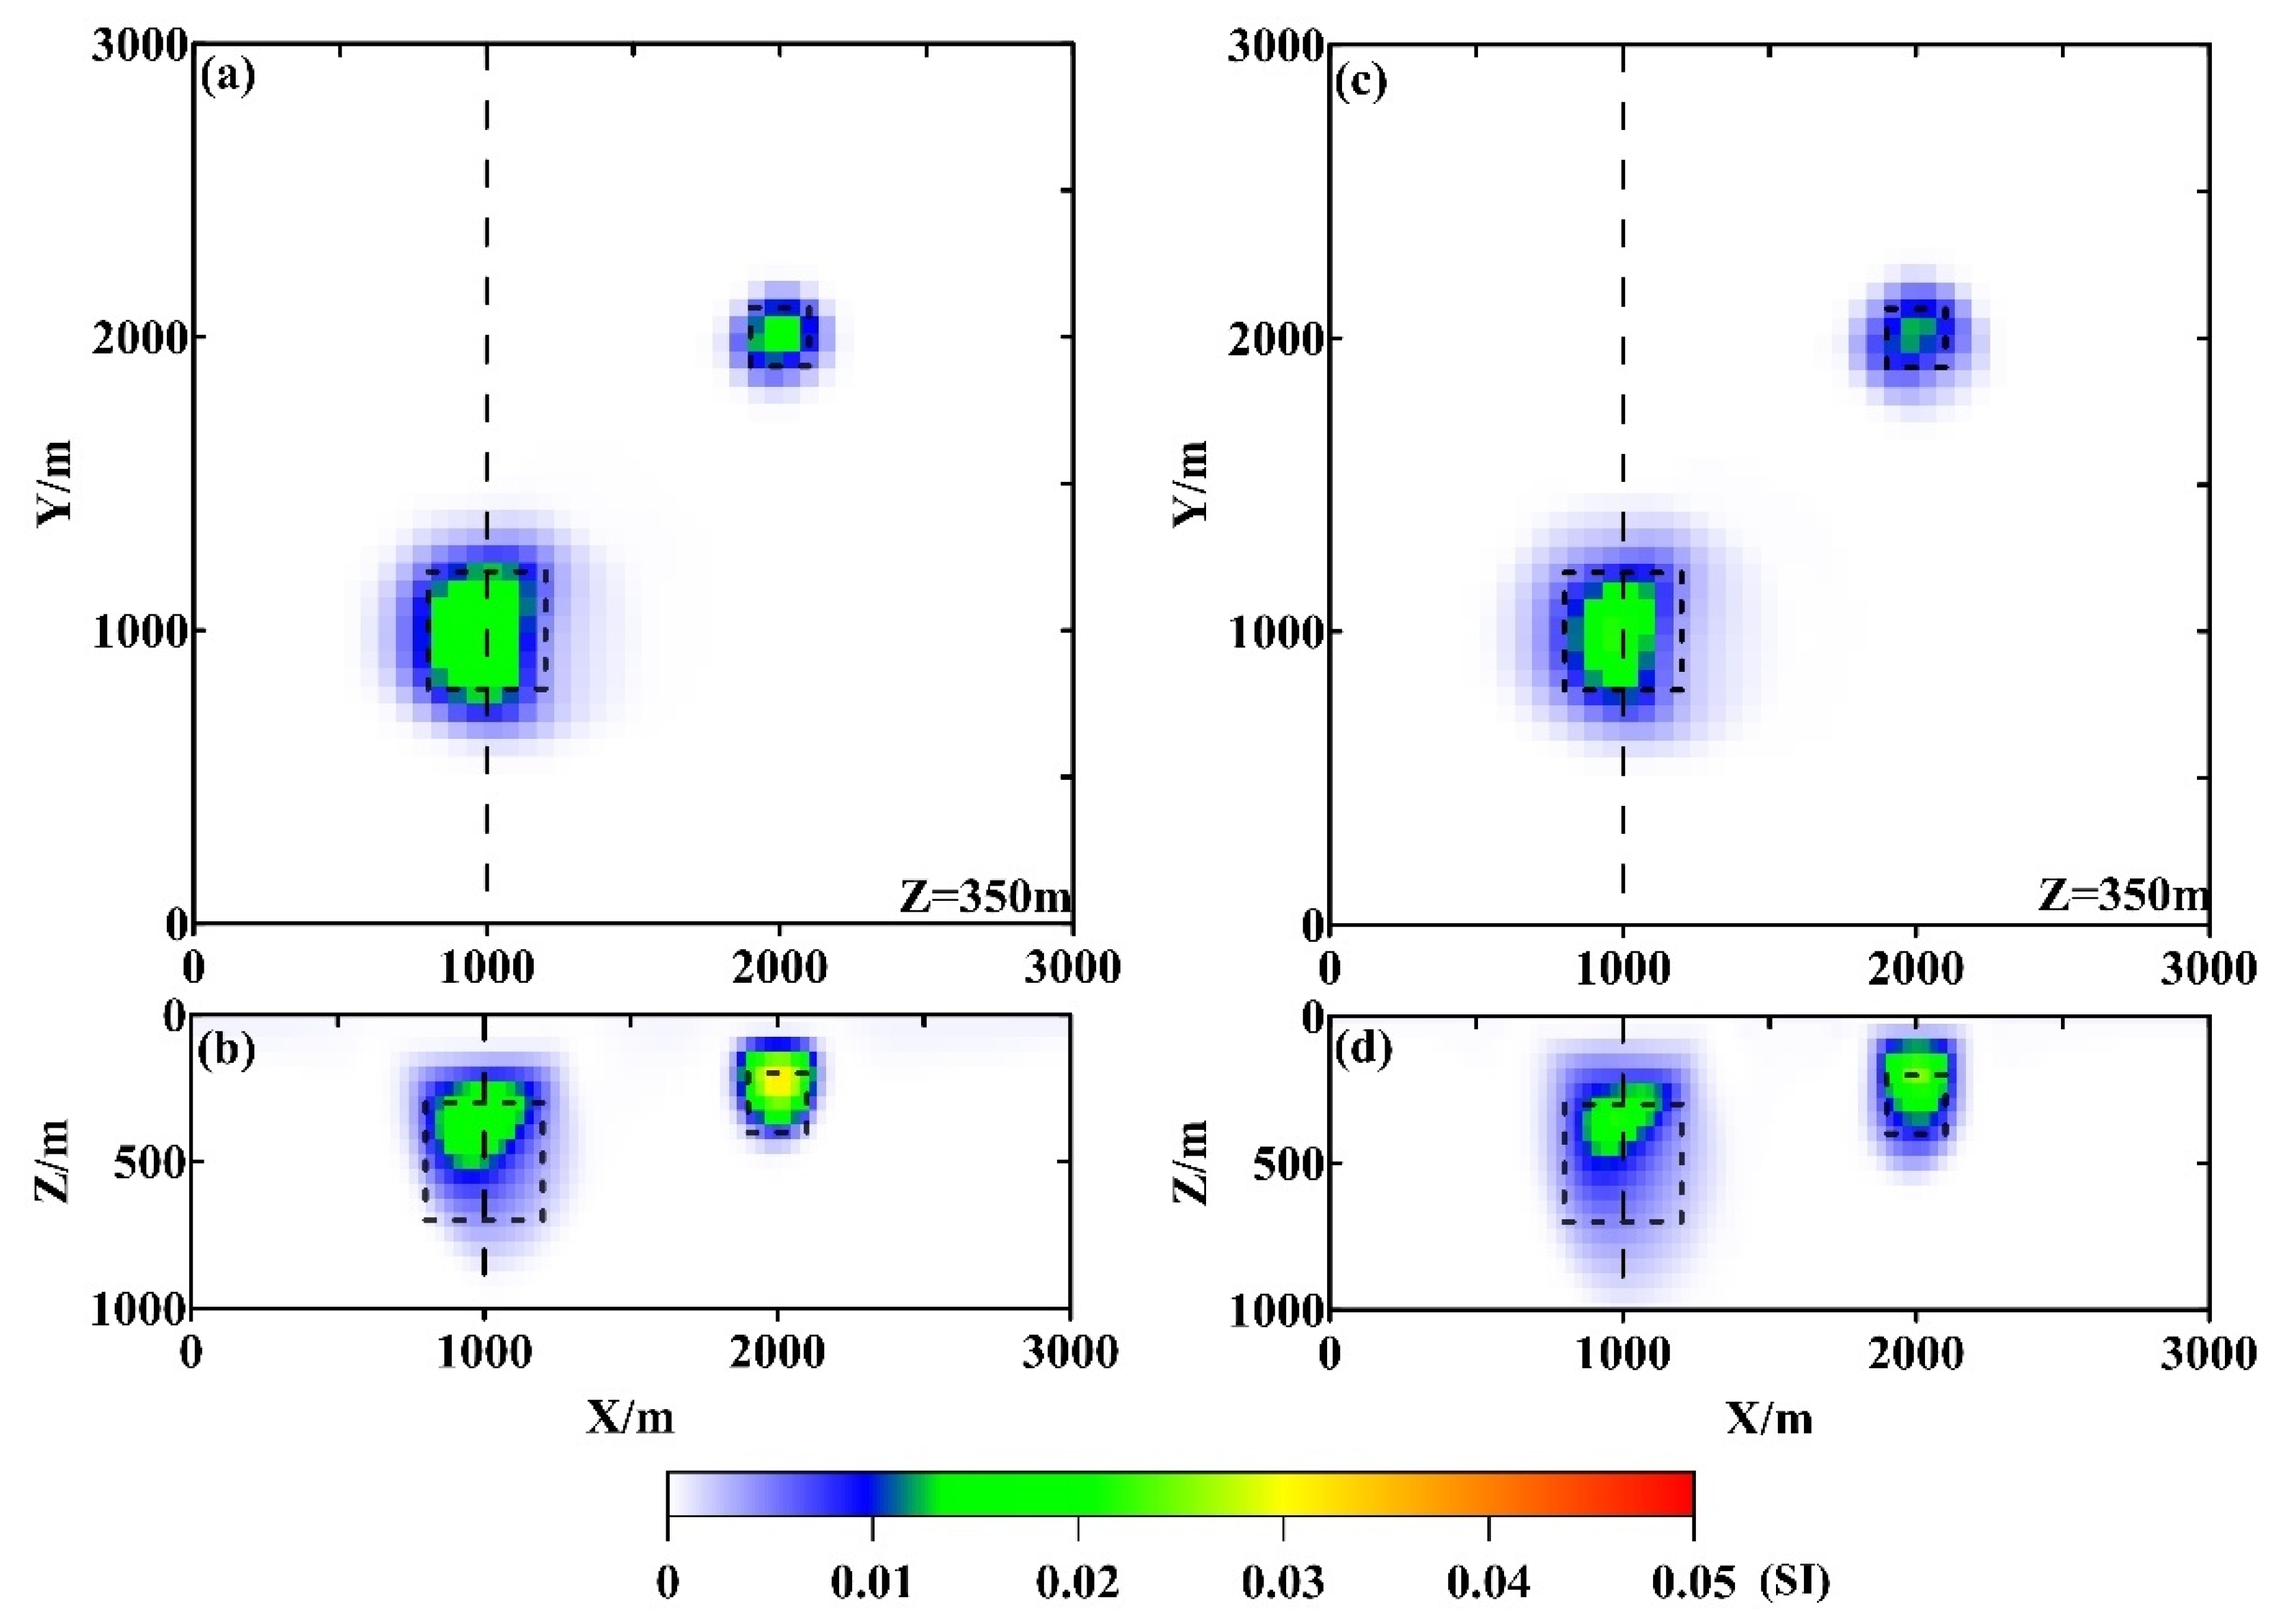
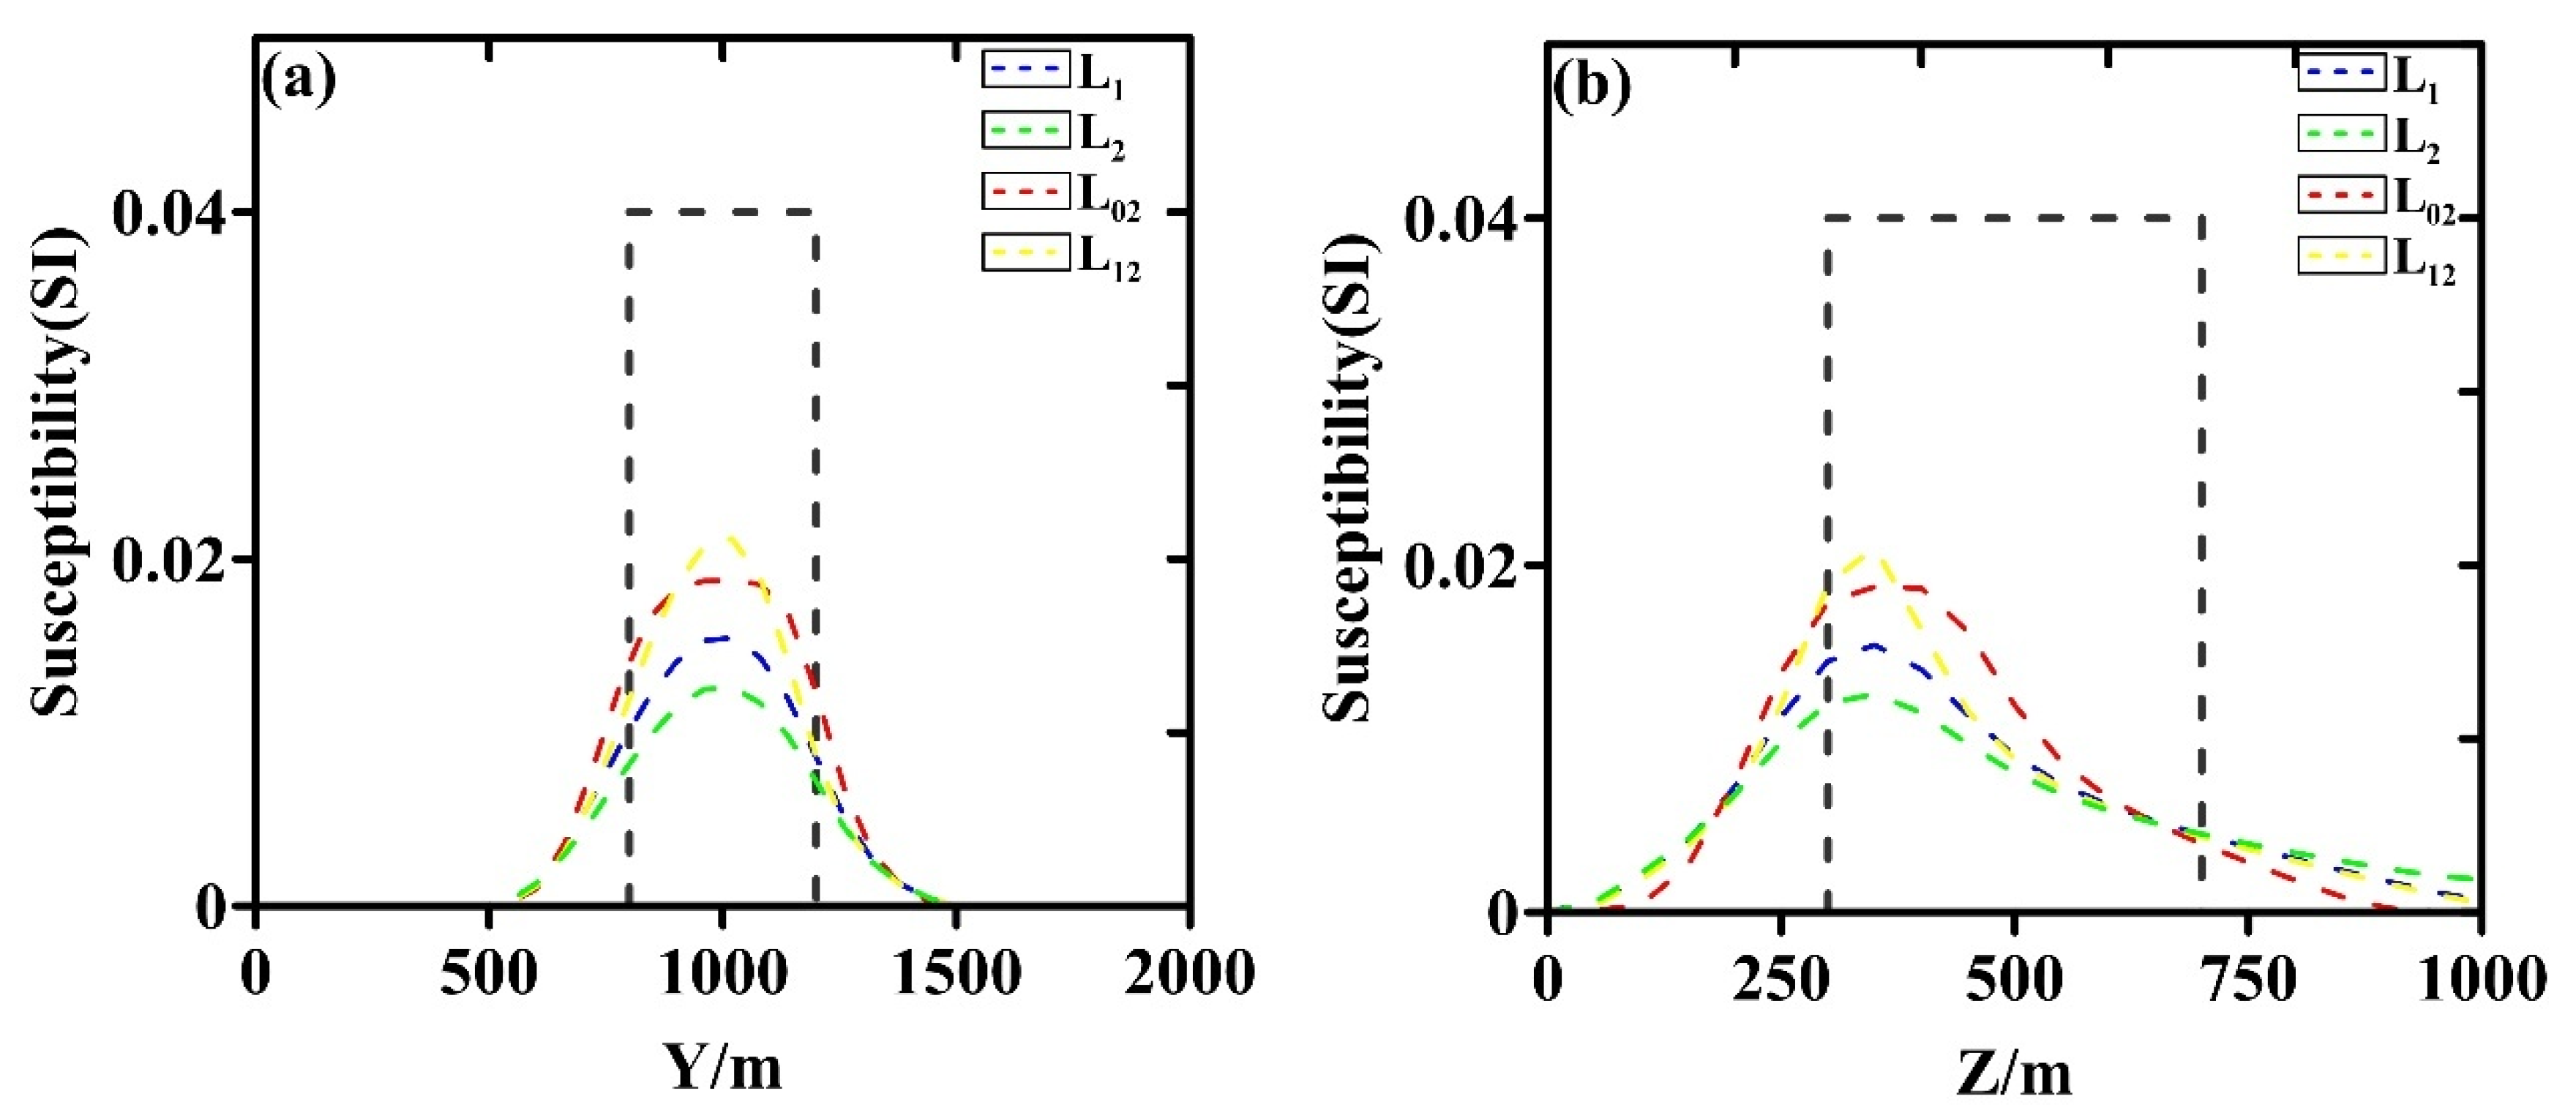
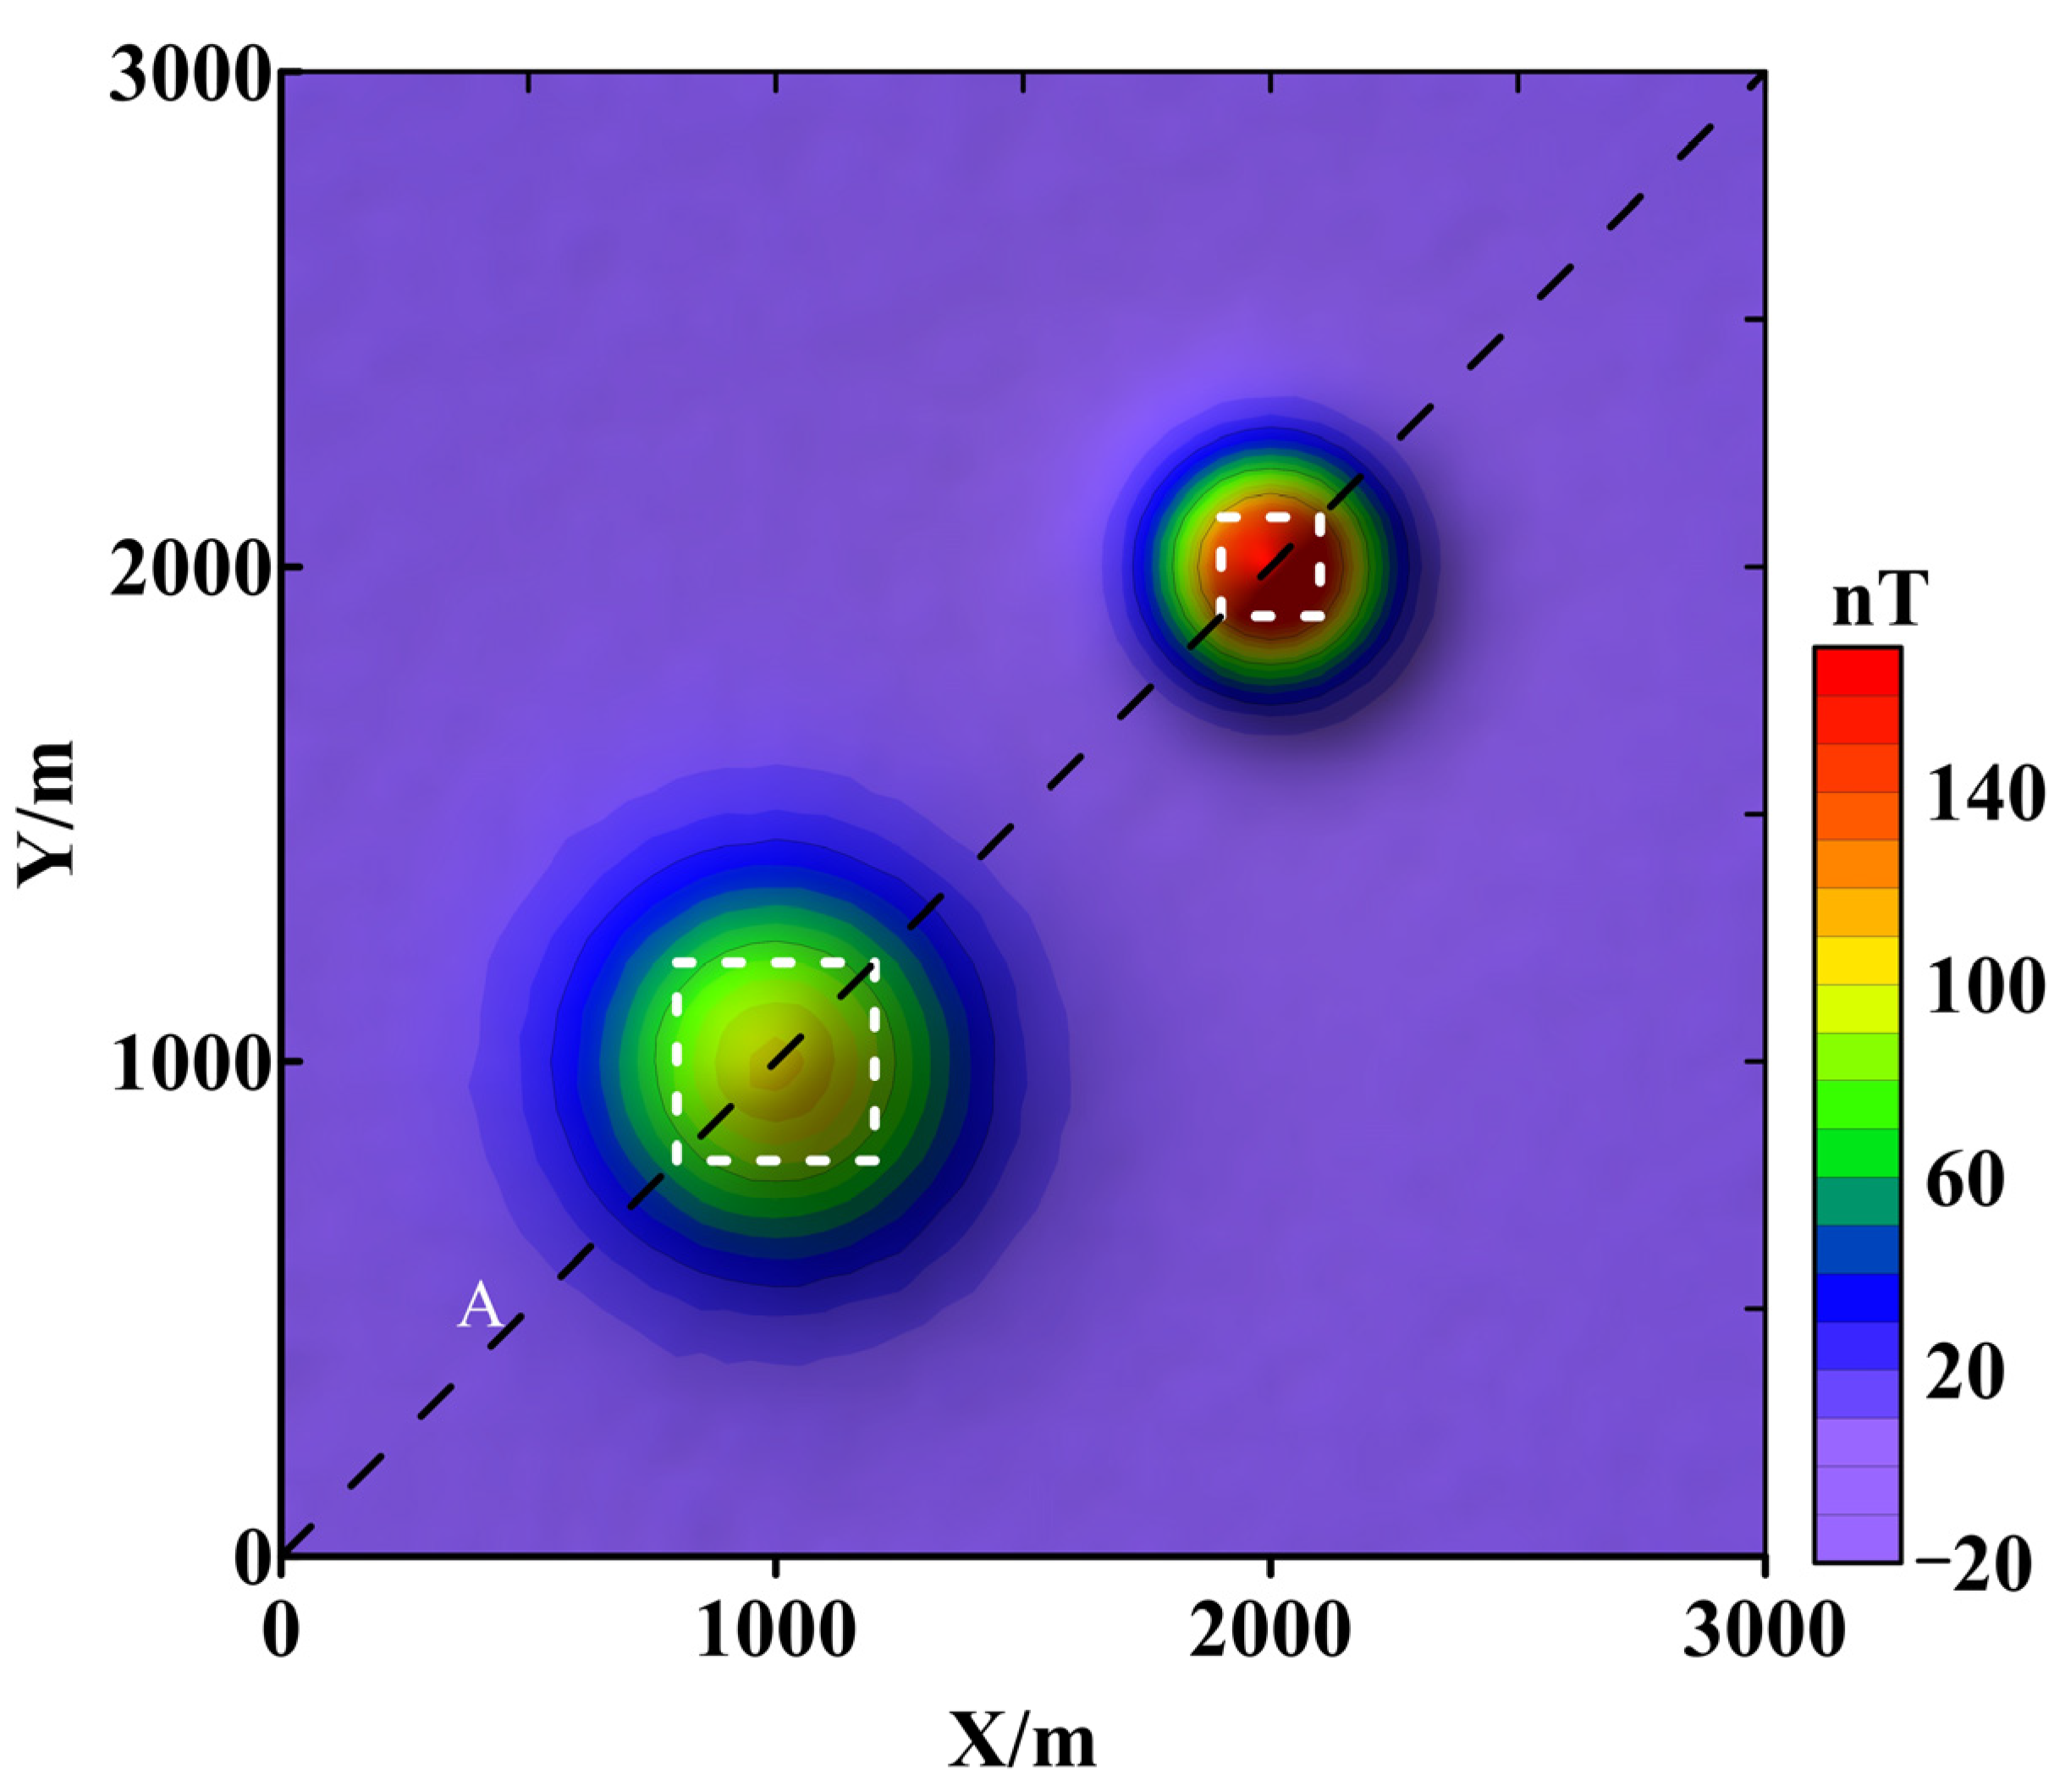
2.2. Synthetic Data Test

The synthetic model consists of two cubes. Cube 1 has a side length of 400 m, with its center located at X = 1000 m, Y = 1000 m, and Z = 500 m, and a magnetic susceptibility of 0.04 (SI). Cube 2 has a side length of 200 m, with its center located at X = 2000 m, Y = 2000 m, and Z = 300 m, and a magnetic susceptibility of 0.08 (SI). The geomagnetic field strength is 55,000 nT, with a dip angle of 90° and a declination of 0°. Both cubes have a magnetic inclination of 90° and a declination of 0°. The magnetic anomalies generated by the synthetic model at the observation plane of Z = 0 m are shown in Figure 3, which includes 2% Gaussian noise.
Figure 4 and Figure 5 present the inversion results using conventional L1 and L2 norms, as well as the mixed Lp norm regularization. It can be observed that the L1 norm provides stronger boundary constraints compared to the L2 norm, with the inversion results more effectively restoring the model boundaries both laterally and vertically. The L2 norm inversion results display divergence in the vertical boundaries of the anomaly body. In contrast, the mixed Lp norm not only better restores the model boundaries but also yields physical–property values closer to the true values. Among the mixed norms, L02 provides better results than L12.
The result along profile X = 1000 m at the depth slice of Z = 350 m (Figure 6a) shows that the horizontal boundary delineation of the anomalous body is similar for both conventional norm inversion and mixed Lp norm regularization. However, the restoration of physical properties is notably superior using the mixed norm, with peak values following the order L12 > L02 > L1 > L2. The result at the position of X = 1000 m along profile A (as illustrated in Figure 6b) reveals significant differences in the delineation of the vertical boundary of the anomalous body across the various norms. Among the different norms, L02 provides the most focused result, while L1 and L12 produce similar outcomes, and L2 exhibits the most divergence, with a distinct “tailing” effect along the Z direction. The restoration of physical properties follows a similar trend as Figure 6a, with peak values of L12 > L02 > L1 > L2. Overall, from the perspective of boundary delineation and physical property restoration, the mixed Lp norm regularization inversion yields better results compared to conventional L1 and L2 norm regularization, with L02 outperforming L01.
Figure 4. Magnetic inversion results using L1 and L2 norm regularization for the synthetic model. (a,b) show the results at depth slice of Z = 350 m and along profile A using the L1 norm regularization algorithm; (c,d) are those using the L2 norm regularization algorithm. The black boxes outline the true model, and the black dashed lines in (ad) locate the profiles shown in Figure 6.
Applsci 15 02791 g004
Figure 5. Magnetic inversion results using mixed Lp norm regularization for the synthetic model. (a,b) show the results at depth slice of Z = 350 m and along profile A using the L02 norm regularization algorithm; (c,d) are those using the L12 norm regularization algorithm. The black boxes outline the true model, and the black dashed lines in (ad) locate the profiles shown in Figure 6.
Applsci 15 02791 g005
Figure 6. Profiles of inversion results using different norms. (a) Inversion results along profile of X = 1000 m at depth slice of Z = 350 m; (b) Inversion results at the position of X = 1000 m along profile A. The black dashed lines represent the true susceptibility values of the cube.
Applsci 15 02791 g006
Indeed, there is a clear mismatch in the depth of anomalous bodies between the true and recovered models. However, despite this discrepancy, the synthetic tests remain valuable as they primarily serve to demonstrate the superiority of the mixed norm method employed in this study over conventional regularization methods. Specifically, the mixed norm method provides more accurate physical–property values and better-defined boundaries, which are critical for enhancing the quality of the inversion results.

3. Data Source

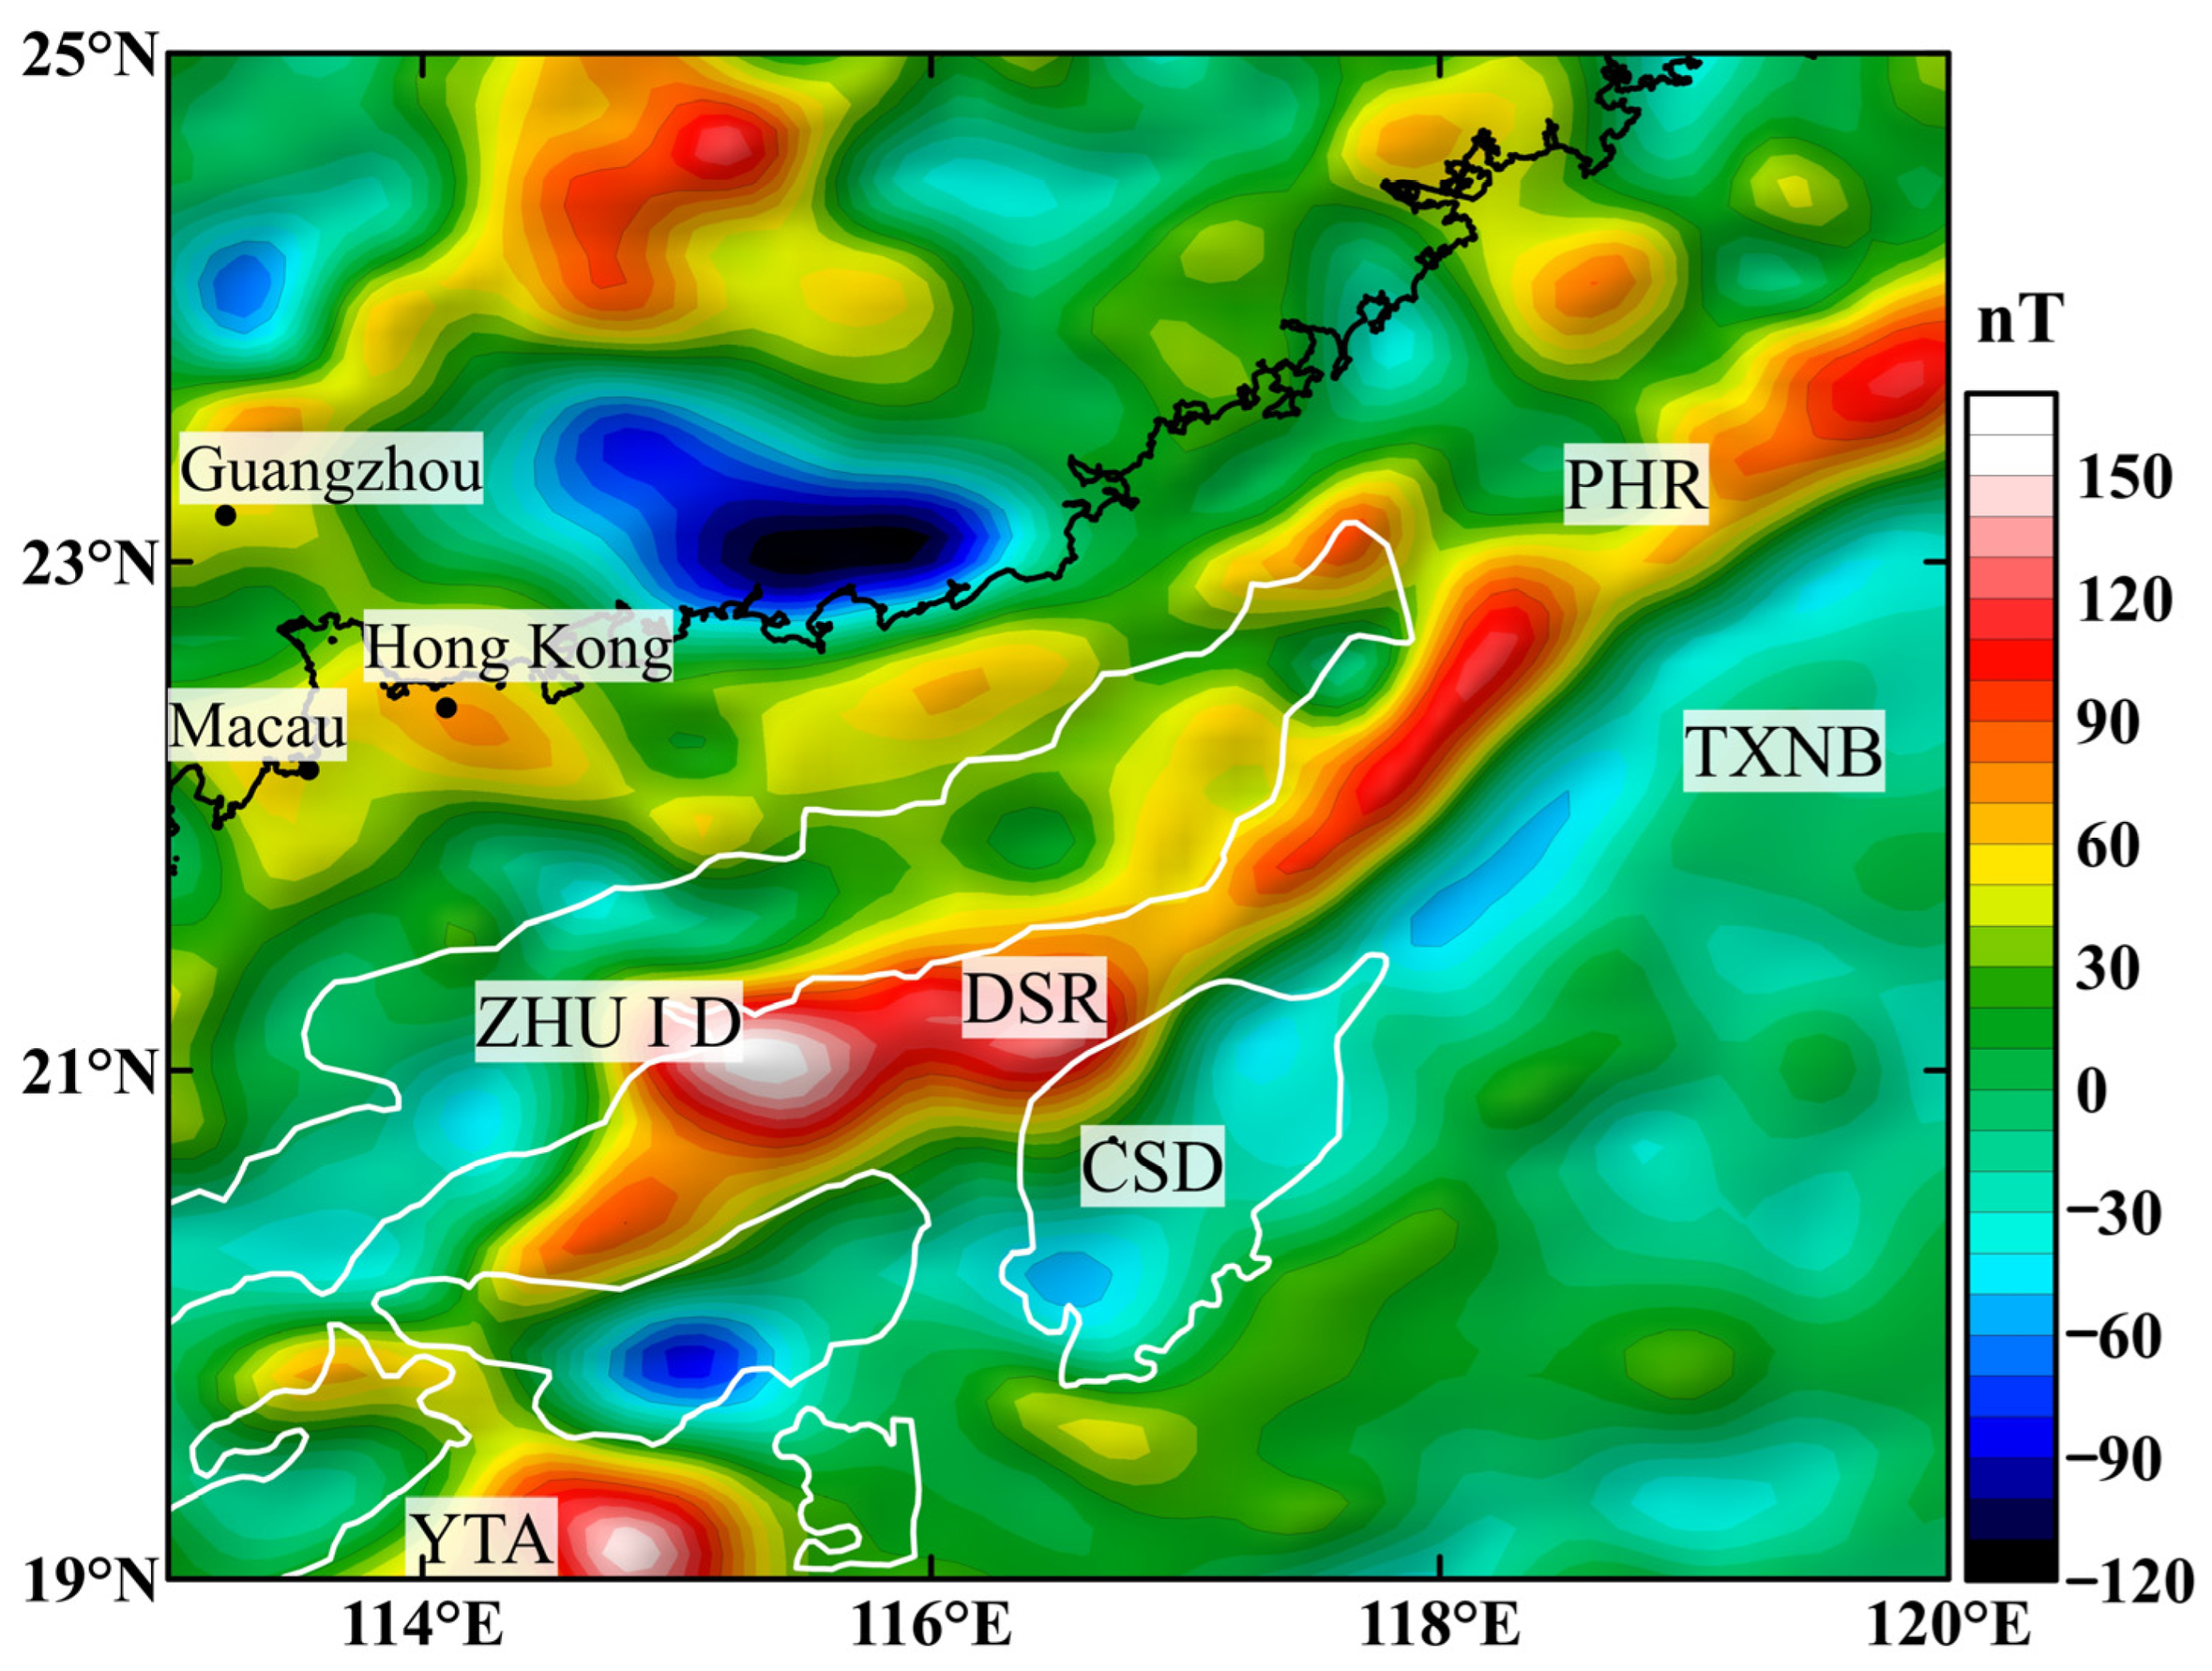
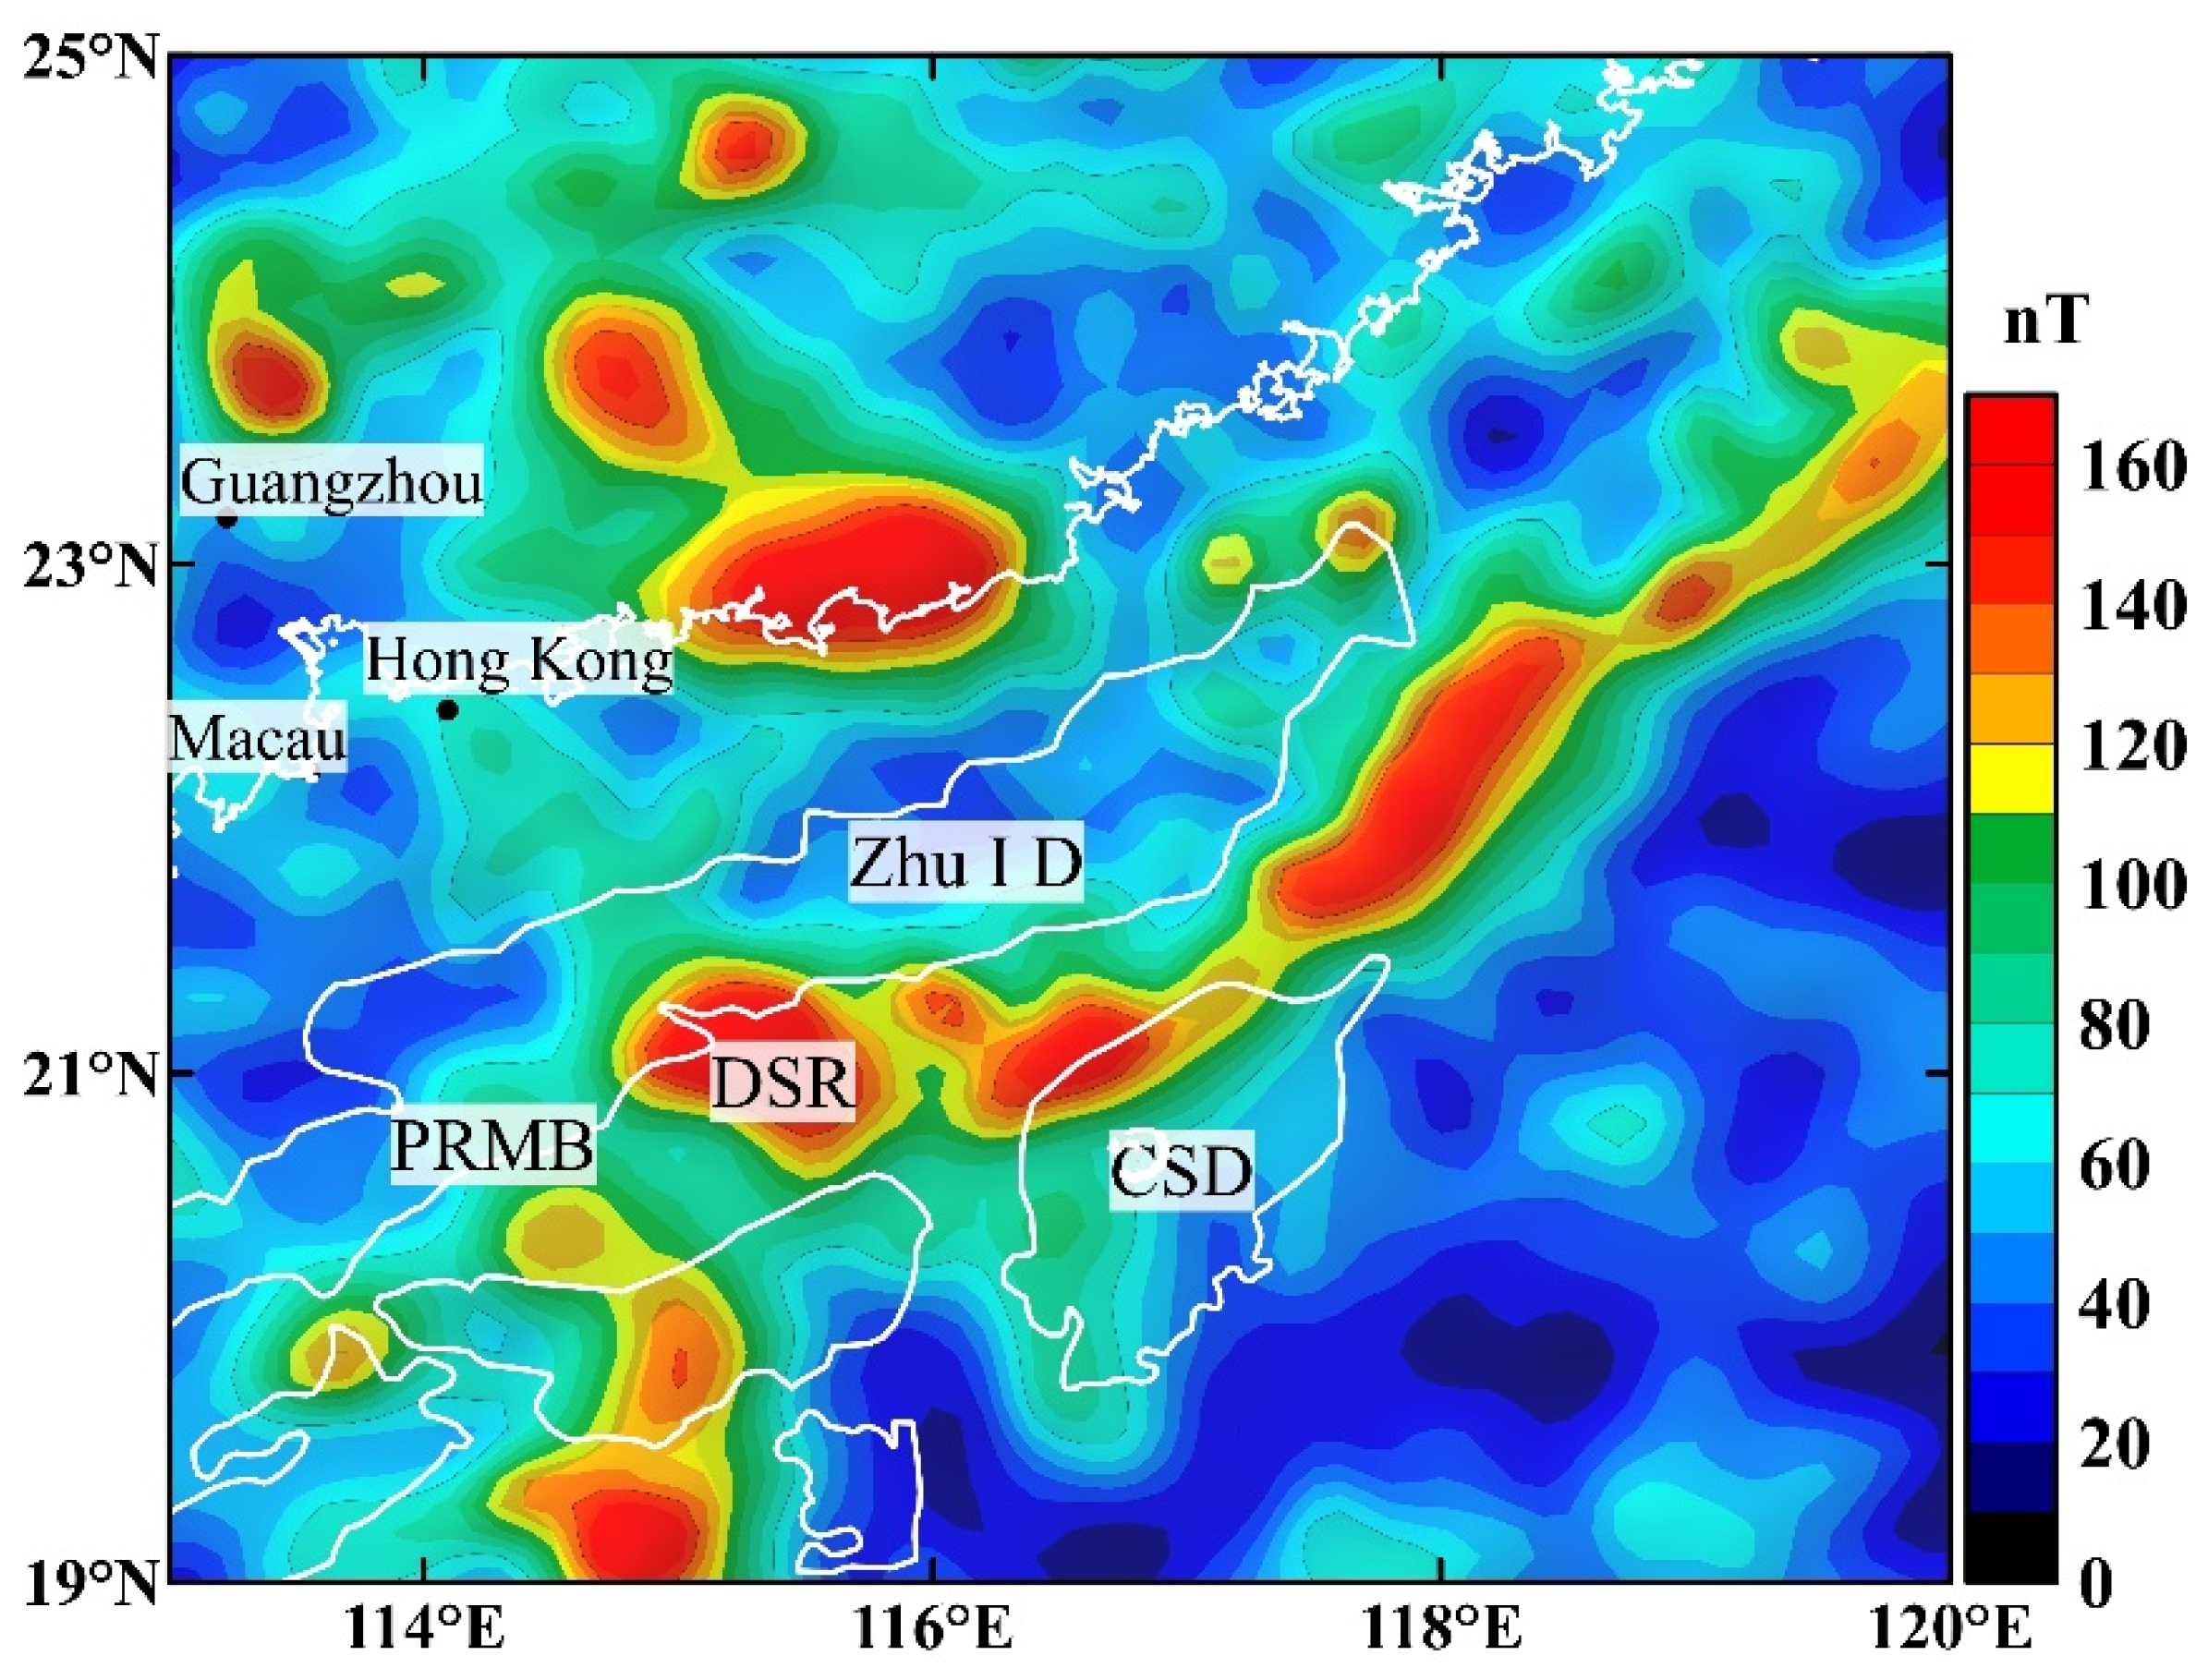
3.1. Aeromagnetic Data

We obtained the RTP aeromagnetic data for the northern SCS from the 2021 Aeromagnetic Map of Series of China and its Adjacent Sea areas (scale 1:5,000,000 with specifications), compiled by the China Aero Geophysical Survey and Remote Sensing Center for Natural Resources [25]. This dataset integrates a substantial amount of aeromagnetic survey data collected up to 2021, as well as data from the CCOP East Asia Sea anomaly map (i.e., data from the CCOP GSJ AeroMAG1966 East Asia Sea anomaly map), prioritizing the most recent and highest-precision measurements. Using digital mapping and cartographic techniques, the final data grid has a spacing of 1 km × 1 km.
The RTP aeromagnetic anomalies in the northern SCS predominantly range from −100 to 100 nT, with positive anomalies being the most common. Low-value anomalies are primarily concentrated in the depression and sedimentary areas. Additionally, an NE-trending high-value positive anomaly belt is visible across the region, along with several sporadic high-value anomalies.
We calculated the magnetic anomaly modulus for the northern SCS (see Appendix A, Figure A1), and the results show that its distribution is generally consistent with that of the RTP anomalies in the high-magnetic anomaly belt region, indicating that the remanent magnetism effect in this area is relatively weak. Therefore, conventional magnetic 3-D inversion methods, including the mixed Lp norm inversion method discussed above, can be applied for inversion analysis, with scalar values used to represent physical–property distribution.

3.2. Physical–Property Data

The differences in the physical properties of rocks form the foundation of geophysical exploration. A comprehensive understanding of the physical–property parameters of various rocks in the study area is a prerequisite for inversion and interpretation. We incorporated highly reliable data spanning multiple years and different areas, including both drilling and outcrop observations. The data employ rock magnetism measurements and research from the coastal lands and islands around the northern SCS [31], as well as the summary report of the comprehensive geophysical survey of the northern SCS continental slope area [32], to statistically analyze the magnetism values for igneous rocks, sedimentary strata, and lower crust materials in the area. Geological bodies with similar magnetism parameters or minimal physical property differences are classified into a single magnetic susceptibility unit. Based on the magnetic susceptibility and corresponding geological types, the study area is divided into five geological units with distinct magnetic susceptibility differences, as follows: (1) seawater layer (no magnetism), (2) sedimentary strata (low or no magnetism), (3) intermediate to acidic intrusions (with a wide range of magnetic variations and strong magnetism), (4) mafic and ultramafic intrusions (highly magnetism), and (5) crust (no magnetism). The statistical results are presented in Table 1.

4. Results and Discussion

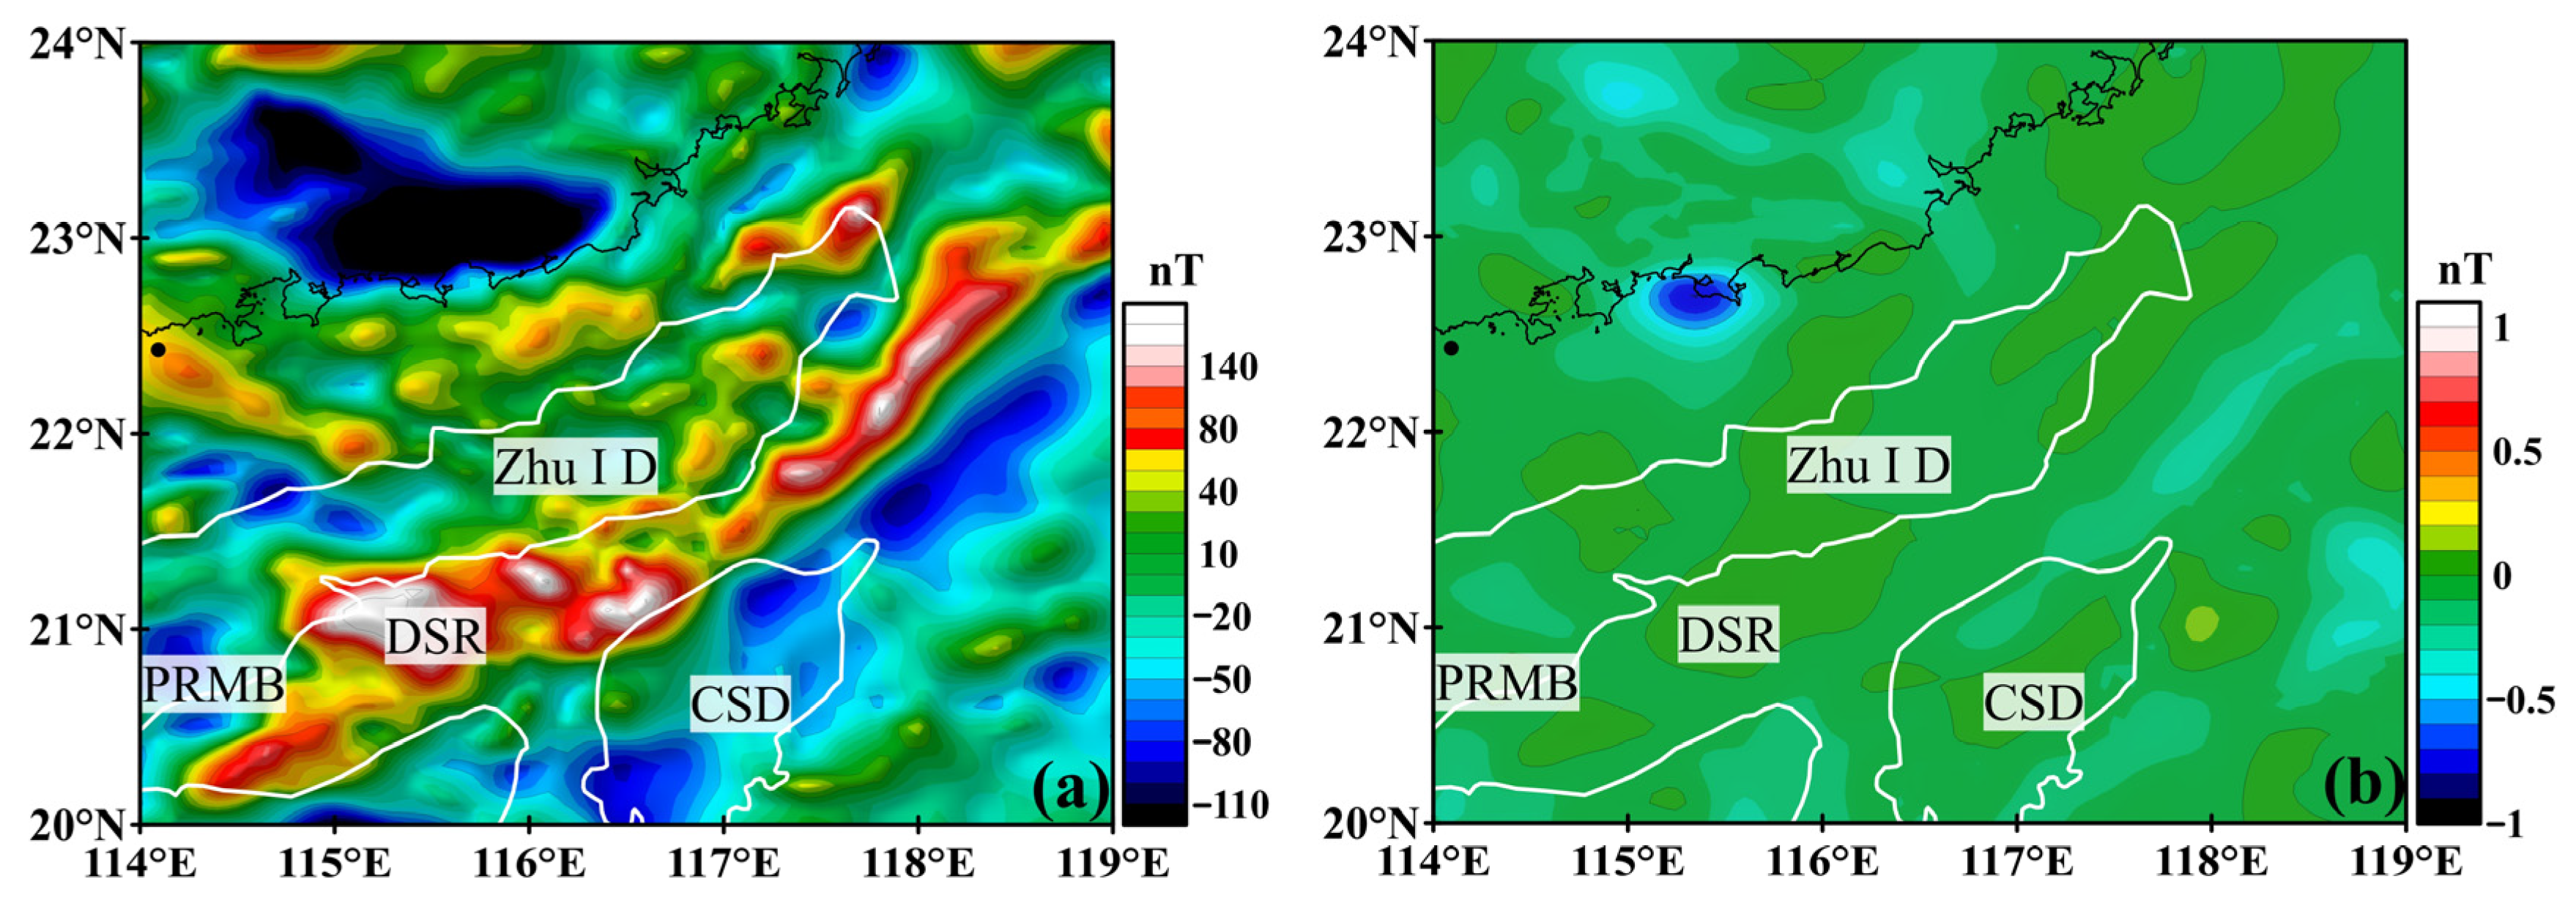
4.1. Inversion and Results

Multiple deep seismic reflection profiles (Figure 1) reveal travel–time information resembling Mesozoic volcanic arc structures [4,7,9,10,11,15,16,17,18,19,20], which, when converted using an average continental crustal velocity of 6.0 km/s [33], provides depth constraints for this study. During the inversion process, the parameters were selected by integrating depth feature constraints to ensure that the magnetic source depth of the inversion in the region was as consistent as possible with the depth of the Mesozoic volcanic arc structure revealed by the multiple deep seismic reflection data. Finally, by selecting the parameters for the mixed Lp norm regularization (p = 0, q = 2, v = 9, and αs = 0.3), a 3-D susceptibility model of the crust in the northern SCS was generated. The model features a lateral grid spacing of 0.1° × 0.1° and a depth range of 0–40 km, with a depth step of 2 km. The results of the inversion are shown in Figure 7.
The model demonstrates that the planar distribution of the magnetic sources in the northern SCS generally aligns with the high-value regions of the RTP aeromagnetic anomalies, representing an NE-trending belt of high magnetism with a primary depth concentration between 20 and 28 km. Additionally, the model shows isolated magnetic sources scattered to the north of the belt, consistent with the speculation by Fan et al. (2017) [34] regarding the intraplate magmatic sources in the northern SCS. The residuals between the real and calculated anomalies are displayed in Figure 8, where the relatively small residual values suggest a strong fit between the model’s calculated anomalies and the real RTP aeromagnetic anomalies data.

4.2. Crustal Architecture of the High-Magnetism Bodies

To verify the reliability of our model, a multiple deep seismic reflection profile from Gao et al. (2018) [10] (Figure 9 and profile line ⑧ in Figure 1) and an OBS profile from Wei et al. (2011) [7] were compared with the model (Figure 9 and Figure 10). The results show that our model aligns well with the multiple deep seismic reflection data, confirming the credibility of the model. As previously mentioned, the Dongsha Rise exhibits significant high-magnetic anomalies, which correspond to high-magnetism bodies revealed at depths of 20–30 km in the model. In addition, the multiple deep seismic reflection profile reveals a Moho discontinuity beneath the Dongsha Rise (at 125 km along the profile), with a high-velocity body in the lower crust at this location. Our model further indicates that the high-magnetism body beneath the Dongsha Rise is situated at the bottom of the lower crust, with its planar position and depth in good agreement with the distribution of the high-velocity body in the lower crust.
The crustal velocity model of the OBS2006-3 profile across the Dongsha Rise (profile line ⑮ in Figure 1, [7]) shows that the upper crust is relatively thick, exceeding 10 km, and has an anomalous uplift at the base of the upper crust, with a P-wave velocity (Vp) of up to 6.9 km/s. The lower crust is approximately 12 km thick, with a Vp of 7.4 km/s, and exhibits a pronounced uplift. This uplift corresponds well with the horizontal position and depth of the high-magnetism bodies revealed by our susceptibility model, suggesting that crustal thickening and velocity anomalies may be due to mantle-derived, mafic, high-magnetism, and high-density material migrating upward. The intense magmatic activity led to the formation of a high-velocity layer in the lower crust that extends laterally on both sides.
To more clearly illustrate the spatial distribution of high-magnetism bodies, four different profiles were selected for visualization, with the susceptibility distribution and positions shown in Figure 11. The base map represents a horizontal slice of the model at a depth of 25 km, displaying the distribution characteristics of high-susceptibility bodies, primarily composed of intermediate to mafic rocks. The horizontal slice reveals that the peak susceptibility of anomalous bodies (approximately 0.04 SI) forms an NE-trending belt along the Dongsha Rise, with large areas of relatively high-magnetism material (approximately 0.02 SI) and scattered high-magnetism material (approximately 0.03 SI) distributed to the north of the belt. The vertical profiles indicate that the high-magnetism bodies are primarily located in the lower crust (at depths of 20–30 km), suggesting that the high-magnetic anomaly zone in this area is caused by deep, large-scale igneous bodies, which is consistent with the findings of [24]. The magnetization characteristics of the high-magnetic anomaly belt may reflect stronger magmatic activity during the expansion process, similar to the residual magma chambers of fast-spreading mid-ocean ridges. This may challenge the traditional “low-magma” expansion model of the SCS, requiring a reassessment of the expansion rate and magma supply mechanisms.

4.3. The Origin of the Mesozoic Volcanic Arc

The tectonic evolution of the SCS region has long been a focus of research, with many scholars proposing that plate subduction plays a critical role in the geological activities of this area. Huang et al. (2005) [16], based on multiple deep seismic reflection data (profile DPSR2002, marked as profile ② in Figure 1), revealed the potential existence of a subduction zone beneath the Baiyun Depression. The boundary between the Dongsha Rise and the Baiyun Depression is considered to be the junction of the subducting plate and the Moho discontinuity. The study found that the igneous bodies are located above the Moho at the leading edge of the subducting plate, while the uplift of the high-velocity body in the lower crust suggests the upwelling of mantle-derived material. This can be interpreted as the upwelling of mafic material induced by the subducting plate, forming high-temperature magma chambers that gradually evolve into a volcanic arc. Furthermore, to the north of the high-magnetic anomaly belt, the distribution of large areas of higher magnetism material and scattered high-magnetism anomalous bodies may be the result of subsequent upwelling, diffusion, and localized intrusion of mafic mantle-derived material within the plate.
In addition, the drilling data indicate that during the Late Jurassic to Early Cretaceous periods, the sedimentary environment in the Chaoshan Depression transitioned rapidly from deep-sea facies to coastal facies [35]. This suggests that the northern SCS experienced a significant uplift of the continental crust during the Late Jurassic period, corresponding to the subduction of the plate. Overall, the characteristics of the deep magnetic source closely match the multiple deep reflection seismic and OBS seismic data, indicating that the high-magnetic anomalies are consistent with regional deep structures. Petrophysical data indicate that the high-magnetism materials are primarily igneous rocks, and drilling data indicate Mesozoic subduction in the region. According to these findings, it is concluded that the high-magnetic anomaly belt in the northern SCS is caused by a Mesozoic volcanic arc. This volcanic arc extends in an NE direction, with the main depth between 20 and 28 km, stretching from the Dongsha Rise to Taiwan Island. Drilling data from Fan et al. (2022) [35] reveal the rapid uplift of the crust in the northern SCS during the Mesozoic period. Petrochemical composition analysis by Xu et al. (2016) [12] identified Mesozoic granites associated with subduction-related environments. Additionally, multiple deep seismic reflection data from Huang et al. (2005) [16], Gao et al. (2015) [9], Zhang et al. (2025) [17], and others reveal relics of subduction. Based on these results, we propose that these igneous bodies represent the volcanic arc roots formed by the upwelling of mantle-derived material following subduction, acting as magma chambers at the time, with the upper portions erupting to form numerous seamounts [34]. The volcanic arc near the Dongsha Rise has a larger scale, which is inferred to be the initiation point of the subduction zone. Mesozoic sedimentary layers in the northern SCS represent the forearc basin associated with the Mesozoic subduction of the Paleo-Pacific plate, as shown by the seismic reflection data and the results of the drill hole LF35-1-1 [35]. The high-magnetism belt in the lower crust indicates the volcanic arc connecting the forearc basin on the northern margin of the SCS, which contributes to the formation of the Paleo-Pacific Plate subduction system. It suggests that deep melting or the ascent of mantle-derived magma and subduction fluids occurred during the expansion of the SCS or the ancient Pacific subduction process, resulting in the alteration of the lower crust. The high-magnetism belt may be the result of deep magmatic activity triggered by the subduction of the Mesozoic Pacific plate. The dehydration of the subducting plate leads to partial melting of the overlying mantle, forming magma bodies rich in iron and magnesium minerals. The high-magnetism belt is indeed supported by the lower crustal intrusion model. Based on OBS2006-3 [7], which indicates crustal uplift and the presence of a high-velocity layer in the lower crust [10], it is suggested that the high-magnetism bodies were formed by the intrusion of mafic material at the bottom of the lower crust. This intrusion results in the creation of high-magnetism bodies and, subsequently, a high-magnetic anomaly belt.
Our results confirm that the Dongsha–Penghu area corresponds to the position of the volcanic arc of the Mesozoic Pacific subduction, which is consistent with the subduction models of Zhang et al., 2025 and Pan et al., 2024 [11,17], which suggest that the volcanic arc originated from the subduction of the Mesozoic Pacific plate. The identification of the deep anomalous bodies causing the high-magnetic anomaly belt in our study reveals the specific location and spatial configuration of the volcanic arc related to the subduction of the ancient Pacific plate beneath the northern continental margin of the SCS. We believe that this finding contributes to a better understanding of the subduction process and the construction of the subduction system.

5. Conclusions

Our study analyzed high-resolution RTP aeromagnetic anomaly data around the northern SCS and then applied the magnetic 3-D Lp norm regularization inversion method with the constraint of multiple deep seismic reflection data to construct a high-quality 3-D susceptibility model of the crust in this area. We focused on the 3-D distribution characteristics of the Mesozoic volcanic arc, which provides important support for understanding the deep structure of the northern SCS. The following key conclusions can be drawn:
(1)
The mixed Lp norm regularization of magnetic inversion produces a more focused model than conventional regularizations, and the multiple deep seismic reflection data provides effective constraints on the magnetic inversion, thereby significantly reducing the non-uniqueness of the inversion;
(2)
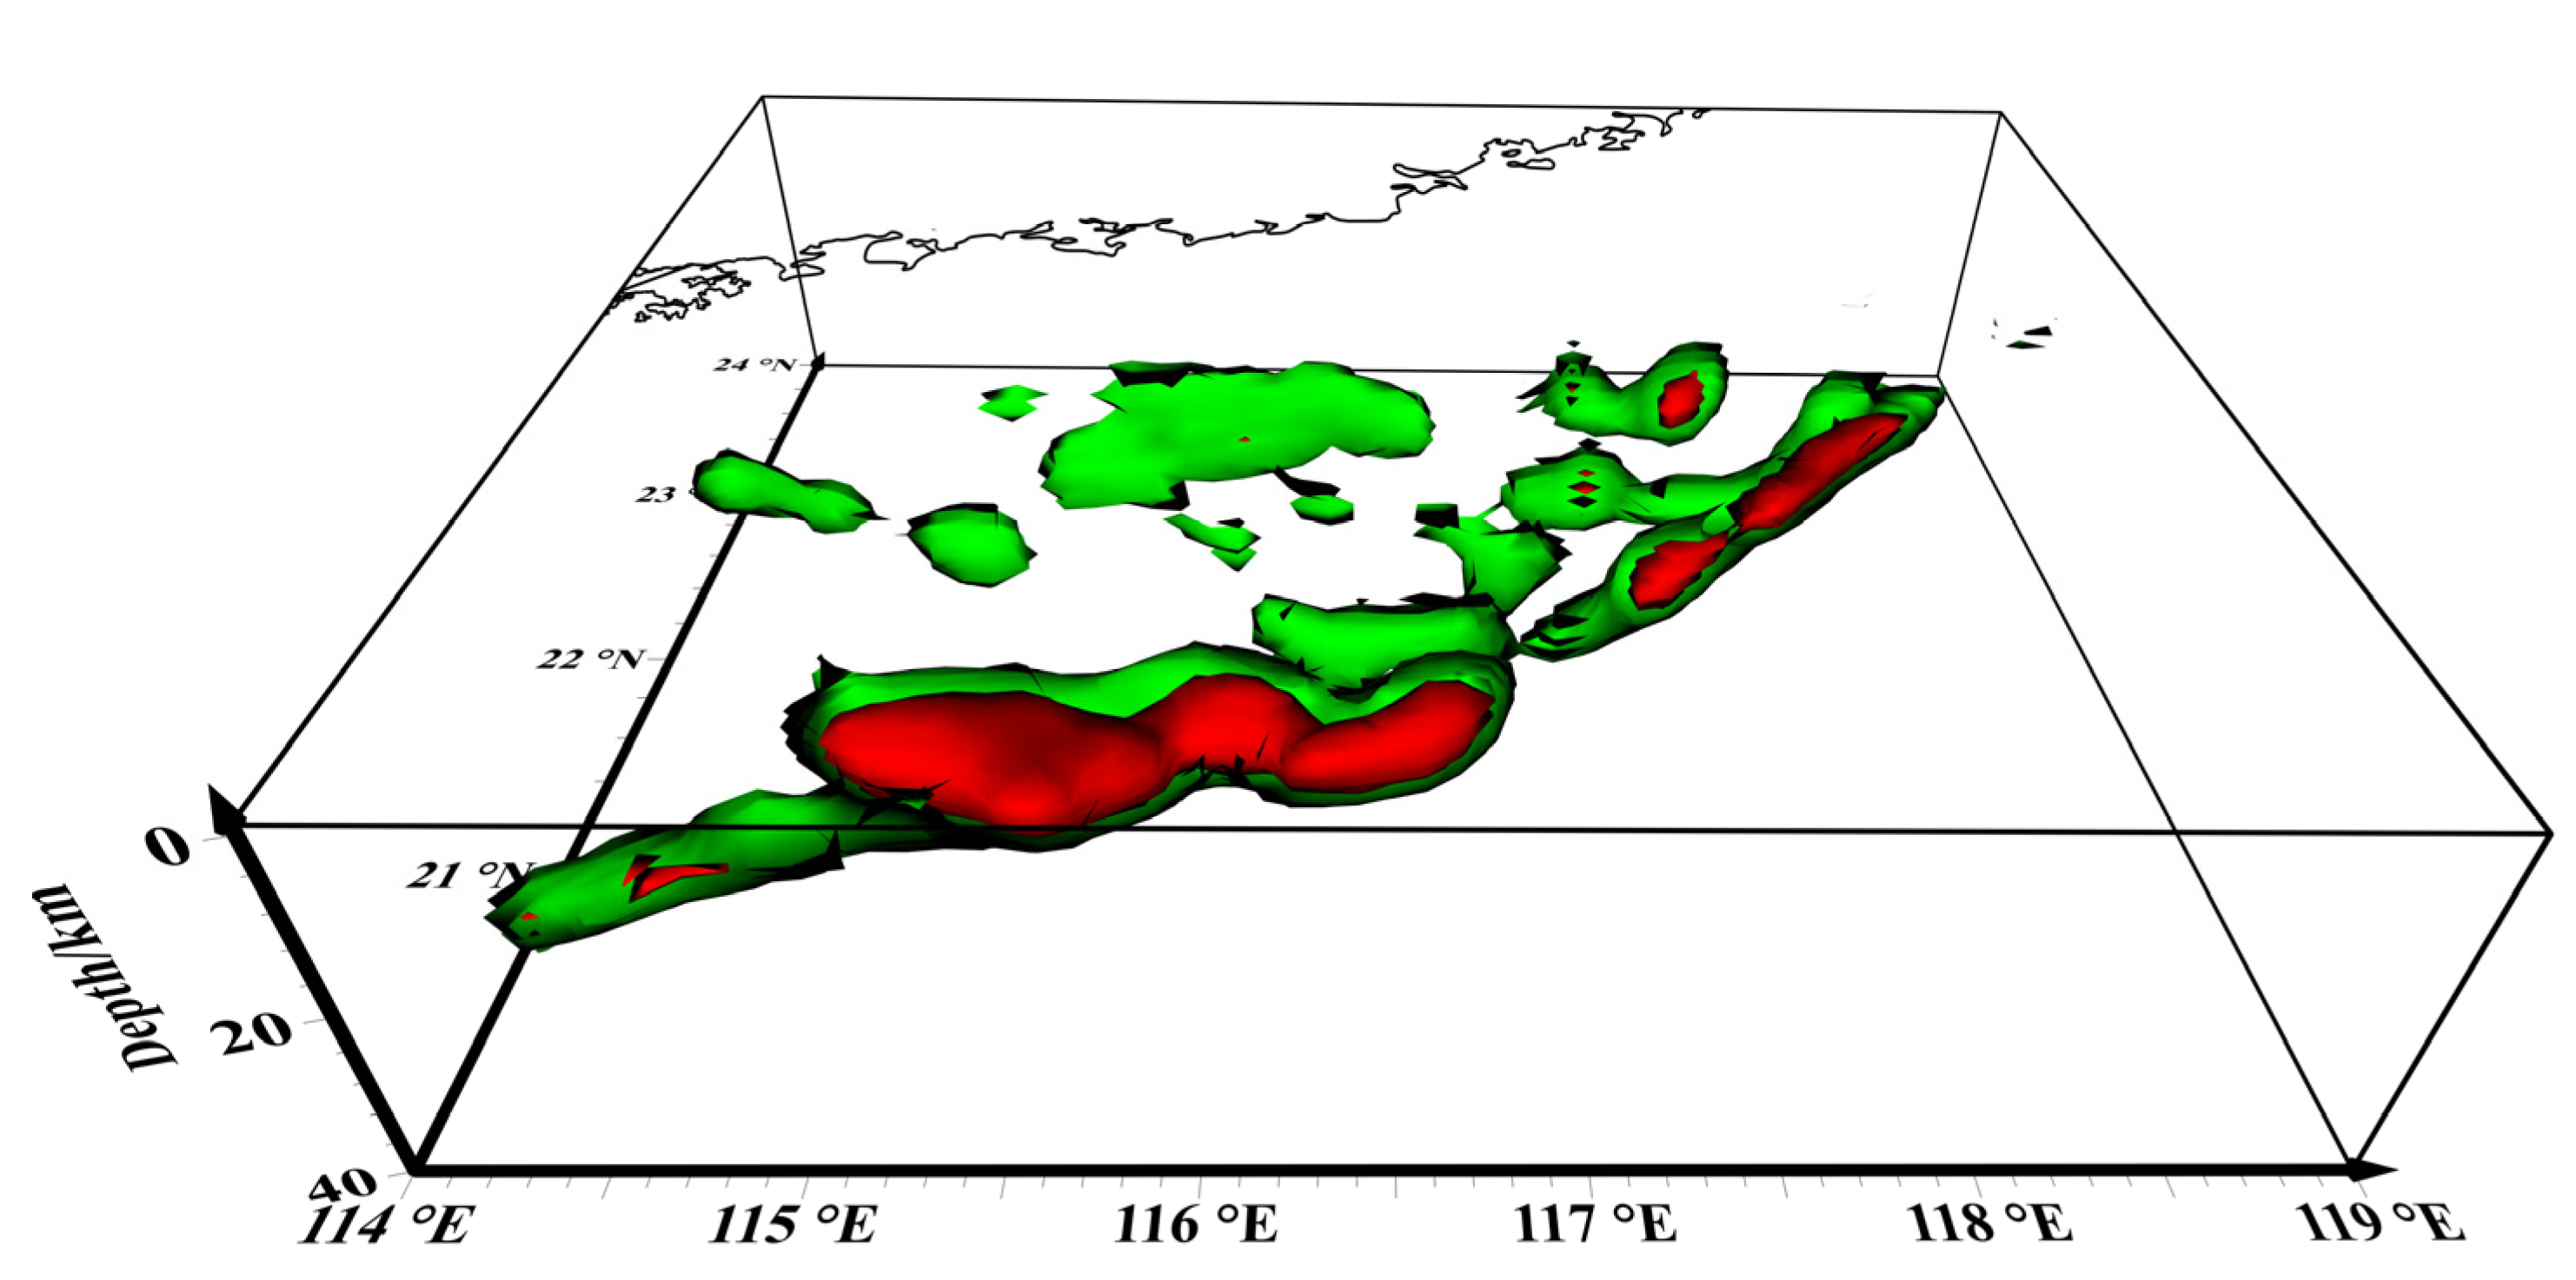
While previous studies have suggested the presence of a Mesozoic volcanic arc in the northern SCS, our model provides new insights to refine the spatial-distributed and compositional characteristics of the arc. The high-magnetic anomaly belt observed in the northern SCS, trending northeastward from the Dongsha Rise to Taiwan Island, is confirmed to be associated with this volcanic arc, which is primarily located within the lower crust at depths ranging from 20 to 28 km;
(3)
The high-magnetism belt in the lower crust revealed in this study indicates a volcanic arc connecting the forearc basin on the northern margin of the SCS, providing evidence for the formation of the Paleo-Pacific plate subduction system. This supports the previously proposed model of Paleo-Pacific subduction in the northern SCS.

Author Contributions

Conceptualization, L.G.; investigation, Z.C.; writing—original draft preparation, Z.C.; writing—review and editing, L.G.; visualization, Z.C.; supervision, L.G.; project administration, L.G.; and funding acquisition, L.G. All authors have read and agreed to the published version of the manuscript.

Funding

This work is supported by the National Science and Technology Major Project of China (2024ZD1000403) and the National Natural Science Foundation of China (41974101). And The APC was funded by the corresponding author Lianghui Guo.

Institutional Review Board Statement

Not applicable.

Informed Consent Statement

Not applicable.

Data Availability Statement

The raw data supporting the conclusions of this article will be made available by the authors on request.

Acknowledgments

We thank researcher Rui Gao at Sun Yat-Sen University for valuable discussions on the tectonics of the SCS. We also thank Xiaolong Wei, a postdoctoral researcher at the University of British Columbia in Canada, for his help and discussions on the magnetic inversion method. We sincerely thank the editor and the anonymous reviewers for their valuable comments and suggestions.

Conflicts of Interest

The authors declare no conflict of interest.

Appendix A

Figure A1. The contour map of magnetic anomaly modulus around the northern SCS.
Applsci 15 02791 g0a1

References

  1. Wang, P.; Huang, C.; Lin, J.; Jian, Z.; Sun, Z.; Zhao, M. The South China Sea is not a mini-Atlantic; plate-edge rifting vs. intra-plate rifting. Natl. Sci. Rev. 2019, 6, 902–913. [Google Scholar] [CrossRef] [PubMed]
  2. Taylor, B.; Hayes, D.E. Origin and History of the South China Sea Basin. In The Tectonic and Geologic Evolution of Southeast Asian Seas and Islands: Part 2; Hayes, D.E., Ed.; Geophysical Monograph, AGU: Washington, DC, USA, 1983; pp. 23–56. [Google Scholar]
  3. Qi, J.; Wu, J.; Ma, B.; Quan, Z.; Neng, Y. The structural model and dynamics concerning middle section, Pearl River Mouth Basin in north margin of South China Sea. Earth Sci. Front. 2019, 26, 203–221. [Google Scholar] [CrossRef]
  4. Lester, R.; Van Avendonk, H.J.; McIntosh, K.; Lavier, L.; Liu, C.S.; Wang, T.K.; Wu, F. Rifting and magmatism in the northeastern South China Sea from wide-angle tomography and seismic reflection imaging. J. Geophys. Res. Solid Earth 2014, 119, 2305–2323. [Google Scholar] [CrossRef]
  5. Wan, K.; Xia, S.; Cao, J.; Sun, J.; Xu, H. Deep seismic structure of the northeastern South China Sea: Origin of a high-velocity layer in the lower crust. J. Geophys. Res. Solid Earth 2017, 122, 2831–2858. [Google Scholar] [CrossRef]
  6. Yan, P.; Zhou, D.; Liu, Z. A crustal structure profile across the northern continental margin of the South China Sea. Tectonophysics 2001, 338, 1–21. [Google Scholar] [CrossRef]
  7. Wei, X.; Ruan, A.; Zhao, M.; Qiu, X.; Li, J.; Zhu, J.; Wu, Z.; Ding, W. A Wide-Angle Obs Profile Across the Dongsha Uplift and Chaoshan Depression in the Mid-Northern South China Sea. Chinese J. Geophys. 2011, 54, 3325–3335. [Google Scholar] [CrossRef]
  8. Zhou, D.; Wang, W.; Pang, X. Mesozoic Subduction Accretionary Zone Revealed by Geophysical Data in the Northeastern South China Sea. Sci. China (Earth Sci.) 2006, 49, 209–218. [Google Scholar]
  9. Gao, J.; Wu, S.; McIntosh, K.; Mi, L.; Yao, B.; Chen, Z.; Jia, L. The Continent-Ocean Transition at the Mid-Northern Margin of the South China Sea. Tectonophysics 2015, 654, 1–19. [Google Scholar] [CrossRef]
  10. Gao, J.; Peng, X.; Wu, S.; Lüdmann, T.; McIntosh, K.; Ma, B.; Xu, Z. Different Expressions of the Crustal Structure Across the Dongsha Rise Along the Northeastern Margin of the South China Sea. J. Asian Earth Sci. 2018, 171, 187–200. [Google Scholar] [CrossRef]
  11. Pan, Z.; Lu, S.; Gao, H.; Li, L.; Chen, H.; Gao, R.; He, Q. Seismic Reflection Imaging Reveals Relict Subduction Zone of the Paleo-Pacific Plate in the Northeastern South China Sea. J. Asian Earth Sci. 2024, 276, 106307. [Google Scholar] [CrossRef]
  12. Xu, C.H.; Shi, H.S.; Barnes, C.G.; Zhou, Z. Tracing a late Mesozoic magmatic arc along the Southeast Asian margin from the granitoids drilled from the northern South China Sea. Int. Geol. Rev. 2016, 58, 71–94. [Google Scholar] [CrossRef]
  13. Wang, J.; Yao, C.; Li, Z. Aeromagnetic anomalies in central Yarlung-Zangbo suture zone (southern Tibet) and their geological origins. J. Geophys. Res. Solid Earth 2020, 125, e2019JB017351. [Google Scholar] [CrossRef]
  14. Wang, J.; Yao, C.; Li, Z.; Zheng, Y.; Shen, X.; Zeren, Z.; Liu, W. 3D inversion of the Sichuan Basin magnetic anomaly in South China and its geological significance. Earth Planets Space 2020, 72, 40. [Google Scholar] [CrossRef]
  15. Liu, Z.; Zhao, Y.; Zhang, Y.; Zhou, X.; He, S.; Xie, Y.; Jiang, S.; Wang, Q.; Huang, Z.; Lin, J. Comprehensive Study on the Geology of the Pearl River Mouth Basin, Liyue Shoal, and Nansha Trough in the South China Sea. J. Trop. Oceanogr. 1997, 12, 7–12. [Google Scholar]
  16. Huang, C.; Zhou, D.; Chen, C.; Hao, H. Deep Crustal Structure of Baiyun Sag Revealed by Deep Reflection Seismic Profiles. Sci. Bull. 2005, 50, 1024–1031. [Google Scholar] [CrossRef]
  17. Zhang, L.; Deng, X.; Cai, C.; Zhou, H.; Gao, R. Mesozoic Paleo-Pacific plate subduction remnants in the northern margin of the South China Sea revealed by deep seismic reflection profile. Chin. J. Geophys. 2025, 68, 623–635. [Google Scholar] [CrossRef]
  18. Yan, P.; Wang, L.; Wang, Y. Late Mesozoic Compressional Folds in Dongsha Waters, the Northern Margin of the South China Sea. Tectonophysics 2014, 615–616, 213–223. [Google Scholar] [CrossRef]
  19. Huang, C.; Xia, K.; Yuan, P.B.; Chen, P.-G. Structural Evolution from Paleogene Extension to Latest Miocene-Recent Arc-Continent Collision Offshore Taiwan: Comparison with On-Land Geology. J. Asian Earth Sci. 2001, 19, 619–638. [Google Scholar] [CrossRef]
  20. McIntosh, K.; Lavier, L.; Van Avendonk, H. Crustal Structure and Inferred Rifting Processes in the Northeast South China Sea. Mar. Pet. Geol. 2014, 58, 612–626. [Google Scholar] [CrossRef]
  21. Min, H.; Ren, J.; Gao, J.; Zuo, Y.S. Location of the Ancient Subduction Zone in the Northern South China Sea and Its Constrains on the Spreading of the South China Sea Basin. Tecton. Metallog. 2010, 34, 599–605. [Google Scholar] [CrossRef]
  22. Wu, Z.; Gao, J.; Li, J.; Zhang, T.; Shen, Z.Y.; Yang, C.G. The characteristics of magnetic anomalies: Implications for Pre-Cenozoic tectonics of the northern South China Sea. Acta Geophys. Sin. 2011, 54, 3292–3302. [Google Scholar] [CrossRef]
  23. Hu, D.; Zhou, D.; Wu, X.; He, M. Origin of high magnetic anomaly belt in northeastern South China Sea as indicated by geophysical inversion. J. Trop. Oceanogr. 2008, 27, 32–37. [Google Scholar] [CrossRef]
  24. Li, F.; Sun, Z.; Yang, H. Possible Spatial Distribution of the Mesozoic Volcanic Arc in the Present-Day South China Sea Continental Margin and Its Tectonic Implications. J. Geophys. Res. Solid Earth 2018, 123, 6215–6235. [Google Scholar] [CrossRef]
  25. Xiong, S.; Fan, Z.; Zhang, H. Aeromagnetic Map of Series of China and Its Adjacent Sea Areas (Scale 1:5,000,000 with Specifications); Geology Press: Beijing, China, 2023. [Google Scholar]
  26. Beamish, D.; Pharaoh, T.C.; Schofield, D.I. A crustal magnetic model of Britain obtained by 3D inversion. Tectonophysics 2021, 814, 228982. [Google Scholar] [CrossRef]
  27. Cui, Y.; Guo, L. A wavenumber-domain iterative approach for 3-D imaging of magnetic anomalies and gradients with depth constraints. J. Geophys. Eng. 2019, 16, 1032–1047. [Google Scholar] [CrossRef]
  28. Sun, J.; Wei, X. Recovering Sparse Models in 3D Potential-Field Inversion Without Bound Dependence or Staircasing Problems Using a Mixed Lp Norm Regularization. Geophys. Prospect. 2021, 69, 901–910. [Google Scholar] [CrossRef]
  29. Wang, B. 3D Lp Inversion and Lithology Identification of Gravity and Magnetic Data and Their Application in a Mining Area in Xinjiang Province. Master’s Thesis, China University of Geosciences, Beijing, China, 2023. [Google Scholar]
  30. Fournier, D.; Oldenburg, W.D. Inversion Using Spatially Variable Mixed Lp Norms. Geophys. J. Int. 2019, 218, 268–282. [Google Scholar] [CrossRef]
  31. Li, T. Measurement and Study of Rock Densities and Magnetic Properties in the Northern South China Sea Coastal and Island Areas. Mar. Geol. Quat. Geol. 1987, 3, 57–69. [Google Scholar]
  32. Liu, S. Study on the Distribution of Basins, Faults and Igneous Rocks by Gravity and Magnetic Data in the South China Sea. Master’s Thesis, China University of Geosciences, Beijing, China, 2016. [Google Scholar]
  33. Gao, R.; Chen, C.; Wang, H.; Lu, Z.; Brown, L.; Dong, S.; Feng, S.; Li, Q.; Li, W.; Wen, Z.; et al. SINOPROBE deep reflection profile reveals a Neo-Proterozoic subduction zone beneath Sichuan Basin. Earth Planet. Sci. Lett. 2016, 454, 86–91. [Google Scholar] [CrossRef]
  34. Fan, C.; Xia, S.; Zhao, F.; Sun, J.; Cao, J.; Xu, H.; Wan, K. New Insights into the Magmatism in the Northern Margin of the South China Sea: Spatial Features and Volume of Intraplate Seamounts. Geochem. Geophys. Geosystems 2017, 18, 2216–2239. [Google Scholar] [CrossRef]
  35. Fan, C.; Xia, S.; Cao, J.; Zhao, F.; Wan, K. Seismic constraints on a remnant Mesozoic forearc basin in the northeastern South China Sea. Gondwana Res. 2022, 102, 77–94. [Google Scholar] [CrossRef]
Figure 3. Magnetic anomalies caused by the synthetic model. The white dashed boxes outline the true cubes, while the black dashed line locates the profile A shown in Figure 4 and Figure 5.
Applsci 15 02791 g003
Figure 7. Three-dimensional prospective map of our crustal susceptibility model in the northern SCS. Only susceptibility greater than 0.02 (SI) is displayed in green, with red representing 0.03 (SI). Black lines represent 0 m isobath.
Applsci 15 02791 g007
Figure 8. (a) Calculated magnetic anomalies of the inversion model and (b) residuals between calculated and real magnetic anomalies. Black lines represent the 0 m isobath. White lines represent the depressions.
Applsci 15 02791 g008
Figure 9. The susceptibility model superimposed the multiple deep seismic reflection profile [10].
Applsci 15 02791 g009
Figure 10. Comparison of the susceptibility model (below) with the OBS2006-3 P-wave velocity model (above) [7]. The red circle in the above map highlights the high-velocity uplift.
Applsci 15 02791 g010
Figure 11. Magnetic inversion results along profiles A~D. ZHU I D: Zhu I depression; PHR: Penghu Rise; TXNB: Taixinan Basin; DSR: Dongsha Rise; CSD: Chaoshan Depression. White lines represent the 0 m isobath.
Applsci 15 02791 g011
Table 1. Physical–property table for geological units in the study area.
Geological UnitMagnetic Susceptibility (×10⁻⁵ SI)Magnetic Characteristics
Seawater Layer0Non-magnetism
Sedimentary Strata0~25Low Magnetism or Non-magnetism
Intermediate to Acidic Intrusions200~4000Moderately High magnetism
Mafic and Ultramafic Intrusions2000~8000High magnetism
Crust0Non-magnetism
Disclaimer/Publisher’s Note: The statements, opinions and data contained in all publications are solely those of the individual author(s) and contributor(s) and not of MDPI and/or the editor(s). MDPI and/or the editor(s) disclaim responsibility for any injury to people or property resulting from any ideas, methods, instructions or products referred to in the content.

