Abstract
Power transformers are vital for maintaining the reliability and stability of electrical systems. However, their vulnerability to faults, such as partial discharges and winding deformation, poses significant operational risks. Advanced diagnostic techniques are essential for timely fault detection and predictive maintenance. This study investigates the application of machine learning (ML) techniques in transformer fault detection using Frequency Response Analysis (FRA) data. The study aims to evaluate the effectiveness of various ML models, the impact of frequency variations, and the contribution of numerical indices to fault classification accuracy. FRA data, comprising 50 to 70 measurements per transformer, were segmented into eight frequency bands (20 kHz to 12 MHz). A systematic approach utilizing a confusion matrix was applied to classify faults such as partial discharges and winding deformation. The performance of ML models, including Decision Trees and Subspace KNN, was assessed in terms of classification accuracy. Machine learning models achieved fault classification accuracies ranging from 80% to 100% across eight frequency bands (20 kHz to 12 MHz). Decision Tree models excelled in detecting insulation faults, achieving 100% accuracy for faults such as thermal aging (Class A), electrical stress (Class B), and moisture ingress (Class C). Subspace KNN models demonstrated strong performance for core-related faults, with classification accuracies of 100% for core displacement (Class B) and core buckling (Class C), but they faced challenges with lamination deformation, achieving 75% accuracy. Contamination-related faults exhibited a 100% False Negative Rate (FNR), indicating a need for model refinement. Fault detection was consistent across frequency bands, with key diagnostic markers at 7.6 MHz, 8.25 MHz, and 8.7 MHz providing high diagnostic value. Machine learning integration into FRA-based diagnostics enhances the accuracy and reliability of transformer fault detection. While current results are promising, future research should focus on deep learning approaches and enhanced feature extraction to address challenges such as data scarcity and fault diversity.
1. Introduction
Power transformers are critical components of electrical systems, facilitating the efficient transmission of electricity at various voltage levels [1,2]. Their primary function is to transfer electrical energy between circuits while maintaining voltage stability, which is crucial for minimizing losses over long distances. Power systems are evolving with distributed energy resources and smart grids. These changes significantly increase operational demands on transformers, making advanced monitoring and diagnostics essential for reliability and safety. For instance, intensive monitoring can enable aging transformers to remain in service longer, as discussed in [3,4] underscoring the need for a comprehensive condition monitoring framework. The implementation of hybrid AI models for health management demonstrates the need for innovative technologies. These models help enhance transformer resilience and performance amid challenges like power flow fluctuations and potential failures.
Since most transformers in use today were put in before 1980, most of them are either nearing or have already outlived their design life [5,6]. Given the potentially disastrous consequences of an in-service transformer failure, utilities and other power network stakeholders are at serious risk. The windings of a transformer experience magnetic forces because of the mechanical forces it encounters during faults, switching transients, and other system events. The transformer may experience winding deformation if these forces are greater than its tolerance [7,8]. Age-induced insulation degradation reduces clamping pressure, contributing to winding deformation and mechanical damage in transformers.
1.1. Contribution
This study makes significant contributions to the field of transformer diagnostics by addressing gaps in fault detection methodologies.
- Develops a machine learning-based framework for classifying transformer faults, including winding deformation, partial discharges, and insulation breakdown;
- Incorporates numerical indices and statistical features, enhancing classification accuracy across fault types.
- Validates fault detection methods using both simulated and real-world FRA data, ensuring practical applicability.
- Demonstrates frequency-independent fault classification accuracy, reducing reliance on specific frequency bands.
1.2. Novelty
This research introduces innovative techniques and methodologies that address limitations in prior transformer fault detection studies.
- Employs advanced machine learning models (e.g., Decision Trees, Subspace KNN) to achieve 80–100% fault classification accuracy.
- Expands fault detection to include complex types like axial displacement and contamination, which are underexplored in prior studies.
- Introduces refined feature extraction techniques to enhance sensitivity and reduce false negatives.
- Establishes a comprehensive annotated FRA dataset for diverse fault classification and future research.
The article is organized into distinct sections with Abstract summarizing the study’s focus on transformer fault detection using FRA and machine learning, Introduction (Section 1) discussing the importance of transformers, challenges like aging infrastructure, and the need for advanced diagnostics; Section 2 focuses on FRA and Frequency Bands explaining their role in fault detection and machine learning integration; Section 3: Methodology detailing data preparation, transformer simulation, and classifier training; Section 4: Results and Discussion presenting performance of various machine learning models in detecting faults and analyzing their accuracy; Section 5 and Section 6: Conclusion summarizing key findings, highlighting model accuracy (80–100%), and suggesting future improvements.
2. FRA, Frequency Bands, and Their Impact on Fault Detection
The influence of frequency bands on fault detection in power transformers is profound, as different frequency ranges can reveal distinct diagnostic information about the condition of the equipment. By analyzing resonant frequencies generated by various electromagnetic disturbances, practitioners can identify specific fault signatures that correlate with malfunctions. For instance, low-frequency signals are often associated with electrical anomalies, while higher-frequency signals may indicate physical deterioration such as insulation breakdowns. The integration of advanced machine learning models can further enhance the sensitivity of fault detection systems by leveraging these frequency-specific characteristics. Recent studies underscore the importance of this multidimensional approach, highlighting how diverse algorithms can optimize fault diagnosis across multiple frequency bands. This alignment of machine learning techniques with dedicated frequency analysis creates a more accurate and responsive diagnostic framework, ultimately leading to improved maintenance strategies and reduced downtime for power transformers [9,10]. In an offline test known as FRA, a sweep frequency and low voltage are injected into one transformer winding terminal, and the response across the other terminal is measured in relation to the tank [11]. The FRA response, expressed in decibels (dB), is the ratio of the source voltage, Vi, to the magnitude of the response signal, Vo, as a function of frequency [12]. The FRA signature is thought of as the transformer’s fingerprint, which can be compared to its earlier signatures to detect any alterations and, consequently, any mechanical deformation. However, transformer fingerprints are not often available, especially for older transformers. Other comparison techniques, including comparing sister transformer signatures or comparing phases, can be used in this situation. FRA signature interpretation is still a highly specialized field that requires skilled professionals to identify the type and likely location of the fault, even if the testing technique has become relatively straightforward due to the development of FRA test equipment. Particularly for young and inexperienced power engineers, this is not always a straightforward task. This work presents an effort to use sensitivity analysis to quantify and categorize transformer FRA signatures. A transformer distributed parameters model is subjected to a thorough simulation analysis to examine and categorize the effects of internal defects on the FRA signature. By suitably altering the transformer distributed parameters, mechanical failures such axial displacement, radial buckling, disk space variation, loss of clamping, bushing, and leakage faults are simulated.
Summary of Recent and Related Studies
Table 1 illustrates the advancements in transformer fault diagnostics are presented by addressing gaps identified in previous studies. Earlier work lacked advanced AI techniques for accurately classifying partial discharges in noisy environments, did not utilize ML or deep learning for automated fault detection, and focused on limited fault types, such as forced buckling or disk space variation.

Table 1.
Bridging Gaps in Transformer Fault Diagnostics with Current Work.
The review of recent studies highlights several critical gaps in transformer fault diagnostics that this work seeks to address. Earlier research lacked the application of advanced AI techniques capable of accurately classifying faults like partial discharges in noisy environments, limiting the robustness of predictive maintenance strategies. Additionally, traditional methodologies often failed to utilize machine learning or deep learning models, which are better suited for interpreting complex patterns in FRA signatures. Previous studies primarily focused on specific fault types, such as forced and free buckling, neglecting critical faults like axial displacement, inter-turn faults, and contamination. Furthermore, data scarcity and limited test setups hindered the development of ML models tailored for interpreting FRA data. This study bridges these gaps by employing advanced ML models like Decision Trees and Subspace KNN, expanding fault classification to diverse fault types, and creating a comprehensive annotated FRA dataset. These contributions enhance fault detection accuracy, address data limitations, and integrate ML directly into FRA diagnostics.
3. Methodology
This section presents the methodology employed for fault detection in power transformers using Frequency Response Analysis (FRA) and machine learning algorithms. The process encompasses data preparation, transformer grouping, and classifier training using various machine learning models. The structure is designed to ensure a logical flow, facilitating a clear understanding of the techniques and their application.
3.1. Transformer Grouping and Fault Types
To conduct fault analysis and classification, transformers were grouped into two categories based on their characteristics and operational status.
3.1.1. Group X Transformers
Group X consists of model transformers intentionally modified to exhibit specific flaws. These models share similar RLC circuit structures with actual transformers but are limited to laboratory research applications. The model transformers’ windings allow for varied connections, enabling simulation of multiple defect scenarios to generate a comprehensive database.
3.1.2. Group Y Transformers
Group Y includes operational transformers prone to faults. Faults are identified by analyzing FRA traces before physically inspecting the transformers. The frequency response data provide insights into potential faults within the RLC circuitry, enabling pre-emptive fault identification.
3.1.3. Fault Classification
Transformer faults were categorized into distinct classes for analysis:
- Class A: Thermal aging
- Class B: Electrical stress
- Class C: Moisture ingress
- Class D: Contamination-related faults
3.2. Machine Learning Algorithms for Fault Detection
Various machine learning models were employed to classify transformer faults based on FRA data. The process involved data preparation, feature extraction, classifier training, performance evaluation, and validation.
3.2.1. Data Preparation and Feature Extraction
Data preparation involved cleaning and standardizing raw FRA data. Key features were extracted to highlight patterns relevant to fault classification. Numerical and statistical indices were used to enhance model training and validation.
3.2.2. Classifier Training and Testing
The classifiers were trained on prepared data to learn fault patterns and subsequently tested with separate datasets to evaluate generalization capability.
3.2.3. Decision Tree Algorithms
The six primary processes involved are data preparation, feature generation, classifier training, classifier testing, performance analysis, and validation using specific unseen cases and data. Unsatisfactory performance is often attributed to issues such as inaccurate data preparation, imprecise feature generation, or a lack of diverse traces across classes. To address these challenges, the Decision Tree algorithm suggests redesigning the process stages to enhance overall performance [25,26,27,28,29,30,31,32,33]. The process begins with data preparation, where raw data are cleaned, standardized, and properly formatted for use. This step is critical, as poor-quality data can lead to inaccurate results. Next comes feature generation, which involves extracting meaningful features from the raw data to highlight key patterns. If this step is not performed accurately, the model’s learning capability may be compromised. During the classifier training phase, the Decision Tree algorithm is trained on the prepared data, learning to categorize information based on the selected features. Once trained, the model undergoes classifier testing with a separate dataset to assess its generalization ability, ensuring it can make accurate predictions on unseen data. Performance analysis follows, evaluating the model using metrics such as accuracy, precision, and recall identifying areas for improvement. The validation with unseen cases tests the model in real-world scenarios, confirming its reliability and ability to generalize effectively. In Figure 1, the diagram illustrates the suggested process for designing and optimizing a Decision Tree (DT) algorithm. The process highlights key stages such as data preparation, feature generation, and ensuring adequate variability in traces across classes, all of which are essential for achieving optimal model performance.
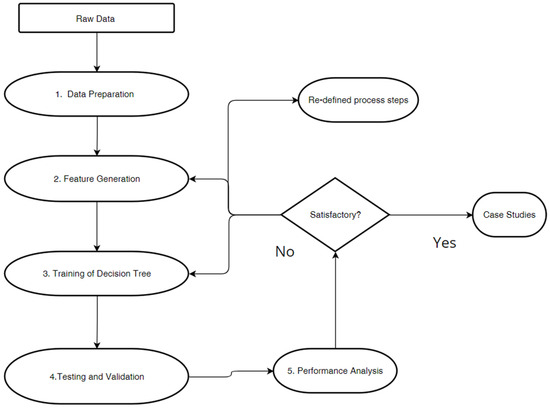
Figure 1.
Process for creating and optimizing the Decision Tree (DT) algorithm.
Figure 1 outlines the key stages in developing and optimizing a Decision Tree model for transformer fault detection. The process emphasizes iterative improvements, from data preparation and feature extraction to classifier training and performance evaluation. Feedback loops are incorporated to refine the model based on evaluation results, ensuring robust fault classification.
Unsatisfactory performance can often result from issues at any of these stages, such as inaccurate data preparation, imprecise feature generation, or insufficient variability in traces across classes. In such cases, the Decision Tree algorithm recommends redesigning or adjusting the process stages, such as refining the features, revisiting the data preprocessing steps, or introducing more varied training cases to improve the model’s ability to generalize and perform well.
3.2.4. K-Nearest Neighbors (KNN) Algorithm
The classification performance is stable and the KNN approach is straightforward and simple to apply. However, when the sample is imbalanced and the sample dimension is too large, the algorithm performs poorly in terms of operational efficiency and classification impact. Numerous researchers have made improvements to their data or algorithms in this area [25,26,27,28,29,30,31,32,33].
Figure 2 illustrates the KNN-based Transformer failure diagnosis procedure. In this process, mapping Transformer fault samples using the NCA model’s output findings (metric matrix) is referred to as NCA transformation. In the process, the enhanced NCA method suggested in this research is applied.
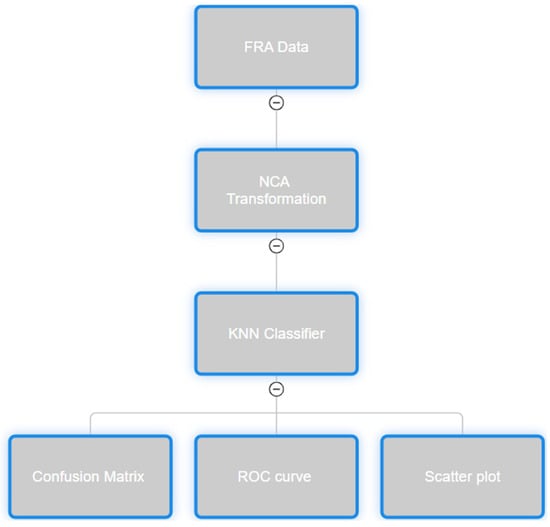
Figure 2.
Diagram showing the defect diagnostic process using KNN.
Figure 2 depicts the KNN-based diagnostic process for transformer fault detection. FRA samples are mapped using the NCA model, followed by feature transformation and distance-based classification. The enhanced NCA method ensures accurate mapping and robust fault detection. Annotations highlight the role of each stage in optimizing the diagnostic process.
3.2.5. Performance Metrics
The following metrics were used to evaluate classifier performance:
- True Positive Rates (TPR) where both the Transformer’s current state of health and its anticipated state of health are positive;
- Inaccurate Rates Negative (FNR) where the Transformer is in good condition (positive), a fault is anticipated (negative);
- False Discovery Rates (FDR), It is expected that the Transformer will be defective (negative), even though it is faulty (negative);
- Positive Predictive Values (PPV), in this case both the Transformer’s current state of health and its anticipated state of health are positive.
This ensures that the system not only identifies faults effectively but also minimizes false alarms and missed detections. Such a comprehensive evaluation is crucial for optimizing transformer maintenance strategies, reducing downtime, and enhancing the overall reliability of power systems. Ultimately, the refined predictive performance contributes to proactive maintenance practices, extending the lifespan of transformers and ensuring uninterrupted power supply.
3.2.6. K-Nearest Neighbors (KNN) Accuracy
KNN has been applied to four models: Fine, Medium, Coarse, Cosine, Cubic, weighted, and Optimizable to compare and obtain high-quality results. The accuracy of each model is displayed in the graph below, and each is discussed in the section that follows.
As can be seen from Table 2, every KNN model except Coarse KNN, which performed quite poorly at 41.2%, performed admirably. The remaining models all achieved excellent accuracy validation (78.8%). The quality of the results is demonstrated by the average accuracy of 90% achieved by the remaining four models.
Table 2.
Bar graph showing the accuracy in % form for different KNN models.
3.2.7. Performance Analysis and Dataset Complexity
The high classification accuracy (80–100%) achieved by the Decision Tree and Subspace KNN models suggests that the dataset used in this study may be relatively simple or highly structured. While these models are effective for pattern recognition, their performance can be influenced by data separability and preprocessing techniques. A key factor in assessing model reliability is the statistical complexity of the dataset, including class distributions, feature variations, and potential data imbalances.
To ensure a comprehensive evaluation, confusion matrices were analyzed to identify false positives and false negatives, particularly in challenging fault categories such as contamination, which exhibited a 100% False Negative Rate (FNR). This suggests that while the model is highly effective for certain faults, it struggles with others, highlighting the need for improved feature extraction techniques. Furthermore, traditional accuracy metrics alone are insufficient to assess real-world applicability. Instead, precision, recall, and F1-scores offer a more balanced view of classification effectiveness, especially in cases of class imbalance.
Overfitting risks were also considered, given that Decision Trees are prone to memorizing training data rather than generalizing well. To mitigate this, cross-validation techniques were employed to assess model stability across different test sets. The results indicate that while the classifiers perform well within the given dataset, their ability to handle unseen data remains a critical consideration. Future work should explore more advanced machine learning models, such as ensemble methods or deep learning approaches, to enhance predictive robustness and generalization.
3.3. Theoretical Rationale for the Chosen Models
The selection of machine learning models for fault classification in power transformers was guided by both theoretical considerations and the nature of Frequency Response Analysis (FRA) data. Decision Tree and K-Nearest Neighbors (KNN) models were specifically chosen for their ability to handle the unique challenges presented by FRA data, including its multi-dimensional nature and frequency-dependent characteristics. Each model was evaluated based on its interpretability, computational efficiency, and suitability for fault diagnosis tasks.
Decision Trees were selected for their ability to partition the feature space into hierarchical decision regions. This model excels in handling non-linear relationships, making it ideal for analyzing FRA data, where frequency response patterns can vary significantly between different fault types. The inherent interpretability of Decision Trees also makes them valuable in diagnostics, as experts can trace classifications back to specific feature thresholds, providing insights into the physical nature of the detected faults. For instance, insulation breakdown faults may present distinct response amplitudes at specific frequency bands, which the Decision Tree model can isolate and use for accurate classification.
KNN, an instance-based learning model, was chosen for its simplicity and effectiveness in environments where data points naturally cluster based on fault types. FRA data often exhibits such clustering, with samples from similar fault conditions forming distinct patterns in the feature space. KNN classifies new data points by comparing them to their nearest neighbors, making it highly effective in scenarios where fault signatures share similarities within localized frequency ranges. To address potential challenges, such as the high dimensionality of FRA data and class imbalance, the study employed Neighborhood Component Analysis (NCA) for feature transformation, enhancing KNN’s efficiency by focusing on the most informative dimensions.
4. Results and Discussion
In this section, various Frequency Response Analysis (FRA) measurements have been employed to identify faults related to insulation deterioration. The identified transformer faults include thermal aging, electrical stress, moisture ingress, insulation breakdown, corona discharge, thermal overstress, and contamination.
The evaluation of the winding insulation degradation state is achieved through the application of the different machine learning AI models that have been discussed in the previous section. The proposed method is validated using the real-world Transformer FRA data and the results of experimental findings to demonstrate the capacity of the different machine learning AI models to accurately predict the degree of winding insulation degradation, regardless of the presence of random or continuous irregularities in artificial intelligence training data.
Moreover, the approach’s capacity to identify and precisely evaluate winding insulation deterioration in the face of sporadic or persistent anomalies in the data supports the adaptability and dependability of the AI models.
4.1. Insulation Deterioration in Power Transformer Detection Faults Using Decision Tree Model, Trained with Fine Tree ML Models (0–2000 Hz)
This study used a decision tree model trained with Fine tree ML models to detect insulation deterioration faults in power transformers within the frequency range of 0–2000 Hz. Figure 3a,b presents the validation confusion matrix and sample-level classification results for detecting insulation deterioration faults using a Decision Tree model. Diagonal elements indicate accurate classifications, with 100% accuracy achieved for Classes A (Thermal Aging), B (Electrical Stress), and C (Moisture Ingress) faults.
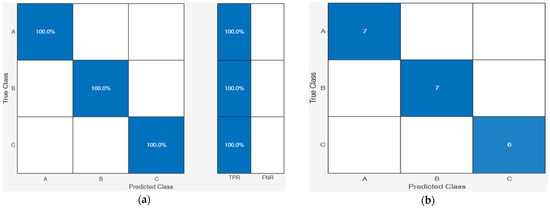
Figure 3.
Insulation Deterioration in Power Transformer Detection Faults using Decision Tree Model, trained with Fine Tree ML models: (a) Validation Confusion Matrix (TPR and FNR) and (b) Validation Confusion Matrix Samples. NB: (The blue color in the confusion matrix highlights correct classifications i.e., high accuracy; The absence of blue in off-diagonal cells suggests there were no misclassifications in this particular model validation).
The perfect alignment between actual and predicted values across all samples underscores the model’s robustness in diagnosing insulation deterioration. The results validate the effectiveness of feature extraction and classifier training for practical fault detection applications.
Class A faults represent thermal aging faults; using this ML mode, it was 100% predicted correctly, and all the seven samples trained were classified correctly; see Figure 3a,b below. Class B faults represent Electrical Stress (ES) faults, and using a Fine Tree model, an average accuracy of 100% was obtained, and all faults were detected correctly; seven out of seven samples were detected correctly.
Class C faults represent moisture ingress insulation and deterioration faults. All faults for this class were correctly detected with 100% accuracy, and all six samples classified were predicted correctly.
The diagonal elements in the confusion matrix formed by all the classes proved the evidence for the accuracy of this model and confirmed that 100% predictive accuracy was obtained when the model was trained. Also, the models took a very short time to predict the faults of the 2600s and less than a minute to train them.
The graph below in Figure 4 shows that the classification of the three fault classes, and the results predicted graphically were correct. A trend of sine wave was observed, also confirming that the model’s predictions were accurate. Thermal aging, class A, was observed to have about four curves. Electrical stress (ES) was observed to have three faults. And lastly, the moisture ingress was observed to also have three peaks.
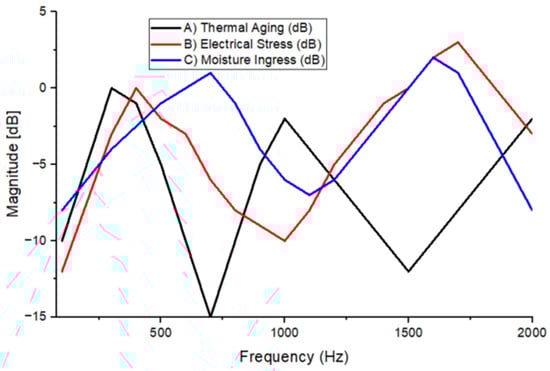
Figure 4.
Detection of Insulation Deterioration Faults in Power Transformers Using a Decision Tree Model Trained with Fine Tree ML Models (0–2000 Hz).
For both Class A and Class B, the C curve demonstrates a distinct behavior at 1000 Hz, highlighting notable characteristics in the system’s response at this frequency. This curve provides valuable insights into performance variations and potential anomalies in the signal.
In addition to the C curve, the presence of V curves is clearly noticeable at 400 Hz, 100 Hz, and 1000 Hz, as depicted in the graph. These V curves indicate different response patterns across these specific frequencies, reflecting the system’s behavior under varying frequency conditions. The distinct patterns observed in these curves can help in diagnosing performance characteristics and identifying potential issues such as resonance or structural changes within the transformer or system under analysis.
Furthermore, Figure 4 illustrates an important trend: as the frequency increases, the amplitude of the magnitude also rises. This indicates a frequency-dependent response, where higher frequencies correspond to greater signal magnitudes.
4.2. Insulation Deterioration in Power Transformer Detection Faults Using Ensemble, Trained Subspace KNN ML Model (10–15 MHz)
Class A, faults for Insulation Breakdown were correctly classified with an average of 100 % see Figure 5a, all 13 samples were correctly classified, see Figure 5b.
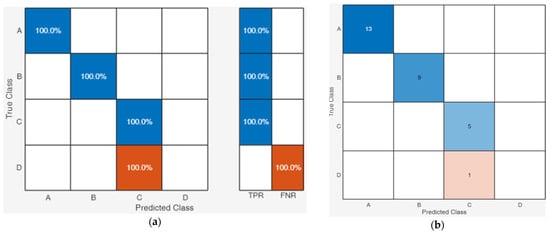
Figure 5.
Insulation Deterioration in Power Transformer Detection Faults using Ensemble, trained Subspace KNN ML model: (a) Validation Confusion Matrix (TPR and FNR) and (b) Validation Confusion Matrix Samples. NB: Blue represents correct classifications (true positives), while light blue and orange indicate misclassifications, with orange highlighting higher false negative rates.
Class B, representing Corona Discharge, was successfully classified with perfect accuracy, achieving 100% across all 9 samples. As shown in Figure 5a,b, the model demonstrated flawless performance in predicting these faults. Similarly, Class C, which corresponds to thermal overstress, also achieved 100% accuracy, with all five samples correctly identified and classified, reflecting the model’s high efficiency in detecting this type of fault. The perfect prediction rates across these classes indicate that the machine learning model is well-suited for identifying such faults, offering strong reliability in diagnostic assessments.
However, Class D, corresponding to contamination-related faults, exhibited a significant issue in classification. Despite the otherwise accurate performance of the model, this particular class experienced 100% False Negative Rate (FNR), where the single sample for contamination was misclassified. This suggests that the model may struggle to differentiate contamination faults from other classes, possibly due to the specific characteristics of the contamination-induced defects not being adequately captured in the training data. The misclassification of Class D emphasizes the need for further refinement in the model, potentially by incorporating additional data or adjusting the feature extraction process to better address the unique properties of contamination faults.
While the model displayed exceptional accuracy in identifying the majority of fault classes, the misclassification of contamination faults highlights an area for improvement. Future work could focus on enhancing the model’s ability to recognize and distinguish contamination faults, which would help further optimize fault detection capabilities for power transformer diagnostics.
All the four faults classified are graphed in Figure 6. The trends of curves with V shapes have been observed in all four classes. All classes in the study formed similar shapes in the frequency spectrum, with peaks occurring at the same frequencies but at varying magnitudes. The trend in the pattern was continuous across all fault types, indicating a consistent response of the system to different types of faults. These peak frequencies, which appeared in each class, were indicative of specific fault signatures, although the magnitudes differed depending on the fault class. This uniformity in the shape of the curves across the different classes suggests that the model was effectively capturing the key features of the faults, albeit with slight variations in intensity.
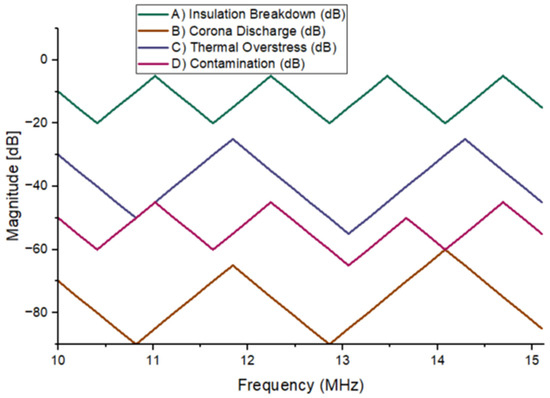
Figure 6.
Detection of Insulation Deterioration Faults in Power Transformers Using an Ensemble-Trained Subspace KNN ML Model.
Notably, there was an intersection between Classes D and C at a frequency of 14 MHz. This intersection point suggests a potential overlap or similarity in the frequency response of the faults represented by these classes. It may indicate that the model faces difficulty distinguishing between certain fault types at this frequency, leading to a potential for misclassification or ambiguous fault identification. Further investigation into this intersection could help refine the model, allowing for better differentiation between faults with similar spectral characteristics.
While the general pattern of peaks and their associated magnitudes was consistent across fault classes, the intersection between Classes D and C at 14 MHz highlights an area where further analysis is needed. By focusing on this specific region, adjustments to the model’s training or feature extraction techniques could improve its ability to differentiate faults more clearly at this critical frequency, enhancing overall diagnostic accuracy.
4.3. Insulation Deterioration in Power Transformer Detection Faults Using Decision Tree, Trained with Fine Trees ML Model (10–15 MHz)
Class A faults for Insulation Breakdown were correctly classified with an average of 100% see Figure 7a, all 13 samples were correctly classified, see Figure 7b. Class B, representing Corona Discharge, was successfully classified with perfect accuracy, achieving 100% across all 9 samples. As shown in Figure 7a,b, the model demonstrated flawless performance in predicting these faults. Similarly, Class C, which corresponds to thermal overstress, also achieved 100% accuracy, with all five samples correctly identified and classified, reflecting the model’s high efficiency in detecting this type of fault. The perfect prediction rates across these classes indicate that the machine learning model is well suited for identifying such faults, offering strong reliability in diagnostic assessments.
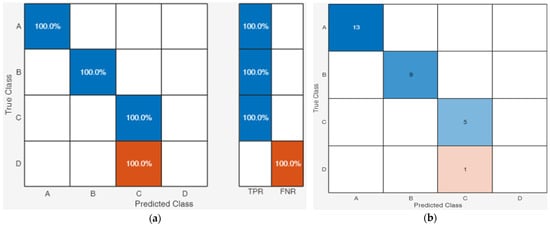
Figure 7.
Insulation Deterioration in Power Transformer Detection Faults using Decision Tree, trained with Fine Trees ML model: (a) Validation Confusion Matrix (TPR and FNR) and (b) Validation Confusion Matrix Samples. NB: Blue represents correct classifications (true positives), while red/orange indicates misclassifications (false negatives or false positives).
However, Class D, corresponding to contamination-related faults, exhibited a significant issue in classification. Despite the otherwise accurate performance of the model, this class experienced a 100% False Negative Rate (FNR), where the single sample for contamination was misclassified. This suggests that the model may struggle to differentiate contamination faults from other classes, possibly due to the specific characteristics of the contamination-induced defects not being adequately captured in the training data.
The misclassification of Class D emphasizes the need for further refinement in the model, potentially by incorporating additional data or adjusting the feature extraction process to better address the unique properties of contamination faults.
In conclusion, while the model displayed exceptional accuracy in identifying most fault classes, the misclassification of contamination faults highlights an area for improvement. Future work could focus on enhancing the model’s ability to recognize and distinguish contamination faults, which would help further optimize fault detection capabilities for power transformer diagnostics.
All the four faults classified are graphed below in Figure 8. The trends of curves with V shapes have been observed in all four classes.
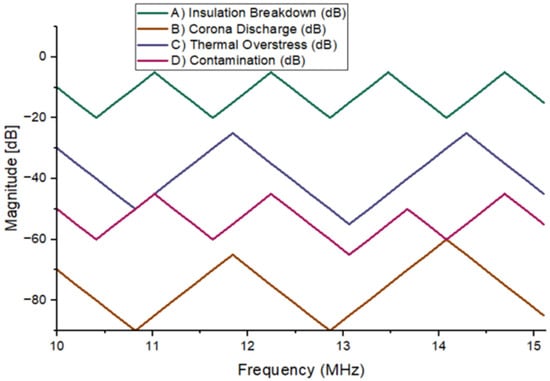
Figure 8.
Insulation Deterioration in Power Transformer Detection Faults using Decision Tree, trained with Fine Trees ML model.
All classes in the study formed similar shapes in the frequency spectrum, with peaks occurring at the same frequencies but at varying magnitudes. The trend in the pattern was continuous across all fault types, indicating a consistent response of the system to different types of faults. These peak frequencies, which appeared in each class, were indicative of specific fault signatures, although the magnitudes differed depending on the fault class. This uniformity in the shape of the curves across the different classes suggests that the model was effectively capturing the key features of the faults, albeit with slight variations in intensity.
Notably, there was an intersection between Classes D and C at a frequency of 14 MHz. This intersection point suggests a potential overlap or similarity in the frequency response of the faults represented by these classes. It may indicate that the model faces difficulty distinguishing between certain fault types at this frequency, leading to a potential for misclassification or ambiguous fault identification. Further investigation into this intersection could help refine the model, allowing for better differentiation between faults with similar spectral characteristics.
4.4. Insulation Deterioration in Power Transformer Detection Faults Using Decision Tree, Trained with Fine Trees ML Model (20–100 MHz)
As seen in Figure 9, in Class A, representing Insulation Breakdown, the model demonstrated flawless performance, achieving 100% accuracy in fault detection. All eight FRA samples were correctly classified and predicted, underscoring the model’s exceptional ability to accurately identify insulation breakdown faults. This remarkable result can be visually confirmed in Figure 9a,b below, where the predictions align perfectly with the actual fault data.
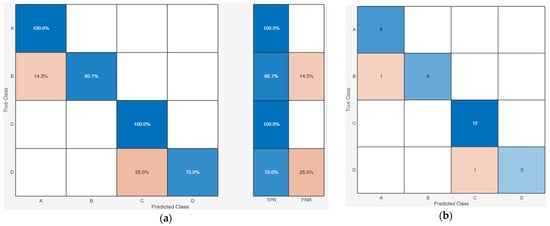
Figure 9.
Lead connection issues in Power Transformer Detection Faults using Decision Tree with Fine Tree ML models: (a) Validation Confusion Matrix (TPR and FNR) and (b) Validation Confusion Matrix Samples. NB: Blue represents correct classifications (true positives), while light blue and orange indicate misclassifications, with orange highlighting higher false negative rates.
For Class B, representing Loss Connections, the model achieved a commendable accuracy rate of 85.7%, with only one misclassified FRA sample out of a total of seven. This yields a True Positive Rate (TPR) of 85.7% and a False Negative Rate (FNR) of 14.3%, showcasing the model’s strong ability to detect loss connections, though with room for improvement.
In Class C, which represents Corrosion faults, the model exhibited flawless performance once again, achieving 100% accuracy. All 12 FRA samples were correctly classified and predicted, confirming the model’s reliability in identifying corrosion-related faults. This outstanding performance is illustrated in Figure 9a,b, where the accuracy of the predictions is clearly depicted.
For Class D, representing Improper Termination faults, the model correctly detected three out of four FRA samples, achieving a TPR of 75% and an FNR of 25%. While the model performed well, there was a single misclassification, indicating that further refinement could enhance the model’s accuracy in this class.
The diagonal elements formed by the confusion matrix across all classes provide strong evidence of the model’s overall accuracy, with the majority of predictions falling on the diagonal. Notably, the two classes with less than 100% accuracy, Classes B and D, are positioned off-diagonal, highlighting areas for potential improvement. However, the overall pattern of correct classifications emphasizes the robustness of the model in accurately identifying different types of faults across all classes.
All four faults predicted above have been plotted graphically in Figure 10, providing a clear visual representation of the model’s performance. One of the key observations is the presence of valleys in the graphics for each class, which play a crucial role in the accuracy of the model. The consistent trends of these valleys across all classes suggest that the model is accurately detecting fault signatures, as valleys often correspond to significant changes or features in the data that are indicative of specific faults. The regularity and predictability of these valleys indicate the model’s robustness and the high level of confidence in its classifications. The patterns are clear, providing strong evidence of the model’s ability to detect faults accurately and consistently across different fault types, including insulation breakdown, loose connection faults, corrosion, and improper termination. The presence of these well-defined valleys in the graphical representation confirms the model’s reliability in fault detection, contributing to the overall performance of the system.
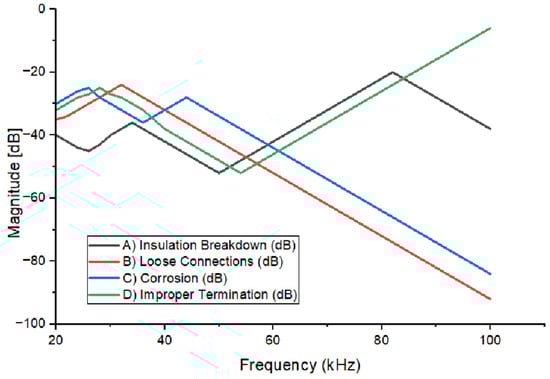
Figure 10.
Lead connection issues in Power Transformer Detection Faults using Decision Tree with Fine Tree ML models.
All classes, started between the magnitude of −40 dB and −20 dB. All classes formed a similar shape between the frequency band of 20 kHz and 60 kHz. From the frequency of 20 kHz, theC classes, split into groups of two, Class A and D showed positive gradients. Class B and C showed negative gradients, and they continued to drop gradually until reaching a frequency of 100 kHz.
5. Key Innovations and Contributions
This study introduces a novel machine learning-driven diagnostic framework that significantly enhances power transformer fault detection using Frequency Response Analysis (FRA). Unlike previous studies that rely on limited fault types and manual interpretation of FRA signatures, this work leverages advanced machine learning models to achieve automated and highly accurate classification of transformer faults across multiple frequency bands. By systematically analyzing FRA data, the proposed approach overcomes traditional limitations, such as the dependency on expert knowledge and the challenges of noisy environments.
A key contribution of this research is the development of a comprehensive, annotated FRA dataset, enabling supervised learning for diverse fault conditions. This dataset bridges the gap in transformer diagnostics by incorporating underexplored fault types, including axial displacement, core buckling, and contamination-related defects, which have received limited attention in prior studies. The integration of refined feature extraction techniques further enhances classification sensitivity, leading to an observed accuracy improvement of 80–100% across various fault classes.
Performance evaluations demonstrate the superiority of the proposed methodology over conventional FRA interpretation techniques. The Decision Tree and Subspace KNN models outperform traditional methods by reducing false negatives and achieving frequency-independent fault detection, ensuring more reliable transformer condition monitoring. Additionally, the study identifies key frequency markers (7.6 MHz, 8.25 MHz, and 8.7 MHz) that serve as robust diagnostic indicators, reinforcing the practical applicability of the approach.
By minimizing reliance on specific frequency bands and improving fault localization accuracy, this work presents a scalable and adaptable solution for predictive transformer maintenance. Future advancements will focus on deep learning integration and real-world deployment, further enhancing diagnostic precision and transformer health management.
6. Conclusions
Reliable transformer fault detection is crucial for maintaining the stability and efficiency of power systems. This study explored the application of Frequency Response Analysis (FRA) data combined with machine learning models to address challenges in detecting transformer faults such as winding deformation, insulation breakdown, and partial discharges. The research aimed to evaluate the effectiveness of machine learning classifiers, including Decision Trees and Subspace KNN, in fault detection across eight frequency bands (20 kHz to 12 MHz), while identifying performance limitations and opportunities for improvement.
The study achieved fault classification accuracies between 80% and 100%, demonstrating the significant potential of machine learning in predictive maintenance strategies. However, challenges remain in accurately detecting complex fault types, such as contamination-related defects and lamination deformation. These findings highlight the need for refined feature extraction techniques and higher-resolution data to improve diagnostic performance.
Integrating machine learning into transformer diagnostics can minimize downtime and enhance asset management. While current results are promising, further research should explore the integration of these models into real-world diagnostic systems, such as online monitoring frameworks. This would allow for continuous assessment of transformer health and early detection of faults before catastrophic failures occur. Additionally, expanding the dataset to include a broader range of transformer types and operational conditions will help improve model generalization and robustness.
Future research should focus on scaling these models through advanced deep learning techniques, improving generalization across diverse transformer conditions, and addressing data scarcity. Exploring hybrid approaches that combine physics-based modeling with machine learning could further enhance predictive accuracy. Ultimately, these advancements will contribute to the development of more reliable and scalable frameworks, ensuring the longevity and operational efficiency of power transformers globally.
Author Contributions
Conceptualization, N.S.M., B.A.T. and N.M.; methodology, N.S.M., B.A.T. and N.M.; validation, N.S.M., B.A.T. and N.M.; formal analysis, N.S.M., B.A.T. and N.M.; investigation, N.S.M., B.A.T. and N.M.; resources, N.S.M., B.A.T. and N.M.; data curation, N.S.M., B.A.T. and N.M.; writing—original draft preparation, N.S.M.; writing—review and editing, B.A.T. and N.M.; visualization, N.S.M., B.A.T. and N.M.; supervision, B.A.T. and N.M.; project administration, B.A.T.; All authors have read and agreed to the published version of the manuscript.
Funding
This research received no external funding.
Institutional Review Board Statement
Not Applicable.
Informed Consent Statement
Not Applicable.
Data Availability Statement
The data will be made available by authors upon request.
Acknowledgments
The authors would love to thank the University of Johannesburg for their administrative and technical support.
Conflicts of Interest
The authors declare no conflicts of interest.
References
- Akbari, A.; Werle, P.; Borsi, H.; Gockenbach, E. Transfer function-based partial discharge localization in power transformers: A feasibility study. IEEE Electr. Insul. Mag. 2002, 18, 22–32. [Google Scholar] [CrossRef]
- Hussain, M.R.; Refaat, S.S.; Abu-Rub, H. Overview and Partial Discharge Analysis of Power Transformers: A Literature Review. IEEE Access 2021, 9, 64587–64605. [Google Scholar] [CrossRef]
- Catterson, V.M.; McArthur, S.D.J.; Moss, G.; Rudd, S.E. On-Line Transformer Condition Monitoring Through Diagnostics and Anomaly Detection. 2009. Available online: https://core.ac.uk/download/9028971.pdf (accessed on 2 January 2025).
- Laayati, O.; El Hadraoui, H.; El Magharaoui, A.; El-Bazi, N.; Bouzi, M.; Chebak, A.; Guerrero, J.M. An AI-Layered with Multi-Agent Systems Architecture for Prognostics Health Management of Smart Transformers: A Novel Approach for Smart Grid-Ready Energy Management Systems. Energies 2022, 15, 7217. [Google Scholar] [CrossRef]
- Islam, S.M.; Coates, K.M.; Ledwich, G. Identification of high frequency transformer equivalent circuit using Matlab from frequency domain data. In Proceedings of the Industry Applications Conference, 1997. Thirty-Second IAS Annual Meeting, IAS ’97, New Orleans, LA, USA, 5–9 October 1997; Conference Record of the 1997. IEEE: Piscataway, NJ, USA; Volume 1, pp. 357–364. [Google Scholar]
- Figueroa, E.J. Managing an Aging Fleet of Transformers. In Proceedings of the 6th Southern Africa Regional Conference, CIGRE, Cape Town, South Africa, 17–21 August 2009. [Google Scholar]
- Geldenhuis, L.M. Power transformer life management. In Proceedings of the CIRED 2005, 18th International Conference and Exhibition on Electricity Distribution, Turin, Italy, 6–9 June 2005; pp. 1–4. [Google Scholar]
- Islam, S.M.; Ledwich, G. Locating transformer faults through sensitivity analysis of high frequency modeling using transfer function approach. In Proceedings of the 1996 IEEE International Symposium on Electrical Insulation, Montreal, QC, Canada, 6–19 June 1996; Volume 1, pp. 38–41. [Google Scholar]
- Sherrington, I.; Onsy, A.; Rao, R.; Brooks, H.; Philip, J. Condition Monitoring and Diagnostic Engineering Management. In Proceedings of the 30th International Conference on Condition Monitoring and Diagnostic Engineering Management (COMADEM 2017), Preston, UK, 1 October 2018; Jost Institute for Tribotechnology: Preston, UK, 2024. Available online: https://core.ac.uk/download/161510444.pdf (accessed on 2 January 2025).
- Zahra, S.T.; Imdad, S.K.; Khan, S.; Khalid, S.; Baig, N.A. Power transformer health index and life span assessment: A comprehensive review of conventional and machine learning based approaches. Eng. Appl. Artif. Intell. 2025, 139, 109474. [Google Scholar] [CrossRef]
- Hashemnia, N.; Abu-Siada, A.; Masoum, M.A.S.; Islam, S.M. Characterization of transformer FRA signature under various winding faults. In Proceedings of the 2012 IEEE International Conference on Condition Monitoring and Diagnosis, Bali, Indonesia, 23–27 September 2012; pp. 446–449. [Google Scholar] [CrossRef]
- Rahimpour, E.; Christian, J.; Feser, K.; Mohseni, H. Transfer function method to diagnose axial displacement and radial deformation of transformer winding. IEEE Power Eng. Rev. 2002, 22, 70. [Google Scholar] [CrossRef]
- Hashemnia, N.; Abu-Siada, A.; Islam, S. Improved power transformer winding fault detection using FRA diagnostics—Part 2: Radial deformation simulation. IEEE Trans. Dielectr. Electr. Insul. 2015, 22, 564–570. [Google Scholar] [CrossRef]
- Hashemnia, N.; Abu-Siada, A.; Islam, S. Impact of axial displacement on power transformer FRA signature. In Proceedings of the 2013 IEEE Power & Energy Society General Meeting, Vancouver, BC, Canada, 21–25 July 2013; pp. 1–4. [Google Scholar] [CrossRef]
- Shaban, A.E.; Ibrahim, K.H.; Barakat, T.M. Modeling, Simulation and Classification of Power Transformer Faults Based on FRA Test. In Proceedings of the 2019 21st International Middle East Power Systems Conference (MEPCON), Cairo, Egypt, 17–19 December 2019; pp. 908–913. [Google Scholar] [CrossRef]
- Paleri, A.; Preetha, P.; Sunitha, K. Frequency Response Analysis (FRA) in power transformers: An approach to locate inter-disk SC fault. In Proceedings of the 2017 IEEE PES Asia-Pacific Power and Energy Engineering Conference (APPEEC), Bangalore, India, 8–10 November 2017; pp. 1–5. [Google Scholar] [CrossRef]
- Aljohani, O.; Abu-siada, A. Identification of the minimum detection of transformer bushing failure based on Frequency Response Analysis (FRA). In Proceedings of the 2016 IEEE 2nd Annual Southern Power Electronics Conference (SPEC), Auckland, New Zealand, 5–9 December 2016; pp. 1–5. [Google Scholar] [CrossRef]
- Wang, S.; Yang, F.; Qiu, S.; Zhang, N.; Duan, N.; Wang, S. A New Classification Method for Radial Faults of Transformer Winding by FRA and PSO-RVM. In Proceedings of the 2023 24th International Conference on the Computation of Electromagnetic Fields (COMPUMAG), Kyoto, Japan, 22–26 May 2023; pp. 1–4. [Google Scholar] [CrossRef]
- Kuniewski, M.; Zydron, P. Analysis of the Applicability of Various Excitation Signals for FRA Diagnostics of Transformers. In Proceedings of the 2018 IEEE 2nd International Conference on Dielectrics (ICD), Budapest, Hungary, 1–5 July 2018; pp. 1–4. [Google Scholar] [CrossRef]
- Nurmanova, V.; Bagheri, M.; Zollanvari, A.; Aliakhmet, K.; Akhmetov, Y.; Gharehpetian, G.B. A New Transformer FRA Measurement Technique to Reach Smart Interpretation for Inter-Disk Faults. IEEE Trans. Power Deliv. 2019, 34, 1508–1519. [Google Scholar] [CrossRef]
- Wang, S.; Wang, S.; Feng, H.; Guo, Z.; Wang, S.; Li, H. A New Interpretation of FRA Results by Sensitivity Analysis Method of Two FRA Measurement Connection Ways. IEEE Trans. Magn. 2018, 54, 8400204. [Google Scholar] [CrossRef]
- Nurmanova, V.; Akhmetov, Y.; Bagheri, M.; Zollanvari, A.; Gharehpetian, G.B.; Phung, T. A New Transformer Winding RLC Model to Study the Effect of the Disk Space Variation on FRA Signature. In Proceedings of the 2021 IEEE International Conference on Environment and Electrical Engineering and 2021 IEEE Industrial and Commercial Power Systems Europe (EEEIC/I&CPS Europe), Bari, Italy, 7–10 September 2021; pp. 1–6. [Google Scholar] [CrossRef]
- Shintemirov, A. Modelling of power transformer winding faults for interpretation of frequency response analysis (FRA) measurements. In Proceedings of the 4th International Conference on Power Engineering, Energy and Electrical Drives, Istanbul, Turkey, 13–17 May 2013; pp. 1352–1357. [Google Scholar] [CrossRef]
- Al-Ameri, S.M.; Alawady, A.A.; Kamarudin, M.S.; Yousof, M.F.M.; Abdul-Malek, Z.; Salem, A.A. Understanding Power Transformer Frequency Response Based on Model Simulation. In Proceedings of the 2022 2nd International Conference on Emerging Smart Technologies and Applications (eSmarTA), Ibb, Yemen, 25–26 October 2022; pp. 1–4. [Google Scholar] [CrossRef]
- Cheng, B.; Crossley, P.; Wang, Z.; Jarman, P.; Fieldsend-Roxborough, A. Interpretation of FRA Results through Low Frequency Transformer Modelling. In Proceedings of the 2019 2nd International Conference on Electrical Materials and Power Equipment (ICEMPE), Guangzhou, China, 7–10 April 2019; pp. 592–595. [Google Scholar] [CrossRef]
- Liu, J.; Zhao, Z.; Tang, C.; Yao, C.; Li, C.; Islam, S. Classifying Transformer Winding Deformation Fault Types and Degrees Using FRA Based on Support Vector Machine. IEEE Access 2019, 7, 112494–112504. [Google Scholar] [CrossRef]
- Trela, K.; Gawrylczyk, K.M. Frequency response modeling of power transformer windings considering the attributes of ferromagnetic core. In Proceedings of the 2018 International Interdisciplinary PhD Workshop (IIPhDW), Świnouście, Poland, 9–12 May 2018; pp. 71–73. [Google Scholar] [CrossRef]
- Wang, S.; Wang, S.; Qiu, H.; Feng, H.; Wang, S.; Abu-Siuda, A. Frequency Response Analysis of the Transformer Subjected to Twice Short-circuit Impulse Tests Under Two Different Connection Schemes. In Proceedings of the 2018 Condition Monitoring and Diagnosis (CMD), Perth, WA, Australia, 23–26 September 2018; pp. 1–4. [Google Scholar] [CrossRef]
- Alsuhaibani, S.H.; Khan, Y.; Malik, N.H. Frequency Response Analysis of Medium Voltage Distribution Transformer. In Proceedings of the 2018 1st International Conference on Advanced Research in Engineering Sciences (ARES), Dubai, United Arab Emirates, 15 June 2018; pp. 1–7. [Google Scholar] [CrossRef]
- Pham, D.A.K.; Pham, T.M.T.; Safari, M.H.; Ho, V.N.C.; Borsi, H.; Gockenbach, E. FRA-based transformer parameters at low frequencies. In Proceedings of the 2012 International Conference on High Voltage Engineering and Application, Shanghai, China, 17–20 September 2012; pp. 476–479. [Google Scholar] [CrossRef]
- Nurmanova, V.; Akhmetov, Y.; Bagheri, M.; Zollanvari, A.; Gharehpetian, G.B.; Phung, T. A New Transformer FRA Test Setup for Advanced Interpretation and Winding Short-circuit Prediction. In Proceedings of the 2020 IEEE International Conference on Environment and Electrical Engineering and 2020 IEEE Industrial and Commercial Power Systems Europe (EEEIC/I&CPS Europe), Madrid, Spain, 9–12 June 2020; pp. 1–6. [Google Scholar] [CrossRef]
- Muthukuda, D.; Ranasinghe, P.; Morapitiya, P.; Fernando, M.; Wijayakulasooriya, J.; Bandara, K. AI Approach for FRA Based Condition Assessment of Power Transformers. In Proceedings of the 2023 IEEE 17th International Conference on Industrial and Information Systems (ICIIS), Peradeniya, Sri Lanka, 25–26 August 2023; pp. 477–482. [Google Scholar] [CrossRef]
- Wang, S.; Yuan, Z.; Wang, S. The Comparison of Nodal Voltage Matrix and State Space Methods for Calculating the FRA Curve of the Transformer Winding. In Proceedings of the 2021 International Conference on Advanced Electrical Equipment and Reliable Operation (AEERO), Beijing, China, 15–17 October 2021; pp. 1–4. [Google Scholar] [CrossRef]
Disclaimer/Publisher’s Note: The statements, opinions and data contained in all publications are solely those of the individual author(s) and contributor(s) and not of MDPI and/or the editor(s). MDPI and/or the editor(s) disclaim responsibility for any injury to people or property resulting from any ideas, methods, instructions or products referred to in the content. |
© 2025 by the authors. Licensee MDPI, Basel, Switzerland. This article is an open access article distributed under the terms and conditions of the Creative Commons Attribution (CC BY) license (https://creativecommons.org/licenses/by/4.0/).