Abstract
This work presents a comparative analysis of microwave ablation applicators, including both antenna-based and open waveguide designs, which are guided and inserted into tumors via catheters. Applicators previously proposed in the literature are evaluated through both electromagnetic and thermal simulations. The objective is to assess temperature distribution within the tumor and surrounding healthy tissues; with a focus on identifying patterns of heat diffusion. Although a variety of applicators have been designed, each typically operates at different central frequency or targets specific tumor shapes and tissue types. In this study, we standardize conditions by analyzing multiple applicators’ designs for the same tumor type. The results highlight the shape of the ablation zone and corresponding temperature distribution, offering insights into potential healthy tissue damage. This comparative analysis provides critical information for optimizing microwave ablation applicators for more precise and effective treatment.
1. Introduction
Microwave ablation (MWA) has emerged as a prominent thermal therapy technique for the treatment of tumors. As a minimally invasive procedure, it offers a promising alternative to traditional surgical methods, providing the benefits of reduced recovery time, lower risk of complications and side effects and the potential for outpatient treatment. Therefore, MWA is a powerful tool in the fight against cancer, a disease that has plagued humanity from its emergence and is one of the leading causes of death worldwide. The primary mechanism of MWA involves the use of microwave energy to generate heat, inducing localized coagulative necrosis of tumor cells. This procedure has been effectively applied to a range of cancers, including liver, lung, kidney, bone tumors etc., making it a versatile tool in the oncological arsenal [1,2,3,4,5].
The efficacy and safety of microwave tumor ablation heavily depends on the design and performance of the microwave applicator and the device responsible for delivering microwave energy to the targeted tissue [6]. Various microwave applicators have been developed, each with unique characteristics that influence their heating patterns, penetration depth, and overall ablation efficiency. The fundamental designs for antennas include monopole, dipole, and slot antennas [6,7,8,9,10,11]. These antennas typically generate “comet-shaped” ablation zones due to backward heating along the antenna shaft, that in turn is caused by leaking currents mainly resulting from the unbalanced structure of the antennas. This leads to the unintended burning of not only the tumor but also of healthy tissue. To address this issue, modified antennas have been proposed through the incorporation of chokes or sleeves [6,7,12,13,14,15,16,17,18]. These modifications improve the radiation pattern and reduce the backward heating effect, thereby minimizing the tail of the comet-shaped ablation zones.
Initially, chokes and sleeves were added externally to the antenna, but more recent designs have integrated these components within the antenna structure to reduce invasiveness [6,7,19,20]. Additionally, backward heating has been mitigated by incorporating more slots into the antenna design [6,7,21,22,23,24,25,26] or by employing cooling systems (water-cooled antennas [27,28,29,30,31], gas-cooled antennas [32,33,34]). Alternative designs include helix and spiral antennas [7,35,36,37,38,39,40,41] and flexible antennas as well [42]. Finally, in case it is not possible to achieve the desired efficiency when optimizing the structural/electrical parameters of the antenna alone, an impedance matching network can be introduced into the design to further enhance the antenna’s performance [6,35].
Another solution to achieve impedance matching and improve the antenna’s performance is a balun (balanced-to-unbalanced transformer). This is a critical component in antenna systems to transition between balanced and unbalanced circuits while preserving the desired signal characteristics. Balanced systems, such as dipole antennas, have two symmetrical conductors with equal and opposite currents, while unbalanced systems, such as coaxial cables, consist of a single conductor with a return path through a ground plane. Without a balun, the unbalanced nature of the feed line can induce undesired currents on the outer surface of the coaxial cable, leading to distortions in the radiation pattern, increased reflections, and unwanted heating along the feed line. Various balun designs have been developed to address these issues, including λ/4 sleeves, choke baluns, and tapered-slot configurations. These designs introduce high-impedance points or suppress surface currents, ensuring effective impedance matching and minimizing interference. The choice of balun modification depends on the specific application, bandwidth requirements, and physical constraints, making it a versatile solution for achieving efficient and reliable antenna performance in diverse scenarios.
Therefore, the choice of applicator plays a crucial role in achieving optimal therapeutic outcomes. Factors such as the geometry of the applicator, operating frequency and cooling mechanisms can significantly affect the precision of energy delivery and the extent of the ablation zone.
The designed applicators include the monopole (initial design) [43], capacitive capped monopole antenna [44], dual-slot antenna [45], multi-slot antenna [21], floating sleeve dipole (FSD) antenna [46], choke dipole antenna [47], triaxial antenna [47], balun-free base-fed monopole (balun-free helical antenna) [47], balun-free helical dipole antenna [48], and a helical open waveguide structure (featuring a helix with an increasing radius starting at the end of the outer conductor of the coaxial cable) [41]. The selection of these designs is deliberate. The basic monopole design was initially implemented to observe the comet-shaped ablation zone, followed by the dual-slot antenna, a modified design intended to address the backward heating issue. The triaxial and choke dipole antennas, along with the FSD dipole antenna, were incorporated because they are utilized in commercial MWA systems approved by the U.S. Food and Drug Administration (FDA) [47]. According to [21,44], multi-slot antenna and capacitive capped monopole antenna provide more spherical ablation zones than others. Moreover, the FSD antenna was implemented on the grounds that it provides similar results to the balun-free helical antenna. Finally, all helical designs were included to compare them with our recent work [41].
The first part of this study concerns the benefits of helical open waveguide structure and the comparison with monopole. Then, the work focuses on the precise simulation of all these designs as presented in previous works. To ensure accuracy, the dimensions, lengths, boundaries, frequency, properties, and materials used were closely aligned with those in the corresponding papers. This alignment is essential for conducting a fair and valid comparison of all indicative applicators considered. After performing the simulations and confirming that the results, specifically the temperature distribution, closely match those of the corresponding parsing studies, the final part of the study is undertaken. This involves implementing all designs within a two-compartment model (tumor and healthy tissue), which provides a reasonably accurate representation of anatomical geometry [49].
This paper aims at comparing the different microwave applicators used in microwave tumor ablation, focusing on their design principles and studying for the same tumor. These published studies have mainly focused on the liver using a two-compartment model, which applies different properties to tumor and healthy tissue. A two-compartment model is already a good approximation in terms of anatomical geometry. However, it is crucial to use accurate tissue properties for each compartment, as the predicted treatment outcome is highly sensitive to these parameters. Ultimately, this study compares the temperature distribution of different applicators when applied to the same tumor models as well as the shape of the ablated region and its impact on healthy tissue.
To sum up, this work provides the first comparative study where multiple, published, microwave applicators are simulated under unified conditions. The novelty of this study lies in its approach: simulations are conducted under standardized conditions, including a two-compartment model that better approximates real experimental results.
2. Materials and Methods
2.1. Applicators Structure: Geometrical Characteristics
The applicators to be examined herein (the authors made any possible effort to comply with the PRISMA process [50]) are illustrated in Figure 1 and are proposed in [21,41,43,44,45,46,47,48]. The complete flow diagram detailing the PRISMA screening and selection process is provided in the Supplementary Materials (see Supplementary Figure S1).
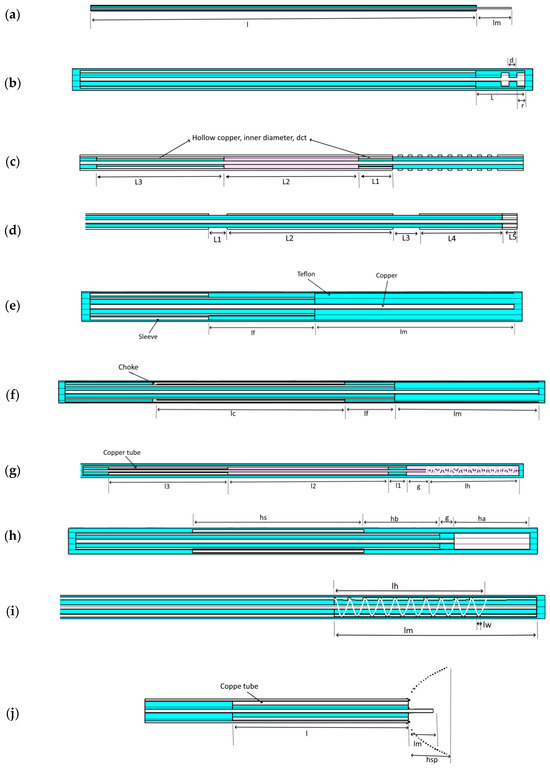
Figure 1.
Topology of all designs considered in this work. The above figures represent: Monopole [43] (a), Capacitive capped monopole antenna [44] (b), Multi-slot antenna [21] (c), Dual-slot antenna [45] (d), Triaxial antenna [47] (e), Choke antenna [47] (f), Balun-free base-fed monopole antenna [47] (g), Floating sleeve dipole (FSD) antenna [46] (h), Balun-free helical dipole antenna [48] (i), and Helical open waveguide structure [41] (j). The light blue, purple, and white colors indicate Teflon, air, and copper, respectively.
The triaxial, choke dipole, balun-free base-fed monopole, balun-free helical dipole, and multi-slot antennas are all constructed out of UT-085C. The FSD antenna (Figure 1g) was fabricated using 50 Ω UT-085C-LL semi-rigid coaxial cable from Micro-Coax (Pottstown, PA, USA). The monopole antenna (Figure 1) was constructed out of RG-405. The dimensions of the coaxial cable of the capacitive capped monopole, dual-slot antennas, and helical open waveguide were specifically defined by authors for their optimal applicators’ performance. Furthermore, all the applicators with their geometrical parameters are presented at Figure 1 and enlisted with detail in accompanying Tables, (Table 1 and Table 2).

Table 1.
Coaxial cable dimensions of the designs under study.
2.2. Comparison Criteria Definition
In microwave ablation (MWA), an optimal antenna is characterized by minimal invasiveness to the patient, high energy transmission efficiency, and the ability to achieve a target ablation zone with precision in both size and shape [6]. Additional important criteria include the antenna’s peak temperature, deposited power, temperature distribution, insertion depth, and the control of heat dispersion within healthy tissue.
The evaluation and comparison of antenna and waveguide designs are based on these essential criteria. In the following sections, the applicators’ dimensions are detailed, and simulations verifying existing studied designs are presented. Additionally, the Specific Absorption Rate (SAR) and temperature distribution at a standardized insertion depth and deposited power are analyzed. Finally, the dimensions of the ablation zone and the aspect ratio are presented to enable a thorough comparison and analysis.
2.3. Simulation Framework and Methods for Applicator Analysis
Microwave ablation (MWA) involves the absorption of electromagnetic energy by biological tissues, leading to localized heating. The electromagnetic field distribution is governed by Maxwell’s equations:
where and are the electric and magnetic fields, ε is the electrical permittivity, μ is the magnetic permeability, ω is the angular frequency and is the current density.
These equations are coupled with tissue dielectric properties to calculate the power deposition in tissues, quantified as Specific Absorption Rate (SAR) [51]:
where σ is the tissue conductivity is the electric field strength and ρ is the tissue density. The resultant heat diffusion in the tissue is governed by the Penne’s bioheat equation:
where ρ and c are the tissue density and specific heat, T is the temperature, k is the thermal conductivity, Q represents the heat generated by electromagnetic absorption (SAR), the perfusion term accounts for cooling by blood flow , and reflects tissue metabolism.
In the electromagnetic simulations, boundary conditions of Perfectly Matched Layers (PMLs) are applied at the computational domain boundaries to absorb outgoing waves and prevent artificial reflections. For thermal boundary conditions, a constant temperature is assumed at the tissue surface, set to body temperature (37 °C). This assumption simplifies the modeling while aligning with the study’s focus on standardized comparisons across applicator designs.
These equations and conditions provide the foundation for accurate modeling of electromagnetic and thermal fields, enabling the standardized comparison of applicator designs in this study. By incorporating realistic material properties and boundary conditions, this approach ensures that simulation results are closely aligned with experimental and clinical scenarios. Herein, a commercial electromagnetic simulator (CST) is utilized which incorporates the above equations and reliably solves both the electromagnetic and thermal problems.
2.4. Verification of Already Existed Designs
We present the verification of existing designs as modeled herein by comparing them with those reported in the literature. The purpose of this section is to ensure that the applicators are correctly constructed as intended by the proposing researchers. The temperature profiles, power settings, and material properties (both dielectric and thermal) used in the simulations are aligned with or closely matched to those in the referenced studies. In cases where certain values were not explicitly provided—for instance, power is not specified in reference [45], and precise dielectric properties are absent in references [21,43,46,47,48]—we have approximated these parameters as closely as possible. This verification is illustrated in Figure 2.

Figure 2.
SAR of dual-slot and temperature distribution (ablation zone) of all the other designs and comparison with the figures (experiments or simulations) in their corresponding references. (a) Monopole → Figure 6 in [43]; (b) Capacitive capped monopole → Figure 4 in [44]; (c) Multi-slot → Figures 2 and 7 in [21]; (d) Balun-free helical dipole → Figures 5 and 7 in [48]; (e) Dual-slot → Figure 12 in [45]; (f) Triaxial → Figures 4 and 5 in [47]; (g) Choke → Figures 4 and 5 in [47]; (h) Balun-free base-fed monopole → Figures 4 and 5 in [47]; (i) FSD → Figures 4 and 9 in [46]; (j) Helical open waveguide → Figure 7 in [41].
Although all the applicators reviewed in this work were previously simulated, designed, and tested in their respective publications [21,41,43,44,45,46,47,48], it was deemed necessary to repeat the simulations using the same phantom model utilized in the corresponding trials to ensure a reliable and fair comparison. Initially, a simulation replicating the original model and conditions was conducted to verify the reported performance. Subsequently, each applicator was inserted into a tumor and simulated to evaluate its SAR and temperature distribution. These results are compared according to the criteria defined above.
The applicators in Figure 2a,c,d,f,g,i retain the comet-tail shape of ablation area, which causes difficulties in ensuring the safe exposure of healthy tissues on the back side of the applicators. On the contrary, the treated area is closer to a spherical shape in Figure 2b,h. However, it is only in Figure 2j that the ablation area is restricted inside the tapered spiral providing the means to control the exposure of the healthy tissue.
3. Results
This section presents a comparative analysis of the simulation results for the applicators, focusing on Specific Absorption Rate (SAR) and temperature distribution. First, the simulation results are provided for all designs using identical parameters as reported by the original authors. Subsequently, simulations are presented for both a homogeneous model and a two-compartment model, each with consistent power deposition, identical healthy tissue and tumor properties, and the same placement insertion depth.
3.1. Performance of the Homogeneous Model for All Designs
In this part of the paper, simulation results for Specific Absorption Rate (SAR) and temperature distribution are presented for all designs within a homogeneous model corresponding to a mean biological tissue with εr = 46.8 and σ = 0.861 at 915 MHz [52]. The simulations were conducted with consistent power deposition and the same insertion depth across all designs. Explicit comparisons follow in the two next subsections.
3.1.1. Specific Absorption Rate (SAR) of the Homogeneous Model for All Designs
In this analysis, we examine the SAR distribution of all applicators using the same homogeneous model (Figure 3). According to IEEE norm [51], SAR should be measured or defined as a mean value averaged over either 1 g or 10 g of mass, namely, corresponding to 1 cm3 or 10 cm3 of tissue. However, the numerical simulator estimates the “point SAR” in order to be accurately transferred to the Pennes bioheat diffusion equation solver. This approach may involve overestimation of point defined power absorption around metallic edges and particularly near metallic tips and corners. In turn, this may yield unexpected, overestimated local temperatures. In Figure 3, we present SAR contours at levels of 2.5, 5, 7.5, and 10 W/kg.
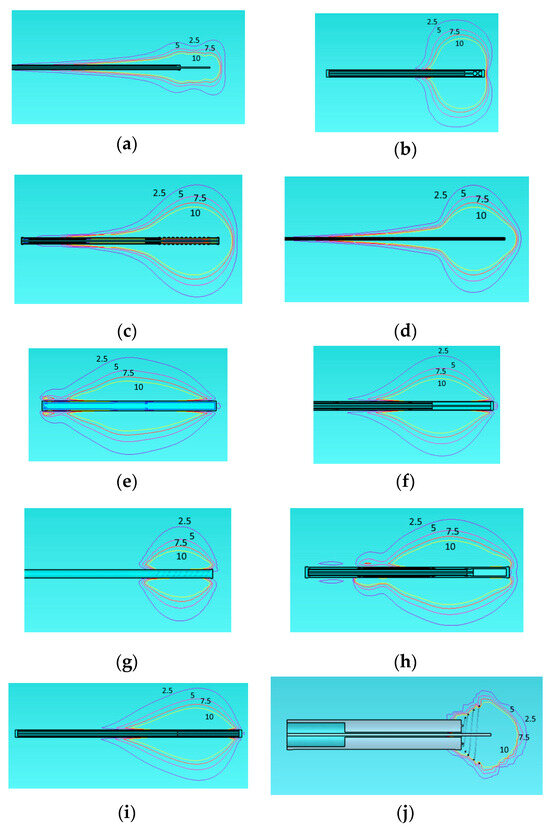
Figure 3.
Specific Absorption Rate (SAR) of the different applicators embedded in a homogeneous tissue with εr = 46.8, σ = 0.861 at 915 MHz. Monopole antenna (a), capacitive capped monopole antenna (b), multi-slot coaxial antenna (c), dual-slot antenna (d), triaxial antenna (e), choke dipole antenna (f), balun-free base-fed monopole (g), floating sleeve dipole antenna (FSD) (h), balun-free helical dipole antenna (i), helical open waveguide structure (j) at one model (healthy tissue). The blue, purple, red, and yellow colors indicate SAR contours of 2.5, 5, 7.5, and 10 W/kg, respectively.
The 2.5 W/kg contour represents a low exposure level, generally regarded as safe according to norm [51]. The 5 W/kg contour indicates moderate exposure, which may still fall within safe limits for healthy tissue. The 7.5 W/kg contour approaches levels where caution may be necessary, depending on the duration of exposure. Finally, the 10 W/kg contour reflects a high exposure level that could increase the risk of thermal damage, particularly with prolonged exposure. Regarding the shape of the treated area, the same observation noted for Figure 2 also applies to Figure 3 exhibiting comet-tail, nearly spherical, or nearly rectangular shapes.
3.1.2. Temperature Distribution of the Homogeneous Model for All Designs
We examine the temperature distribution in Figure 4 of all the above applicators using the same homogeneous model.
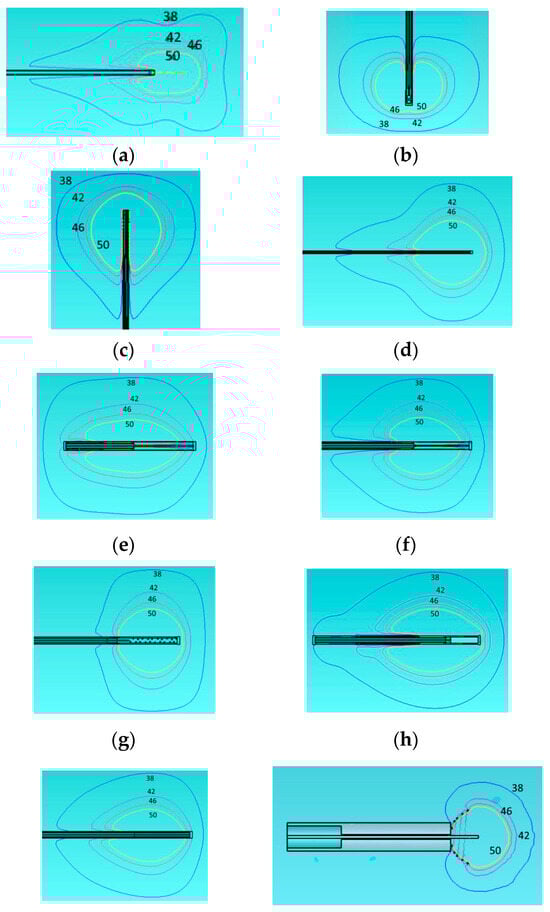
Figure 4.
Temperature distribution of the different applicators embedded in a homogeneous tissue with εr = 46.8, σ = 0.861 at 915 MHz. Monopole antenna (a), capacitive capped monopole antenna (b), multi-slot coaxial antenna (c), dual-slot antenna (d), triaxial antenna (e), choke dipole antenna (f), balun-free base-fed monopole (g), floating sleeve dipole antenna (FSD) (h), balun-free helical dipole antenna (i), and helical open waveguide structure (j). The blue, purple, red, and yellow colors indicate temperature contours of 38 °C, 42 °C, 46 °C, and 50 °C, respectively.
We present the temperature contours of 38, 42, 46, and 50 degrees Celsius. We examine especially these contours on the grounds that irreversible changes start at 38 °C and beyond, the possibility of cell necrosis starts at 42 °C, the cancer cells are destroyed into few hours at 46 °C and into few minutes at 50 °C. The shapes of the temperature equi-level lines follow that of the SAR. The desired spherical or rectangular shapes, assumed more adaptable to tumor ones, are supported again by capacitive capped (b), multi-slot coaxial (c), balun-free (g), and open helical (j) cases. However, only the last one is promising to control-restrict the area above 42 °C inside the tumor. As we can see from Figure 4, the results of our simulations for the homogeneous model are close to what depicted in the corresponding papers [21,41,43,44,45,46,47,48]. However, as shown next in Section 3.3.2, the behavior of temperature distribution changes when we are using a more realistic two-compartment model for the tumor.
3.2. Temperature Distribution of Helical Open Waveguide Structure vs. Monopole for the Two-Compartment Model
The helical open waveguide structure [41] is discussed here, with simulation results presented to demonstrate its flexibility in producing various ablation zone shapes.
Figure 5 presents two designs in which the spirals are arranged in a suboptimal configuration, reducing their effectiveness in containing the electromagnetic field within the tumor. This arrangement results in unintended exposure of surrounding healthy tissue to potentially harmful levels of electromagnetic energy. Figure 5a depicts a helical open waveguide structure consisting of three spirals, while Figure 5b shows a structure with two spirals. Both configurations share a height of 12 mm and a monopole length of 7.61 mm.
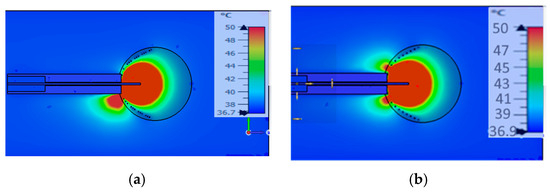
Figure 5.
Temperature distribution of suboptimum designs of the helical open waveguide structure: (a) with 3 spirals, (b) with 2 spirals.
The adjustment of the number of spirals, in combination with their opening (e.g., different openings for tumors with diameters of 3 cm and 2 cm) and the dimensions of the coaxial cable, play a crucial role in mitigating the issue of backward heating. This issue can be effectively addressed by increasing the number of spirals, as demonstrated in Figure 6. Figure 6 illustrates the ablation zones produced under different configurations.
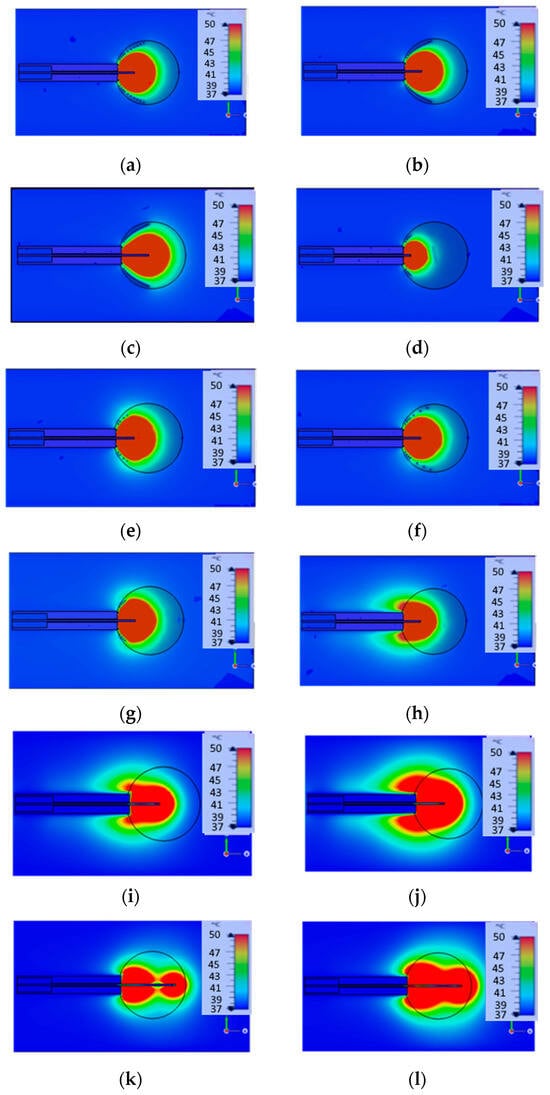
Figure 6.
Parametric analysis of helical open waveguide structure (a–g) and design of monopole (h–l): 2 spirals with height = 3 mm and 2 spirals with height = 12 mm (a), 4 spirals with height = 12 mm (b), 4 spirals with height = 12 mm (c), 4 spirals with height = 3 mm (d), 2 spirals with height = 1 mm and 2 spirals with height = 4.5 mm (e), 3 spirals with height = 3 mm and 1 spiral with height = 12 mm (f), 4 spirals with height = 3 mm (g). The length of monopole is 7.61 mm at (a,b,e–h), 12 mm at (c,i,j), 3 mm at (d), and 24 mm at (k,l).
These results demonstrate that by adjusting the power of the generator and altering the monopole length and spiral height, it is possible to produce various ablation zone shapes. In the first two images (a, b), the ablation zone assumes a spherical shape. In images (c, d), simulations present an ellipsoid-shaped ablation zone. In images (e–g), the simulations depict a bell-shaped ablation zone. These simulations were conducted on a large intestine model with a tumor diameter of 3 cm and power source 25 W, with the properties of both the large intestine and tumor taken from [41], as large intestine εr = 57, σ = 1.09, and tumor εrt = 60, σt = 0.67. The tissue and tumor model in this section is placed in the large intestine, consistent with [41], which initially analyzed the helical open waveguide structure under these conditions. This study extends the findings of [41] by performing a parametric analysis of the same antenna, varying the monopole length and spiral height to optimize its performance in the large intestine model. In contrast, for simulations in other sections, we employed a liver model to provide a unified evaluation framework for comparing different designs. This approach ensures both consistency with prior studies and meaningful cross-design comparisons.
In the final images (h–l), the monopole design is depicted for different lengths (7.61 cm: h, 12 cm: i, j and 24 cm: k, l) and different source powers (25 W: images h, i, k, and 50 W: j, l). For (h, i, j) cases, the backward heating problem persists, resulting in a comet-shaped ablation zone that leads to the burning of healthy tissue. In contrast, in all other simulations, the backward heating issue is eliminated by properly adjusting the number and the density of the helices, confining the heat to the tumor and leaving the surrounding healthy tissue unaffected.
The results of Figure 6 indicate that the spirals function as a shield, effectively trapping the electromagnetic field within the spiral structure, and consequently within the tumor. To achieve this desired outcome, extensive simulations and careful refinements are required.
In summary, the number of spiral turns and their configuration play a critical role in achieving the desired outcome: eliminating backward heating and ensuring that only the tumor is ablated. Additionally, the open and tapered helical structure provides flexibility in shaping ablation zones, enhancing the safety and precision of microwave ablation as a treatment modality.
3.3. Performance of the Two-Compartment Model for All Designs
In this segment of the study, simulation results for Specific Absorption Rate (SAR) and temperature distribution are presented for all designs within a two-compartment model corresponding to a mean biological tissue εr = 46.8 and σ = 0.861 and tumor with εr = 57.09 and σ = 1.05 at 915 MHz [52,53]. The simulations were conducted with consistent power deposition and the same insertion depth across all designs. Explicit comparisons follow in the two next subsections.
3.3.1. Specific Absorption Rate (SAR) of the Two-Compartment Model for All Designs
Figure 7 presents the SAR distribution of a two-compartment model across all designs.
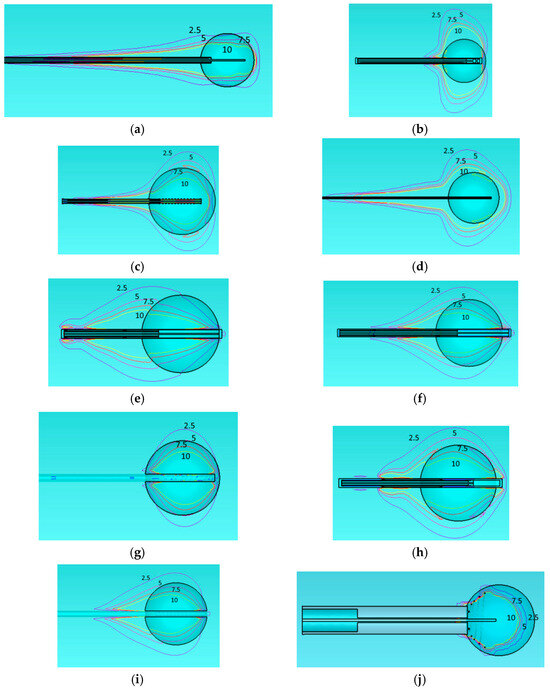
Figure 7.
Specific Absorption Rate (SAR) with a deposited power of 40 W of monopole antenna (a), capacitive capped monopole antenna (b), multi-slot coaxial antenna (c), dual-slot antenna (d), triaxial antenna (e), choke dipole antenna (f), balun-free base-fed monopole (g), floating sleeve dipole antenna (FSD) (h), balun-free helical dipole antenna (i), and helical open waveguide structure (j) in the two-compartment model (healthy tissue and tumor). The blue, purple, red, and yellow colors indicate SAR contours of 2.5, 5, 7.5, and 10 W/kg, respectively.
All simulations were conducted using the same tumor type with consistent properties. It is obvious that only two applicators restrict the electromagnetic energy within the tumor. These are the balun-free base-fed monopole (Figure 7g) and the helical open waveguide (Figure 7j). Explicitly, one may see that the 7.5 W/kg contour lies entirely inside the tumor only for these two cases.
3.3.2. Temperature Distribution of the Two-Compartment Model for All Designs
This part of the results addresses the temperature distribution across all designs within a two-compartment model. The corresponding results are displayed in Figure 8. It is again clear that only the two applicators Figure 8g,j show the temperature contours above 42 °C restricted inside or slightly outside the tumor boundary. Since it is desired to cauterize a ring of about 1 cm beyond the tumor boundary, Figure 8g is obtained for the appropriate deposited power of 40 W. However, the applicator of Figure 8j allows for an additional small increase of the source power.
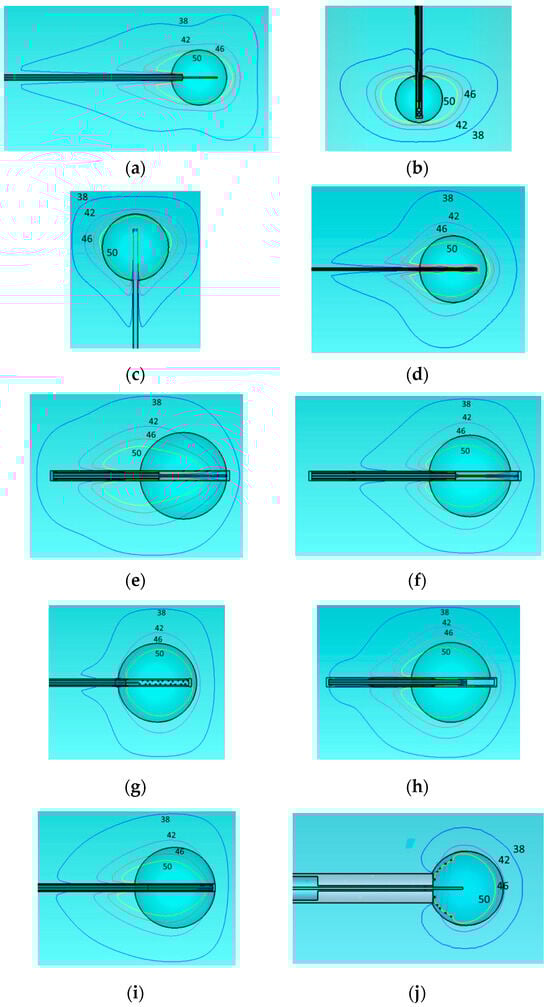
Figure 8.
Temperature distribution with a deposited power of 40 W of monopole antenna (a), capacitive capped monopole antenna (b), multi-slot coaxial antenna (c), dual-slot antenna (d), triaxial antenna (e), choke dipole antenna (f), balun-free base-fed monopole (g), floating sleeve dipole antenna (FSD) (h), balun-free helical dipole antenna (i), and helical open waveguide structure (j) in the two-compartment model (healthy tissue and tumor). The blue, purple, red, and yellow colors indicate temperature contours of 38 °C, 42 °C, 46 °C, and 50 °C, respectively.
We analyze the temperature distribution of all the, aforementioned, applicators using both a simple model and a two-compartment model. The temperature contours at 38 °C, 42 °C, 46 °C, and 50 °C are presented. As mentioned before, these specific contours are of particular interest because irreversible changes in tissue begin at 38 °C, cell necrosis becomes possible at 42 °C, and cancer cells are destroyed within a few hours at 46 °C and within a few minutes at 50 °C.
The tumor diameter was set to 3 cm for the multi-slot, triaxial, choke, FSD, balun-free base-fed monopole, and balun-free helical dipole antennas, and 2 cm for the monopole, capacitive monopole, dual-slot antennas, and helical open waveguide. This variation is based on the ablation zone dimensions reported in the literature and the attempt to confine the treatment temperature (50 °C) within the tumor. Both tumor models were assumed to be perfectly spherical. As observed, there are notable differences between the homogeneous model and the two-compartment model.
3.4. Quantitative Comparison of Ablation Performance Across Applicators Under Standardized Conditions
The final focus of the results is to provide a quantitative comparison of all designs. To ensure consistency, each applicator design is initially positioned within healthy tissue (homogeneous model—HM) and subsequently within healthy tissue with tumor (two-compartment model—TCM) at the same insertion depth, with all configurations set to receive an identical power level (same deposited power equal to 40 W). Comparison criteria include maximum temperature, ablation zone dimensions (diameter and length), aspect ratio, and dimensions penetration of the 38 °C zone into healthy tissue. The outcomes of this comparison are summarized in Table 3. It is observed that the maximum temperature is too high for the applicators; Figure 1g,j presented the best energy concentration inside the tumor.
Table 3.
Comparison of all designs as aware of maximum temperature, ablation zone, and aspect ratio (in all cases, the absorbed power deposited in the tissues was the same and equal to 40 W).
However, this can be reduced by lowering the microwave source power without any compromise in the ablation zone shape. Besides that, this maximum temperature value may be fictitiously caused by the high values of the considered point SAR. In turn, excessive SAR values are related to field singularities at metallic edges. In any case, this issue needs further examination through careful research. Table 4 illustrates the performance metrics of applicators after power reduction to achieve safe maximum temperature. We consider values close to 100 °C as the maximum temperature, where the water starts to boil and evaporate.
Table 4.
Comparison of applicators with adjusted power to maintain safe maximum temperature limits (HM = homogeneous model, TCM = two compartment model).
Although water evaporation may seem to involve major complications, there is no clear relevance in the standards, e.g., Ref. [51], denoting a maximum allowable temperature. Notably, the deposited power was reduced as shown in Table 4 to 10–30 W to maintain a maximum temperature close to 100 °C. The highest reduction was observed in the most focusing applicator of helical open waveguide. The question is whether, in most cases where the deposited energy is restricted within the tumor, the entire tumor is uniformly covered/ablated. To examine this option, the corresponding temperature distribution is depicted in Figure 9.
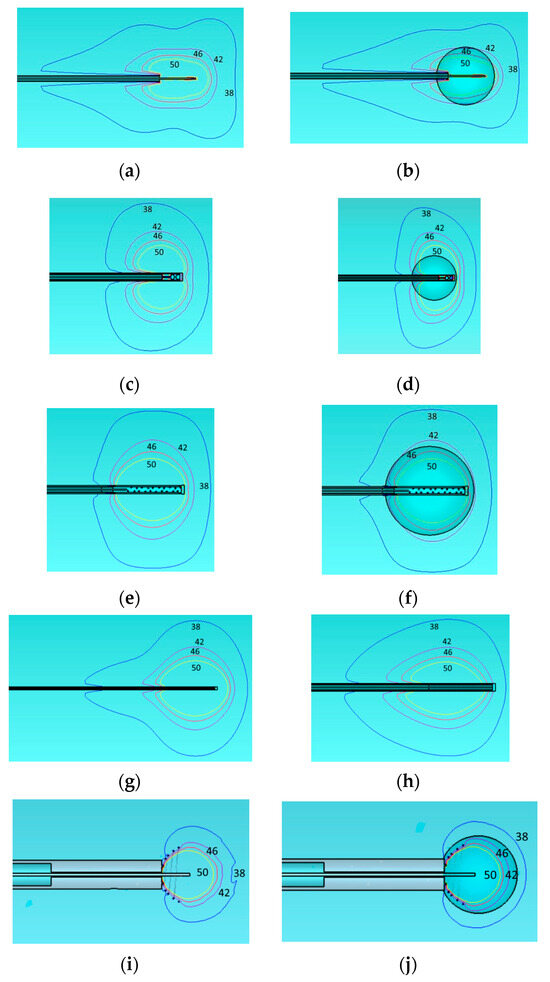
Figure 9.
Temperature distribution for applicators of Table 4 and deposited power levels: (a) monopole antenna with 25 W deposited power, (b) monopole antenna with tumor and 20 W deposited power, (c) capacitive-capped monopole antenna with 20 W deposited power, (d) capacitive-capped monopole antenna with tumor and 30 W deposited power, (e) balun-free base-fed monopole antenna with 30 W deposited power, (f) balun-free base-fed monopole antenna with tumor and 30 W deposited power, (g) dual-slot antenna with 25 W deposited power, (h) balun-free helical dipole antenna with 30 W deposited power, (i) helical open waveguide structure with 10 W deposited power, and (j) helical open waveguide structure with tumor 15 W deposited power. Temperature contours are indicated by colors: blue (38 °C), purple (42 °C), red (46 °C), and yellow (50 °C).
Figure 9 illustrates, through schematic representations, the results presented in Table 5. It is observed that the 50 °C isothermal line encloses the 3 cm or 2 cm tumor diameter in all cases. However, only the open waveguide (Figure 9j) restricts the 38 °C isothermal to only 1 cm beyond the tumor boundary as desired to avoid healthy tissue damage.
Table 5.
Comparison of all designs with respect to the 38 °C penetration zone. The two rightmost columns denote the depth g (mm) that the 38 °C isothermal extends beyond the tumor boundary.
Finally, Table 5 presents the 38 °C penetration zone for all applicators and the deviation of this zone from the tumor, providing a quantitative assessment of the uncontrolled temperature distribution. Specifically, the extension of the 38 °C isothermal beyond the tumor’s diameter (2 cm or 3 cm) is calculated by subtracting the tumor’s dimensions from the isothermal’s length (horizontal axis) and diameter (vertical axis).
4. Discussion
Our objective was to replicate all designs proposed in the literature, with implementations closely following those reported in previous studies, using the data provided in the respective publications. Figure 2, Figure 3 and Figure 4 (results for the homogeneous model) show favorable comparisons with simulation and experimental results reported in the literature for the homogeneous model. However, when a tumor model volume of 2 cm or 3 cm, with distinct dielectric properties from healthy tissue (two-compartment model), is introduced (Figure 7 and Figure 8), the shape and form of the temperature distribution are significantly altered and deformed. Similar observations are evident from the SAR distribution, shown in Figure 3 and Figure 7.
As demonstrated in Figure 2, Figure 3, Figure 4, Figure 5, Figure 6, Figure 7 and Figure 8 and Table 3, some applicators produce nearly spherical ablation zones, indicating a uniform distribution of electromagnetic energy into the region of interest. However, there is a notable lack of control over temperature distribution (examine the temperature contours at 38 °C and 42 °C), which becomes particularly critical when the tumor is located near sensitive biological structures, such as blood vessels. This issue is partially mitigated by the balun-free, base-fed monopole antenna and fully addressed only by the helical open waveguide structure. As shown in Table 4, the 38 °C penetration zone exceeds the tumor dimensions by less than 1 cm in both diameter and length only for the helical open waveguide structure. This, combined with the safety margin of approximately 1 cm, makes this applicator the most secure and ideal choice for tumors located near vulnerable biological tissues. The main drawback of this helical open waveguide is its challenging construction and placement. Our group is brainstorming on this issue, where a convenient and practical solution is found that will be presented in a follow-up paper. In any case, other researchers are welcome to propose appropriate mechanical solutions.
Additionally, precise power calibration is essential to achieve spherical ablation zones; deviations in power can lead to elliptical ablation zones. Accurate applicator positioning is also critical, as the design directly affects its efficacy in ablating the tumor. The applicator must be inserted into the tumor before the microwave ablation (MWA) process begins, which may risk the dissemination of tumor cells. Positioned at the tumor periphery, the applicator initiates ablation immediately upon insertion, a critical step to prevent metastasis that can occur if cancer cells enter the bloodstream during treatment. The helical open waveguide structure, for instance, could address this concern by initiating MWA immediately upon insertion, thereby reducing the risk of tumor cell dissemination and enhancing treatment outcomes.
In the helical open waveguide design, spirals serve as a protective shield, enabling precise control of the electromagnetic field and allowing flexibility in adjusting the shielding based on the clinical context. For example, if the tumor is adjacent to sensitive biological tissues and no safety margin exists, a stronger shield can be applied. Conversely, if a safety margin is present, the shielding can be adjusted to a lower intensity.
As MWA is an image-guided treatment modality, the helical open waveguide design further enhances precision by encapsulating the target tumor with minimal operator error when guided by imaging techniques, thus increasing the safety of the procedure. However, given that MWA is a minimally invasive treatment, the size of the helical open waveguide is a primary limitation compared to existing applicators and other designs analyzed here. Additionally, it appears to create a smaller ablation zone than other designs. However, the ablation zone coincides with the tumor volume; thus, different sizes can be utilized in each case so as to exactly fit each tumor.
It is important to note that several designs in this analysis—including the capacitive capped monopole antenna, dual-slot antenna (as referenced in [45]), and helical open waveguide—have not yet been physically constructed. While this may limit direct experimental validation, the computational model provides an initial assessment of each design’s theoretical performance relative to existing designs.
Moreover, it is important to address the management and control of maximum temperature during therapy. The simulator utilizes the point-wise Specific Absorption Rate (SAR) as the thermal source point, which may occasionally lead to an overestimation of maximum temperature levels. Despite this, it is essential to continuously monitor temperature throughout the therapy to ensure it remains within a safe range. Temperature control can be achieved using sensors that provide real-time temperature measurements. Additionally, regulating the microwave source power or employing cooling mechanisms can help maintain safe temperature levels. Notably, the designs in Figure 1e,f mentioned above are already in clinical use and have received FDA approval, ensuring consistent temperature control for patient safety. However, for designs that have not yet been constructed or approved by the FDA, it is crucial to prioritize patient safety by implementing these temperature control measurements rigorously.
Recall that this study is a computational comparative analysis. The simulations do not account for changes in tissue properties that occur during ablation, such as temperature-dependent dielectric properties, nor do they incorporate thermodynamic mechanisms like the latent heat of water vaporization. These factors inevitably introduce some discrepancies between simulation results and ex vivo ablation experiments. A challenging next step is to encourage researchers to carry out the corresponding simulation studies. Nonetheless, the presented simplified simulations offer valuable insights into the relative performance of these designs in ablation scenarios.
5. Conclusions
This study presents the first comparative analysis of microwave ablation (MWA) applicators under standardized conditions, utilizing both homogeneous and two-compartment models. It also evaluates the safety aspects of MWA by investigating not only the temperature thresholds for effective treatment (50 °C and 60 °C) but also the isothermal contours at 42 °C and 38 °C. These contours are critical to ensuring the safety of MWA, a key factor in advancing this therapeutic modality. To achieve this, a two-compartment model, incorporating both tumor and healthy tissue, is employed. This model provides a robust framework for validating the performance of MWA applicators under these critical conditions.
This comparative analysis was conducted between previously developed microwave ablation applicators. Initially, various applicators were modeled, including the monopole, capacitive-fed monopole antenna, floating sleeve dipole antenna, dual-slot antenna, multi-slot antenna, triaxial antenna, choke antenna, balun-free base-fed monopole antenna, balun-free helical dipole antenna, and the helical open waveguide structure.
Following the simulation phase, our results show strong alignment with those reported in the literature. We subsequently tested the applicators using (i) a homogenous tissue and (ii) a two-compartment model, incorporating a tumor with a diameter of 3 cm or 2 cm. This model differentiated between healthy tissue and the tumor by assigning distinct electrical properties, offering a reliable approximation of anatomical geometry.
The results revealed notable differences in the behavior of the electromagnetic field between the homogeneous model and the two-compartment model. Notably, all applicators except for helical open waveguide failed to confine the temperature field within the tumor, resulting in unintended damage to surrounding healthy tissue. In contrast, helical open waveguide demonstrated the capability to limit the ablation zone effect to the tumor region, thereby enhancing the safety and precision of the microwave ablation process. However, its current size is unsuitable for an immediate exploitation as a minimally invasive microwave ablation (MWA) applicator, even though a plethora of folding techniques exist that may devise a mechanism to compress the spirals inside the catheter. These can be unfolded to form the proper shape after the insertion of the catheter inside the tumor.
Supplementary Materials
The following supporting information can be downloaded at: https://www.mdpi.com/article/10.3390/app15042142/s1, The flow diagram illustrating the PRISMA screening and selection process is available as Supplementary Figure S1 online.
Funding
This research received no external funding.
Conflicts of Interest
The authors declare no conflicts of interest.
References
- Afaghi, P.; Lapolla, M.A.; Ghandi, K. Percutaneous microwave ablation applications for liver tumors: Recommendations for COVID-19 patients. Heliyon 2021, 7, e06454. [Google Scholar] [CrossRef]
- Brace, C.L. Microwave Tissue Ablation: Biophysics, Technology, and Applications. Crit. Rev. Biomed. Eng. 2010, 38, 65–78. [Google Scholar] [CrossRef] [PubMed]
- Simon, C.J.; Dupuy, D.E.; Mayo-Smith, W.W. Microwave Ablation: Principles and Applications. RadioGraphics 2005, 25 (Suppl. S1), S69–S83. [Google Scholar] [CrossRef] [PubMed]
- Lubner, M.G.; Brace, C.L.; Hinshaw, J.L.; Lee, F.T. Microwave Tumor Ablation: Mechanism of Action, Clinical Results, and Devices. J. Vasc. Interv. Radiol. 2010, 21, S192–S203. [Google Scholar] [CrossRef] [PubMed]
- Brace, C.L. Radiofrequency and Microwave Ablation of the Liver, Lung, Kidney, and Bone: What Are the Differences? Curr. Probl. Diagn. Radiol. 2009, 38, 135–143. [Google Scholar] [CrossRef] [PubMed]
- Huang, H.; Zhang, L.; Moser, M.A.J.; Zhang, W.; Zhang, B. A review of antenna designs for percutaneous microwave ablation. Phys. Medica 2021, 84, 254–264. [Google Scholar] [CrossRef] [PubMed]
- Fallahi, H.; Prakash, P. Antenna Designs for Microwave Tissue Ablation. Crit. Rev. Biomed. Eng. 2018, 46, 495–521. [Google Scholar] [CrossRef]
- Bertram, J.M.; Yang, D.; Converse, M.C.; Webster, J.G.; Mahvi, D.M. A Review of Coaxial-Based Interstitial Antennas for Hepatic Microwave Ablation. Crit. Rev. Biomed. Eng. 2006, 34, 187–213. [Google Scholar] [CrossRef] [PubMed]
- Hurter, W.; Reinbold, F.; Lorenz, W.J. A dipole antenna for interstitial microwave hyperthermia. IEEE Trans. Microw. Theory Tech. 1991, 39, 1048–1054. [Google Scholar] [CrossRef]
- Mohtashami, Y.; Hagness, S.C.; Behdad, N. A Hybrid Slot/Monopole Antenna With Directional Heating Patterns for Microwave Ablation. IEEE Trans. Antennas Propag. 2017, 65, 3889–3896. [Google Scholar] [CrossRef]
- Karampatzakis, A.; Kühn, S.; Tsanidis, G.; Neufeld, E.; Samaras, T.; Kuster, N. Antenna design and tissue parameters considerations for an improved modelling of microwave ablation in the liver. Phys. Med. Biol. 2013, 58, 3191–3206. [Google Scholar] [CrossRef] [PubMed]
- Bertram, J.M.; Yang, D.; Converse, M.C.; Webster, J.G.; Mahvi, D.M. Antenna design for microwave hepatic ablation using an axisymmetric electromagnetic model. BioMed Eng. OnLine 2006, 5, 15. [Google Scholar] [CrossRef] [PubMed]
- Nevels, R.D.; Arndt, G.D.; Raffoul, G.W.; Carl, J.R.; Pacifico, A. Microwave catheter design. IEEE Trans. Biomed. Eng. 1998, 45, 885–890. [Google Scholar] [CrossRef] [PubMed]
- Cavagnaro, M.; Amabile, C.; Bernardi, P.; Pisa, S.; Tosoratti, N. A Minimally Invasive Antenna for Microwave Ablation Therapies: Design, Performances, and Experimental Assessment. IEEE Trans. Biomed. Eng. 2011, 58, 949–959. [Google Scholar] [CrossRef] [PubMed]
- Brace, C.L.; Laeseke, P.F.; Van Der Weide, D.W.; Lee, F.T. Microwave ablation with a triaxial antenna: Results in ex vivo bovine liver. IEEE Trans. Microw. Theory Tech. 2005, 53, 215–220. [Google Scholar] [CrossRef] [PubMed]
- Wakaki, T.; Michiyama, T.; Kuwano, S. A new interstitial choke embedded antenna for microwave ablation. IEICE Commun. Express 2017, 6, 435–438. [Google Scholar] [CrossRef]
- Longo, I.; Gentili, G.B.; Cerretelli, M.; Tosoratti, N. A coaxial antenna with miniaturized choke for minimally invasive interstitial heating. IEEE Trans. Biomed. Eng. 2003, 50, 82–88. [Google Scholar] [CrossRef] [PubMed]
- Pisa, S.; Cavagnaro, M.; Bernardi, P.; Lin, J.C. A 915-MHz antenna for microwave thermal ablation treatment: Physical design, computer modeling and experimental measurement. IEEE Trans. Biomed. Eng. 2001, 48, 599–601. [Google Scholar] [CrossRef]
- Luyen, H.; Hagness, S.C.; Behdad, N. Reduced-Diameter Designs of Coax-Fed Microwave Ablation Antennas Equipped With Baluns. IEEE Antennas Wirel. Propag. Lett. 2017, 16, 1385–1388. [Google Scholar] [CrossRef]
- Luyen, H.; Hagness, S.C.; Behdad, N. A Minimally Invasive Coax-Fed Microwave Ablation Antenna With a Tapered Balun. IEEE Trans. Antennas Propag. 2017, 65, 7280–7287. [Google Scholar] [CrossRef]
- Ge, M.; Jiang, H.; Huang, X.; Zhou, Y.; Zhi, D.; Zhao, G.; Chen, Y.; Wang, L.; Qiu, B. A multi-slot coaxial microwave antenna for liver tumor ablation. Phys. Med. Biol. 2018, 63, 175011. [Google Scholar] [CrossRef] [PubMed]
- Aziz, S.B.; Kaysir, M.R.; Jahirul Islam, M.; Islam, T.; Rahman, M. Effect of the antenna slot numbers and position on the performance of microwave ablation. Med. Nov. Technol. Devices 2023, 20, 100271. [Google Scholar] [CrossRef]
- Wang, T.; Zhao, G.; Qiu, B. Theoretical evaluation of the treatment effectiveness of a novel coaxial multi-slot antenna for conformal microwave ablation of tumors. Int. J. Heat Mass Transf. 2015, 90, 81–91. [Google Scholar] [CrossRef]
- Wu, C.; Huang, H.; Liu, Y.; Chen, L.; Yu, S.; Moser, M.A.J.; Zhang, W.; Fang, Z.; Zhang, B. Optimal design of aperiodic tri-slot antennas for the conformal ablation of liver tumors using an experimentally validated MWA computer model. Comput. Methods Programs Biomed. 2023, 242, 107799. [Google Scholar] [CrossRef] [PubMed]
- Ibitoye, Z.A.; Nwoye, E.O.; Aweda, M.A.; Oremosu, A.A.; Annunobi, C.C.; Akanmu, O.N. Optimization of dual slot antenna using floating metallic sleeve for microwave ablation. Med. Eng. Phys. 2015, 37, 384–391. [Google Scholar] [CrossRef]
- Xu, Y.; Moser, M.A.J.; Zhang, E.; Zhang, W.; Zhang, B. Large and round ablation zones with microwave ablation: A preliminary study of an optimal aperiodic tri-slot coaxial antenna with the π-matching network section. Int. J. Therm. Sci. 2019, 140, 539–548. [Google Scholar] [CrossRef]
- Blain, M.; Narayanan, G.; Ricoeur, A.; Kobe, A.; Mahendra, A.M.; Jacks, B.; Letty, Q.; Bonnet, B.; Tselikas, L.; Deschamps, F.; et al. Safety and Efficacy of Percutaneous Liver Microwave Ablation Using a Fully Water-Cooled Choke Ring Antenna: First Multicenter Clinical Report. CardioVascular Interv. Radiol. 2023, 46, 1086–1091. [Google Scholar] [CrossRef]
- Fallahi, H.; Clausing, D.; Shahzad, A.; O’Halloran, M.; Dennedy, M.C.; Prakash, P. Microwave antennas for thermal ablation of benign adrenal adenomas. Biomed. Phys. Eng. Express 2019, 5, 025044. [Google Scholar] [CrossRef]
- Wang, Y.; Sun, Y.; Feng, L.; Gao, Y.; Ni, X.; Liang, P. Internally cooled antenna for microwave ablation: Results in ex vivo and in vivo porcine livers. Eur. J. Radiol. 2008, 67, 357–361. [Google Scholar] [CrossRef]
- Kuang, M.; Lu, M.D.; Xie, X.Y.; Xu, H.X.; Mo, L.Q.; Liu, G.J.; Xu, Z.F.; Zheng, Y.L.; Liang, J.Y. Liver Cancer: Increased Microwave Delivery to Ablation Zone with Cooled-Shaft Antenna—Experimental and Clinical Studies. Radiology 2007, 242, 914–924. [Google Scholar] [CrossRef] [PubMed]
- Zhou, Q.; Jin, X.; Jiao, D.-C.; Zhang, F.-J.; Zhang, L.; Han, X.-W.; Duan, G.-F.; Han, J.-J.; Li, C.-X. Microwave ablation: Results in ex vivo and in vivo porcine livers with 2450-MHz cooled-shaft antenna. Chin. Med. J. 2011, 124, 3386–3393. [Google Scholar]
- Horn, J.C.; Patel, R.S.; Kim, E.; Nowakowski, F.S.; Lookstein, R.A.; Fischman, A.M. Percutaneous Microwave Ablation of Renal Tumors Using a Gas-Cooled 2.4-GHz Probe: Technique and Initial Results. J. Vasc. Interv. Radiol. 2014, 25, 448–453. [Google Scholar] [CrossRef]
- Ziemlewicz, T.J.; Hinshaw, J.L.; Lubner, M.G.; Brace, C.L.; Alexander, M.L.; Agarwal, P.; Lee, F.T. Percutaneous Microwave Ablation of Hepatocellular Carcinoma with a Gas-Cooled System: Initial Clinical Results with 107 Tumors. J. Vasc. Interv. Radiol. 2015, 26, 62–68. [Google Scholar] [CrossRef][Green Version]
- Leapman, M.; Jayadevan, R.; Phillips, C.; Hall, S.J.; Palese, M.A.; Fischman, A.M. V5-14 Percutaneous Gas-Cooled Microwave Ablation for Small Renal Masses: The Mount Sinai Experience. J. Urol. 2014, 191, e620. [Google Scholar] [CrossRef]
- Luyen, H.; Hagness, S.C.; Behdad, N. A Balun-Free Helical Antenna for Minimally Invasive Microwave Ablation. IEEE Trans. Antennas Propag. 2015, 63, 959–965. [Google Scholar] [CrossRef]
- Lee, M.; Son, T. Helical Slot Antenna for the Microwave Ablation. Int. J. Antennas Propag. 2019, 2019, 1–9. [Google Scholar] [CrossRef]
- Maini, S.; Shekhawat, D.S. Analysis of Copper Tube Sleeve Coaxial Spiral Antenna for Interstitial Hepatic Microwave Ablation. In Proceedings of the 2018 Eighth International Conference on Information Science and Technology (ICIST), Cordoba, Spain, 30 June–6 July 2018; pp. 31–34. [Google Scholar] [CrossRef]
- Mohtashami, Y.; Behdad, N.; Hagness, S.C. Ex Vivo Performance of a Flexible Microwave Ablation Antenna. IEEE Trans. Biomed. Eng. 2021, 68, 1680–1689. [Google Scholar] [CrossRef]
- Gu, Z.; Rappaport, C.M.; Wang, P.J.; VanderBrink, B.A. A 2 1/4-turn spiral antenna for catheter cardiac ablation. IEEE Trans. Biomed. Eng. 1999, 46, 1480–1482. [Google Scholar] [CrossRef] [PubMed]
- Satoh, T.; Stauffer, P.R. Implantable helical coil microwave antenna for interstitial hyperthermia. Int. J. Hyperth. 1988, 4, 497–512. [Google Scholar] [CrossRef]
- Karkanis, N.; Kyriakou, G.; Psomas, M.; Samaras, T.; Kaifas, T.N.F. Helical Open Waveguide Structure for Optimization of Microwave Ablation. In Proceedings of the 2024 Panhellenic Conference on Electronics & Telecommunications (PACET), Thessaloniki, Greece, 28–29 March 2024; pp. 1–4. [Google Scholar] [CrossRef]
- He, Z.; Lin, X.; Yang, X.; Li, C. A Flexible Microwave Ablation Antenna for Lung Cancer Treatment. IEEE Antennas Wirel. Propag. Lett. 2023, 22, 3147–3151. [Google Scholar] [CrossRef]
- Cilia, F.; Farrugia, L.; Bonello, J.; Farhat, I.; Sammut, C.V.; Joe Dimech, E. Design of an uncooled microwave monopole antenna for tissue ablation at 2.45 GHz. In Proceedings of the 2021 15th European Conference on Antennas and Propagation (EuCAP), Dusseldorf, Germany, 22–26 March 2021; pp. 1–5. [Google Scholar] [CrossRef]
- Yassin, M.M.; Tammam, E.; Ibrahim, A.A.; Said, A.M.; Galal, A.I. A Dual Ring Interstitial Monopole Antenna with Spherical Heating Pattern for Hepatic Tumor Microwave Ablation. In Proceedings of the 2019 36th National Radio Science Conference (NRSC), Port Said, Egypt, 16–18 April 2019; pp. 425–430. [Google Scholar] [CrossRef]
- Aparna, V.C.; Gandhi, A.S.; Naik, S.B.; Harsh, R. Minimally Invasive Microwave Ablation Antenna Designs at 915 MHz and 2.45 GHz. In Proceedings of the 2022 National Conference on Communications (NCC), Online, 24 May–27 May 2022; pp. 280–284. [Google Scholar] [CrossRef]
- Hung, L.; Gao, F.; Hagness, S.C.; Behdad, N. Microwave Ablation at 10.0 GHz Achieves Comparable Ablation Zones to 1.9 GHz in Ex Vivo Bovine Liver. IEEE Trans. Biomed. Eng. 2014, 61, 1702–1710. [Google Scholar] [CrossRef] [PubMed]
- Mohtashami, Y.; Luyen, H.; Sawicki, J.F.; Shea, J.D.; Behdad, N.; Hagness, S.C. Tools for Attacking Tumors: Performance Comparison of Triaxial, Choke Dipole, and Balun-Free Base-Fed Monopole Antennas for Microwave Ablation. IEEE Antennas Propag. Mag. 2018, 60, 52–57. [Google Scholar] [CrossRef]
- Mohtashami, Y.; Behdad, N.; Hagness, S.C. Toward Flexible Microwave Ablation Antennas With a Balun-Free Helical Dipole Design. IEEE Trans. Antennas Propag. 2020, 68, 5052–5060. [Google Scholar] [CrossRef]
- Zorbas, G.; Samaras, T. Simulation of radiofrequency ablation in real human anatomy. Int. J. Hyperth. 2014, 30, 570–578. [Google Scholar] [CrossRef] [PubMed]
- Page, M.J.; McKenzie, J.E.; Bossuyt, P.M.; Boutron, I.; Hoffmann, T.C.; Mulrow, C.D.; Shamseer, L.; Tetzlaff, J.M.; Akl, E.A.; Brennan, S.E.; et al. The PRISMA 2020 statement: An updated guideline for reporting systematic reviews. BMJ 2021, 372, n71. [Google Scholar] [CrossRef]
- IEEE. Standard for Safety Levels with Respect to Human Exposure to Radio Frequency Electromagnetic Fields, 3 kHz to 300 GHz; IEEE: New York, NY, USA, 1992. [Google Scholar] [CrossRef]
- IT’IS Foundation, «TISSUE PROPERTIES». Available online: https://itis.swiss/virtual-population/tissue-properties/database/database-summary/ (accessed on 4 February 2025).
- O’Rourke, A.P.; Lazebnik, M.; Bertram, J.M.; Converse, M.C.; Hagness, S.C.; Webster, J.G.; Mahvi, D.M. Dielectric properties of human normal, malignant and cirrhotic liver tissue: In vivo and ex vivo measurements from 0.5 to 20 GHz using a precision open-ended coaxial probe. Phys. Med. Biol. 2007, 52, 4707–4719. [Google Scholar] [CrossRef]
Disclaimer/Publisher’s Note: The statements, opinions and data contained in all publications are solely those of the individual author(s) and contributor(s) and not of MDPI and/or the editor(s). MDPI and/or the editor(s) disclaim responsibility for any injury to people or property resulting from any ideas, methods, instructions or products referred to in the content. |
© 2025 by the authors. Licensee MDPI, Basel, Switzerland. This article is an open access article distributed under the terms and conditions of the Creative Commons Attribution (CC BY) license (https://creativecommons.org/licenses/by/4.0/).