Abstract
We proposed a novel technique for detecting optical filter shift in ROADMs in optical transmission lines by applying machine learning on DP-16QAM constellation data captured just after Analogue-to-Digital Converters (ADCs) in a digital coherent receiver. For this purpose, we implemented Docker container applications in WhiteBox Cassini to acquire the real-time raw digital data. By using the captured data, we generated CNN models for the detections in off-line processing and used them for real-time detections. As preliminary results, we confirmed the successful detection of optical filter shift in real-time with an accuracy of 51 GHz. To enhance the detection accuracy, we challenged ourselves to reproduce digital coherent constellation data by using a Generative Adversarial Network (GAN) for real-time optical filter shift detection for the first time. By utilizing a GAN, we successfully generated clone data based on actual constellation data. By adding the cloned data onto the actually captured data, we successfully enhanced detection sensitivity to as high as 26 GHz. As a result, we reduced the amount of required data for the high detection accuracy by 68% with the help of GAN-supported data augmentation. Furthermore, we confirmed our augmentation method enables the prediction of faults before they occur by enabling high enough detection sensitivity to detect an optical filter shift before degradation of Bit Error Rates (BERs) appears. This demonstrates the potential of GAN-based data augmentation in optimizing the efficiency and precision of optical network impairment sensing by using captured digital coherent optical signal.
1. Introduction
In recent years, with the advent of digitalization and various online services such as subscription video-on-demand services (SVOD), the amount of data traffic on the network has been increasing. In addition to that, in the Beyond-5G, 6G era, virtualized network slices on top of the physical network will achieve various services to meet each requirement in the next-generation networks. Moreover, various virtual network operators, including mobile virtual network operators (MVNOs), will provide novel services and applications on such network slices. As a natural consequence of such developments, network complexity and diversification will be expected to explode, including network slicing and other virtualization network technologies [1]. On the other hand, the continued adoption of advanced technologies such as software-defined networking (SDN), and network functions virtualization (NFV) will necessitate future networks to achieve even greater levels of flexibility and programmability in both management and service delivery. These networks will not only expand significantly in size and complexity but will also need to dynamically adapt to diverse and evolving requirements. A vast array of network slices, each tailored to specific needs, will operate on a layered and interconnected infrastructure, managed by various network service and content providers. Consequently, the scale, heterogeneity, and intricacy of these systems are expected to grow to a point were traditional, human-driven administration will no longer be sufficient. Given this background, autonomous network diagnosis [2,3] and proactive maintenance [4] by fault prediction are attracting attention for the purpose of economizing on manpower and reducing the cost of network maintenance and operations. Various drivers are pushing toward the automation of networks.
On the other hand, to reduce equipment costs, there is a strong trend toward network disaggregation [5,6,7]. As shown in Figure 1, disaggregation refers to the openness of network equipment. Traditionally, as shown in this figure under the term “aggregated network”, all network components are typically supplied by a single vendor. In contrast, the disaggregated approach allows for the selection of individual components from a variety of vendors. This shift encourages price competition among vendors, leading to potential reductions in CAPital EXpenditures (CAPEX) over time. Such devices are called WhiteBox, since we can see the inside of the box. From an OPerational EXpenditure (OPEX) perspective, the aggregated approach offers a significant advantage in terms of clear accountability for network failures, such as transponder malfunctions. In an aggregated setup, the vendor responsible for providing the network components assumes full responsibility for resolving failures and restoring normal operations. In contrast, the disaggregated approach involves components sourced from multiple vendors, which can introduce ambiguity when diagnosing failures that occur between components, such as an issue involving Component A from Vendor A and Component B from Vendor B. In such cases, identifying the root cause of the failure and determining accountability can become a complex and time-consuming task.
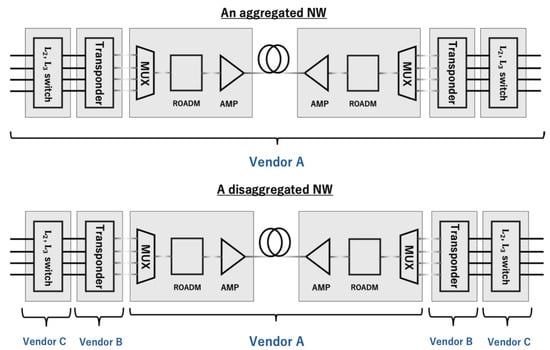
Figure 1.
Optical network disaggregation.
To address this challenge, autonomous network diagnosis plays a crucial role. By enabling precise fault detections and analysis, it minimizes the disadvantages associated with the disaggregated approach, ensuring efficient troubleshooting and reducing the operational burden. In TIP [6], various WhiteBox packet transponders have been designed and implemented, such as Cassini and Voyager. To promote open innovations based on WhiteBox, a multi-vendor inter-operability demonstration is reported [8]. Moreover, we can implement various container-based applications such as network monitoring functions in WhiteBox.
Advancements in artificial intelligence (AI), including machine learning (ML) and deep learning (DL), are already driving progress in this direction, laying the foundation for autonomous network operation and management. In the field of optical networking, digital coherent optical transmission systems have been put into practical use, and it has become common practice to digitize optical signals for signal processing. Therefore, it can be said that the groundwork has been laid for the application of machine learning using neural networks to optical signals as well [9,10].
For autonomous network diagnosis, we proposed a (Collecting, Analyzing, and Testing) CAT platform for autonomous network diagnosis, as shown in Figure 2. The CAT platform autonomously performs network diagnosis by executing iterative diagnostic cycles without human intervention. In each cycle, it collects various types of information, such as logs, alerts, and sensor data, analyzes the collected data to identify potential issues, conducts further tests based on the analysis results, and then gathers additional information. This process is repeated until the root cause of the issue is identified, ensuring efficient and accurate network diagnosis [11,12,13]. When human operators face some ambiguous situation (question marks in the figure), they will arrange additional tests to further dig into toward final cause. The analyzing (yellow arrow) and testing blocks (blue arrow) generates additional tests to diagnose as the next step as shown in the figure. When they got additional results, but could not reach the final cause, then they will generate further additional tests to clarify cause. This cyclic testing continues until it gets final cause of corresponding faults (star marks in the figure).
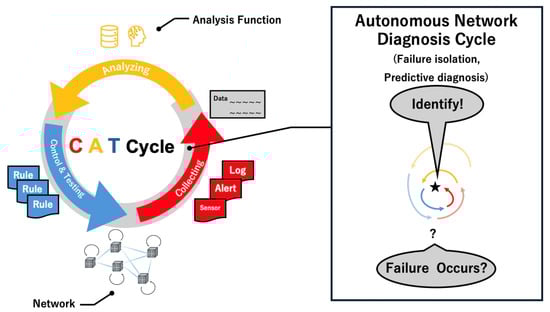
Figure 2.
Functions of the CAT platform.
Conventional network maintenance tasks require multiple types/times of test measurements to find the root cause of a failure. Such network diagnostic algorithms can be realized in the CAT platform, which is implemented in the open-source software StackStorm [14]. CAT algorithms in the StackStorm iterate through various network tests to find the final cause of failure by automatically performing these diagnostic steps. The algorithm is written in Yet Another Markup Language (YAML). The CAT platform is expected to realize autonomous network diagnosis and failure prediction.
Network failures resulting from various causes including network equipment failures, incorrect operation, and network congestions, among others, will lead to disruptions in network services. Therefore, extensive studies have been carried out to realize prompt network diagnosis and network failure predictions. Link failure detection and prediction in mobile ad hoc network are summarized in [15]. Machine learning techniques such as long short-term memory (LSTM) have been used for root cause analysis and prediction of microwave networks [16]. Decision trees and support vector machine (SVM) are used for LAN failure predictions [17]. As for optical networks, various techniques including machine learning have been extensively investigated [18]. In optical backbone and metro area networks, reconfigurable optical add/drop multiplexers (ROADMs) are employed to support cost-effective optical routing function. Conventional ROADM nodes have many optical switches, which have optical steering and filtering functions [19]. An optical filter shift in ROADM nodes in optical network impacts the Quality of Transmission (QoT).
In this article, we introduce a novel real-time data acquisition method from digital coherent optical receiver and approaches for optical filter shift detection. In addition, we introduce an overview of a GAN and an explanation of a DC-GAN (Deep Convolutional-GAN) [20] for data augmentation in Section 2. Then, we describe the experimental setup for performance evaluation of our novel approaches in Section 3. In Section 4, we discuss the evaluation results. Finally, we provide the conclusion in Section 5.
2. Related Works and Our Approaches
2.1. Related Works
As we discussed in the previous section, an optical filter shift in ROADM nodes in an optical network impacts the QoT. A machine-learning-based approach for detecting such a shift using an Optical Spectrum Analyzer (OSA) has been reported in [21]. In this method, the spectrum of a correctly filtered signal exhibits distinct characteristics, including a flat region near the center wavelength, sharp edges, and a rounded transition between the edges and the center frequency. When a filter shift occurs, these spectral features are altered. The detection process leverages residual signals, which are calculated as the difference between the measured spectrum and the ideal spectrum. These residuals serve as input features for a machine-based algorithm to identify a filter shift effectively [22]. However, a notable limitation of this approach is the requirement for additional hardware, such as OSAs, to be deployed at each reconfigurable optical add/drop multiplexer (ROADM) node, which may increase system complexity and costs.
In contrast to the above work, we propose a convolutional neural network (CNN)-based approach [21] that utilizes constellation data obtained prior to demodulation by the transponder. By analyzing these constellation data before the demodulation process within the Digital Signal Processor (DSP)-LSI installed in the digital coherent optical receiver, our method achieves high accuracy detection of the optical filter shift [21]. This approach directly examines the optical signal itself, enabling a precise determination of whether the signal is affected by optical filters. Furthermore, it requires only front-end ADC and feedback circuits for sampling synchronization, eliminating the need for OSAs. This simplification reduces hardware complexity and enhances the practicality of the solution while maintaining reliable detection performance.
Asynchronous sampling methods have already been proposed for detecting the Optical Signal-to-Noise Ratio (OSNR) of optical signals [23]. They have successfully estimated OSNR for various modulation formats’ optical signals by using machine learning techniques. Such information can be used for QoT estimation. However, an asynchronous sampling procedure averages time-dependent features contained in the received signal. Therefore, it will erase important information resulting from time-dependent phenomena.
We propose a novel data acquisition method to improve the quality of data for machine learning in the next section.
As discussed above, there have been some reports on fault diagnosis or detection of ROADMs in a photonic network. However, to the best our knowledge, there have been no reports of failure prediction of optical filters in ROADMs. We propose a novel failure prediction technique for optical filters in ROADMs in this paper.
2.2. Real-Time Monitoring of Digital Coherent Optical Signals by TRDS
We propose a novel network monitoring approach which is Tapped Raw Digital Signal (TRDS) monitoring in digital coherent optical receivers. An optical signal transmitted through optical transmission links experiences various impairments, including chromatic dispersion, polarization mode dispersion, optical losses in connection points, optical fiber bending, noise from optical amplifiers, and optical spectrum deformation induced by optical filter shift in intermediate optical filters in ROADMs. Therefore, there will be some information on these impairments in the optical signal received in digital coherent receivers. In conventional optical receivers, we use various powerful signal processes to compensate for such impairments, as shown in Figure 3.
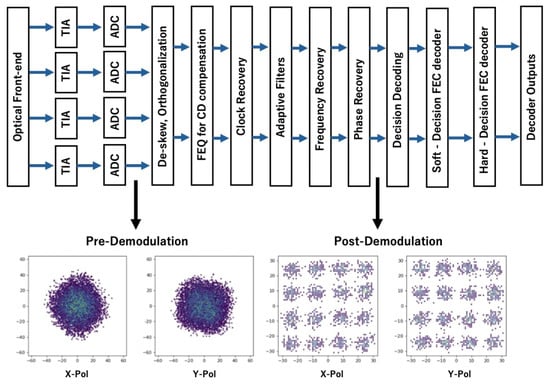
Figure 3.
Block diagram of coherent receiver.
For instance, chromatic dispersion can be compensated for using finite impulse response (FIR) filters applied in either the time domain or the frequency domain. Similarly, polarization mode dispersion can be mitigated using adaptive butterfly-type filters, which dynamically update their tap coefficients to address variations. However, from the perspective of detecting various impairments, such robust signal processing techniques may pose issues. This demodulation operation will erase the information contained in the received optical signal. Thus, we propose a novel approach where we tap digital signals just after ADC in optical receivers, as shown in Figure 3 [24].
By monitoring the raw signal without any digital signal processing, we can expect to detect various impairments occurring in transmission lines.
The actual configuration for TRDS is shown in Figure 4. The sampling phase is synchronized with the symbol rate of optical signal by the PLL circuit, as shown in the figure. To improve the accuracy of synchronization, we compensated for the known impairment caused by chromatic dispersion in optical transmission links. The tapped raw digital signals retain information about various impairments in their original form, preserving essential details for further analysis. Therefore, we can expect to detect such impairments by analyzing the TRDS signals.
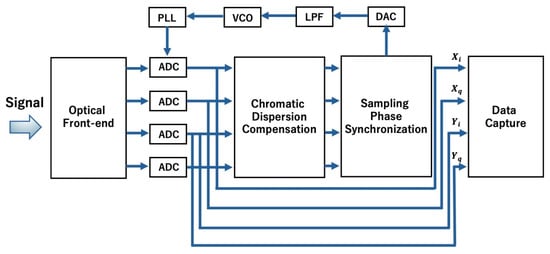
Figure 4.
Tapped raw digital signal (TRDS); (DAC: Digital-to-Analog Converter, LPF: Low-Pass Filter, VCO: Voltage-controlled Oscillator, PLL: Phase-Locked Loop).
By utilizing the above-mentioned symbol synchronized sampling technique, we have already succeeded in fault detection for various optical networks by applying machine learning to digital data about optical networks obtained from digital signal processing LSI. In [24], the detection of optical fiber bending with machine learning was reported, which extended the network monitoring capability from nodes to links. It can detect optical fiber bending without any monitoring tools such as an Optical Time Domain Reflectometer (OTDR). The authors used pre-demodulation constellation data from a digital coherent optical receiver for machine learning. They implemented the detection software on the Cassini WhiteBox [25]. Their results showed high detection accuracy in high Optical Signal-to-Noise Ratio (OSNR) conditions. Furthermore, they achieved high accuracy in optical fiber bending detection by incorporating post-demodulation data in addition to pre-demodulation data under low OSNR conditions, too. In [26], the authors experimentally confirmed real-time detection of optical cross talk noise in an optical network by applying machine learning to tapped raw optical signal data obtained from a digital coherent LSI for the first time. As a result, they achieved above 98% of accuracy by using a 25 Gbit/s DP-16QAM optical signal.
2.3. Generative Adversarial Network for Data Augmentations
A Generative Adversarial Network (GAN) is a framework introduced by [27] to train deep generative models. As shown in Figure 5, it consists of a generator network, , whose goal is to learn a distribution, matching the data, and a discriminator network, which tries to distinguish between real data (from true distribution ) and fake data (generated by the generator).
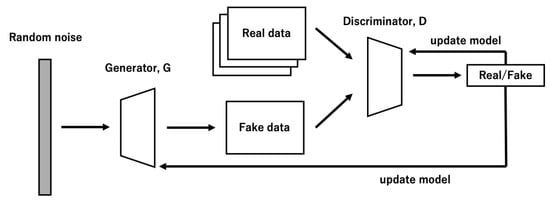
Figure 5.
GAN model diagram.
and are competitors in a minimax game with the following formulation:
Here, represents the empirical estimate of the expected value of the probability. The generator transforms a noise variable into , effectively generating a sample from the distribution . Ideally, the distribution should converge to the true data distribution Minimizing is mathematically equivalent to maximizing . The training process is iterative and adversarial. The generator learns to fool the discriminator by improving the quality of its generated samples, while the discriminator simultaneously learns to better distinguish between real and fake data. This dynamic interplay results in a balance where the generator produces high-quality samples, and the discriminator achieves robust classification accuracy.
The Deep Convolutional Generative Adversarial Network (DCGAN) [20] is an extension of the standard GAN that incorporates convolutional and deconvolutional layers to improve the quality and stability of the generated outputs. While traditional GANs typically rely on fully connected layers, DC-GANs utilize convolutional layers in the generator and discriminator, making them particularly effective for image-related tasks as shown Figure 6.
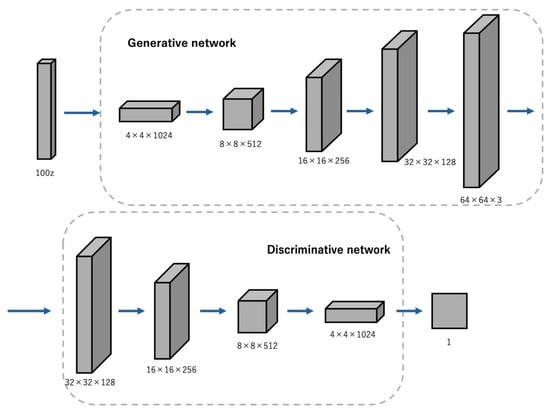
Figure 6.
Dimensions and structure of a DC-GAN model diagram.
In a DC-GAN, the generator employs transposed convolutional layers to progressively up-sample a low-dimensional noise vector into a high-resolution image. Meanwhile, the discriminator uses standard convolutional layers to down-sample the input image and determine whether it is real or generated. This architectural shift has several advantages. The use of convolutional layers allows the network to effectively capture spatial hierarchies and local features in the data, making DC-GAN more suitable for generating visually coherent images. Furthermore, techniques such as replacing pooling operations with stridden convolutions and the introduction of batch normalization help to stabilize the training process, a common challenge in traditional GAN. Overall, the DC-GAN represents a significant improvement over the conventional GAN, particularly in applications involving high-dimensional data like images, due to its ability to leverage convolutional structures for better feature representation and generation quality.
To train machine learning models in the actual field, it is necessary to acquire a large volume of constellation data to train machine learning models for various anomalous conditions. However, collecting the constellation data used for machine learning takes a certain amount of time, and the data are not generally distributed. In addition, the actual network is mainly used to carry customer traffic; so, the time needed to acquire constellation data should be minimized. Therefore, reducing the amount of data needed for machine learning seems to be very attractive to solve the above-mentioned issue.
To solve this issue, we present a novel approach to generate new constellation data using a GAN [27] based on actually measured constellation data and we demonstrate the effectiveness of the generated constellation data in optical filter shift detection. Furthermore, the effectiveness of the fault prediction method in ROADMs will be examined by combining the data augmentation method and BER monitoring. This article extends our previous work [21].
3. Optical Filter Shift Detection and Data Augmentation
3.1. Experimental Setup
Figure 7 shows the experimental setup for optical filter shift detection and the WhiteBox apparatus used in this experiment. A CFP2-ACO transceiver installed in the Cassini WhiteBox is used as the optical source. The transmitter wavelength and corresponding linewidth of the CFP2-ACO transceiver are 1550 nm and 300 kHz, respectively. Thus, its coherent length can be estimated as approximately 300 m [28]. The optical signal is launched into a fiber link that consists of a G.652 standard Single-Mode Fiber (SMF) and an optical variable ATTenuator (ATT). The transmitter generates a Dual-Polarization (DP) 16 Quadrature Amplitude Modulation (16QAM) optical signal of 25 GBd. The optical signal at the transmitter with 1 dBm of output power is launched into a flat-top optical filter with an FWHM bandwidth of 121 GHz through the ATT of 5dB. The filter edge rolling-off slope is 55 dB/nm. The output from the optical filter was measured by OSA. The resolution of the OSA is 0.06 nm.
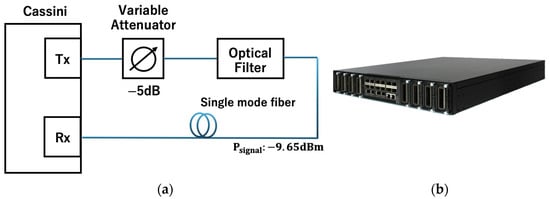
Figure 7.
(a) Experimental setup for optical filter shift detection; (b) WhiteBox packet transponder Cassini.
For real-time data acquisition, as shown in Figure 8a, we implemented Docker container applications in the Cassini WhiteBox packet transponder [25] to acquire/store constellation data and to test trained CNN models. In the demodulation module in the LSI, we implemented two types of Forward Error Correction (FEC) codes. One is a Soft-Decision (SD) FEC with 13% redundancy and another one is Hard-Decision (HD) FEC with 7% redundancy. Figure 8b shows a heatmap obtained by the Docker container applications. This is a contour map where brighter color means high population. These two codes are concatenated to ensure reliable transmission, as shown in Figure 9. The Docker container applications can also monitor the Bit Error Rate (BER) before SD-FEC, HD-FEC and after these decoders at the tapping points, as shown in Figure 9.
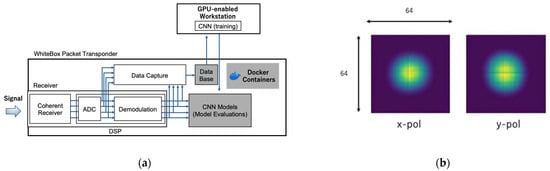
Figure 8.
Sensing system configuration: (a) Docker containers for real-time detection; (b) 2D histogram generated by TRDS.
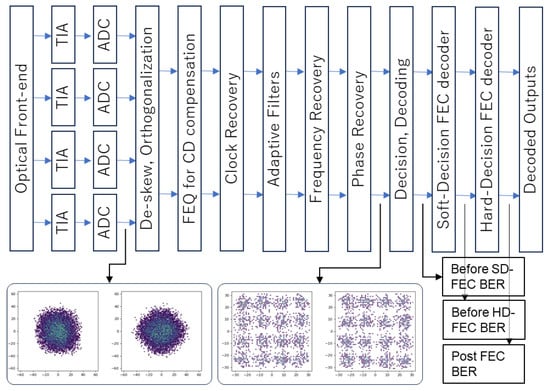
Figure 9.
Tapping points of BERs.
The Cassini WhiteBox is a versatile platform capable of hosting various container-based applications tailored for different purposes, such as data collection and information monitoring, as outlined in [25]. The tapped digital waveform data are temporarily stored in a database container application implemented in Cassini. For machine learning purposes, we accumulated the sampled digital data, consisting of I/Q components, over a fixed timeframe. From these data, we generated 2D histograms with a resolution of 64 × 64 for each polarization (X and Y), as shown Figure 8b. This histogram represents a heat map, with the green area in the center showing higher frequencies.
The captured data were sent to a Redis database container and stored in the container. The TRDS data were retrieved from the database and used to train CNN models in GPU-installed workstation server.
Figure 10 illustrates the software stack of our WhiteBox transponder system. We deployed network diagnosis containers in addition to the Kubernetes orchestrator, enabling seamless management and scalability. This platform allows for the straightforward addition of new sensing, diagnosis, and testing applications as needed, offering flexibility and adaptability to evolving requirements.
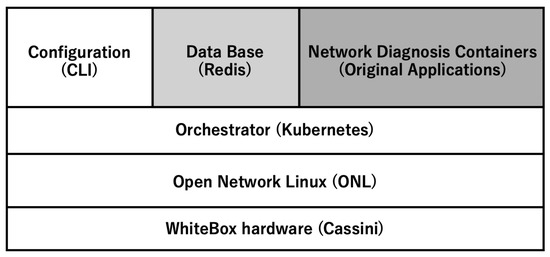
Figure 10.
Software stack structure in our WhiteBox.
To train the CNN model, a workstation PC equipped with a Graphics Processing Unit (GPU) retrieved the captured data stored in the Redis container. The performance of the workstations is shown in Table 1. Once the training process was completed, the trained CNN model was transferred to the filter shift estimation container. This allowed for real-time detection of the filter shift using the trained model, ensuring an efficient and accurate performance.

Table 1.
Workstation performance.
The structure of the CNN model used for optical filter shift detection is shown in Figure 11. The dataset sizes for the constellation data, both before and after demodulation, are configured as 64 × 64. Since there are two polarizations (X and Y), the input data for the CNN model are represented as a three-dimensional tensor with the dimensions 2 × 64 × 64. This structure is depicted in the accompanying figure, where each polarization contributes its own 64 × 64 grid of constellation points to form the input layer. This design enables the model to process and learn from both polarization components simultaneously, improving its performance in analyzing and detecting impairments in optical signals. After the input layer, those data are input into DenseNet [29] (DenseNet 121) implemented by PyTorch. Finally, classification values are obtained through the fully connected layer. In this experiment, the magnitude of the filter shift was divided into two cases: the first filter shift is large (51 GHz) and the second filter shift is small (26 GHz). Accumulation and Min–Max normalization were performed on the captured data.
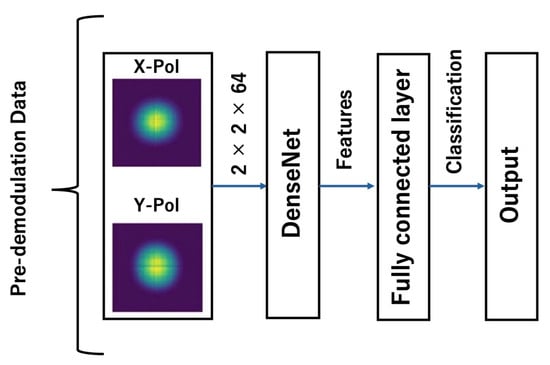
Figure 11.
Pre-demodulation input to DenseNet.
We utilized Python and PyTorch as the primary machine learning platform and library for developing and training the models. The Docker containers hosting these components were centrally managed using the Kubernetes orchestration tool. For real-time monitoring of various parameters within the Cassini system, a dedicated webserver container was implemented. This container allows for real-time telemetry and visualization of critical metrics such as transmitter (Tx) and receiver (Rx) power, bit error rate (BER), and the pre-/post-demodulation constellations. A snapshot of the telemetry interface is shown in Figure 12. Additionally, Kubernetes ensures high availability and fault tolerance. If any container encounters an issue and becomes non-operational, Kubernetes automatically detects the failure and restarts or recovers the container, maintaining the system’s overall functionality and reliability. This robust orchestration capability significantly enhances the resilience and manageability of the system.
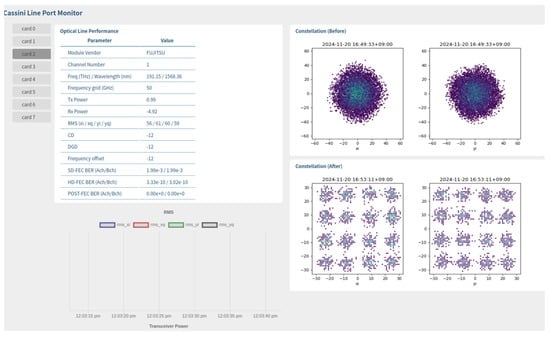
Figure 12.
Snapshot of real-time telemetry (on the network).
3.2. Data Augmentation
We evaluated the detection performance by adding constellation data reproduced by the DC-GAN. For data augmentation, a DC-GAN-generated model is created with reference to a model created by using only measured constellation data. The model diagram of the DC-GAN for this experiment is shown in Figure 13. In addition, the DC-GAN training parameters used in this experiment are shown in Table 2 below.
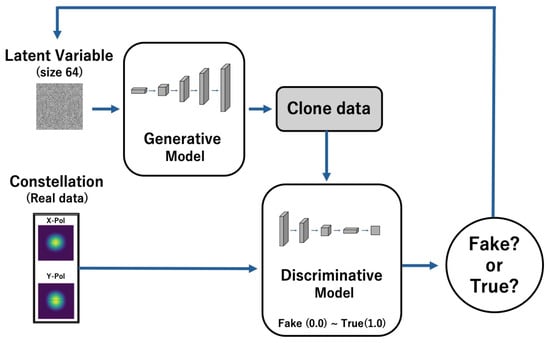
Figure 13.
DC-GAN model diagram.
Table 2.
The DC-GAN training parameters.
4. Experimental Results and Discussion
4.1. Optical Spectra and BERs
Figure 14 and Figure 15 show the shape of the optical spectrum for each condition and constellation histogram (heatmap) obtained at the conditions determined (51 GHz and 26 GHz). Three labels are assigned for each condition: ‘left shift’ for the negative frequency shift, ‘right shift’ for the positive frequency shift, and ‘normal’ for optimum. The optical spectra for the above conditions were acquired using an optical spectrum analyzer. At 51 GHz shift, we can observe a small tilt in each spectrum. On the other hand, at 26 GHz shift, a very slight slope is observed compared to that at 51 GHz.
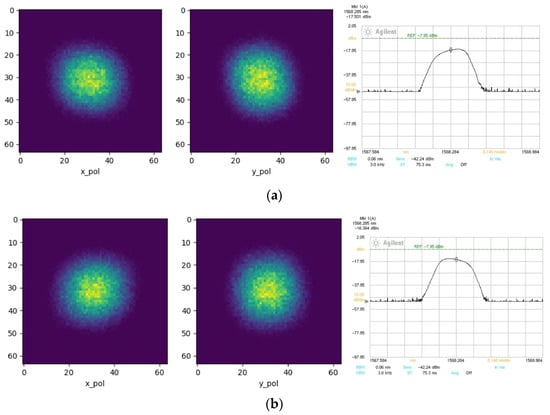
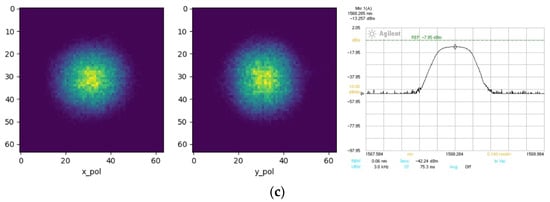
Figure 14.
Heatmap and optical spectrum examples used for training: (a) −51 GHz; (b) +51 GHz; (c) no shift.
Figure 15.
Heatmap and optical spectrum examples used for training: (a) −26 GHz; (b) +26 GHz; (c) no shift.
The BERs are measured at the tapping points depicted in Figure 8. The BERs before SD-FEC and after HD-FEC are summarized in Table 3.
Table 3.
The measured BERs.
As shown in the table above, at ±51 GHz of optical filter shift, obvious error rate increases were observed before SD-FEC. These increases represent some kind of abnormality occurring. However, we cannot identify the cause of the abnormalities by the information obtained by BER monitoring only. On the other hand, at ±26 GHz of the optical filter shift, no abnormality was detected in the error rate before SD-FEC. In addition, since no errors were observed in the post-FEC BERs, there is no impact on the actual network service at these optical filter shifts.
4.2. Data Augmentation by Using DC-GAN
Figure 16 shows some examples of constellation data generated by the DC-GAN based on the actual constellation data obtained in our experiment in comparison with the original data. The constellation heat map cloned by the DC-GAN closely resembles the real data. The final value of the discrimination signal is 0.922/1.000, indicating that the data generated by the DC-GAN is sufficiently similar to the actual data.
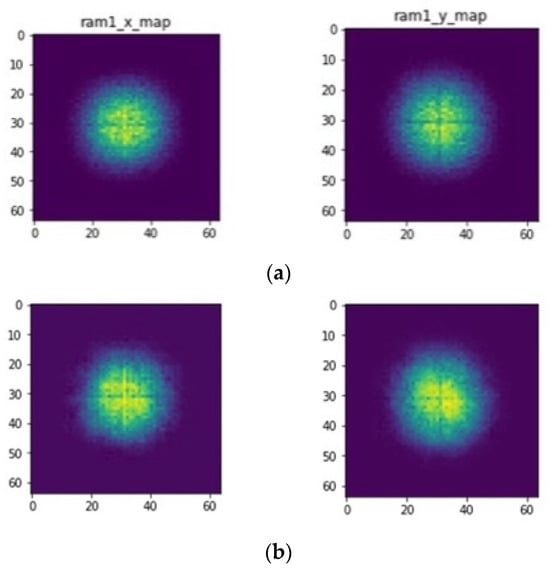
Figure 16.
Heatmap examples: (a) original constellation; (b) cloned constellation generated by the DC-GAN.
4.3. Model Evaluation
We used F1-scores to evaluate the generated models. The F1-score is a widely used metric that quantitatively represents the degree of alignment or correspondence between the true values and the predicted values in a classification task. The F1-score is calculated by following formulation:
Here, TP (True Positive), FP (False Positive), and FN (False Negative) represent the number of validation data points that were predicted as Positive or Negative, corresponding to their actual True or False states. In this experiment, for example, for the No-Shift data, the F1-score would be higher if it were not detected with other labels (−51 GHz, +51 GHz).
4.3.1. Evaluation Results at 51 GHz Shifts
Figure 17 shows the evaluation result at 51 GHz shifts with TRDS data only. The number of training data points used was 12,450 for each label. We successfully achieved very high accuracy (nearly 100%).
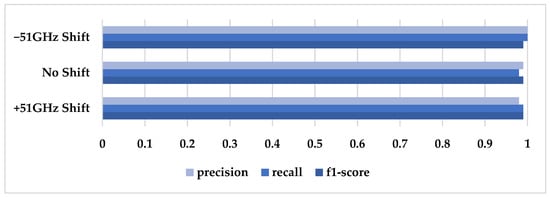
Figure 17.
Evaluation result at 51 GHz without augmentation (DS: 12,450).
4.3.2. Evaluation Results at 26 GHz Shifts
- Results with TRDS data only
Figure 18 shows the evaluation results at the 26 GHz shift without augmentation. The number of training data points used was 13,000 for each label. The number was almost the same as the one used for detection at the 51 GHz shift.
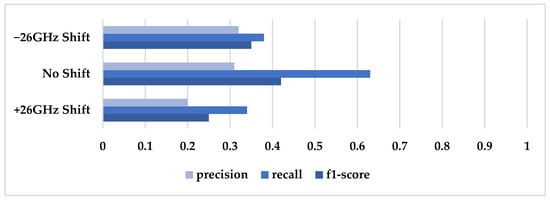
Figure 18.
Evaluation result at 26 GHz without augmentation (DS: 13,000).
As shown in Figure 18, the detection accuracy was severely degraded in comparison with the results at 51 GHz shifts. The degradation in detection accuracy at 26 GHz shifts may be a result of some characteristic features that correspond to optical filter shifts becoming fainter than in the case of 51 GHz shifts. To improve the detection accuracy, we challenged to augment the constellation data by adopting the above-mentioned novel DC-GAN-based data reproduction scheme.
- 2.
- Results with augmented data only
Next, an evaluation experiment was conducted using only the constellation data generated by the DC-GAN, as shown Figure 19. The evaluation experiments used two dataset sizes: 13,000, which matches the number used in the 26 GHz shifting experiment without augmentation, and an increased count of 28,000 generated by the DC-GAN.
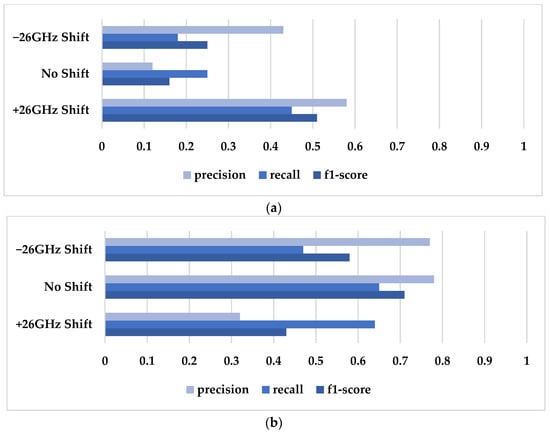
Figure 19.
Evaluation result at 26 GHz; only augmented data; (a) DS: 13,000; (b) DS: 28,000.
As evident from the evaluation results, when the evaluation experiment was conducted using the same dataset size of 13,000 as in the first experiment, the overall performance was not satisfactory, as shown in Figure 19a, despite some bias being observed among the three labels. However, when the dataset size was increased to 28,000, the overall score showed improvement, as one can see in Figure 19b, although the results remained suboptimal as an evaluation outcome. However, these findings confirm that the constellation data generated by the DC-GAN are treated equivalently to the data obtained directedly from the receiver LSI, thereby demonstrating their independence. Additionally, it was observed that the evaluation results showed proportional improvement with an increase in the size of the datasets. This evaluation is serves to clarify whether the GAN-generated data could be used for machine learning of an optical filter shift. We successfully confirmed its validity through this evaluation experiment.
- 3.
- Results with TRDS data and GAN-augmented data
Finally, an evaluation experiment was conducted by combining the constellation data obtained through the conventional method with the data generated by the DC-GAN, as shown Figure 20. The dataset consisted of 13,000 TRDS data points and 28,000 DCGAN-generated data points for each of the three labels, resulting in a total of 41,000 data for evaluations. The amount of optical filter shift is 26 GHz.
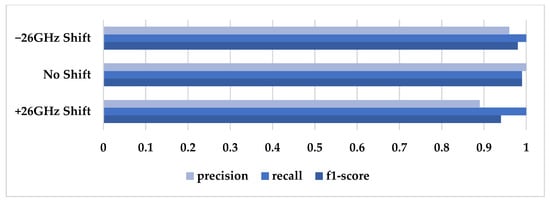
Figure 20.
Evaluation result at 26 GHz with augmentation data (DS: 41,000).
As shown above, by incorporating the constellation data generated by the DC-GAN and increasing the number of datasets used in the evaluation experiment, we achieved around 90 to 100% of precision, recall and F1-score, even with a small optical filter shift. Moreover, 68% of the total training data used in this evaluation experiment consisted of constellation data generated by the DC-GAN. As a result, we successfully augmented constellation data from the original data obtained by TRDS. This was our goal in this paper. We achieved sufficiently high accuracy in this specific use case; so, we do not need further optimization of GAN models. This demonstrates the effectiveness of our approach in reducing the amount of actual training data volume required for optical impairment sensing while simultaneously enhancing the corresponding sensitivity. Further optimization of our data augmentation technique will be expected to yield a larger reduction in the data volume required for machine learning and will be able to minimize the disruption of actual production network for data acquisition. Such optimization of our approach, including optimization of machine learning models for augmentation, will be the focus of our further studies. To further minimize disruption related to data acquisition, one of the potential approaches could be the case where each ROADM vendor provides pre-captured constellation data or a mathematical model of precise frequency response when they sell the system.
4.4. Combined Optical Filter Shift Detection and BER Evaluation
To simultaneously monitor the optical filter shift and the time series variation in BER, we conducted an evaluation experiment in the configuration, as shown in Figure 21. We implemented container applications to monitor the BER at the tapping points, as shown in Figure 8. These applications work together with the optical shift detection container.
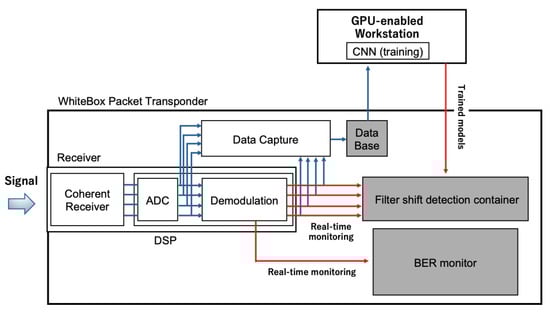
Figure 21.
Simultaneous acquisition of optical filter shift and BER.
The summary results of simultaneous monitoring of BERs and DC-GAN-enhanced optical filter shift detection are shown in Figure 22. The SD-FEC BER for each optical filter shift stayed stable when the optical filter shift was within 26 GHz and showed a significant increase at ±51 GHz. As for optical filter shift detection, we successfully detected it at as small as ±26 GHz, where we there was no sign of abnormality in the BER. The BER is a fundamental measure for transmission quality; so, we can say that network services work well and in a normal state when there is no BER increase. In other words, the proposed technology made it possible to confirm that an optical filter shift had already occurred, even when the optical transmission line was in a completely normal state. The optical filter shift gradually increases with time; so, we can predict that there will be a failure resulting from the optical filter shift in ROADMs in the near future by utilizing the novel DC-GAN-enhanced optical filter shift detection. To realize a practical prediction system based on this idea, one of the options may be to accumulate and prepare sufficient data of temporal drift of the central optical frequency in ROADM nodes. Based on this information, we can estimate the residual time to encounter the failure. How to estimate the actual time needed to induce ROADM failures will be focused on in further research.
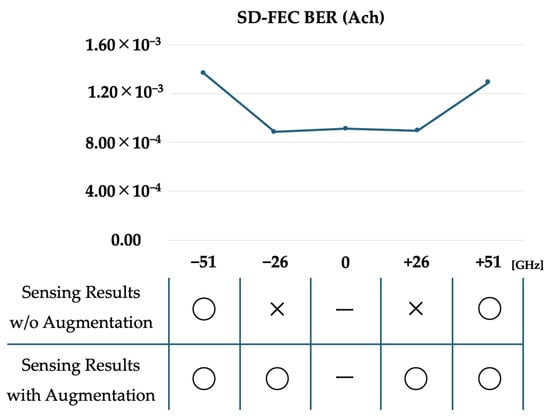
Figure 22.
Joint diagram of SD-FEC BER variation and sensing results at each optical filter shift.
In a conventional optical network, we have multiple ROADM nodes between the optical sender and receiver. By using our proposed technique, we can find the optical filter shift in a ROADM node among these ROADM nodes. How to identify which node has a problem will be focused on in a further study. On of the options will be to detune each optical filter with a very small amount, such as 26 GHz, in the opposite direction of the detected optical filter shift in the candidate ROADMs. When we find no optical filter shift sign from the detection container, the ROADM can be assumed to be experiencing failure. In this case, we only need one detection container in the receiver side; so, it will be a cost-effective solution. In general, precise control of absolute optical frequency is very hard. But relative detuning is conventional. For example, the optical frequency of filters is usually stabilized by temperature control of the relevant devices. Based on the derivative coefficient of optical frequency and temperature, we can detune frequency in some desired amount by changing the temperature. But it becomes very hard to anchor at an absolute optical frequency. However, such a detuning function will be available only in limited versions of ROADMs. So, a generic approach to realize a cost-effective solution will be the focus of further research.
In this evaluation experiment, we confirmed a specific network condition, as explained in the experimental setup. To ensure more reliability of our approach, we need experimental verification in various network conditions, including various OSNR conditions, modulation formats, FEC variations, and different network architectures, among others. These evaluations will be the focus of further studies.
The computation time required for DC-GAN data augmentation is around 30–60 min using a conventional GPU-enabled server. Thus, for actual implementation of this proposed approach, pre-training and generation of DC-GAN-augmented data could be carried out by a conventional server machine near network equipment. Then, the trained model can be copied to the corresponding detection container applications in WhiteBox transponders. The network disaggregation trend has been expanding mainly in the data center interconnection network and gradually penetrating into the Tier1 carrier network. Therefore, such a container-based detection approach could be easily implemented in the WhiteBox-based network.
5. Conclusions
We proposed a novel real-time ROADM failure detection and prediction system that utilizes the tapped raw optical signal from a digital coherent optical receiver. To achieve real-time monitoring, we implemented container-based applications within the Cassini WhiteBox. These container applications include tapping digital signal data immediately after the ADCs in receiver LSI, storing the acquired data from Cassini, and providing it for machine learning to detect an optical filter shift. As a result, we successfully confirmed the detection of the optical filter shift with high accuracy (nearly 100%) by using DP-16QAM constellations data before demodulation for machine learning at a 51 GHz shift. Moreover, we proposed a novel data augmentation technique of the digital signal data captured from a digital coherent LSI to reduce the amount of data needed for machine learning. We successfully cloned the constellation data by using a DC-GAN trained on actual constellation data. We confirmed enhanced sensitivity in optical filter shift detection (26 GHz) with a reduced amount of actual data (68% reduction) for machine learning. Additionally, by analyzing changes in BERs before SD-FEC decoders, the optical filter shift could be detected before the degradation of the BERs, demonstrating the effectiveness of our proposed approach for fault prediction. The estimation of the actual timeframe from the detection of optical filter shift to the occurrence of BER degradation will be the focus of future work.
As the demand for diverse communication services continues to expand and communication technologies advance at an ever-increasing pace, we remain committed to improving the accuracy of real-time sensing and further developing our proposed CAT platform to reduce OPEX in network operation and ensure a sustainable future of such a complex network by providing an autonomous fault diagnosis system. By enhancing the performance and reliability of these technologies, we aim to create an environment where users can access communication services with greater comfort, efficiency, and convenience. Our goal is to contribute to a future where communication infrastructure supports seamless connectivity, meeting the needs of a rapidly evolving digital society.
Author Contributions
Conceptualization, A.H., Y.N. and S.N.; methodology, A.H., Y.N., S.N. and T.N.; software, Y.N., S.N. and T.N.; validation, S.N. and T.N.; formal analysis, T.N.; investigation, T.N.; data curation, T.N.; writing—original draft preparation, T.N.; writing—review and editing, A.H.; visualization, T.N. and A.H.; supervision, A.H.; project administration, A.H. All authors have read and agreed to the published version of the manuscript.
Funding
This study is partially supported by the Support Center for Advanced Telecommunications Technology Research (SCAT) in Japan.
Institutional Review Board Statement
Not applicable.
Informed Consent Statement
Not applicable.
Data Availability Statement
The data presented in this study are available in this article.
Conflicts of Interest
The authors declare no conflicts of interest.
References
- An Introduction to Network Slicing. Available online: https://www.gsma.com/futurenetworks/resources/an-introduction-to-network-slicing-2/ (accessed on 11 November 2024).
- Tanaka, T.; Hirano, A.; Kobayashi, S.; Oda, T.; Kuwabara, S.; Lord, A.; Gunning, P.; Dios, G.; Lopez, V.; Lerma, A.; et al. Autonomous network diagnosis from the carrier perspective [Invited]. J. Opt. Commun. Netw. 2020, 12, A9–A17. [Google Scholar] [CrossRef]
- Tanaka, T.; Kuwabara, S.; Oda, T.; Inuzuka, F.; Inui, T. Advances toward AI-assisted autonomous network. In Proceedings of the 2019 Asia Communications and Photonics Conference (ACP), Chendu, China, 2–5 November 2019. Artificial Intelligence Assisted Photonic Applications. [Google Scholar]
- Natalino, C.; Coelho, F.; Lacerda, G.; Braga, A.; Wosinska, L.; Monti, P. A proactive restoration strategy for optical cloud networks based on failure Predictions. In Proceedings of the 2018 20th International Conference on Transparent Optical Networks (ICTON), Bucharest, Romania, 1–5 July 2018; pp. 1–5. [Google Scholar] [CrossRef]
- ONF’s ODTN Project Brings Disaggregation and Open Source to Optical Networking. Available online: https://opennetworking.org/news-and-events/press-releases/onfs-odtn-project-brings-disaggregation-and-open-source-to-optical-networking/ (accessed on 11 November 2024).
- TELECOM INFRA PROJECT®. Available online: https://telecominfraproject.com/oopt/ (accessed on 11 November 2024).
- JANOG Meeting 24 January 2019. Available online: https://www.janog.gr.jp/meeting/janog43/application/files/7915/4823/1858/janog43-line-kobayashi.pdf (accessed on 11 November 2024). (In Japanese).
- Francia, G.; Nagase, R.; Ishida, W.; Sone, Y.; Kumar, L.; Krishnamohan, S.; Lopez, V. Disaggregated Packet Transponder field demonstration exercising multi-format transmission with multi-vendor, open packet optical network elements. In Proceedings of the Optical Fiber Communication Conference (OFC) 2020, OSA Technical Digest (Optica Publishing Group, 2020), San Diego, CA, USA, 8–12 March 2020. Paper Th3A.1 2020. [Google Scholar] [CrossRef]
- Mata, J.; Miguel, I.; Durán, R.J.; Merayo, M.; Singh, K.S.; Jukan, A.; Chamania, M. Artificial intelligence (AI) methods in optical networks: A comprehensive survey. Opt. Switch. Netw. 2018, 28, 43–57. [Google Scholar] [CrossRef]
- Rafique, D.; Velasco, L. Machine learning for network automation: Overview, architecture, and applications. J. Opt. Commun. Netw. 2018, 10, D126–D142. [Google Scholar] [CrossRef]
- Yan, S.; Aguado, A.; Ou, Y.; Wang, R.; Nejabati, R.; Simeonidou, D. Multi-layer network analytics with SDN-based monitoring framework. J. Opt. Commun. Netw. 2017, 9, A271–A279. [Google Scholar] [CrossRef]
- Meng, F.; Ou, Y.; Yan, S.; Nejabati, R. Field trial of a novel SDN enabled network restoration utilizing in-depth optical performance monitoring assisted net-work re-planning. In Proceedings of the Optical Fiber Communication Conference (OFC), OSA Technical Digest (Optica Publishing Group, 2019), San Diego, CA, USA, 3–7 March 2019. Paper Tu2E.4 2019. [Google Scholar] [CrossRef]
- Yan, S.; Khan, N.K.; Mavromatis, A.; Gkounis, D. Field trial of machine learning assisted and SDN- based optical network planning with network-scale monitoring Database. In Proceedings of the 2017 European Conference on Optical Communication (ECOC), Gothenburg, Sweden, 17–21 September 2017. PDP Th.PDP. B.4 2017. [Google Scholar] [CrossRef]
- Yoshioka, T.; Nishijima, S.; Nishikawa, Y.; Hirano, A. Demonstration of Autonomous Fault Diagnosis by Real-time Monitoring of Digital Coherent Optical Signals. In Proceedings of the 2023 International Conference on Optical Network Design and Modeling (ONDM), Coimbra, Portugal, 8–11 May 2023. [Google Scholar] [CrossRef]
- Shukla, D.; Singh, R. A Study and Review on Link Failure Prediction and Detection in Mobile Ad hoc Network. In Proceedings of the 2022 3rd International Conference on Issues and Challenges in Intelligent Computing Techniques (ICICT), Ghaziabad, India, 11–12 November 2022; pp. 1–7. [Google Scholar] [CrossRef]
- Choi, M.; Kim, T.; Lee, J.; Koh, S. An Empirical Study on Root Cause Analysis and Prediction of Network Failure Using Deep Learning. In Proceedings of the 2021 International Conference on Information and Communication Technology Convergence (ICTC), Jeju Island, Republic of Korea, 20–22 October 2021; pp. 741–746. [Google Scholar] [CrossRef]
- Rzayeva, L.; Myrzatay, A.; Abitova, G.; Sarinova, A.; Kulniyazova, K.; Saoud, B.; Shayea, S. Enhancing LAN Failure Predictions with Decision Trees and SVMs: Methodology and Implementation. Electronics 2023, 12, 3950. [Google Scholar] [CrossRef]
- Cruzes, S. Failure Management Overview in Optical Networks. IEEE Access 2024, 12, 169170–169193. [Google Scholar] [CrossRef]
- Mello, D. Digital Coherent Optical Systems: Architecture and Algorithms; Springer International Publishing: Cham, Switzerland, 2021. [Google Scholar]
- Radford, A.; Metz, L.; Chintala, S. Unsupervised representation learning with deep convolutional generative adversarial networks. arXiv 2015, arXiv:1511.06434. [Google Scholar]
- Naito, T.; Nishijima, S.; Nishikawa, Y.; Hirano, A. GAN-Supported Data Augmentation in Real-time Optical Filter Shift Detection. In Proceedings of the 2024 29th OptoElectronics and Communications Conference (OECC), Melbourne, Australia, 30 June–4 July 2024. [Google Scholar]
- Shariati, B.; Ruiz, M.; Comellas, J.; Velasco, L. Learning from the Optical Spectrum: Failure Detection and Identification. J. Light. Technol. 2019, 37, 433–440. [Google Scholar] [CrossRef]
- Tanimura, T.; Hoshida, T.; Rasmussen, J.C.; Suzuki, M.; Morikawa, H. OSNR monitoring by deep neural networks trained with asynchronously sampled data. In Proceedings of the 2016 21st OptoElectronics and Communications Conference (OECC) Held Jointly with 2016 International Conference on Photonics in Switching (PS), Niigata, Japan, 3–7 July 2016; pp. 1–3. [Google Scholar]
- Nishikawa, Y.; Nishijima, S.; Hirano, A. Real-Time Detection of Fiber Bending and/or Optical Filter Shift by Machine-Learning of Tapped Raw Digital Coherent Optical Signals. IEICE Trans. Commun. 2023, E106, 1065–1073. [Google Scholar] [CrossRef]
- Nishizawa, H.; Ishida, W.; Sone, Y.; Tanaka, T.; Kuwabara, S.; Inui, T.; Sasai, T.; Tomizawa, M. Open WhiteBox architecture for smart integration of optical networking and data center technology [Invited]. J. Opt. Commun. Netw. 2021, 13, A78–A87. [Google Scholar] [CrossRef]
- Onodera, M.; Hirano, A. Real-Time Detection of Optical Cross-Talk for Autonomous Network Diagnosis. In Proceedings of the 2024 International Conference on Computing, Networking and Communications (ICNC), Big Island, HI, USA, 19–22 February 2024; pp. 249–253. [Google Scholar] [CrossRef]
- Goodfellow, L.; Pouget-Abadie, J.; Mirza, M.; Xu, B.; Warde-Farley, D.; Ozair, S.; Courville, A.; Bengio, Y. Generative Adversarial Nets. Adv. Neural Inf. Process. Syst. 2014, 63, 139–144. [Google Scholar] [CrossRef]
- CFP2 ACO (Analog Coherent Optics). Available online: https://www.fujitsu.com/jp/group/foc/products/coherent-modules/cfp2-aco/indexgig5.html (accessed on 24 November 2024). (In Japanese).
- Huang, G.; Liu, Z.; Maaten, L.; Weinberger, K.Q. Densely connected convolutional networks. In Proceedings of the 2017 IEEE Conference on Computer Vision and Pattern Recognition (CVPR), Honolulu, HI, USA, 21–26 July 2017; pp. 2261–2269. [Google Scholar] [CrossRef]
Disclaimer/Publisher’s Note: The statements, opinions and data contained in all publications are solely those of the individual author(s) and contributor(s) and not of MDPI and/or the editor(s). MDPI and/or the editor(s) disclaim responsibility for any injury to people or property resulting from any ideas, methods, instructions or products referred to in the content. |
© 2025 by the authors. Licensee MDPI, Basel, Switzerland. This article is an open access article distributed under the terms and conditions of the Creative Commons Attribution (CC BY) license (https://creativecommons.org/licenses/by/4.0/).