Featured Application
The carbon fiber-reinforced plastic thin-walled cylinders are lightweight and highly stiff, making them suitable for application in rockets and aircraft fuselages.
Abstract
Thin-walled cylinders made from carbon fiber-reinforced plastic (CFRP) were measured using a laser displacement sensor and subjected to load tests. The effects of shape imperfections in the circumferential and axial directions, the radius–thickness ratio (r/t), and the offset compression loads on the knockdown factor (KDF), which is the ratio of the experimental and theoretical buckling loads, were investigated. A statistical evaluation of various trends relating to the KDF and the amplitudes of the shape imperfections was conducted. The buckling load test on the cylinders showed large deviations and scatter between theory and experiment. It is known that shape imperfections are one of the key factors affecting KDF. The shape imperfection induces a local stress concentration and/or local buckling, and they may induce premature buckling. We found a correlation between the KDF and shape imperfections in the circumferential and axial directions and r/t. The KDF did not have a simple correlation with the direction of offset compression loads, the direction of the maximum and minimum amplitude of local shape imperfections, or offset distance.
1. Introduction
Since the research on the buckling load of thin-walled cylinders began in 1947 [1], this topic has been studied for 60 years. However, we still do not know the effect of the scatter and deviation of the buckling load between theory and experiment. Hilburger measured shape imperfections in cylinders and found that a nonlinear finite element analysis gave results that were 5–10% larger than the experimental buckling loads [2]. It is necessary to measure the shape imperfections using this method before production; however, this method cannot be used for prediction. B. Kriegesmann employed FEM to investigate the probabilistic design of axially compressed composite cylinders with geometric and loading imperfections but did not explore the relationship between KDF and shape imperfections [3]. H.N.R. Wagner investigated the influence of cylinder length (L) on KDF [4]. D. Y. Kim investigated the effect of r/t and L/r on KDF using FEM [5]. X. X. Zheng conducted buckling analysis of thin-walled cylinder structures and structural improvements using FEM [6]. S. Toda investigated the buckling of cylinders with cutouts under axial compression [7].
Most of the research on buckling of thin-walled cylinders has focused on FEM, with relatively few physical experiments conducted. This paper summarizes previous physical experiments and adds a significant number of experiments conducted by the authors to explore the buckling strength of CFRP cylinders. Through this, we hope to discover some patterns. There have been many investigations on the buckling load of thin-walled cylinders made from carbon fiber-reinforced plastic (CFRP) [8,9,10,11,12,13,14,15,16,17,18,19,20,21,22], the results of which are summarized in [23].
The buckling tests in these previous studies were conducted on cylinders with radius–thickness ratios up to r/t (radius–thickness ratio) = 893, and the relationship between buckling load and the knockdown factor (KDF = experimental value/theoretical value) was investigated [24]. Figure 1 summarizes the KDFs of thin-walled cylinders determined therein. Note that only two r/t = 893 data were obtained; thus, more tests will be required to make conclusions on those data.
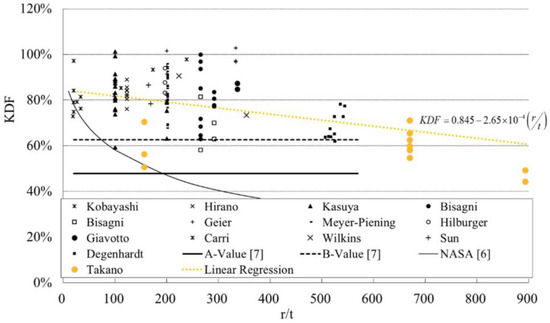
Figure 1.
KDF values of CFRP thin-walled cylinders for a large range of r/t [24].
Regression analyses further showed that various factors, including layup overlaps or gaps, the r/t, the L/r (length–radius ratio), layup stiffness, and oval shape imperfection, are not statistically significant [25].
Buckling tests with the cylinders under the offset between the center of the compression load and the center of the cylinder showed that the decrease in KDF is not directly correlated to the offset or amplitude of local directional-shape imperfections [24]. Still, since the offsets of 0°, 90°, 180°, and 270° did not correspond to the maximum (or minimum) amplitudes of the local shape imperfections, more tests need to be conducted to confirm these findings.
Furthermore, it was found that the KDF decreases when the amplitude of pentagonal imperfections increases. But when this information was added to the other data and analyzed, the tendency for the KDF to decrease when the amplitude of pentagonal imperfections increased disappeared. The reason for the disappearance of this tendency is suspected to be that the KDF is a normalized value, whereas the amplitude of shape imperfections is not normalized. Hence, in the study reported below, the relationship between the KDF and out-plane shape imperfections normalized by the wall thickness was investigated. Nine CFRP cylindrical specimens with different wall thicknesses were made and tested to examine the relationship between the KDF and normalized out-plane shape imperfections.
2. Materials and Properties of Test Specimens
Nine cylindrical specimens were made from carbon fiber-reinforced plastic (CFRP) pre-preg HSX350C075S (HSX) and TR350J075SB42UWS (TR) (Mitsubishi Chemical Co. Ltd.). The material properties of CFRP pre-preg HSX350C075S are listed in Table 1, and those of CFRP pre-preg TR350J075SB42UWS are listed in Table 2. The configurations of the 17 specimens are shown in Table 3.

Table 1.
Material properties of HSX350C075S carbon fiber-reinforced plastic (CFRP).
Table 2.
Material properties of TR350J075SB42UWS carbon fiber-reinforced plastic (CFRP).
Table 3.
Configuration of cylindrical specimens. (L/r: length–radius ratio and r/t: radius–thickness ratio.)
When making the cylindrical specimens, the CFRP cylinder is fitted into the groove of the aluminum ring and secured with adhesive. The width of the groove is larger than the thickness of the CFRP cylinder, and shape imperfections occur naturally. Therefore, although the configurations of cylindrical specimens of No. 191, No. 192, No. 201, No. 202, and No. 203 are the same, the shape imperfections in each cylinder specimen are different. The same applies to No. 204 and No. 205, as well as No. 206 and No. 207.
The manufacturing process of the CFRP cylinders is provided in reference [24]. Fiber orientation error and residual thermal stress that depend on the manufacturing process and uniformity of load distribution that depends on the test jig are provided in reference [25].
3. Equipment for Measuring Shape Imperfections
We measured the shapes of the CFRP thin-walled cylinders with the measurement equipment shown in Figure 2, which consisted of a rotary table, a laser displacement sensor (LDS), and two stepping motors. The measurements and movements of the equipment were controlled with a laptop computer—the major specifications are shown in Table 4. The specimens were placed on the rotary table, and data were measured at ten heights (along the length direction of the cylinder) at 6° increments. After 61 data points were measured at a particular height (one full rotation), the laser displacement sensor was raised, and the measurements were taken at the new height.
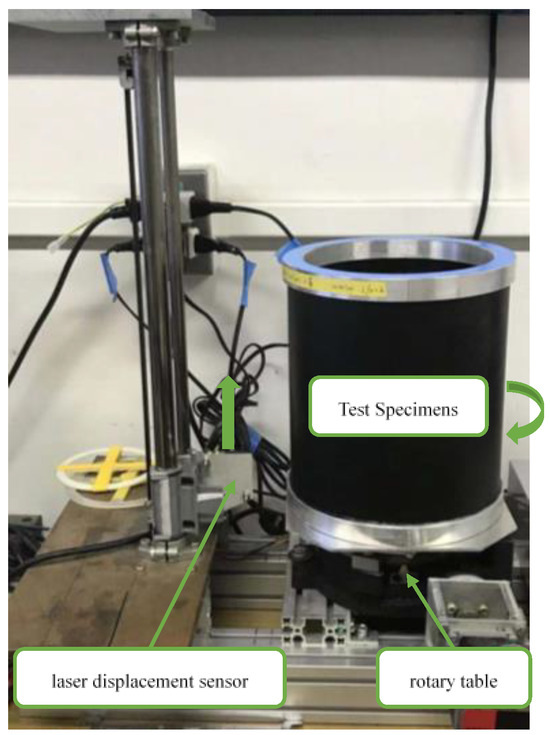
Figure 2.
Equipment for measuring shape imperfections (The arrows is the direction of movement and rotation.).
Table 4.
Specifications of equipment for measuring shape imperfections.
4. Buckling Test
We used a universal testing instrument (Shimadzu AGI 100kN, load accuracy within ±1% for an indicated value) for the buckling test. Figure 3 shows a steel ball (diameter 15 mm) and adjustment fixture utilized to achieve a uniform load. Before the buckling test, a small load (150 N) was applied to confirm the tilt of the stainless plate. Here, if the stainless plate tilts abnormally (in Figure 4, the θx or θy > 0.015 deg is abnormal), the plate and steel ball are adjusted until the abnormality disappears. This step ensures that the load is at the center of the stainless plate. Figure 4 shows the location of the four laser displacement sensors used to measure the tilt of the stainless plate. A crosshead displacement was applied until it reached 1.1 times the buckling displacement in the buckling test. Each CFRP thin-walled cylinder underwent nine tests; the order of tests is shown in Table 5. The first had no offset, the second had an offset of 0°, the third had an offset of 90°, the fourth had an offset of 180°, the fifth had an offset of 270°, the sixth and seventh tests had offsets at the maximum–minimum amplitude of the local shape imperfections, and the eighth and ninth tests had no offsets. Figure 5 is a sketch of the buckling load test. The experimental specimens of CFRP cylinders showed elastic deformation during the buckling test without material failure because of very thin walls. Also, the eighth and ninth buckling tests were consecutively conducted without any disturbance to the cylinder between them. Previous experimental results also indicate that repeated buckling has no effect on the strength of the CFRP cylinder [24].
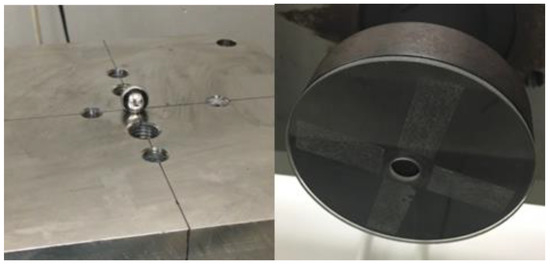
Figure 3.
Steel ball and adjustment fixture.
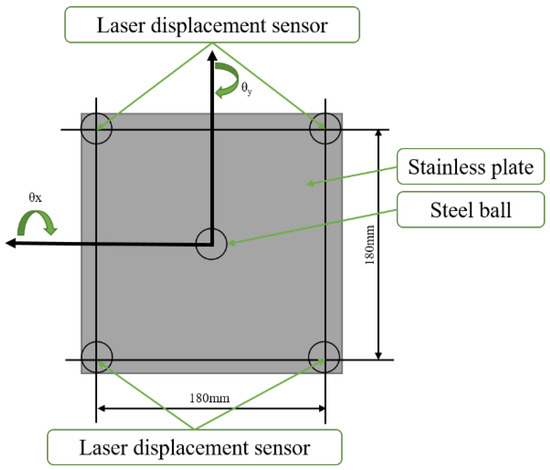
Figure 4.
Setup of measurement using four laser displacement sensors.
Table 5.
Offset directions in buckling test.
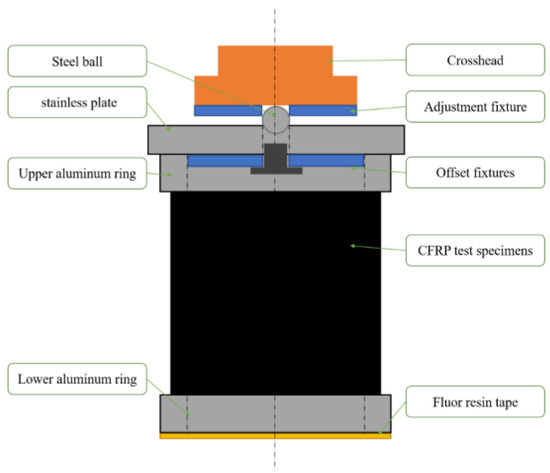
Figure 5.
Setup of the buckling load test.
In the no-offset testing, the alignment fixture was used; in the offset testing, an alignment fixture was also used. The fixture is shown in Figure 6. There were two different offset fixtures, one with δ/t = 14.6 and the other with δ/t = 7.3, where δ is the offset distance and t is 0.112 mm (cylinders with the thickness of HSX350C075S test specimens (Table 3)) [24]. Figure 7 shows a photograph of the equipment used in the buckling test. Figure 8 shows a buckling mode of cylindrical specimens No. 191.
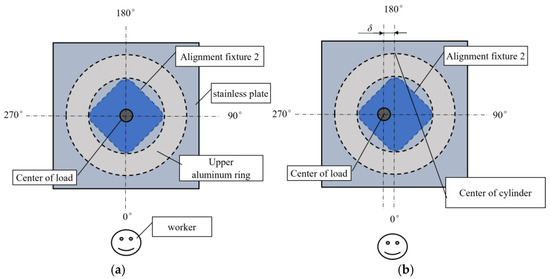
Figure 6.
(a) Test without offset; (b) test with 270° offset.
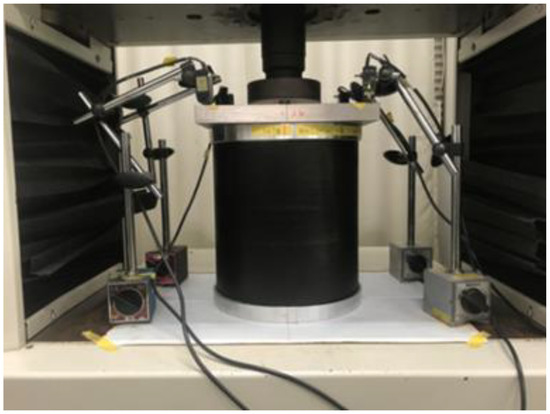
Figure 7.
Photograph of the buckling test.
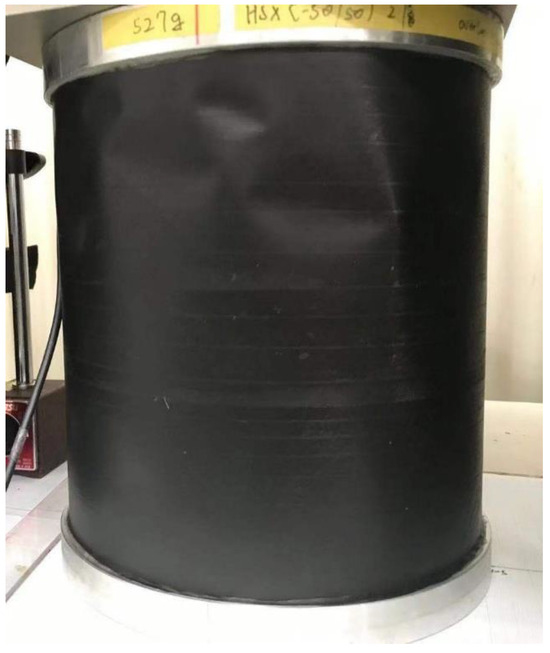
Figure 8.
Buckling mode (No. 191).
5. Test Results and Evaluation
The test specimens were observed after buckling occurred in the buckling test, and it was found that all the buckling modes were diamond type. The KDF of each test specimen is shown in Table 6. Note that although the number of specimens is 17, the number of rows in Table 6 is 27. For example, specimen number 191 was repeatedly tested at different offsets. Nos. 171–174 are cylindrical specimens with an intentionally introduced elliptical-shaped imperfection. N’ is a multiple of the thickness of the TR pre-preg. The length and radius of Nos. 171–174, which were manufactured in [25], and Nos. 12–20, which were manufactured in [25], are different from the other cylinders with L = 136 mm and L/r = 2.
Table 6.
KDF of each test specimen.
5.1. The Amplitude of Shape Imperfections in the Circumferential Direction
The types of defects in the CFRP cylinder include elastic modulus deviation, layup angle deviation, thickness deviation, ply gap and overlap, manufacturing-induced defects, and shape imperfection. This study focuses on shape imperfections because the shape imperfections are significant. The authors resolved the data measured by the shape-imperfection measurement equipment into the amplitude of diameter deflection w0, amplitude of rigid body movement w1, elliptic amplitude w2, triangles amplitude w3, etc., by performing a Fourier transformation (Equation (1)). Figure 9 illustrates the meanings of w0~w3. Because the diameter deflection w0 and amplitude of rigid body movement w1 uniformly along the axial direction are not circumferential imperfections, they are evaluated in Section 5.2 (Evaluation of Amplitude of Shape Imperfections in the Axial Direction).
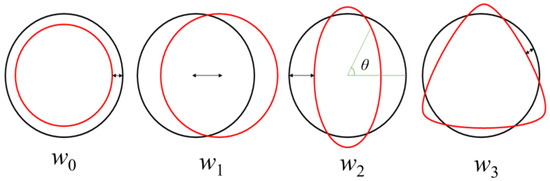
Figure 9.
Illustration of amplitudes w0~w3.
: index of axial direction : angle in circumferential direction
: amplitude in wave numbers
: coefficient for the sine part
: coefficient for the cosine part
The terms in Equation (1) are determined using Equations (2) and (3), where hk,j are the raw data obtained by the measurement equipment at a particular circumferential position k and elevation (lengthwise) position j.
with being the measured values at circumferential position k and elevation position j.
: index of circumferential direction
Here, each amplitude wn is determined using Equation (4).
with
: angle in circumferential direction
: index of circumferential direction
To obtain the KDF, it is necessary to investigate the theoretical formula. It is thought that the anisotropy of the laminate and the deformation of out-plane shear have led to complex stress/multidimensional stress states. The buckling load of the cylindrical shell is calculated using a theoretical formula that takes into account anisotropy of the laminate and deformation of out-plane shear. This method is based on the deformation of out-plane shear, first-order shear theory, and anisotropic elasticity, including coupling of laminate tensile–shear, bending–torsion, and tension–torsion (bending–shear). It has the fewest approximations among the linear buckling theories and is known to agree well with experimental results [23]. However, it assumes that the shape of the cylindrical shell is ideal and that the radius and thickness are constant regardless of the measurement location. Because the theoretical formula has a huge equation, it is difficult to present in this paper. The complete formula is shown in [26].
Because the KDF on the y-axis is a dimensionless quantity, the amplitudes are divided by t to make the transformation dimensionless. It is necessary to evaluate w2/t–w10/t simultaneously by multiple regression analysis. The relationships between the KDF and the graphed amplitudes w2–w10, together with linear regression lines, KDF = a(wn/t) + KDF0, are shown in Figure 10. The linear analysis of Figure 10a–i is simple linear regression analysis. These linear regressions are used as a reference for showing tendency.
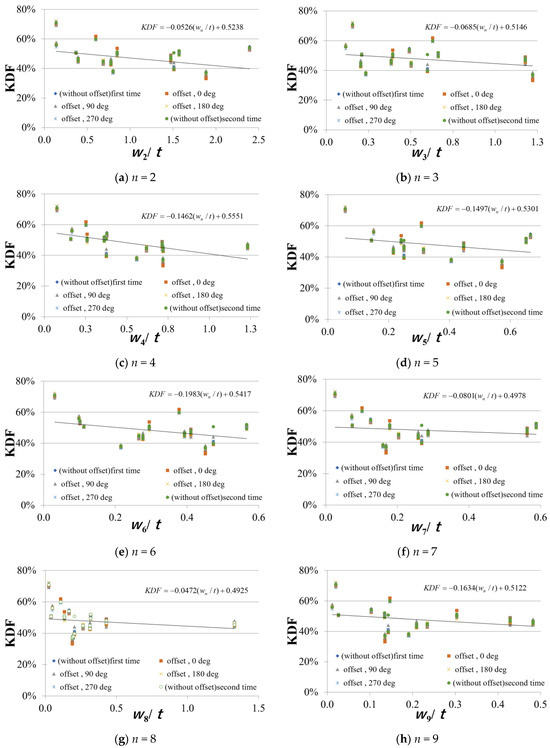
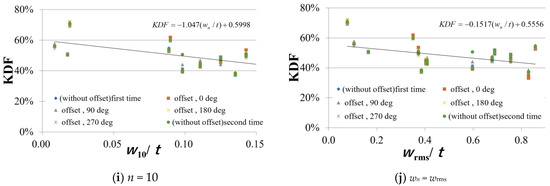
Figure 10.
KDF versus w2/t–w10/t and wrms/t.
Here, wrms in panel (j) is the amplitude of shape imperfections, i.e.,
with
: each amplitude
As a result, we see the correlation between w2/t and wrms/t and KDF from Figure 10. When the dimensionless shape imperfections, i.e., the amplitude of the shape imperfections divided by t increases in value, the KDF decreases. In other words, the KDF decreases as the shape imperfections become larger. The intercepts of the linear regression lines, KDF0, obtained by the least square method are all between 0.5 and 0.65. This means KDF0, i.e., the KDF, is between 50 and 65% even when there are no shape imperfections in the circumferential direction. For the KDF, it is between 50 and 65%, a possible cause could be the variation in the thickness of the cylinder.
The relationship between KDF, shape imperfection, and offset was investigated through ANOVA (analysis of variance) and multiple regression analysis (Equation (6)). Qualitative variables with offset were represented by dummy variables (0 or 1).
with
: slope of wn/t (n = 2–10)
: amplitude in wave numbers
:
: deg of offset
Since the CFRP cylinders were offset during the buckling tests, the data with offsets at each angle should be considered as being distinct from the data without offsets. Additionally, due to the point load, the first and second tests of no offsets were not applied to the exact same location. This ensured the independence of the data. Since the second and third tests of no offsets were continuous compressive static tests, the third test of no offsets was not included in the ANOVA. wrms/t includes w2/t to w10/t, so wrms/t was investigated separately.
The p-value represents the probability that the data fit the regression equation by coincidence. When the p-value is small, it indicates that the occurrence of such randomness is unlikely, and the regression equation is of significance. A p-value below 5% is statistically significant, and a p-value below 1% indicates high statistical significance. Small p-values are hoped for to prove hypotheses with limited amounts of data [27].
In Table 7, the p-value of wrms/t is 5.85 × 10−09, which is much smaller than 1%, indicating high statistical significance. The p-values of the offsets are larger than 5%, indicating no statistical significance. The slope (a) of wrms/t is −0.166. This result was obtained using simple linear regression analysis.
Table 7.
p-value of regression analyses of wrms/t.
Table 8 shows the results of multiple regression analyses of w2/t–w10/t. Here, the p-values of w4/t, w6/t, and w8/t are extremely small, and the slope (a) is too large. For example, when wi/t changes, KDF approaches 0. The w8/t of slope (a) is 0.308, and the slope (a) (range of w8/t) . Furthermore, the KDF is , which is greater than 100%. Regarding the cause, since each variable affects one another, it can be speculated that multi-collinearity exists with w2/t–w10/t. The multi-collinearity is the occurrence of high intercorrelations among two or more independent variables in a multiple regression model.
Table 8.
p-value of regression analyses.
The p-value of offsets are larger than 5%, indicating no statistical significance.
The multi-collinearity was investigated by variance inflation factors (VIFs) using Equation (7). Rj2 is the square of the multiple correlation coefficient that results when the predictor variable is regressed against all the other predictor variables [28].
The results of the VIFs are shown in Table 9 (first column). A VIF greater than 10 is often considered a signal that the data have collinearity problems [28]. For example, the amplitudes of w5/t have a high correlation with other amplitudes of w2–w4 and w6–w10. The VIF was recalculated after excluding w5, w6, w8, and w9, and the results are shown in Table 9 (second column). The VIFs smaller than 10 were investigated through ANOVA. The results are shown in Table 10.
Table 9.
Variance inflation factors.
Table 10.
p-value of regression analyses.
The p-values of w2/t, w4/t, w7/t, and w10/t are much smaller than 1%, indicating high statistical significance. The p-value of w3/t is larger than 5%, indicating no statistical significance.
The analysis of the KDF was conducted considering the range of wn/t, as shown in Table 11. Regarding the slope (a), w2/t, w4/t, and w10/t are negative, i.e., these shape imperfections reduce the buckling load; w7/t has the opposite effect. When , the KDF is 0.618. When , the KDF is 0.693. Thus, w7/t has a small effect on improving the KDF.
Table 11.
p-value of regression analyses.
5.2. Evaluation of the Amplitude of Shape Imperfections in the Axial Direction
After the Fourier transform in the circumferential direction (Equation (1)), ten values each of the (diameter expansion and contraction on the elevation position j), , and (rigid body movement at elevation position j) in the axial direction were Fourier transformed using Equations (8)–(10).
with
Zj: j -th in the axial direction .
l: cylinder length.
WR,n,j: coefficient of the real part of the second Fourier transform.
WI,n,j: coefficient of the imaginary part of the second Fourier transform.
The coefficients of Equations (9)–(11), coefficients bR,n,p, bI,n,p, cR,n,p, and cI,n,p, can be obtained by Equations (11)–(14); substitute the numerical value from Equations (2) and (3) into wR,n,j and wI,n,j in Equations (10)–(13).
with
: coefficient of the real part of circumferential-direction Fourier transform at each height.
: coefficient of the imaginary part of circumferential-direction Fourier transform at each height.
The shape of the cylinder in the axial direction is obtained after the second Fourier transform (Figure 11). Because the KDF on the y-axis is a dimensionless quantity, the Fourier coefficients for each shape are divided by t in order to make the transformation dimensionless.
Figure 11.
Imperfections in the shape of the thin-walled cylinder in the axial direction.
In this figure, the shapes 4 and 5 are both related to bI,0,1, i.e., the drum shape appears when bI,0,1 > 0, while the barrel shape appears when bI,0,1 < 0.
The relationship between the KDF and shape imperfections 1 to 5 are shown in Figure 12. Here, there are correlations between the KDF and shapes 1, 2, 3, and 4, wherein the KDF decreases as the dimensionless values of the Fourier coefficients of shapes 1 and 3 divided by t increase, while that of shapes 2 and 4 decreases. In other words, shapes 2 and 4 increase the buckling load. The dimensionless value in the case of shape 5 tended to fall slightly. The intercepts of the linear regression KDF0 values or KDF were between 45 and 60%.
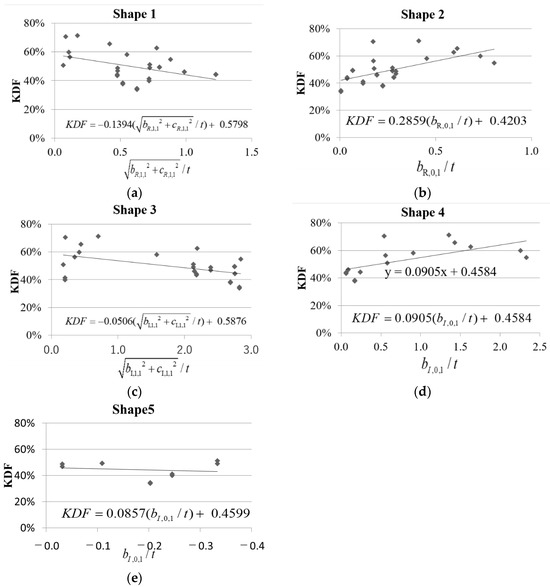
Figure 12.
KDF versus the shape in the axial direction of (a) shape 1; (b) shape 2; (c) shape 3; (d) shape 4; and (e) shape 5.
The results of the multiple regression analyses and the p-values obtained by ANOVA are shown in Table 12 (Equation (15)). Here, shape 4 and shape 5 were combined for ANOVA and multiple regression analysis.
Table 12.
p-value of regression analyses.
The p-values of shape 1 are smaller than 5%, indicating statistical significance. The p-value of shape 3 is much smaller than 1%, indicating high statistical significance. The slopes (a) of shapes 1 and 3 are all negative; these shape imperfections lower the buckling load. The p-values of shape 2 and shapes 4 and 5 are over 5%, indicating statistical insignificance. The shape imperfections of shape 2 and shapes 4 and 5 have no effect on the buckling load. The p-values of offsets are larger than 5%, indicating no statistical significance.
5.3. Effect on KDF by Relationship Between Load Offset and Direction of Maximum (−Minimum) Amplitude of Local Shape Imperfections
The local shape imperfections of the out-plane leading to a decrease in KDF were predicted. In particular, when axial compressive load is concentrated at locations of large local shape imperfections in the out-plane deformation, the buckling load was assumed to decrease. Thus, to confirm the shape imperfections of the cylinder, we made plots using Equations (16) and (17).
Figure 13 shows the plot for cylinder No. 191. The maximum (−minimum) amplitude of local directional-shape imperfections can be identified in this plot. Note that the shape imperfections in the figure have been enlarged by Q = 30 times.
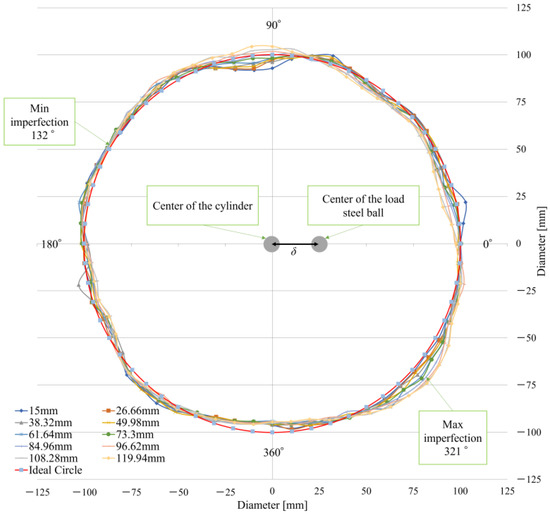
Figure 13.
Plot of shape imperfections of cylinder No. 191 (0° offset).
Figure 14 shows the relationship between the KDF and offset angle for the various specimens. The offset angles in this case are 0°, 90°, 180°, and 270°, and the shape imperfections are the maximum and minimum values. As shown, the KDF values have some scatter. The offset direction and distance both affect the KDF, i.e., the KDF does not have a simple correlation with offset direction, shape imperfections, or offset distance. This conclusion is consistent with the ANOVA.
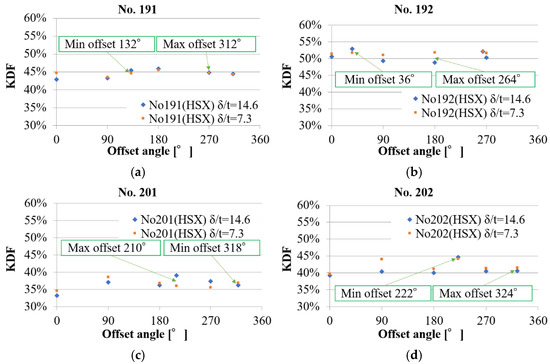
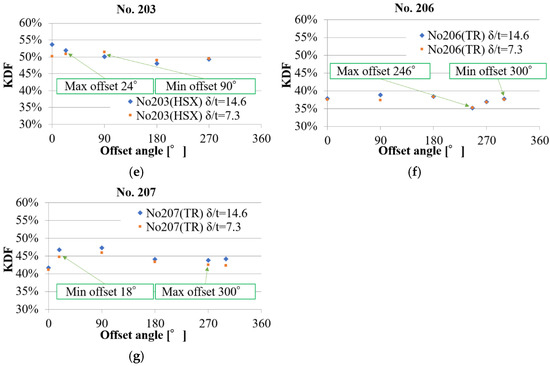
Figure 14.
KDF versus offset angle for various cylinders of: (a) No. 191; (b) No. 192; (c) No. 201; (d) No. 202; (e) No. 203; (f) No. 206; and (g) No. 207.
5.4. Evaluation of the Relationship Between KDF and r/t
The relationship between KDF and r/t obtained from past experiments by the authors of [24] and the publicly available paper [23] is shown in Figure 15. The dates are added in the green circles on r/t = 615 (No. 206 and No. 207 in Table 6, no offset) and r/t = 893 (No. 191–205 in Table 6, no offset). As the diagram indicates, the KDF decreases as r/t increases, and an inclination of the lower right is evident. The coefficient of r/t is −2 × 10⁻⁴. It seems small, but the p-value is 2.03 × 10⁻¹⁵, which is much smaller than 1% and indicates very high statistical significance. The KDFs scatter across both sides of the line; thus, this line cannot be used for prediction. This conclusion is consistent with previous studies. Compared with the results of previous studies [24], the data for r/t = 670 have decreased. This is because the test specimens for r/t = 670 incorporated large elliptical shape imperfections on purpose. These test specimens were excluded from further analyses because large elliptical shape imperfections may degrade the buckling load.
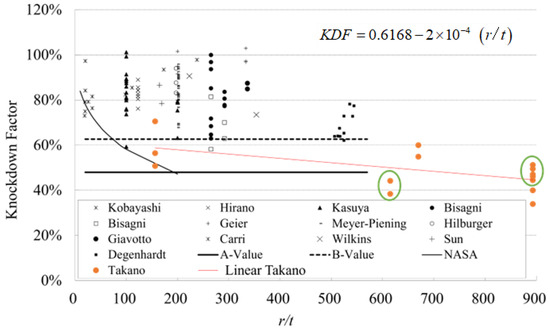
Figure 15.
KDF versus r/t. (The references for each data are by Kobayashi [8], Hirano [9], Kasuya [10], Hilburger [2], Bisagni [11], Bisagni [12], Geier [13], Meyer-Piening [14], Herakovich [15], Giavotto [16], Carri [17], Wilkins [18], Waters [19], Tennyson [20], Sun [21], Degenhardt [22], and Takano [24]).
6. Conclusions
For the circumferential direction, KDF decreases as the shape imperfections increase in amplitude. The intercepts of the linear regression KDF0 obtained by the least squares method all lie between 50 and 65%. Namely, the KDF is 50–65% even when there are no shape imperfections in the circumferential direction. A possible cause could be the variation in thickness of the cylinder. This issue will be considered in the future. The simple linear regression analysis for wrms/t indicated with high statistical significance that wrms/t can lower the buckling load. The ANOVA indicated high statistical significance; in particular, results for w2/t–w10/t indicate that w7/t has a small effect on improving the KDF.
Regarding the axis direction, KDF decreases as the dimensionless values of the Fourier coefficients of shapes 1 and 3 increase. On the other hand, they increase as dimensionless values for shapes 2 and 4 decrease, i.e., the shape imperfections of shapes 2 and 4 enhance the buckling load. The p-values for shapes 1, 2, 3, and 4 are all smaller than 5%, indicating statistical significance. The p-value of shape 1 is smaller than 5%, indicating statistical significance. The p-value of shape 3 is much smaller than 1%, indicating high statistical significance. The p-values of shapes 2, 4, and 5 are over 5%, indicating statistical insignificance.
The offset direction and offset distance both affect the KDF, i.e., the KDF does not have a simple correlation with offset direction, shape imperfections, or offset distance. This conclusion is consistent with the ANOVA.
In the evaluation of the relationship between KDF and r/t, it is evident that the KDF decreases as the r/t ratio increases. The KDFs scatter across both sides of the line; thus, this linearity cannot be used for prediction. This conclusion is consistent with previous studies [22]. Data with a KDF below 40% were obtained for r/t values between 500 and 900; this should be considered when using the buckling load. But this linearity cannot be directly used in the design.
This paper can be used for designing CFRP cylinders with FEM and can also provide references for designing thin-walled cylindrical structures. When r/t > 500, a KDF of 50% or less should be considered when calculating the buckling load of thin-walled cylinders. For example, it can be used to design the rocket body of an ultra-compact hybrid rocket [29].
Author Contributions
Conceptualization, A.T.; methodology, A.T.; software, A.T. and J.B.; validation, A.T. and J.B.; formal analysis, A.T. and J.B.; data curation, J.B.; investigation, J.B.; writing—original draft preparation, J.B.; writing—review and editing, R.K. and T.M. All authors have read and agreed to the published version of the manuscript.
Funding
This work was supported by JKA and its promotion funds from KEIRIN RACE.
Institutional Review Board Statement
Not applicable.
Informed Consent Statement
Not applicable.
Data Availability Statement
The data presented in this study are available on request from the corresponding author.
Conflicts of Interest
The authors declare no conflicts of interest.
References
- Batdorf, S.B. A Simplified Method of Elastic-Stability Analysis for Thin Cylindrical Shells; Technical Note. No. 1341.; National Advisory Committee for Aeronautics: Hampton, VA, USA, 1947. [Google Scholar]
- Hilburger, M.W.; Nemeth, M.P.; Starnes, J.H., Jr. Shell Buckling Design Criteria Based on Manufacturing Imperfection Signatures. AIAA J. 1999, 37, 276–278. [Google Scholar]
- Kriegesmann, B.; Rolfes, R.; Hühne, C.; Teßmer, J.; Arbocz, J. Probabilistic design of axially compressed composite cylinders with geometric and loading imperfections. Int. J. Struct. Stab. Dyn. 2010, 10, 623–644. [Google Scholar] [CrossRef]
- Wagner, H.N.R.; Hühne, C.; Niemann, S.; Khakimova, R. Robust design criterion for axially loaded cylindrical shells—Simulation and Validation. Thin-Walled Struct. 2017, 115, 154–162. [Google Scholar] [CrossRef]
- Kim, D.-Y.; Sim, C.-H.; Park, J.-S.; Yoo, J.-T.; Yoon, Y.-H.; Lee, K. Buckling Knockdown Factors of Composite Cylinders under Both Compression and Internal Pressure. Aerospace 2021, 8, 346. [Google Scholar] [CrossRef]
- Zheng, X.; Zou, Y.; He, B.; Xiang, J.; Li, Z.; Yang, Q. Buckling Analysis and Structure Improvement for the Afterburner Cylinder of an Aero-Engine. Aerospace 2023, 10, 484. [Google Scholar] [CrossRef]
- Toda, S. Buckling of cylinders with cutouts under axial compression. Exp. Mech. 1983, 23, 414–417. [Google Scholar] [CrossRef]
- Kobayashi, S.; Seko, H.; Koyama, K. Compressive Buckling of CFRP Circular Cylindrical Shells Part I. Theoretical Analysis and Experiment. Aeronaut. Space Sci. Jpn. 1984, 32, 111–121. (In Japanese) [Google Scholar]
- Hirano, Y. Optimization of Laminated Composite Cylindrical Shells for Axial Buckling. Aeronaut. Space Sci. Jpn. 1984, 32, 46–51. (In Japanese) [Google Scholar]
- Kasuya, H.; Uemura, M. Coupling Effect on Axial Compressive Buckling of Laminated Composite Cylindrical Shells. Aeronaut. Space Sci. Jpn. 1982, 30, 664–675. (In Japanese) [Google Scholar]
- Bisagni, C. Experimental Buckling of Thin Composite Cylinders in Compression. AIAA J. 1999, 37, 276–278. [Google Scholar] [CrossRef]
- Bisagni, C.; Cordisco, P. An Experimental Investigation into the Buckling and Post-Buckling of CFRP Shells under Combined Axial and Torsion Loading. Compos. Struct. 2003, 60, 391–402. [Google Scholar] [CrossRef]
- Geier, B.; Klein, H.; Zimmermann, R. Buckling Tests with Axially Compressed Unstiffened Cylindrical Shells Made from CFRP. In Buckling of Shell Structures, on Land, in the Sea and in the Air; Jullien, J.F., Ed.; Elsevier Applied Science: London, UK, 1991; pp. 498–507. [Google Scholar]
- Meyer-Piening, H.R.; Farshad, M.; Geier, B.; Zimmermann, R. Buckling Loads of CFRP Composite Cylinders under Combined Axial and Torsion Loading—Experiments and Computations. Compos. Struct. 2001, 53, 427–435. [Google Scholar] [CrossRef]
- Herakovich, C.T. Theoretical–Experimental Correlation for Buckling of Composite Cylinders Under Combined Compression and Torsion; NASA Technical Reports, NASA-CR-157358; NASA: Washington, DC, USA, 1978. [Google Scholar]
- Giavotto, V.; Poggi, C.; Chryssanthopoulos, M.; Dowling, P. Buckling Behaviour of Composite Shells under Combined Loading. In Buckling of Shell Structures, on Land, in the Sea and in the Air; Jullien, J.F., Ed.; Elsevier Applied Science: London, UK, 1991; pp. 53–60. [Google Scholar]
- Carri, R.L. Buckling Behavior of Composite Cylinders Subjected to Compressive Loading; NASA Technical Reports, NASA CR-132264; NASA: Washington, DC, USA, 1973. [Google Scholar]
- Wilkins, D.J.; Love, T.S. Combined Compression-Torsion Buckling Tests of Laminated Composite Cylindrical Shells. J. Aircr. 1975, 12, 885–889. [Google Scholar] [CrossRef]
- Waters, W.A., Jr. Effects of Initial Geometric Imperfections on the Behavior of Graphite-Epoxy Cylinders Loaded in Compression. Master’s Thesis, in Engineering Mechanics. Old Dominion Univ., Norfolk, VA, USA, 1996. [Google Scholar]
- Tennyson, R.C.; Hansen, J.S. Optimum Design for Buckling of Laminated Cylinders, Collapse: The Buckling of Structures in Theory and Practice; Cambridge University Press: Cambridge, NY, USA, 1983. [Google Scholar]
- Sun, G. Optimization of Laminated Cylinders for Buckling; UTIAS Report No. 317; Institute for Aerospace Studies, University of Toronto: North York, ON, Canada, 1987. [Google Scholar]
- Degenhardt, R.; Kling, A.; Bethge, A.; Orf, J.; Kärger, L.; Zimmermann, R.; Rohwer, K.; Calvi, A. Investigations on Imperfection Sensitivity and Deduction of Improved Knock-down Factors for Unstiffened CFRP Cylindrical Shells. Compos. Struct. 2010, 92, 1939–1946. [Google Scholar] [CrossRef]
- Takano, A. Statistical Knockdown Factors of Buckling Anisotropic Cylinders under Axial Compression. J. Appl. Mech. 2012, 79, 051004. [Google Scholar] [CrossRef]
- Takano, A.; Kitamura, R.; Masai, T.; Bao, J. Buckling Test of Composite Cylindrical Shells with Large Radius Thickness Ratio. Appl. Sci. 2021, 11, 854. [Google Scholar] [CrossRef]
- Takano, A. Buckling Test of CFRP Cylindrical Shells under Compression Load. J. Jpn. Soc. Aeronaut. Space Sci. 2018, 66, 98–111. (In Japanese) [Google Scholar] [CrossRef]
- Takano, A. Simple Closed-Form Solution for the Buckling of Moderately Thick Anisotropic Cylinders. Aerospace Technol. Jpn. 2012, 10, 17–26. [Google Scholar] [CrossRef]
- Allen, T.T. Introduction to Engineering Statistics and Lean Sigma, Statistical Quality Control and Design of Experiments and Systems, 2nd ed.; Springer: Berlin/Heidelberg, Germany; pp. 261–264.
- Chatterjee, S. Regression Analysis by Example; John Wiley & Sons, Inc.: Hoboken, NJ, USA, 2006; pp. 248–251. [Google Scholar]
- Takano, A.; Ganaha, N.; Yoshino, K.; Ou, M.; Sugimoto, Y.; Sakiyama, H.; Hiyama, K.; Fukushima, Y.; You, L.; Tada, H.; et al. Launch result of a hybrid rocket toward an altitude of 15 km. In Proceedings of the Space Engineering Conference, the Japan Society of Mechanical Engineers, Kyoto, Japan, 9–11 June 2022. [Google Scholar]
Disclaimer/Publisher’s Note: The statements, opinions and data contained in all publications are solely those of the individual author(s) and contributor(s) and not of MDPI and/or the editor(s). MDPI and/or the editor(s) disclaim responsibility for any injury to people or property resulting from any ideas, methods, instructions or products referred to in the content. |
© 2025 by the authors. Licensee MDPI, Basel, Switzerland. This article is an open access article distributed under the terms and conditions of the Creative Commons Attribution (CC BY) license (https://creativecommons.org/licenses/by/4.0/).