Abstract
Traditional disease detection methods typically depend on visual assessments conducted by human experts, which are time-consuming and subjective. Thus, there is an urgent demand for automated and efficient approaches to accurately detect and classify tea diseases. This study presents an enhanced Real-Time Detection Transformer (RT-DETR), tailored for the accurate and efficient identification of tea diseases in natural environments. The proposed method integrates three novel components: Faster-LTNet, CG Attention Module, and RMT Spatial Prior Block, to significantly improve computational efficiency, feature representation, and detection capabilities. Faster-LTNet employs partial convolution and hierarchical design to optimize computational resources, while the CG Attention Module enhances multi-head self-attention by introducing grouped feature inputs and cascading operations to reduce redundancy and increase attention diversity. The RMT Spatial Prior Block integrates a Manhattan distance-based spatial decay matrix and linear decomposition strategy to improve global and local context modeling, reducing attention complexity. The enhanced RT-DETR model achieves a detection precision of 89.20% and a processing speed of 346.40 FPS. While the precision improves, the FPS value also increases by 109, which is superior to the traditional model in terms of precision and real-time processing. Additionally, compared to the baseline model, the FLOPs are reduced by 50%, and the overall model size and parameter size are decreased by approximately 50%. These findings indicate that the proposed algorithm is well-suited for efficient, real-time, and lightweight agricultural disease detection.
1. Introduction
Tea is a widely cultivated crop that possesses significant economic and social value [1]. The production of tea involves multiple stages, with the prevention and control of tea diseases being one of the crucial factors affecting tea quality [2]. Tea diseases refer to various diseases that occur in the process of tea tree growth, such as tea red leaf spot, tea white leaf spot, tea brown blight, etc. These diseases can lead to reduced tea yield, decreased quality, and even pose threats to human health [3]. Therefore, the prevention and control of tea diseases hold great significance in ensuring the safety and health of tea production and consumption [4]. Tea disease recognition based on deep learning and image processing has gradually become a hot topic [5]. Deep learning technology, with its characteristics of automation, efficiency, and accuracy, can automatically extract the disease characteristics of tea by training a large number of tea disease images, thus achieving automatic detection of tea diseases [6]. Among them, deep learning methods based on the Convolutional Neural Network (CNN) have been extensively applied in tea disease detection. For example, AlexNet [7], VGG [8], Inception [9], ResNet [10], and so on.
The conventional approach to disease detection primarily depends on visual inspection and experiential judgment [11,12,13,14,15,16]. Farmers and professionals diagnose and identify diseases based on the appearance and characteristics of tea trees, which is a laborious and lengthy process. Spectroscopic detection methods identify and differentiate different diseases by utilizing the spectral characteristics of plants. For example, Schor et al. [11] conducted principal component analysis on multispectral images and proposed an automated detection method for tomato spotted wilt and pepper powdery mildew disease. This method requires the acquisition of extensive spectral datasets and subsequent preprocessing and feature extraction operations. However, plant spectral data are easily influenced by various interfering factors such as lighting conditions and plant surface morphology, making it difficult to guarantee the quality and reliability of the data. Furthermore, tea disease detection can be performed through image processing and computer vision methods. For example, Zhang et al. [12] developed a real-time disease detection method utilizing Otsu thresholding, color space transformation, and a Convolutional Neural Network (CNN) to perform feature extraction, segmentation, and classification of diseases in cucumber, corn, and rice leaves. In addition, non-destructive testing techniques can be utilized to assess and examine the physical characteristics of plants to determine if they have been affected by diseases. Kumar et al. [13] introduced a sensor-based method for identifying plant diseases, which collects environmental data such as humidity and temperature using sensors and detects diseases through data analysis. However, the accuracy and stability of temperature and humidity measurements may be influenced by limitations of the measuring equipment, environmental interferences, and measurement errors. This can lead to significant errors and uncertainties in disease detection, making accurate disease detection challenging. Lastly, other detection algorithms, such as Single Shot MultiBox Detector (SSD) [14], represent single-stage approaches with rapid detection speeds but limited localization precision and reduced accuracy. In contrast, two-stage detection algorithms like Fast R-CNN [15] and FPN [16] offer improved localization and overall accuracy at the cost of slower detection speeds.
To tackle the aforementioned challenges of low efficiency and limited accuracy in tea disease detection, this study introduces an improved RT-DETR algorithm. The key contributions are as follows:
(1) Faster-LTNet Integration: The study incorporates Faster-LTNet into the backbone network to enhance computational efficiency by reducing memory access and redundant calculations. Its hierarchical structure with embedding and merging layers optimizes spatial downsampling and channel expansion, ensuring efficient feature extraction and reuse, particularly for central feature emphasis.
(2) CG Attention Module: The CG Attention Module is introduced to refine the attention mechanism by reducing redundancy in multi-head self-attention. Grouped feature inputs lower computational complexity, while cascading operations improve attention diversity and model capacity, resulting in more precise feature representation.
(3) RMT Spatial Prior Block: The RMT Spatial Prior Block is incorporated to introduce explicit spatial priors via a Manhattan distance-based spatial decay matrix. Linear decomposition reduces computational complexity, enabling efficient global and local context modeling, especially for high-resolution feature maps, and improving the network’s ability to detect disease features accurately.
These improvements significantly enhance the efficiency and precision of the RT-DETR algorithm, ensuring its effectiveness in tea disease detection.
2. Related Work
2.1. Plant Disease Detection Method
In the field of plant disease detection, various technologies and common approaches have been developed. Recent studies include Ma et al. [17], who developed a Deep Convolutional Neural Network (DCNN) model for detecting four cucumber diseases, including anthracnose, achieving a 93.4% accuracy rate while reducing the influence of multiple diseases on detection. Similarly, Wang et al. [18] proposed a neural network-based model that integrates Depthwise Separable Convolution (DSC) and an attention mechanism, achieving 94.65% accuracy on four public rice datasets. This model outperformed six other deep learning models tested at the same time and demonstrated good adaptability to mobile devices. Chen et al. [19] developed a method for identifying plant diseases in different plant datasets. The method effectively combines segmentation and classification and achieves a classification accuracy of 93.75% using genetic algorithms on CNN. Liu et al. [20] introduced an enhanced YOLOv3 model for multi-scale feature detection of disease images. Through the adoption of multi-scale training strategy; a detection accuracy of 92.39% was achieved. Qi et al. [21] presented an enhanced SE-YOLOv5 network architecture that incorporates attention mechanisms for extracting important features and optimization of the network model, resulting in a detection accuracy of 91.07%. Rahman et al. [22] adopted the relatively large architecture of InceptionV3 and VGG16 and slightly adjusted the model for rice disease detection. Meanwhile, due to the unsuitability of mobile devices for large-scale architectures, a two-stage small CNN architecture is proposed, resulting in a detection precision of 93.3%. Wu et al. [23] introduced a strategy to enhance training samples by integrating GoogleNet and Deep Generative Adversarial Network (GAN) [24]. Samples processed by this network have better generalization effects compared to those processed by traditional data augmentation methods. This approach enhances the accuracy of tomato leaf disease detection, improving the model’s effectiveness and achieving a detection accuracy of 94.33%. Zhou et al. [25] introduced a redesigned residual dense network that combines the advantages of deep residual networks and dense networks. This approach reduces the parameter volume and enhances the information flow, resulting in a detection accuracy of 95%. Ozguven et al. [26] developed an enhanced Faster R-CNN model for detecting leaf spot disease on sugar beet leaves. By optimizing parameters according to the image and region of interest, detection efficiency was improved, resulting in an accuracy of 95.48%.
2.2. RT-DETR Technology and Analysis
A Real-Time Detection Transformer (RT-DETR) is the first real-time, end-to-end object detection framework that eliminates Non-Maximum Suppression (NMS), enhancing both speed and accuracy. Its architecture comprises three core components: a ResNet backbone for multi-scale feature extraction, an efficient hybrid encoder, and a flexible transformer decoder. The hybrid encoder integrates attention mechanisms and convolutional operations, utilizing an Attention-based Intra-scale Feature Interaction (AIFI) module for single-scale processing and a Cross-scale Convolutional Feature Fusion (CCFF) module for efficient multi-scale feature integration. The transformer decoder supports adjustable layers to balance speed and accuracy without retraining, making it highly adaptable to diverse application scenarios. A standout feature is its uncertainty-minimal query selection strategy, which models and minimizes uncertainty in classification and localization tasks. By optimizing a loss function to align positional and categorical probabilities, RT-DETR ensures high-quality query generation, improving detection robustness and precision. The design advantages of RT-DETR lay in its comprehensive architecture, removing the requirement for post-processing, and its combination of a hybrid encoder with a flexible decoder, which substantially improves computational efficiency and offers high adaptability for a wide range of real-time visual tasks.
RT-DETR shows superior precision and reasoning speed, particularly excelling in lightweight models. Experiments show that RT-DETR demonstrates robust performance on large datasets, maintaining high accuracy and efficiency. When working with smaller datasets, it still remains reliable and efficient, showcasing its adaptability to various real-world scenarios. Kong et al. [27] developed Drone-DETR, integrating ESDNet and EDF-FAM, and achieving an 8.1% mAP50 improvement over RT-DETR-R18 on Vis-Drone2019 with 28.7 M parameters. Zhang et al. [28] proposed RS-DETR, a model combining cascaded attention, enhanced feature fusion, and Focaler-GIoU loss to improve the remote sensing object detection performance. Yu et al. [29] proposed the FHB-DETR model, improving railway-turnout defect detection accuracy by 3.5% in mAP50, reducing the parameter count by 25%, and lowering computational complexity by 6% while maintaining high real-time performance. Li et al. [30] proposed EMSC-DETR, an improved chicken detection model, achieving 98.6% AP50 and surpassing RT-DETR by 8.2%, 9.2%, and 28.3% in three independent testing sets. Zhao et al. [31] introduced an enhanced RT-DETR-Tomato model, integrating a Swin Transformer backbone and a BiFormer module, significantly enhancing the detection accuracy and reducing training time. Peng et al. [32] proposed FedsNet, an RT-DETR-based network for pedestrian detection, achieving a 1.7% accuracy improvement, a 15.1% reduction in parameters, and a 14.5% decrease in model size, with detection speeds of 109.5 FPS and 100.3 FPS on self-built and public datasets, respectively.
3. Materials and Methods
3.1. Overview of the Proposed Method
This study introduces three innovative approaches to enhance computational efficiency and feature modeling in visual tasks. Faster-LTNet employs partial convolution (PConv) to minimize computational redundancy and memory usage, achieving high floating-point operations per second (FLOPs). Its hierarchical structure includes embedding layers for initial spatial downsampling and merging layers for further resolution reduction and channel expansion. By integrating inverted residual blocks with shortcut connections, Faster-LTNet ensures efficient feature reuse and central feature emphasis through a T-shaped convolution structure. The CG Attention Module addresses inefficiencies in multi-head self-attention (MHSA) by introducing grouped feature inputs, which reduce computational complexity, and cascading operations, which refine feature representation and improve attention diversity. This approach enhances model capacity and ensures lightweight computation while increasing the non-linear expressiveness of the network. Lastly, the RMT Spatial Prior Block introduces explicit spatial priors through a Manhattan distance-based spatial decay matrix and reduces the attention complexity from quadratic to linear via a novel linear decomposition strategy. This enables efficient global and local context modeling, especially for high-resolution feature maps, while balancing computational costs. Together, these methods provide a comprehensive and flexible framework for achieving high efficiency, advanced feature representation, and broad applicability across various visual tasks. The overall network framework of this study is illustrated in Figure 1.
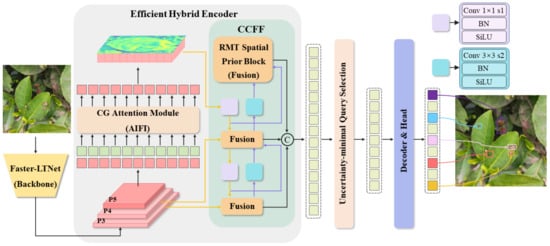
Figure 1.
The overall structure diagram of improved RT-DETR.
In addition, the modules proposed in this research can also be applied to other agricultural scenarios. For example, Faster-LTNet’s lightweight and real-time performance make it well-suited for scenarios such as pest detection in large-scale crop fields, where high-speed inference is critical to enable timely intervention. CG Attention Module’s ability to enhance feature extraction by focusing on critical regions can be beneficial for tasks such as fruit maturity classification, where subtle variations in texture or color need to be captured effectively. By leveraging spatial priors to refine detection, RMT Spatial Prior Block can be applied to livestock monitoring tasks, such as identifying specific health conditions or behaviors in animals within cluttered farm environments.
3.2. Faster-LTNet
Conventional neural networks usually enhance efficiency by decreasing the number of floating-point operations (FLOPs), but this approach does not always result in substantial latency reduction. Techniques like group convolution (GConv) and depthwise separable convolution (DWConv) are effective in reducing FLOPs, yet they are hindered by low floating-point operations per second due to frequent memory access. The Faster-LTNet aims to design a highly efficient network architecture by minimizing redundant computations and memory access, optimizing computational resource utilization, and enabling more effective spatial feature extraction.
Faster-LTNet adopts a hierarchical design comprising four stages, each preceded by an embedding layer or a merging layer for spatial downsampling and channel expansion. The embedding layer performs initial downsampling and channel expansion through a 4 × 4 convolution, while the merging layer further reduces spatial resolution and increases channel numbers between stages using a 2 × 2 convolution. The specific network architecture is illustrated in Figure 2. Each Faster-LTNet block consists of a partial convolution (PConv) [33] and two convolutions, collectively creating an inverted residual block with an expanded channel count in the intermediate layer and a shortcut connection for reusing input features. This design leverages information across all channels, forming a T-shaped convolution structure that emphasizes central features. The T-shaped structure design captures key features while retaining diversity, giving the model greater robustness, making it more robust in the face of changes in data distribution or interference. This capability is particularly important for practical application scenarios, such as maintaining high accuracy in a noisy background. PConv focuses on extracting local spatial features and significantly reduces FLOPs compared to regular convolutions. To balance computational efficiency and model performance, activation functions and batch normalization (BN) are judiciously placed to preserve feature diversity while reducing latency. Additionally, BN can be fused with adjacent convolutional layers to accelerate the inference process.
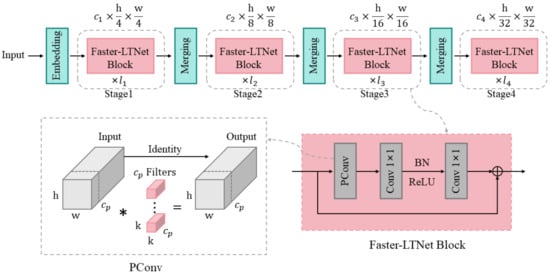
Figure 2.
The structure of the Faster-LTNet network.
The efficiency of Faster-LTNet is reflected in two key aspects: first, by optimizing FLOPS rather than solely focusing on reducing FLOPs, it achieves both low latency and high throughput; second, its design substantially reduces memory access, making it particularly suitable for I/O-constrained devices such as mobile and embedded systems. Although Faster-LTNet has demonstrated excellent performance, there remains room for further optimization. For instance, the network’s receptive field could be expanded by incorporating global operations, or its performance could be further enhanced by integrating operators such as attention mechanisms and MLPs.
3.3. CG Attention Module
Soil, branches, and trunks are coexisting with tea leaves, creating a complex and diverse growth environment for tea plants. The complex environmental background may interfere with the extraction of key disease information during the feature extraction process, leading to the neglect or loss of some important features. Therefore, by incorporating an effective attention mechanism into the network model, the weight of important features can be increased, thereby enhancing the tea disease features and sup-pressing irrelevant background features. This can improve the efficiency of extracting disease features from images.
CG Attention is an efficient attention mechanism designed to enhance the computational efficiency and diversity of attention mechanisms in vision Transformers, while simultaneously reducing the computational redundancy in Multi-Head Self-Attention (MHSA) [34] modules. By introducing feature grouping and cascaded processing strategies, CG Attention effectively alleviates the issue of attention map similarity in traditional MHSA and significantly strengthens the model’s representational capacity.
In MHSA, the input features are mapped to multiple independent attention subspaces to capture global dependencies. However, traditional MHSA provides the same input features to all attention heads, resulting in highly similar feature maps learned by different heads, thus wasting computational resources and limiting the diversity of feature representations. To address this issue, CG Attention provides independent feature splits for each attention head, explicitly decomposing the attention computation and significantly enhancing the diversity of attention maps. The detailed structure of the CG attention module is depicted in Figure 3.
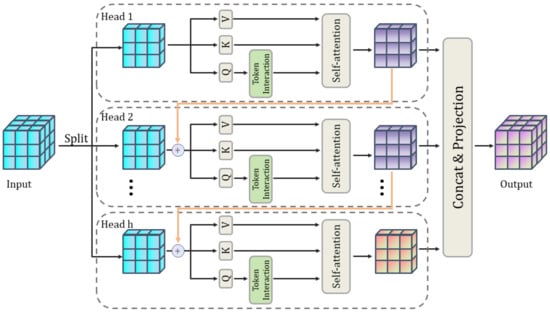
Figure 3.
CG attention module structure diagram.
The core mechanism of CG Attention includes grouped feature input and cascaded design. Specifically, CG Attention divides the input feature into h sub-feature groups , with each group being processed independently by a corresponding attention head. This design, akin to group convolutions in convolutional networks, significantly minimizes parameter count and reduces computational complexity. Unlike traditional MHSA, CG Attention’s grouping strategy reduces the number of input and output channels by a factor of 1/h, thereby reducing the computational overhead of matrix multiplications while improving attention diversity. The computation for each attention head is given by the following:
where is the output feature of the j-th attention head, and , , and are the linear transformation matrices used to project the input features.
To further enhance feature representation, CG Attention introduces a cascaded operation between attention heads. Specifically, the output of each attention head is passed to the next head, added to its input features, and progressively refines the feature representation. This process increases the network depth and non-linear expressiveness, without introducing additional parameters. The cascaded computation is expressed as follows:
where is the output of the previous attention head. This mechanism not only enhances the network depth but also improves the utilization of previous layer information by the attention heads.
Through the feature grouping and cascaded strategies, CG Attention innovatively addresses the issues of computational redundancy and capacity limitations in MHSA. Unlike conventional attention mechanisms that calculate dense pairwise interactions across all features, the CG Attention Module simplifies this process by employing lightweight operations. This targeted computation ensures that resources are focused on the most relevant aspects of the data, further reducing redundancy. Its design combines the concepts of group convolutions and cascaded feature transmission, achieving a good balance between memory, computation, and parameter efficiency, thus providing strong support for the construction of efficient models.
3.4. RMT Spatial Prior Block
The RMT Spatial Prior Block is an innovative vision module that combines the retentive mechanism of Retentive Networks (RetNets) [35] with the attention mechanism of Vision Transformer (ViT), greatly improving the efficiency of global information modeling while integrating explicit spatial priors. The primary framework of the RMT Spatial Prior Block includes the Manhattan Self-Attention (MaSA) mechanism [36] and an efficient decomposition strategy, enabling outstanding performance across various vision tasks. Figure 4 provides a detailed representation of the module’s structure.
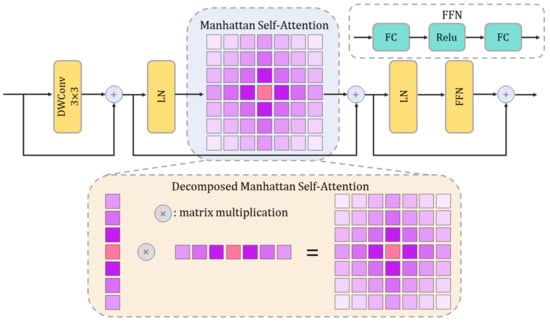
Figure 4.
Structural Diagram of the RMT Spatial Prior Block.
The RMT Spatial Prior Block incorporates a two-dimensional spatial decay matrix based on Manhattan distance, embedding explicit spatial priors into the self-attention mechanism. By attenuating weights based on the distances between tokens, the target token can more effectively allocate attention resources when perceiving global information. The MaSA mechanism extends the one-dimensional temporal decay of RetNets into two-dimensional space, designing a decay matrix based on Manhattan distance. The attention scores in this matrix progressively diminish as the distance from the target token increases, thereby explicitly embedding spatial priors. The attenuation matrix is formulated as follows:
where and represent the two-dimensional coordinates of two tokens, and γ denotes the attenuation factor.
The spatial decay matrix is utilized to adjust attention allocation, replacing the traditional Softmax operation in standard self-attention. The improved self-attention formula is as follows:
where represents element-wise multiplication.
In low-resolution data scenarios, due to the limited spatial resolution of the data, capturing local information is particularly important. MaSA’s attention mechanism based on Manhattan distance effectively enhances the interaction ability of neighboring regions by explicitly modeling spatial attenuation, thus having a significant advantage in capturing fine-grained features. In addition, its two-dimensional receptive field preservation feature enables the model to comprehensively consider a larger spatial range even at low resolution to avoid information loss. This stability and adaptability of performance makes MaSA’s performance on low-resolution data an important manifestation of its comprehensive capabilities.
When processing high-resolution feature maps, the computational cost of global attention is often prohibitive. To address this, MaSA introduces a decomposition strategy with linear complexity, breaking down the attention and spatial decay matrix into operations computed separately along horizontal and vertical directions. This method preserves the full two-dimensional receptive field while achieving linear computational complexity. Specifically, the two-dimensional attention is decomposed into horizontal and vertical one-dimensional operations:
where and represent the attenuation matrices in the horizontal and vertical directions, respectively. Finally, they are combined as follows:
The decomposed Manhattan Self-Attention not only retains the complete two-dimensional receptive field but also significantly reduces computational complexity, making it particularly suitable for handling early-stage high-resolution feature maps. The RMT Spatial Prior Block introduces a novel paradigm for constructing general-purpose vision backbone networks through its efficient design and flexible spatial priors.
4. Experiment and Evaluations
4.1. Dataset
Currently, no publicly accessible datasets on tea plant diseases are available online. Relying solely on the internet to collect disease images is far from sufficient. To accurately replicate the natural growth conditions of tea plants and enhance the collected data, all data for this study were obtained through field photography. The tea plant disease images in the dataset were gathered in the concentrated tea garden behind Xiaohe Mountain Campus of Zhejiang University of Science and Technology. The overall environment of the tea garden is shown in Figure 5. The collection dates were from 16th March to 27th March 2023, and from 4th April to 15th April. Since this period coincides with the high incidence of tea plant diseases, it is more convenient to collect disease data images. During the collection of disease images, the influence of weather conditions and light intensity was taken into consideration, and the photographs were taken on sunny, cloudy, and rainy days, respectively. In order to guarantee authenticity of the tea disease image data, photographs were captured from the front, top, and side angles, with soil and branches included as interference factors in the imaging background. In addition, images of the coexistence of multiple diseases are included to enhance the adaptability and generalizability of the dataset. Tea disease images under various situations are shown in Figure 6. A total of 1494 tea plant disease images of four types were collected, including 437 samples of red leaf spot, 415 samples of tea white spot, 273 samples of tea coal disease, and 369 samples of tea brown blight.
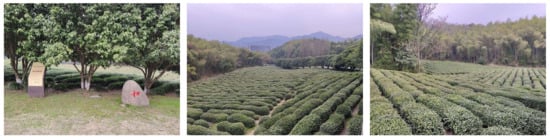
Figure 5.
Tea garden panorama.
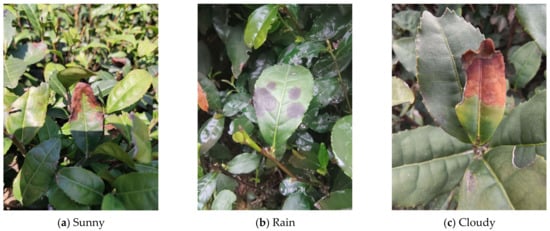
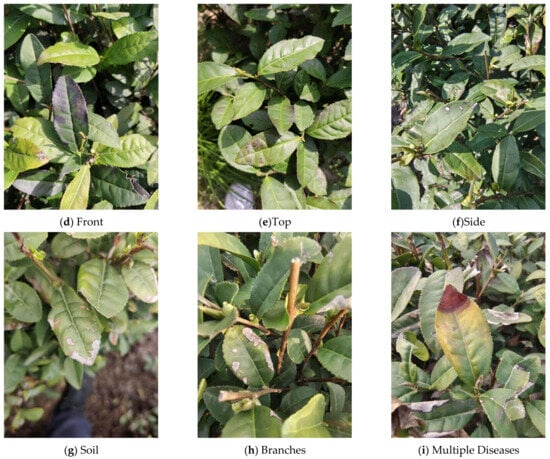
Figure 6.
Tea disease images under various situations.
4.2. Data Processing
A lack of sufficient data can lead to overfitting during model training. To prevent overfitting and enhance the recognition performance of the convolutional neural network on images, it is imperative to supply an ample number of samples for the network to acquire a broader range of image features. Image augmentation operations were performed on the dataset, which included image rotation, flipping, adding Gaussian noise, and enhancing contrast. Each of the four image augmentation methods was applied to 25% of the original dataset, ensuring a balanced and diverse augmentation process to enrich the training data and improve model robustness. After augmentation, a total of 4580 tea plant disease images were obtained. Taking tea brown blight as an example, Figure 7 presents the images in their original form alongside their augmented counterparts. The augmented dataset was annotated using the visualization annotation tool, LabelImg. The annotation results generated a series of corresponding txt files, which included details such as the disease type and location coordinates for each image. These files, along with the tea plant disease images, formed the final dataset.
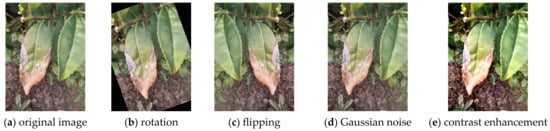
Figure 7.
Augmentation processing of tea brown blight image.
To optimize the use of the dataset, it was randomly split in a 9:1 ratio. The training set included 4124 images for network model training, while the validation set contained 456 images used to evaluate model convergence during training. The dataset split details are presented in Table 1. This approach ensures optimal use of the dataset, advancing the model’s generalization and performance, thereby improving its applicability to real-world scenarios. The model is trained primarily on data from a specific crop. To generalize the model to other crops, we propose that future work includes expanding the dataset to encompass a broader variety of crops with different characteristics. This helps to enhance the model’s ability to adapt to the unique features and disease manifestations of different plant species.

Table 1.
Sample classification data of different tea diseases.
4.3. Experimental Environment and Parameters
The experimental platform operates on a Linux system, utilizing an NVIDIA GeForce RTX 3090 GPU with 24 GB of memory. The CUDA version used is 11.6, and the PyTorch framework is version 1.12.0. The network model is trained within the PyTorch deep learning framework, with a batch size of 16, 400 epochs, an initial learning rate of 0.0001, momentum set to 0.9, and the AdamW optimizer for gradient descent. The initial learning rate of 0.0001 was selected based on both preliminary experiments and best practices reported in similar studies. Furthermore, an excessively high learning rate may cause the optimizer to overshoot the minima of the loss function, while an excessively low rate could prolong the training process unnecessarily. Our choice of 0.0001 represents a balanced approach, ensuring both training stability and efficiency. The selection of 400 epochs is the result of comprehensive consideration of multiple factors such as model convergence, architecture complexity, dataset size, and computing resources. The model parameters are not fixed during the experimental process but are dynamically adjusted through iterative experimentation and performance evaluation. This adjustment involves optimizing key hyperparameters, such as learning rate, weight initialization, regularization parameters, and optimizer settings. The objective is to iteratively refine the model based on its performance on the training and validation datasets, ensuring that the final trained model achieves optimal performance and generalization capability.
This paper evaluates the algorithm’s detection efficacy proposed in this study by comparing the differences between the original RT-DETR model and the improved model in disease detection, while exploring the feasibility of each improvement method. In terms of quantitative evaluation, the main indicators selected are as follows: precision, recall, and mean average precision (mAP), including mAP50 and mAP50:95, etc. The relevant equations are as follows:
In this context, TP (True Positive) refers to the count of accurately identified positive samples in the detection outcomes. FP (False Positive) indicates the count of incorrectly identified positive samples. FN (False Negative) denotes the count of positive samples from a specific category that were missed. C represents the total number of categories.
4.4. Experimental Results
4.4.1. Comparative Experiment
In order to comprehensively and objectively evaluate the improved RT-DETR algorithm, this study conducts experimental comparisons on four different algorithms and their corresponding versions with different network structures. Precision, Recall, mAP50, and mAP50:95, etc., were chosen as evaluation metrics. The tested algorithm models include the traditional YOLOv5s, YOLOv7-tiny, YOLOv7, YOLOv7-X, YOLOv8, YOLOv8-P2, YOLOv8-P6, and the improved RT-DETR proposed in this study. To guarantee the accuracy of the comparative experiments, all models are trained without loading pre-trained weights. The results presented in Table 2 indicate that the proposed improved algorithm surpasses the current methods across most evaluation metrics.
Table 2.
Comparison results with other methods.
Figure 8 illustrates the disease detection performance of various algorithm models. Among them, Figure 8c,f,h have missed detection of tea brown blight in the top left corner of the image, and Figure 8b,c have missed detection of tea brown blight in the middle of the image. Moreover, in terms of detection details, only Figure 8b,h,i detected part of the tea brown blight on the left part of the image, and the rest were missed. In addition, the detection anchor box in Figure 8c does not fully fit the disease, and the disease is not fully detected. In comparison, the model introduced in this study has higher detection quality on the same detection image, can comprehensively detect the disease, the detection anchor box also fits the disease area better, and can maintain a high detection level. This indicates that the model presented in this study can detect diseases with greater accuracy and comprehensiveness.
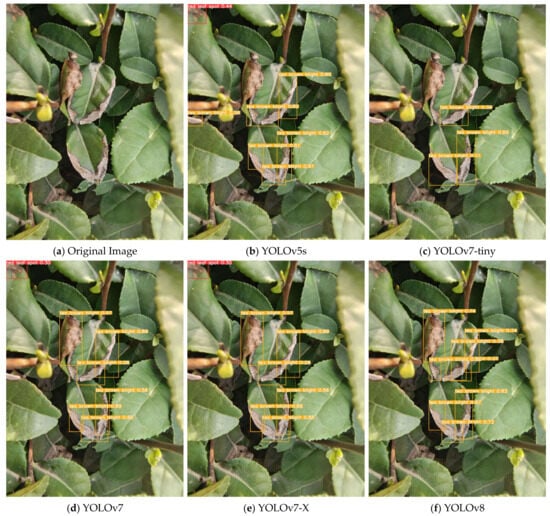
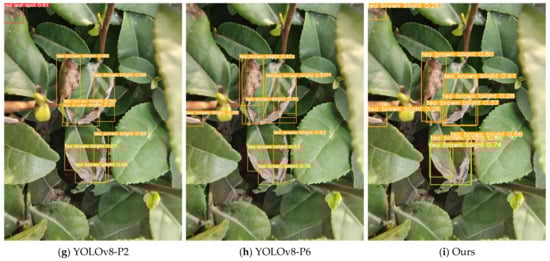
Figure 8.
The performance of various algorithmic models in disease detection.
To further evaluate the effectiveness and robustness of the improved RT-DETR algorithm, Grad-CAM++ was employed to generate heatmaps, visually highlighting the regions of interest detected by various network backbones. Heatmaps act as a valuable tool for visualizing how models concentrate on particular areas during detection, offering important insights into their capability to localize and identify disease-affected regions. Figure 9 presents the heatmaps for detecting tea diseases, generated by the proposed backbone compared to other backbones, including RT-DETR-R18 [37], ConvNextV2 [38], LSKNet [39], EfficientViT [34], RepViT [40], EfficientFormerV2 [41], and UniRepLKNet [42].
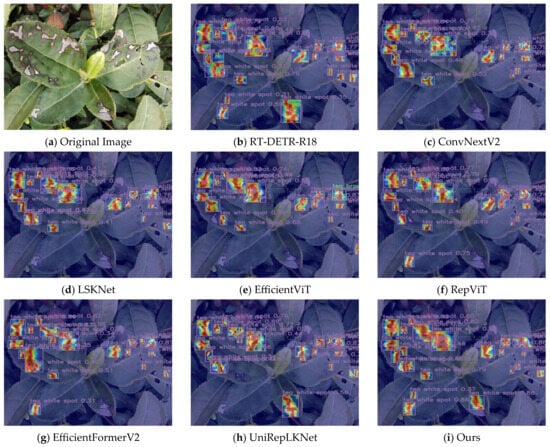
Figure 9.
Heat map of detection results of different network backbones.
Compared with previous models, the proposed model exhibits a slight decline in precision and recall; however, it demonstrates significant advantages in terms of lightweight performance. Specifically, the model achieves substantial reductions in FLOPs, remarkable improvements in FPS, a significant decrease in the number of parameters, and a notable compression in model size. These improvements effectively address the limitations of traditional models, such as slow detection speed and excessive model size, providing a more efficient solution for scenarios with constrained computational resources and high real-time requirements.
The proposed backbone network can comprehensively detect diseased areas, excels in detecting subtle and irregular lesions that other backbones often overlook, and shows excellent attention to fine-grained features, outperforming other backbone network models. Overall, the heatmap confirms the enhanced detection capabilities of the proposed backbone network, consistent with its excellent quantitative metrics (Table 3). These results highlight its suitability for real-time, accurate, and lightweight agricultural disease detection tasks.
Table 3.
Comparison of detection metrics across various network backbones.
In addition, in order to fully verify the generalization ability and practical application value of the model, we specially selected the public tea disease dataset provided by Sun et al. [43], which is highly representative and widely recognized because it covers typical disease samples in a variety of real scenarios. We used this dataset to conduct independent tests, focusing on evaluating the performance of the model on unseen data, including the classification accuracy and detection efficiency of different disease types. The specific experimental data and results are shown in Table 4 and Figure 10. This process cannot only comprehensively test the robustness and stability of the model in complex scenarios, but also provide more authoritative and credible results support for the research results, laying a solid foundation for subsequent practical promotion and application.
Table 4.
Results of independent testing on public datasets.
Figure 10.
The effect diagram of the model’s comparative experiment on public datasets. Column (a) is the original image of Tea exobasidium blight, Tea red scab, Tea cake, and Tea cloud leaf blight from top to bottom. Columns (b,c) correspond to the effect of disease detection before and after improvement of the model, respectively.
4.4.2. Ablation Experiment
To thoroughly evaluate the efficiency of the proposed approach, this study performed several ablation experiments to assess the impact of individual components on model performance and further investigate the advantages of the improved algorithm. To ensure the reliability and consistency of the results, all models were trained from scratch without the use of pre-trained weights, eliminating external factors and strengthening the validity of the findings. The outcomes of the ablation experiments are presented in Table 5.
Table 5.
Results of ablation experiment.
In the experiments, although the precision showed only a slight improvement, other critical performance metrics demonstrated significant enhancements. For instance, the FLOPs were drastically reduced from 57.00 to 28.30, improving efficiency by over two-fold. The FPS increased from 237.40 to 346.40, indicating a significant improvement in real-time performance, enabling the model to process tasks more efficiently. The number of parameters decreased from 19.88 M to 10.30 M, nearly halving the model complexity and reducing storage requirements substantially. Similarly, the model size was reduced from 40.50 M to 20.40 M, further highlighting the advantages of the lightweight design. Overall, compared to the conventional RT-DETR, the proposed improved algorithm not only achieves higher real-time performance but also significantly reduces computational and storage requirements, making it viable for implementation on devices with limited resources. Table 5 illustrates that the improved algorithm significantly surpasses the original one in overall performance.
Additionally, to further demonstrate the practical effectiveness of the enhanced model, this study conducted a comparative analysis using specific detection cases, with the results presented in Figure 11. In order to facilitate detailed error analysis of the model, the confusion matrix is specially introduced, as shown in Figure 12.
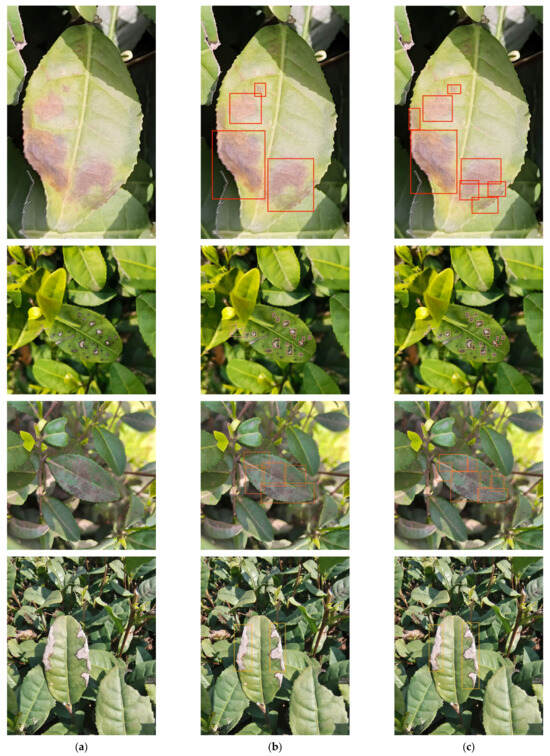
Figure 11.
Effect diagram of tea disease detection before and after model enhancement. Column (a) is the original image of red leaf spot, tea white spot, tea coal disease, and tea brown blight from top to bottom. Columns (b,c) correspond to the effect of disease detection before and after improvement of the model, respectively.
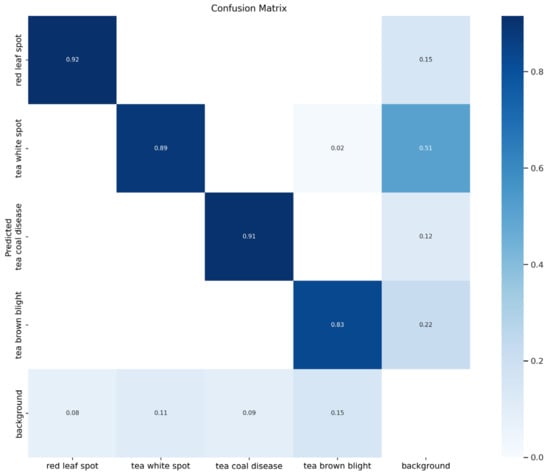
Figure 12.
Schematic diagram of the confusion matrix of the model.
The first row illustrates the detection results for red leaf spot. The improved model shows notable improvements in accuracy and precision in bounding boxes compared to the original model, capturing not only the diseased regions more closely but also subtle disease features that were previously undetected, showcasing the model’s responsiveness to fine-grained details. In the second row, depicting tea white spot disease detection, the original model misidentified white cracks along the leaf edges as disease, whereas the improved model accurately distinguished diseased and non-diseased regions through more precise feature extraction and exhibited a stronger capability to detect minor disease spots on the leaves. The third row presents results for tea coal disease detection, where the improved model achieves markedly enhanced localization accuracy. Its bounding boxes align more closely with the diseased regions, providing comprehensive coverage of the affected areas and significantly reducing both missed and false detections. The fourth row highlights the detection of tea brown blight disease. The original model exhibited clear omissions in the lower part of the bounding box, failing to fully cover the diseased region. The improved model, with its superior feature extraction and modeling capabilities, successfully addressed this issue, achieving complete coverage of the diseased areas.
In summary, the improved RT-DETR model demonstrates significant advancements in real-time performance, lightweight design, and detection capabilities. Comparative analyses with the initial model reveal that the enhanced model not only detects diseased regions more accurately but also effectively identifies subtle and complex disease features, showcasing exceptional generalization performance.
5. Conclusions
This study introduces an improved RT-DETR algorithm for real-time and precise detection of tea diseases in natural settings. The integration of Faster-LTNet, CG Attention Module, and RMT Spatial Prior Block significantly enhances the model’s computational efficiency, feature representation, and detection capabilities. Experimental results demonstrate that the enhanced algorithm surpasses other methods in key metrics, achieving a mAP50 of 85.80% and a detection speed of 346.40 FPS, with a 50% reduction in FLOPs and parameter size compared to baseline models.
The heatmap analysis reveals the model’s ability to comprehensively detect disease regions, accurately fit bounding boxes, and identify subtle and complex features that competing models often overlook. These advancements demonstrate the robustness and practicality of the proposed RT-DETR algorithm for agricultural applications. Future work will focus on enlarging the dataset, optimizing the algorithm for additional agricultural scenarios, and further enhancing its adaptability to resource-constrained devices.
This study provides a foundation for leveraging deep learning technologies to improve the efficiency and reliability of agricultural disease detection, contributing to sustainable tea production and ensuring crop health.
Author Contributions
Conceptualization, Z.L. and Z.Z.; methodology, Z.L. and L.G.; software, Z.Z. and J.C.; validation, Z.L., Z.Z. and J.C.; formal analysis, Z.Z.; investigation, L.G.; resources, Z.L.; writing—original draft preparation, Z.Z.; writing—review and editing, Z.L. and J.C.; visualization, Z.Z.; supervision, Z.L., L.G., J.C. and J.W. All authors have read and agreed to the published version of the manuscript.
Funding
This research was supported by the Natural Science Foundation of Zhejiang Province (No. LY21F020005), Teaching Research and Reform Foundation (No.2023-jg29, No.2023-30) and Higher Education Research Institute Foundation of Zhejiang University of Science and Technology.
Institutional Review Board Statement
Not applicable.
Informed Consent Statement
Not applicable.
Data Availability Statement
The datasets generated during the current study are available from the corresponding author on reasonable request.
Acknowledgments
The authors are grateful to all individuals who have contributed to this study.
Conflicts of Interest
The authors declare no conflicts of interest.
References
- Suroso, A.I.; Abdullah, A.; Haryono, A.; Tandra, H. The potential of China’s tea trade and how it affects China’s economic growth. J. Int. Trade Econ. Dev. 2024, 1–22. [Google Scholar] [CrossRef]
- Saleem, M.H.; Potgieter, J.; Arif, K.M. Plant disease detection and classification by deep learning. Plants 2019, 8, 468. [Google Scholar] [CrossRef] [PubMed]
- Shinde, S.V.; Lahade, S. Deep Learning for Tea Leaf Disease Classification: Challenges, Study Gaps, and Emerging Technologies. In Applied Computer Vision and Soft Computing with Interpretable AI; Chapman and Hall/CRC: Boca Raton, FL, USA, 2024; pp. 293–314. [Google Scholar]
- Miao, S.; Wei, Y.; Pan, Y.; Wang, Y.; Wei, X. Detection methods, migration patterns, and health effects of pesticide residues in tea. Compr. Rev. Food Sci. Food Saf. 2023, 22, 2945–2976. [Google Scholar] [CrossRef]
- Ihsan, C.N.; Agustina, N.; Naseer, M.; Gusdevi, H.; Rusdi, J.F.; Hadhiwibowo, A.; Abdullah, F. Comparison of Machine Learning Algorithms in Detecting Tea Leaf Diseases. J. RESTI 2024, 8, 135–141. [Google Scholar] [CrossRef]
- Wang, H.; Gu, J.; Wang, M. A review on the application of computer vision and machine learning in the tea industry. Front. Sustain. Food Syst. 2023, 7, 1172543. [Google Scholar] [CrossRef]
- Krizhevsky, A.; Sutskever, I.; Hinton, G.E. ImageNet classification with deep convolutional neural networks. Commun. ACM 2017, 60, 84–90. [Google Scholar] [CrossRef]
- Simonyan, K.; Zisserman, A. Very deep convolutional networks for large-scale image recognition. arXiv 2014, arXiv:1409.1556. [Google Scholar]
- Szegedy, C.; Liu, W.; Jia, Y.; Sermanet, P.; Reed, S.; Anguelov, D.; Erhan, D.; Vanhoucke, V.; Rabinovich, A. Going deeper with convolutions. In Proceedings of the IEEE Conference on Computer Vision and Pattern Recognition, Las Vegas, NV, USA, 27–30 June 2016; pp. 1–9. [Google Scholar]
- He, K.; Zhang, X.; Ren, S.; Sun, J. Deep residual learning for image recognition. In Proceedings of the IEEE Conference on Computer Vision and Pattern Recognition, Las Vegas, NV, USA, 27–30 June 2016; pp. 770–778. [Google Scholar]
- Schor, N.; Bechar, A.; Ignat, T.; Dombrovsky, A.; Elad, Y.; Berman, S. Robotic disease detection in greenhouses: Combined detection of powdery mildew and tomato spotted wilt virus. IEEE Robot. Autom. Lett. 2016, 1, 354–360. [Google Scholar] [CrossRef]
- Zhang, P.; Yang, L.; Li, D. EfficientNet-B4-Ranger: A novel method for greenhouse cucumber disease recognition under natural complex environment. Comput. Electron. Agric. 2020, 176, 105652. [Google Scholar] [CrossRef]
- Kumar, M.; Kumar, A.; Palaparthy, V.S. Soil sensors-based prediction system for plant diseases using exploratory data analysis and machine learning. IEEE Sens. J. 2020, 21, 17455–17468. [Google Scholar] [CrossRef]
- Liu, W.; Anguelov, D.; Erhan, D.; Szegedy, C.; Reed, S.; Fu, C.Y.; Berg, A.C. Ssd: Single shot multibox detector. In Computer Vision–ECCV 2016: 14th European Conference, Amsterdam, The Netherlands, 11–14 October 2016; Proceedings, Part I 14; Springer International Publishing: Berlin/Heidelberg, Germany, 2016; pp. 21–37. [Google Scholar]
- Girshick, R. Fast r-cnn. In Proceedings of the IEEE International Conference on Computer Vision, Santiago, Chile, 7–13 December 2015; pp. 1440–1448. [Google Scholar]
- Lin, T.Y.; Dollár, P.; Girshick, R.; He, K.; Hariharan, B.; Belongie, S. Feature pyramid networks for object detection. In Proceedings of the IEEE Conference on Computer Vision and Pattern Recognition, Honolulu, HI, USA, 21–26 July 2017; pp. 2117–2125. [Google Scholar]
- Ma, J.; Du, K.; Zheng, F.; Zhang, L.; Gong, Z.; Sun, Z. A recognition method for cucumber diseases using leaf symptom images based on deep convolutional neural network. Comput. Electron. Agric. 2018, 154, 18–24. [Google Scholar] [CrossRef]
- Wang, Y.; Wang, H.; Peng, Z. Rice diseases detection and classification using attention based neural network and bayesian optimization. Expert Syst. Appl. 2021, 178, 114770. [Google Scholar] [CrossRef]
- Chen, J.; Chen, J.; Zhang, D.; Nanehkaran, Y.A.; Sun, Y. A cognitive vision method for the detection of plant disease images. Mach. Vis. Appl. 2021, 32, 1–18. [Google Scholar] [CrossRef]
- Liu, J.; Wang, X. Tomato diseases and pests detection based on improved Yolo V3 convolutional neural network. Front. Plant Sci. 2020, 11, 898. [Google Scholar] [CrossRef]
- Qi, J.; Liu, X.; Liu, K.; Xu, F.; Guo, H.; Tian, X.; Li, M.; Bao, Z.; Li, Y. An improved YOLOv5 model based on visual attention mechanism: Application to recognition of tomato virus disease. Comput. Electron. Agric. 2022, 194, 106780. [Google Scholar] [CrossRef]
- Rahman, C.R.; Arko, P.S.; Ali, M.E.; Khan, M.A.I.; Apon, S.H.; Nowrin, F.; Wasif, A. Identification and recognition of rice diseases and pests using convolutional neural networks. Biosyst. Eng. 2020, 194, 112–120. [Google Scholar] [CrossRef]
- Wu, Q.; Chen, Y.; Meng, J. DCGAN-based data augmentation for tomato leaf disease identification. IEEE Access 2020, 8, 98716–98728. [Google Scholar] [CrossRef]
- Goodfellow, I.; Pouget-Abadie, J.; Mirza, M.; Xu, B.; Warde-Farley, D.; Ozair, S.; Courville, A.; Bengio, Y. Generative adversarial nets. Adv. Neural Inf. Process. Syst. 2014, 27. [Google Scholar]
- Zhou, C.; Zhou, S.; Xing, J.; Song, J. Tomato leaf disease identification by restructured deep residual dense network. IEEE Access 2021, 9, 28822–28831. [Google Scholar] [CrossRef]
- Ozguven, M.M.; Adem, K. Automatic detection and classification of leaf spot disease in sugar beet using deep learning algorithms. Phys. A Stat. Mech. Its Appl. 2019, 535, 22537. [Google Scholar] [CrossRef]
- Kong, Y.; Shang, X.; Jia, S. Drone-DETR: Efficient small object detection for remote sensing image using enhanced RT-DETR model. Sensors 2024, 24, 5496. [Google Scholar] [CrossRef] [PubMed]
- Zhang, H.; Ma, Z.; Li, X. RS-DETR: An Improved Remote Sensing Object Detection Model Based on RT-DETR. Appl. Sci. 2024, 14, 10331. [Google Scholar] [CrossRef]
- Yu, C.; Chen, X. Railway rutting defects detection based on improved RT-DETR. J. Real-Time Image Process. 2024, 21, 146. [Google Scholar] [CrossRef]
- Li, X.; Cai, M.; Tan, X.; Yin, C.; Chen, W.; Liu, Z.; Wen, J.; Han, Y. An efficient transformer network for detecting multi-scale chicken in complex free-range farming environments via improved RT-DETR. Comput. Electron. Agric. 2024, 224, 109160. [Google Scholar] [CrossRef]
- Zhao, Z.; Chen, S.; Ge, Y.; Yang, P.; Wang, Y.; Song, Y. Rt-detr-tomato: Tomato target detection algorithm based on improved rt-detr for agricultural safety production. Appl. Sci. 2024, 14, 6287. [Google Scholar] [CrossRef]
- Peng, H.; Chen, S. FedsNet: The real-time network for pedestrian detection based on RT-DETR. J. Real-Time Image Process. 2024, 21, 142. [Google Scholar] [CrossRef]
- Chen, J.; Kao, S.H.; He, H.; Zhuo, W.; Wen, S.; Lee, C.H.; Chan, S.H.G. Run, don’t walk: Chasing higher FLOPS for faster neural networks. In Proceedings of the IEEE/CVF Conference on Computer Vision and Pattern Recognition, Vancouver, BC, Canada, 17–24 June 2023; pp. 12021–12031. [Google Scholar]
- Liu, X.; Peng, H.; Zheng, N.; Yang, Y.; Hu, H.; Yuan, Y. Efficientvit: Memory efficient vision transformer with cascaded group attention. In Proceedings of the IEEE/CVF Conference on Computer Vision and Pattern Recognition, Vancouver, BC, Canada, 17–24 June 2023; pp. 14420–14430. [Google Scholar]
- Sun, Y.; Dong, L.; Huang, S.; Ma, S.; Xia, Y.; Xue, J.; Wang, J.; Wei, F. Retentive network: A successor to transformer for large language models. arXiv 2023, arXiv:2307.08621. [Google Scholar]
- Fan, Q.; Huang, H.; Chen, M.; Liu, H.; He, R. Rmt: Retentive networks meet vision transformers. In Proceedings of the IEEE/CVF Conference on Computer Vision and Pattern Recognition, Seattle, WA, USA, 16–22 June 2024; pp. 5641–5651. [Google Scholar]
- Zhao, Y.; Lv, W.; Xu, S.; Wei, J.; Wang, G.; Dang, Q.; Liu, Y.; Chen, J. Detrs beat yolos on real-time object detection. In Proceedings of the IEEE/CVF Conference on Computer Vision and Pattern Recognition, Seattle, WA, USA, 16–22 June 2024; pp. 16965–16974. [Google Scholar]
- Woo, S.; Debnath, S.; Hu, R.; Chen, X.; Liu, Z.; Kweon, I.S.; Xie, S. Convnext v2: Co-designing and scaling convnets with masked autoencoders. In Proceedings of the IEEE/CVF Conference on Computer Vision and Pattern Recognition, Vancouver, BC, Canada, 17–24 June 2023; pp. 16133–16142. [Google Scholar]
- Li, Y.; Hou, Q.; Zheng, Z.; Cheng, M.M.; Yang, J.; Li, X. Large selective kernel network for remote sensing object detection. In Proceedings of the IEEE/CVF International Conference on Computer Vision, Vancouver, BC, Canada, 17–24 June 2023; pp. 16794–16805. [Google Scholar]
- Wang, A.; Chen, H.; Lin, Z.; Han, J.; Ding, G. Repvit: Revisiting mobile cnn from vit perspective. In Proceedings of the IEEE/CVF Conference on Computer Vision and Pattern Recognition, Seattle, WA, USA, 16–22 June 2024; pp. 15909–15920. [Google Scholar]
- Li, Y.; Hu, J.; Wen, Y.; Evangelidis, G.; Salahi, K.; Wang, Y.; Tulyakov, S.; Ren, J. Rethinking vision transformers for mobilenet size and speed. In Proceedings of the IEEE/CVF International Conference on Computer Vision, Vancouver, BC, Canada, 17–24 June 2023; pp. 16889–16900. [Google Scholar]
- Ding, X.; Zhang, Y.; Ge, Y.; Zhao, S.; Song, L.; Yue, X.; Shan, Y. UniRepLKNet: A Universal Perception Large-Kernel ConvNet for Audio Video Point Cloud Time-Series and Image Recognition. In Proceedings of the IEEE/CVF Conference on Computer Vision and Pattern Recognition, Seattle, WA, USA, 16–22 June 2024; pp. 5513–5524. [Google Scholar]
- Sun, Y.; Wu, F.; Guo, H.; Li, R.; Yao, J.; Shen, J. TeaDiseaseNet: Multi-scale self-attentive tea disease detection. Front. Plant Sci. 2023, 14, 1257212. [Google Scholar] [CrossRef] [PubMed]
Disclaimer/Publisher’s Note: The statements, opinions and data contained in all publications are solely those of the individual author(s) and contributor(s) and not of MDPI and/or the editor(s). MDPI and/or the editor(s) disclaim responsibility for any injury to people or property resulting from any ideas, methods, instructions or products referred to in the content. |
© 2025 by the authors. Licensee MDPI, Basel, Switzerland. This article is an open access article distributed under the terms and conditions of the Creative Commons Attribution (CC BY) license (https://creativecommons.org/licenses/by/4.0/).