
RPS-YOLO: A Recursive Pyramid Structure-Based YOLO Network for Small Object Detection in Unmanned Aerial Vehicle Scenarios


Abstract
1. Introduction
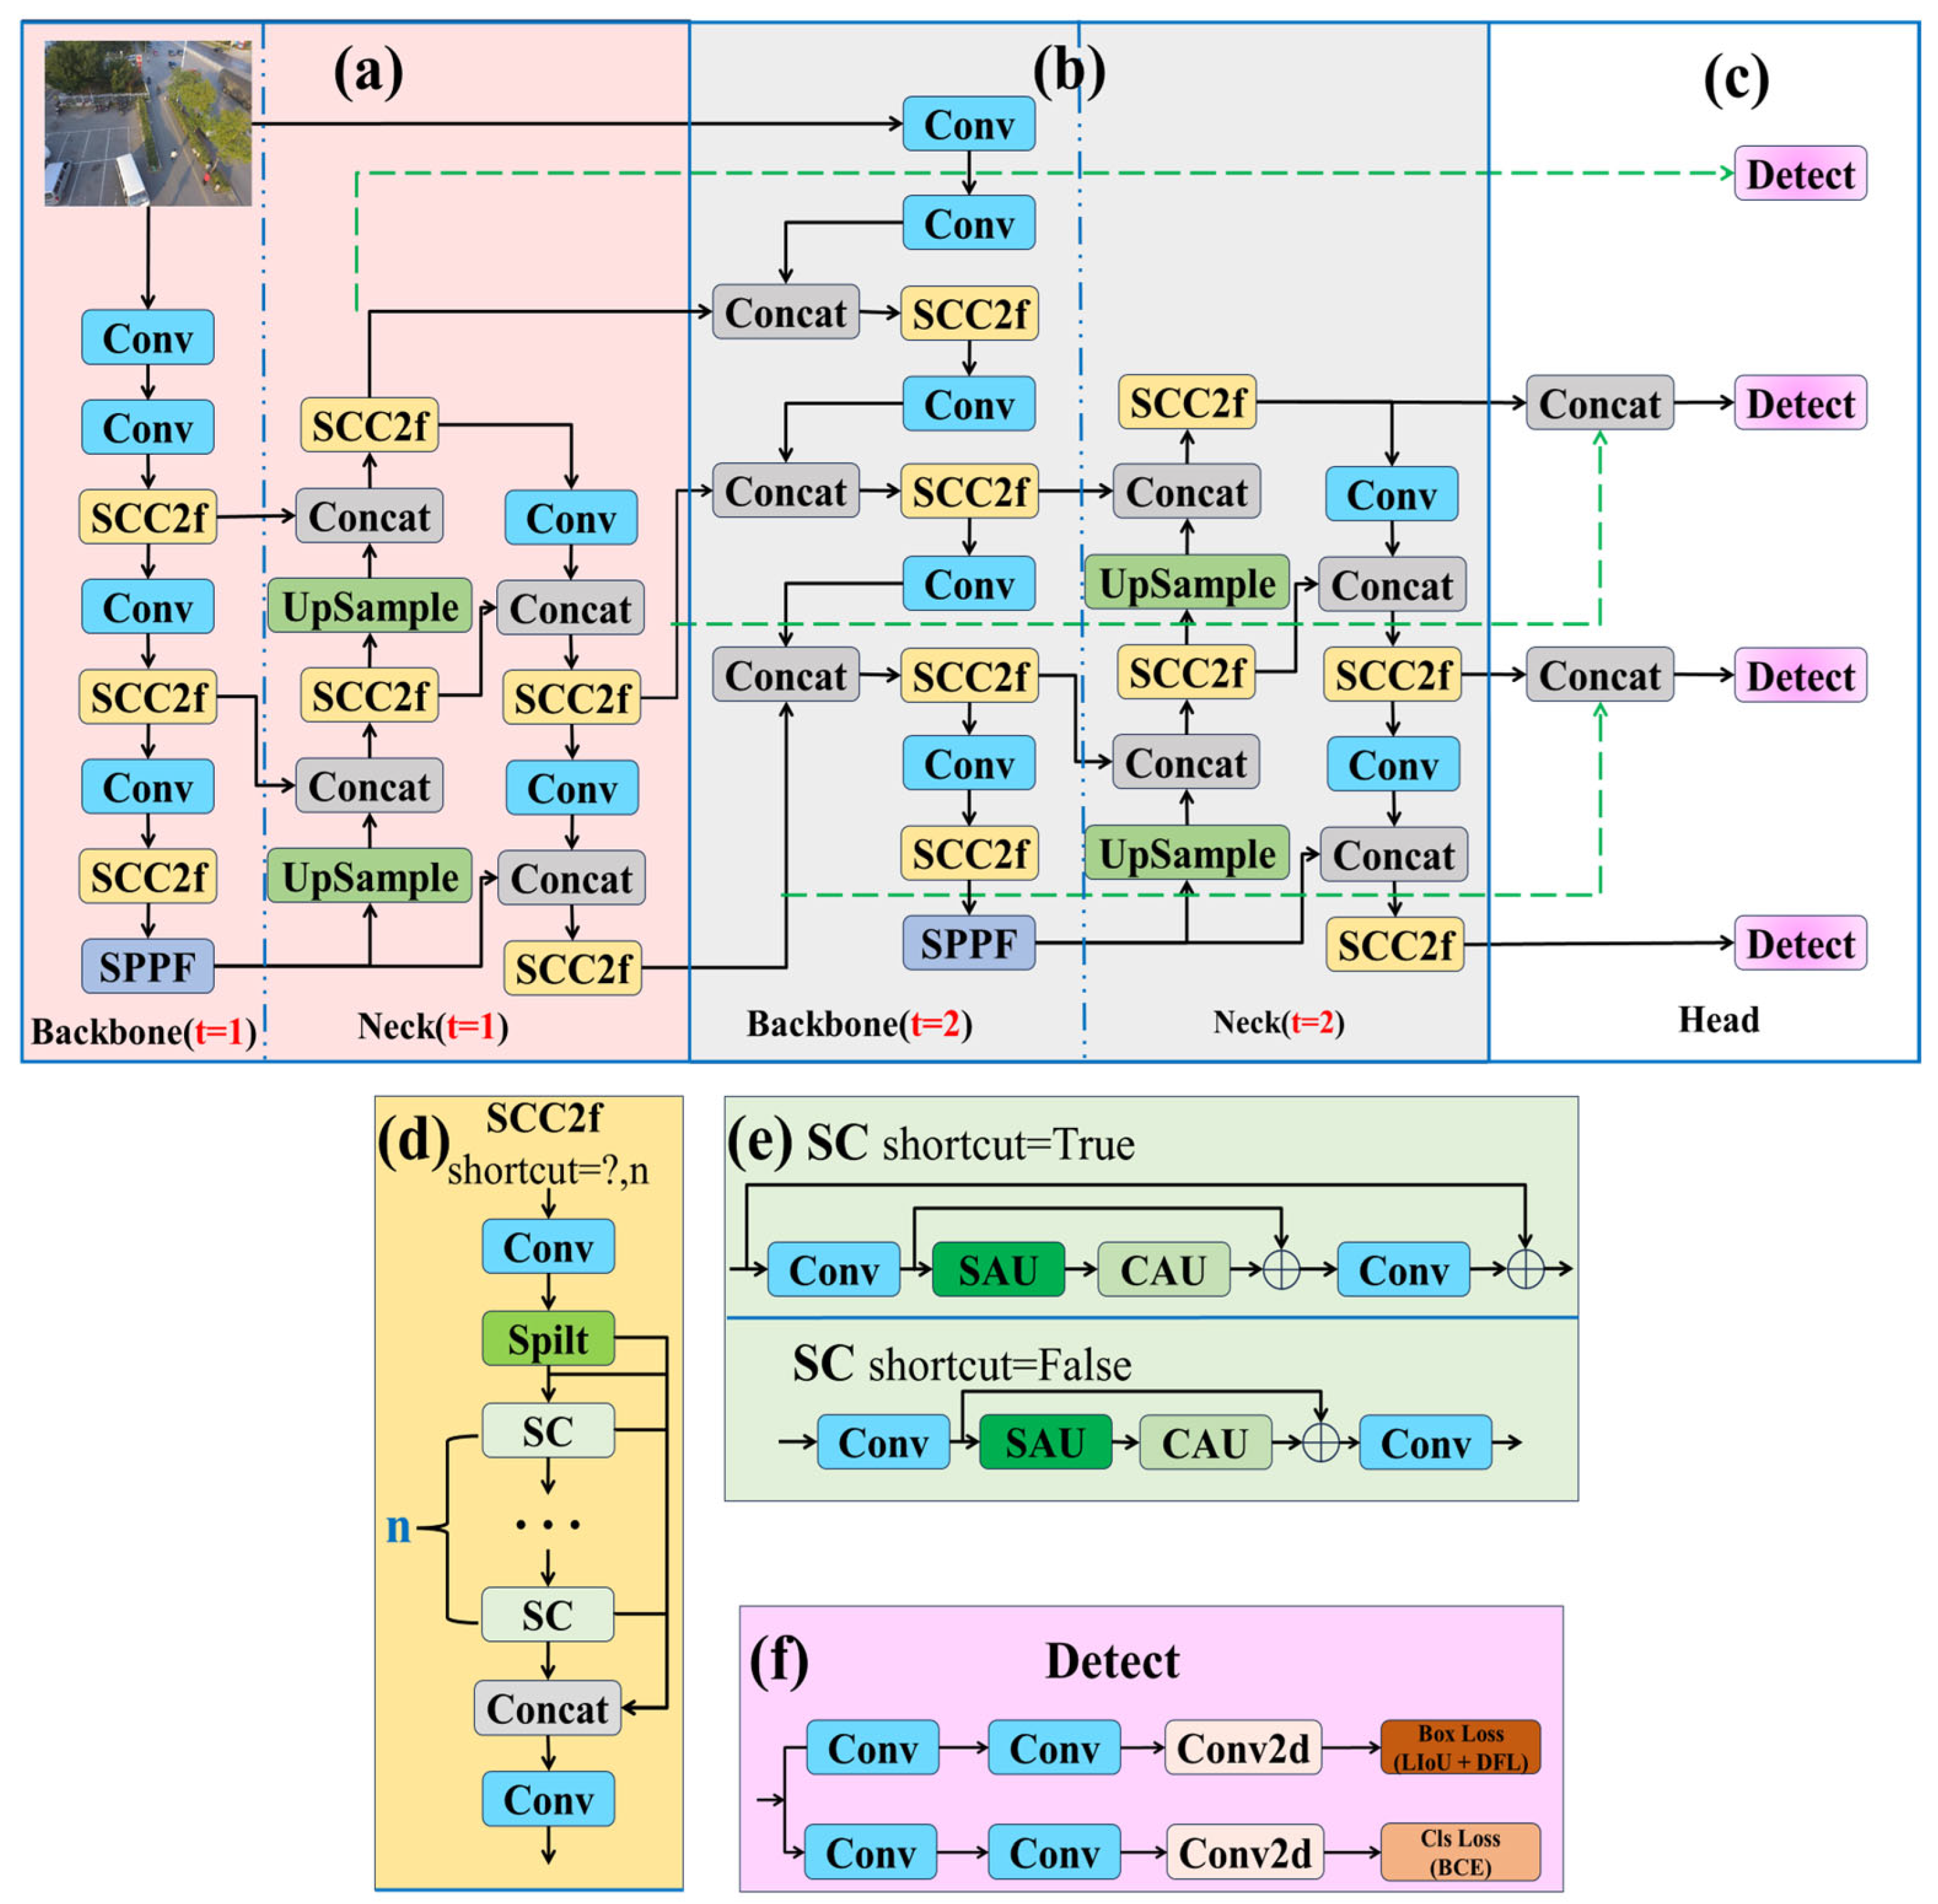
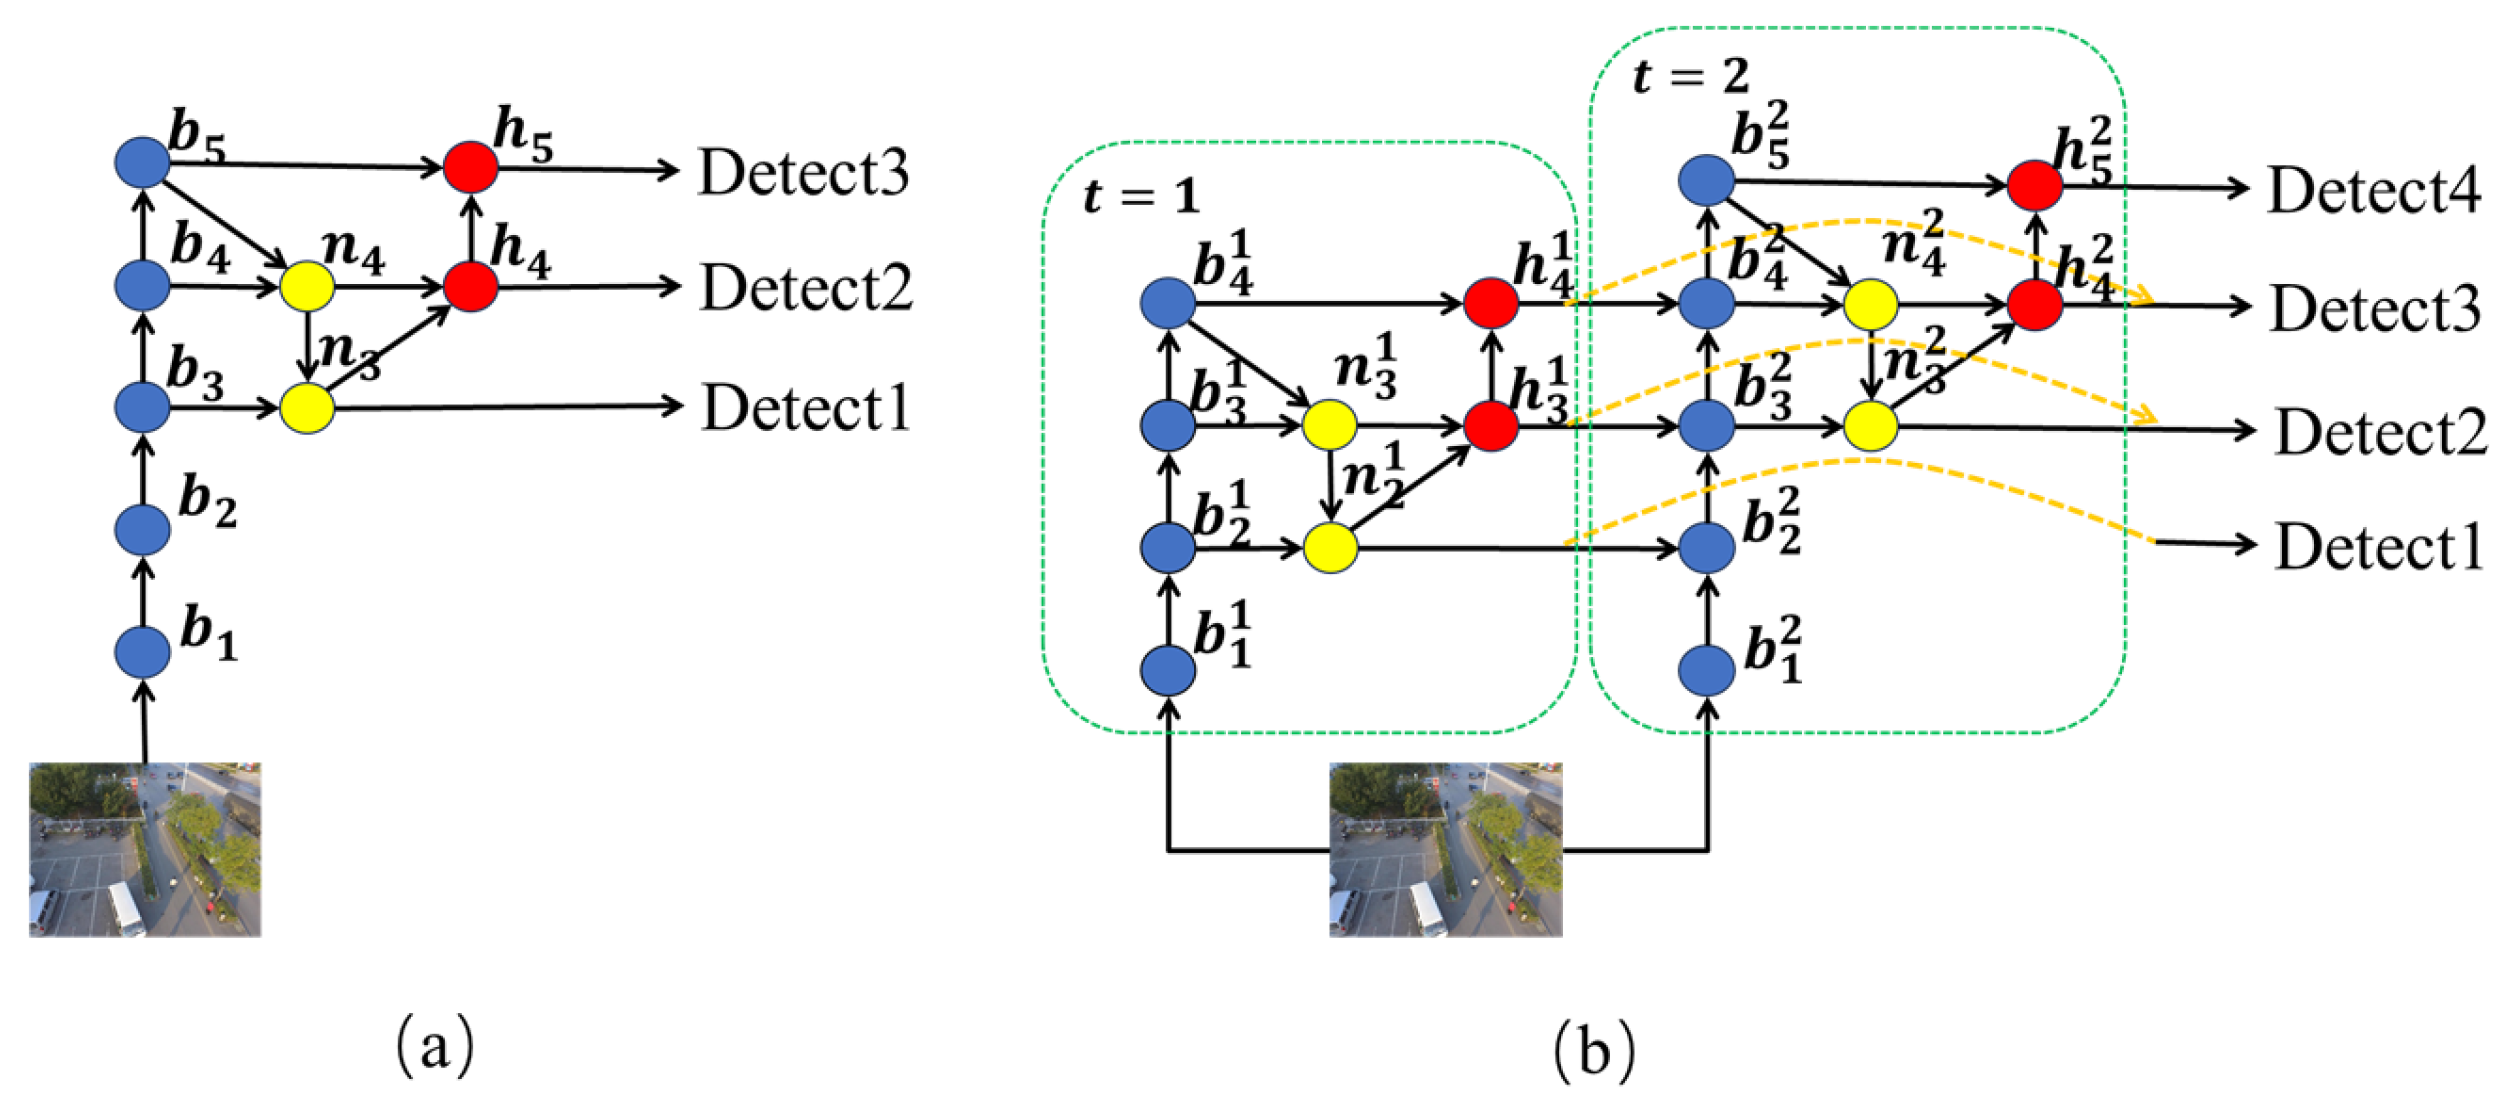
- The YOLOv8 network is enhanced with a recursive feature pyramid (RFP) structure to perform two stages of “processing” on the image—i.e., two rounds of feature extraction. During the first stage, a single downsampling operation is reduced, enabling the model to place greater emphasis on small object detection in multi-scale scenarios.
- In order to prevent feature loss during the convolution process, we designed a new attention mechanism that can supplement salient information with detailed information from both spatial and channel perspectives, thus enabling feature recovery during the convolution process.
- A new bounding box loss function is proposed by incorporating angle loss, accelerating the regression of predicted bounding boxes.
2. Related Works
2.1. YOLOv8 Detection Algorithm
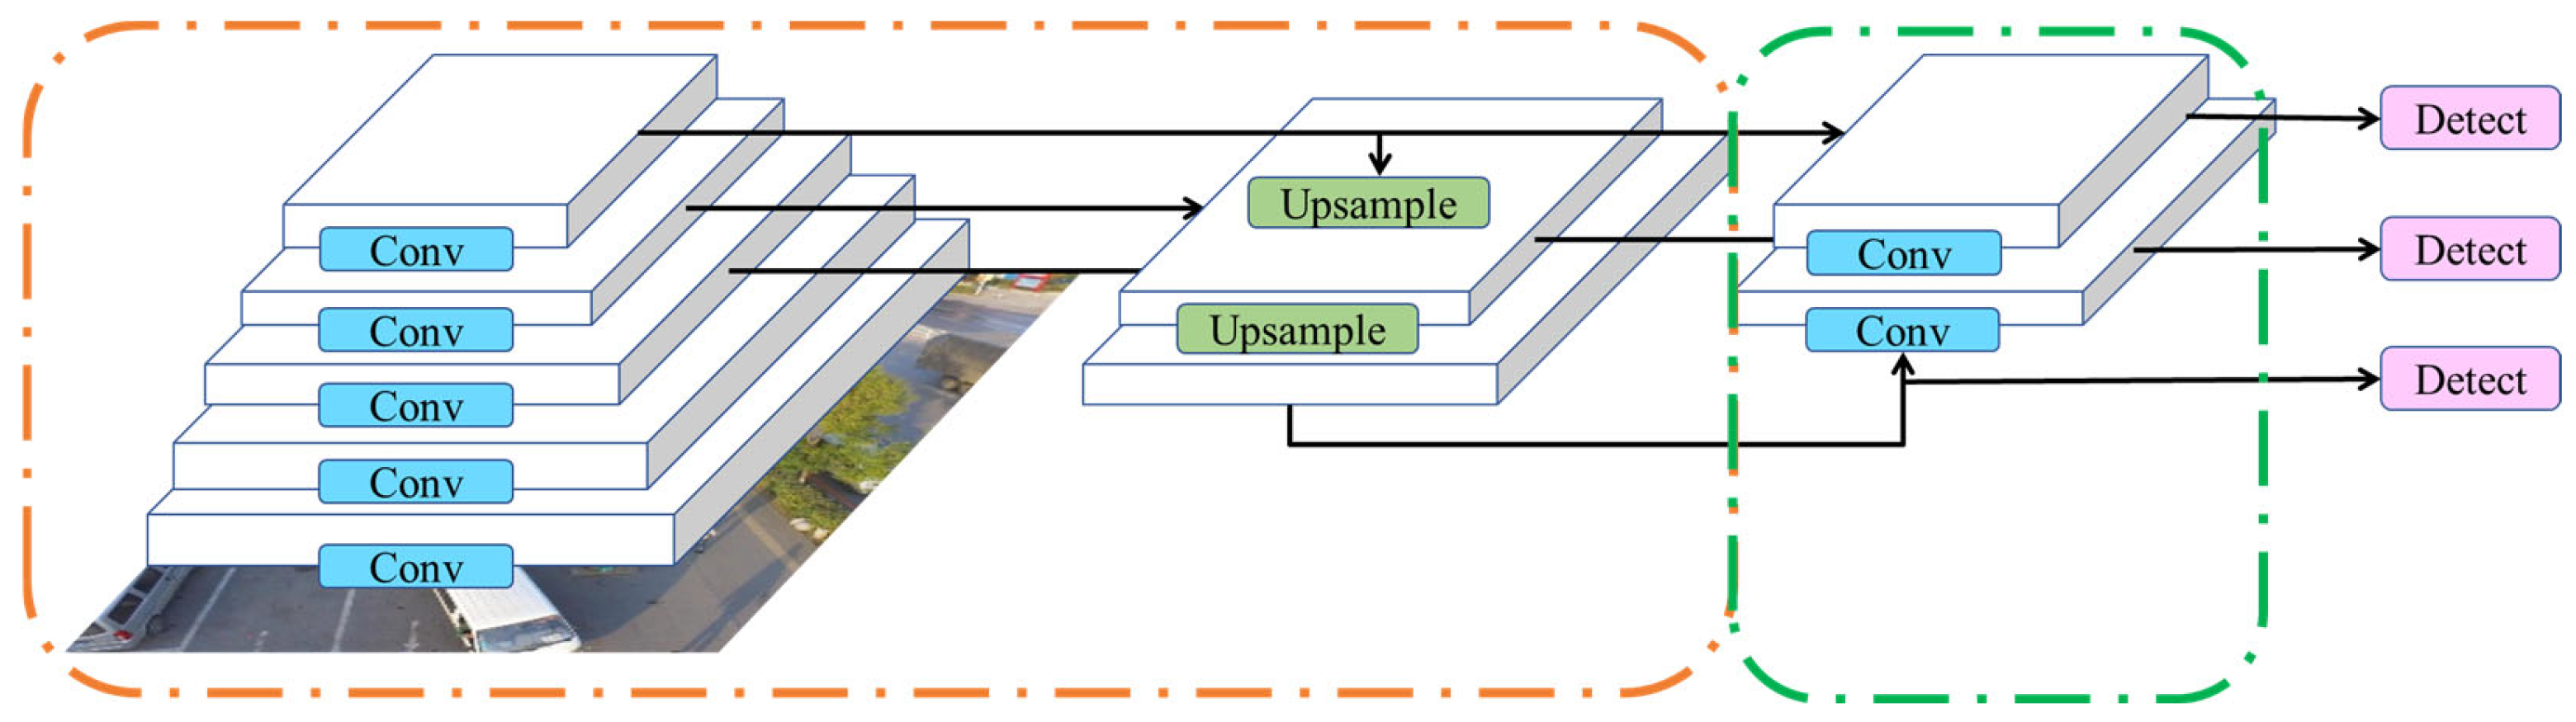
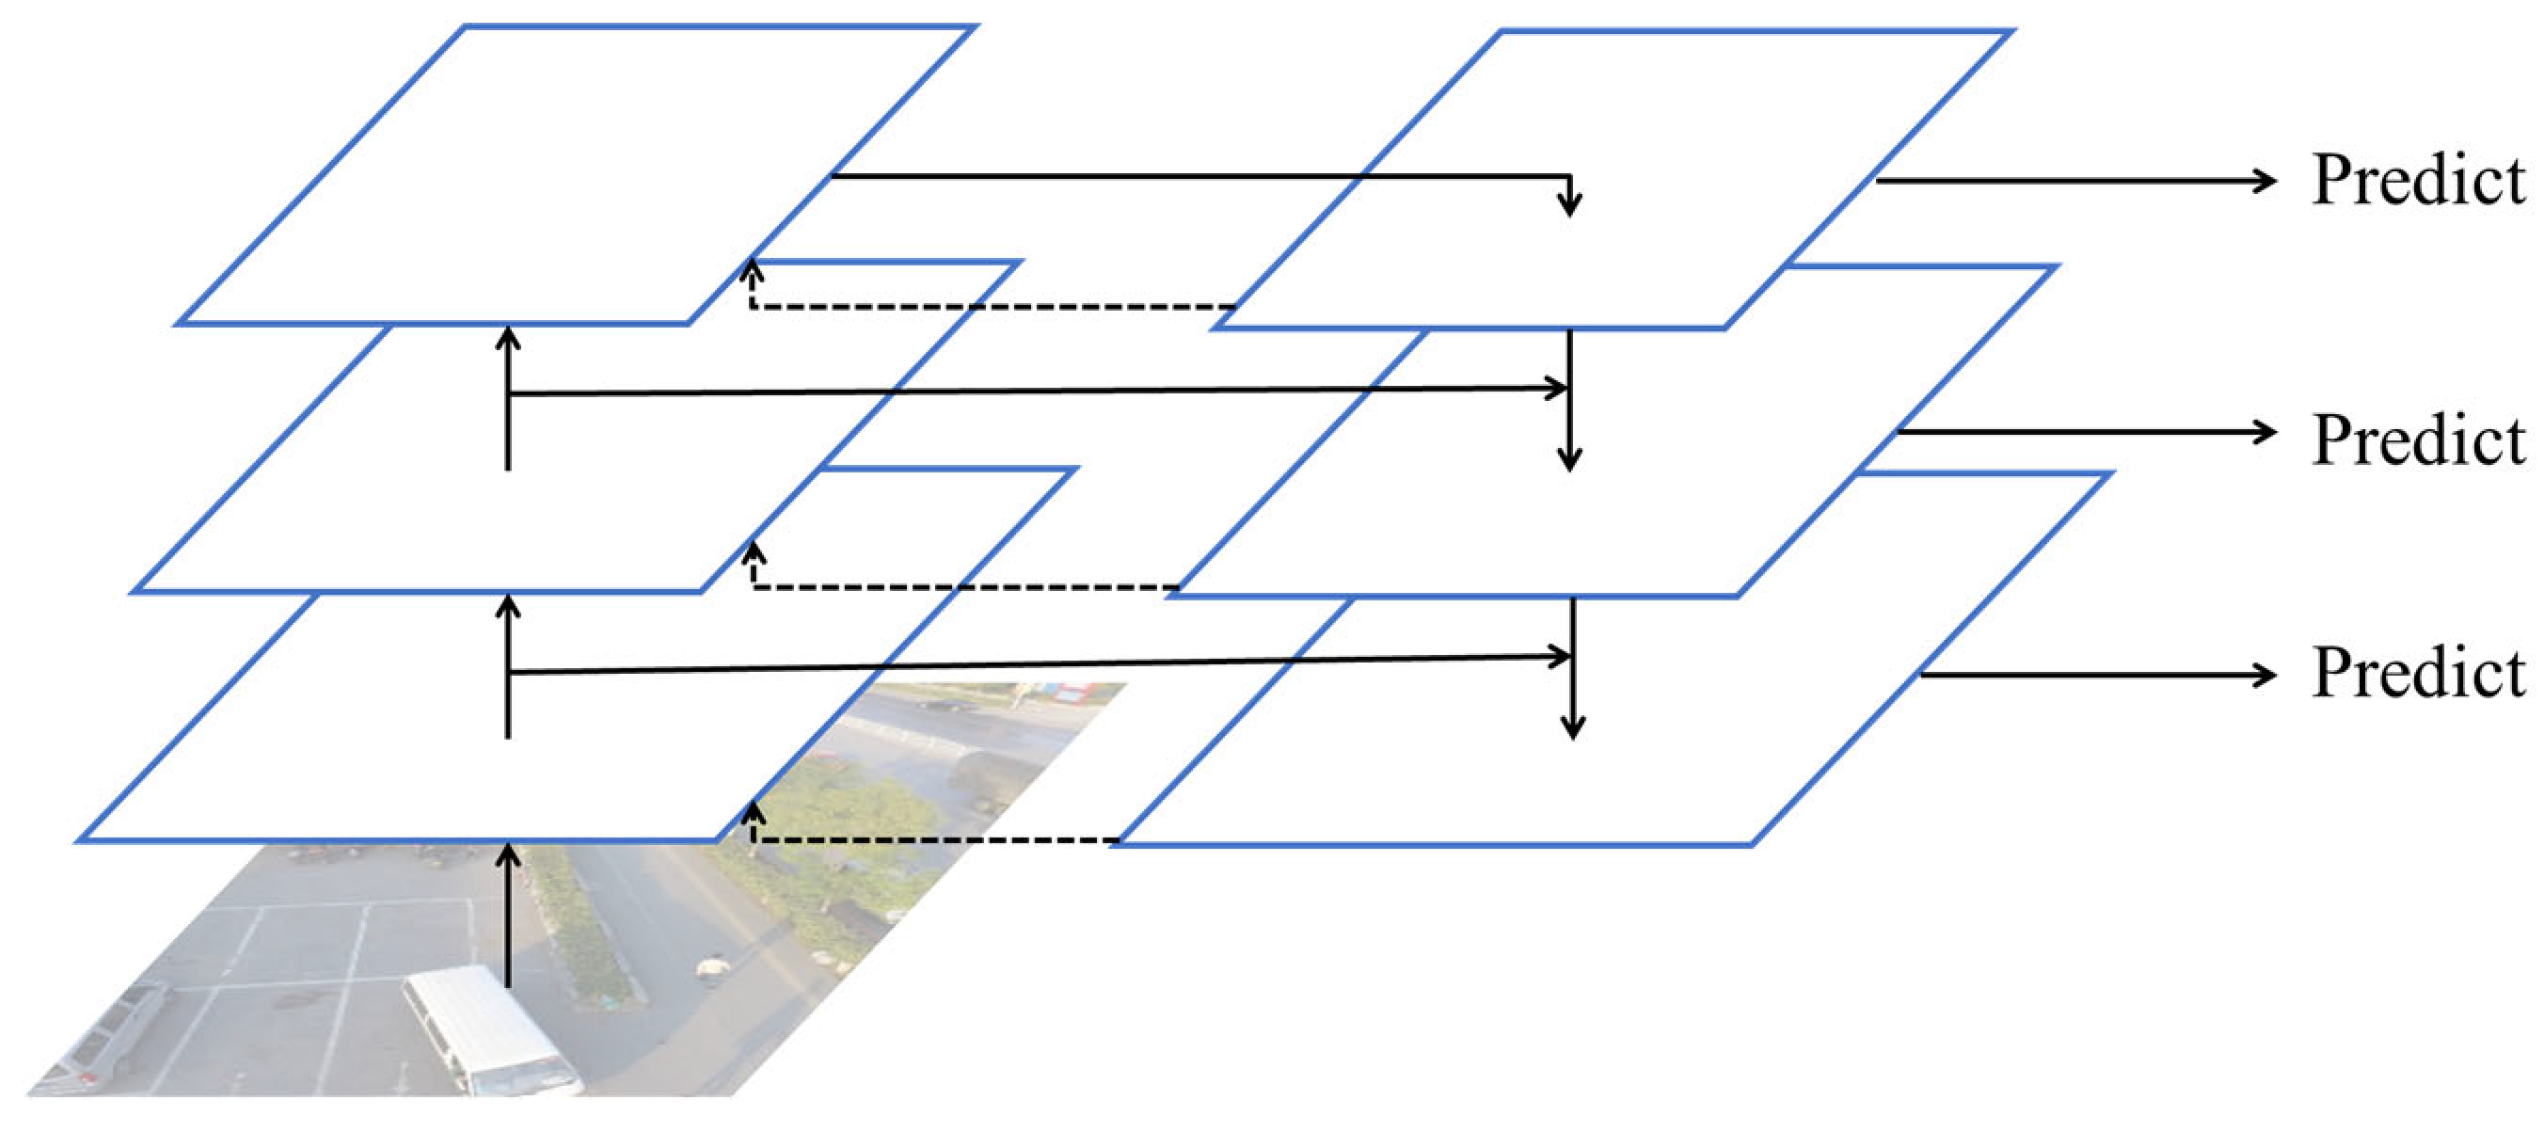
2.2. Recursive Feature Pyramid
3. Method
3.1. Multi-Scale Feature Fusion
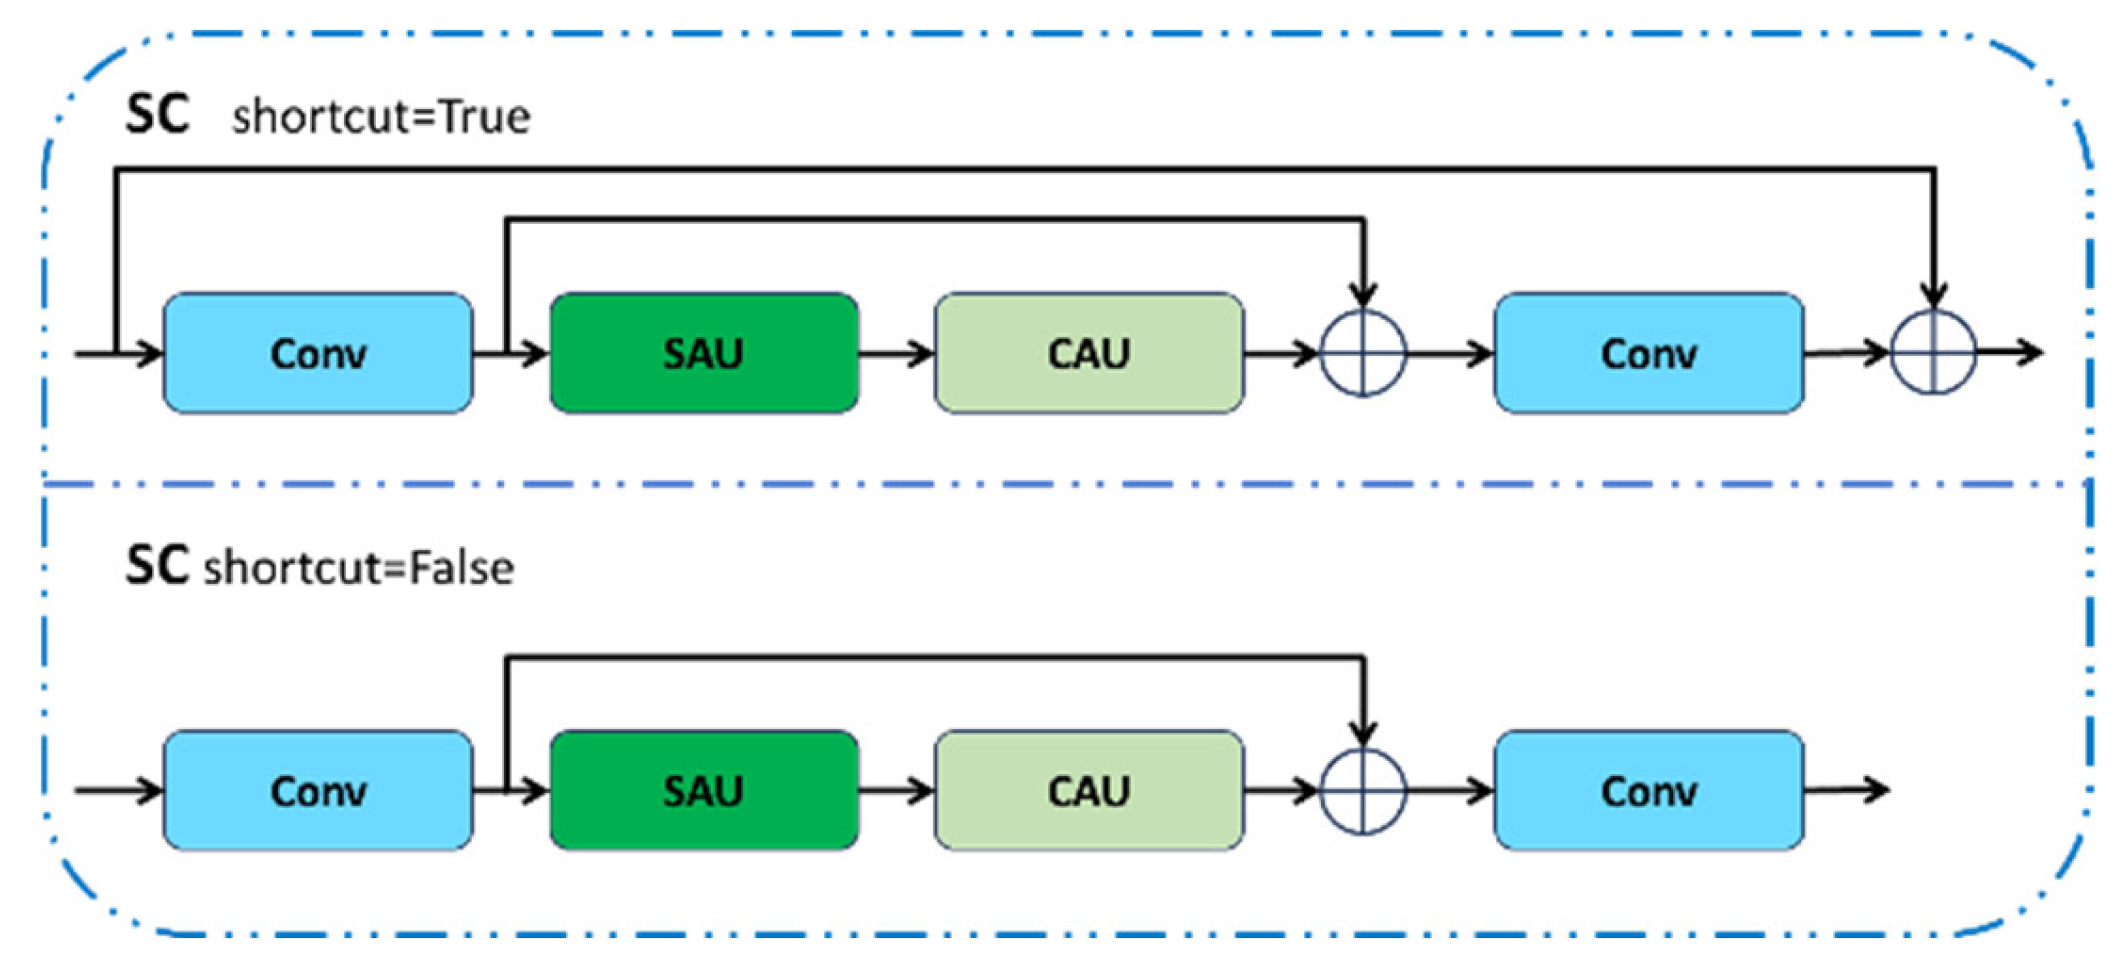
3.2. SC Attention Mechanism
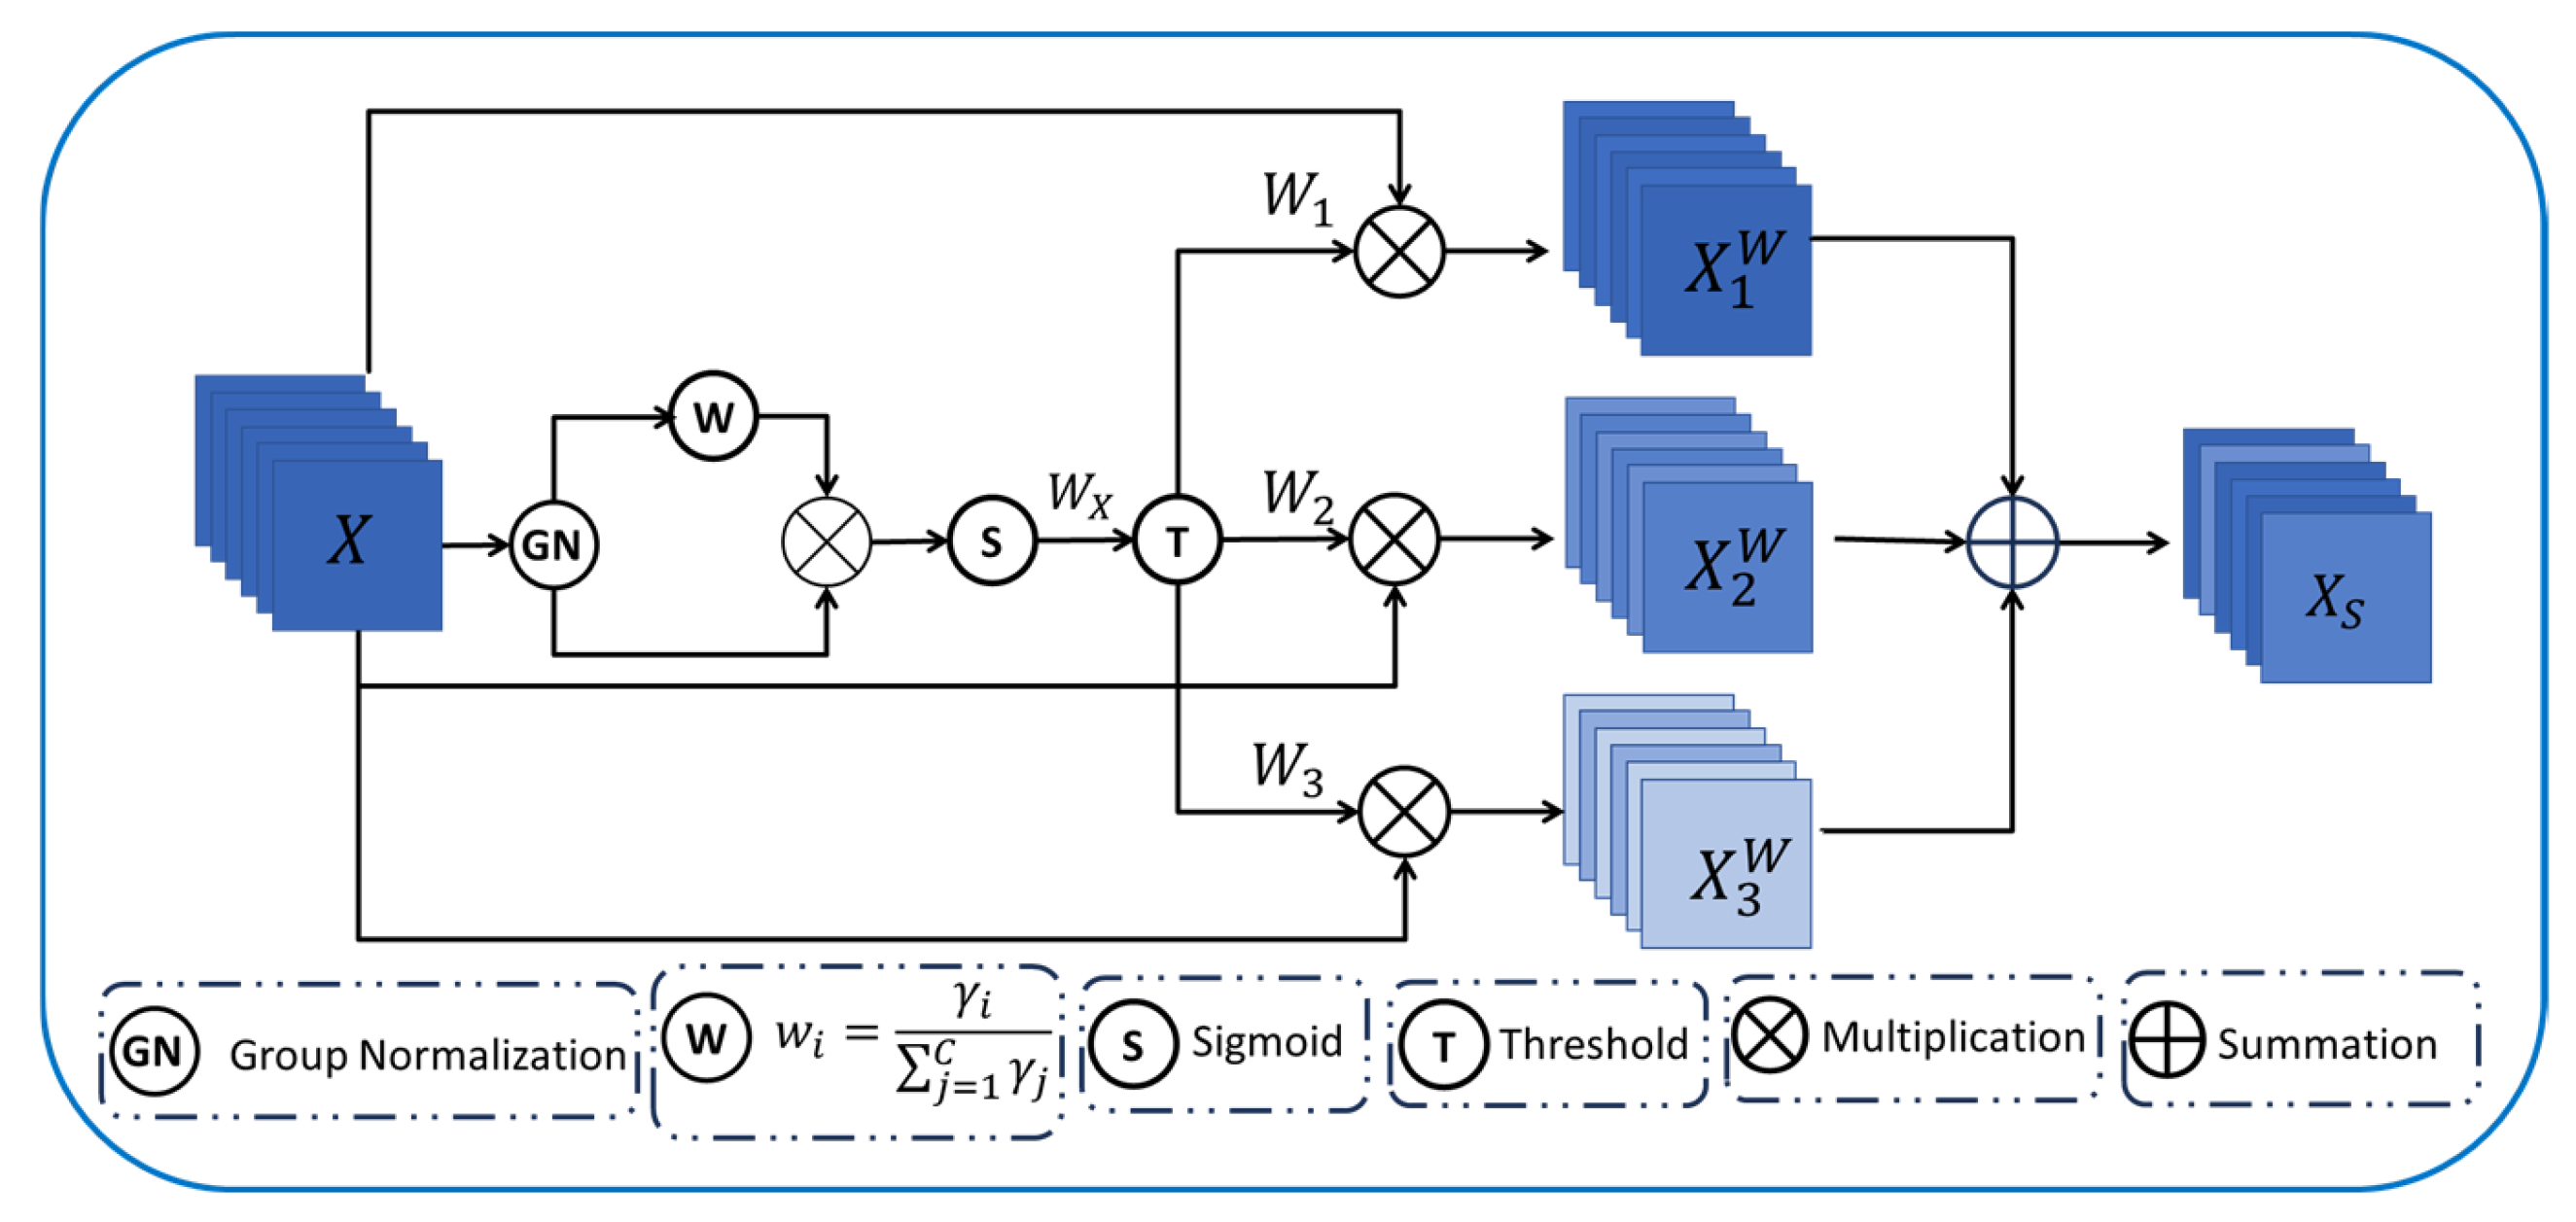
3.2.1. Spatial Attention Unit
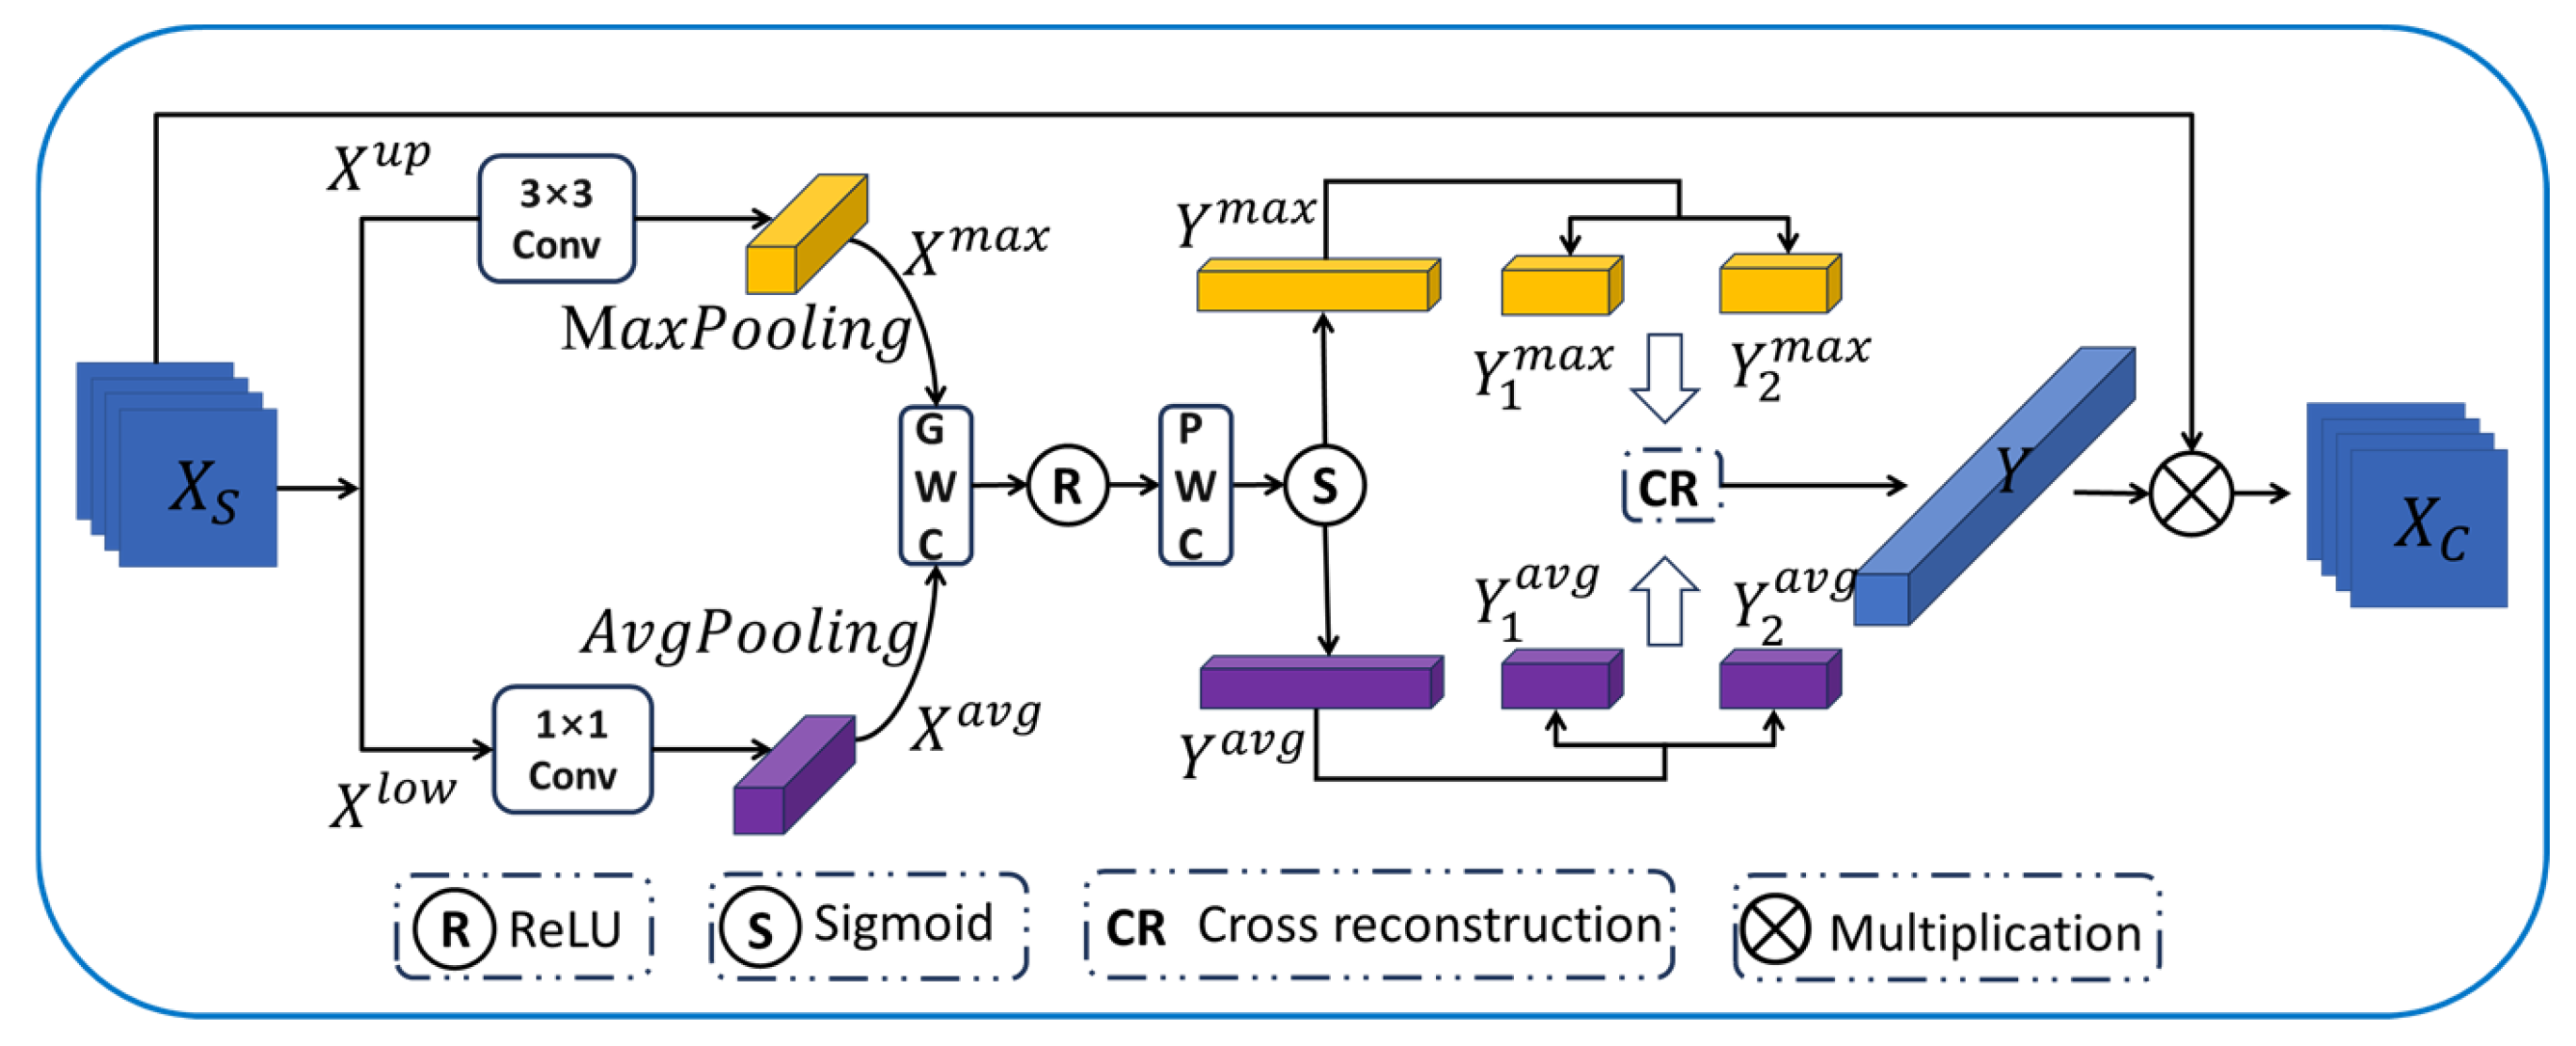
3.2.2. Channel Attention Unit
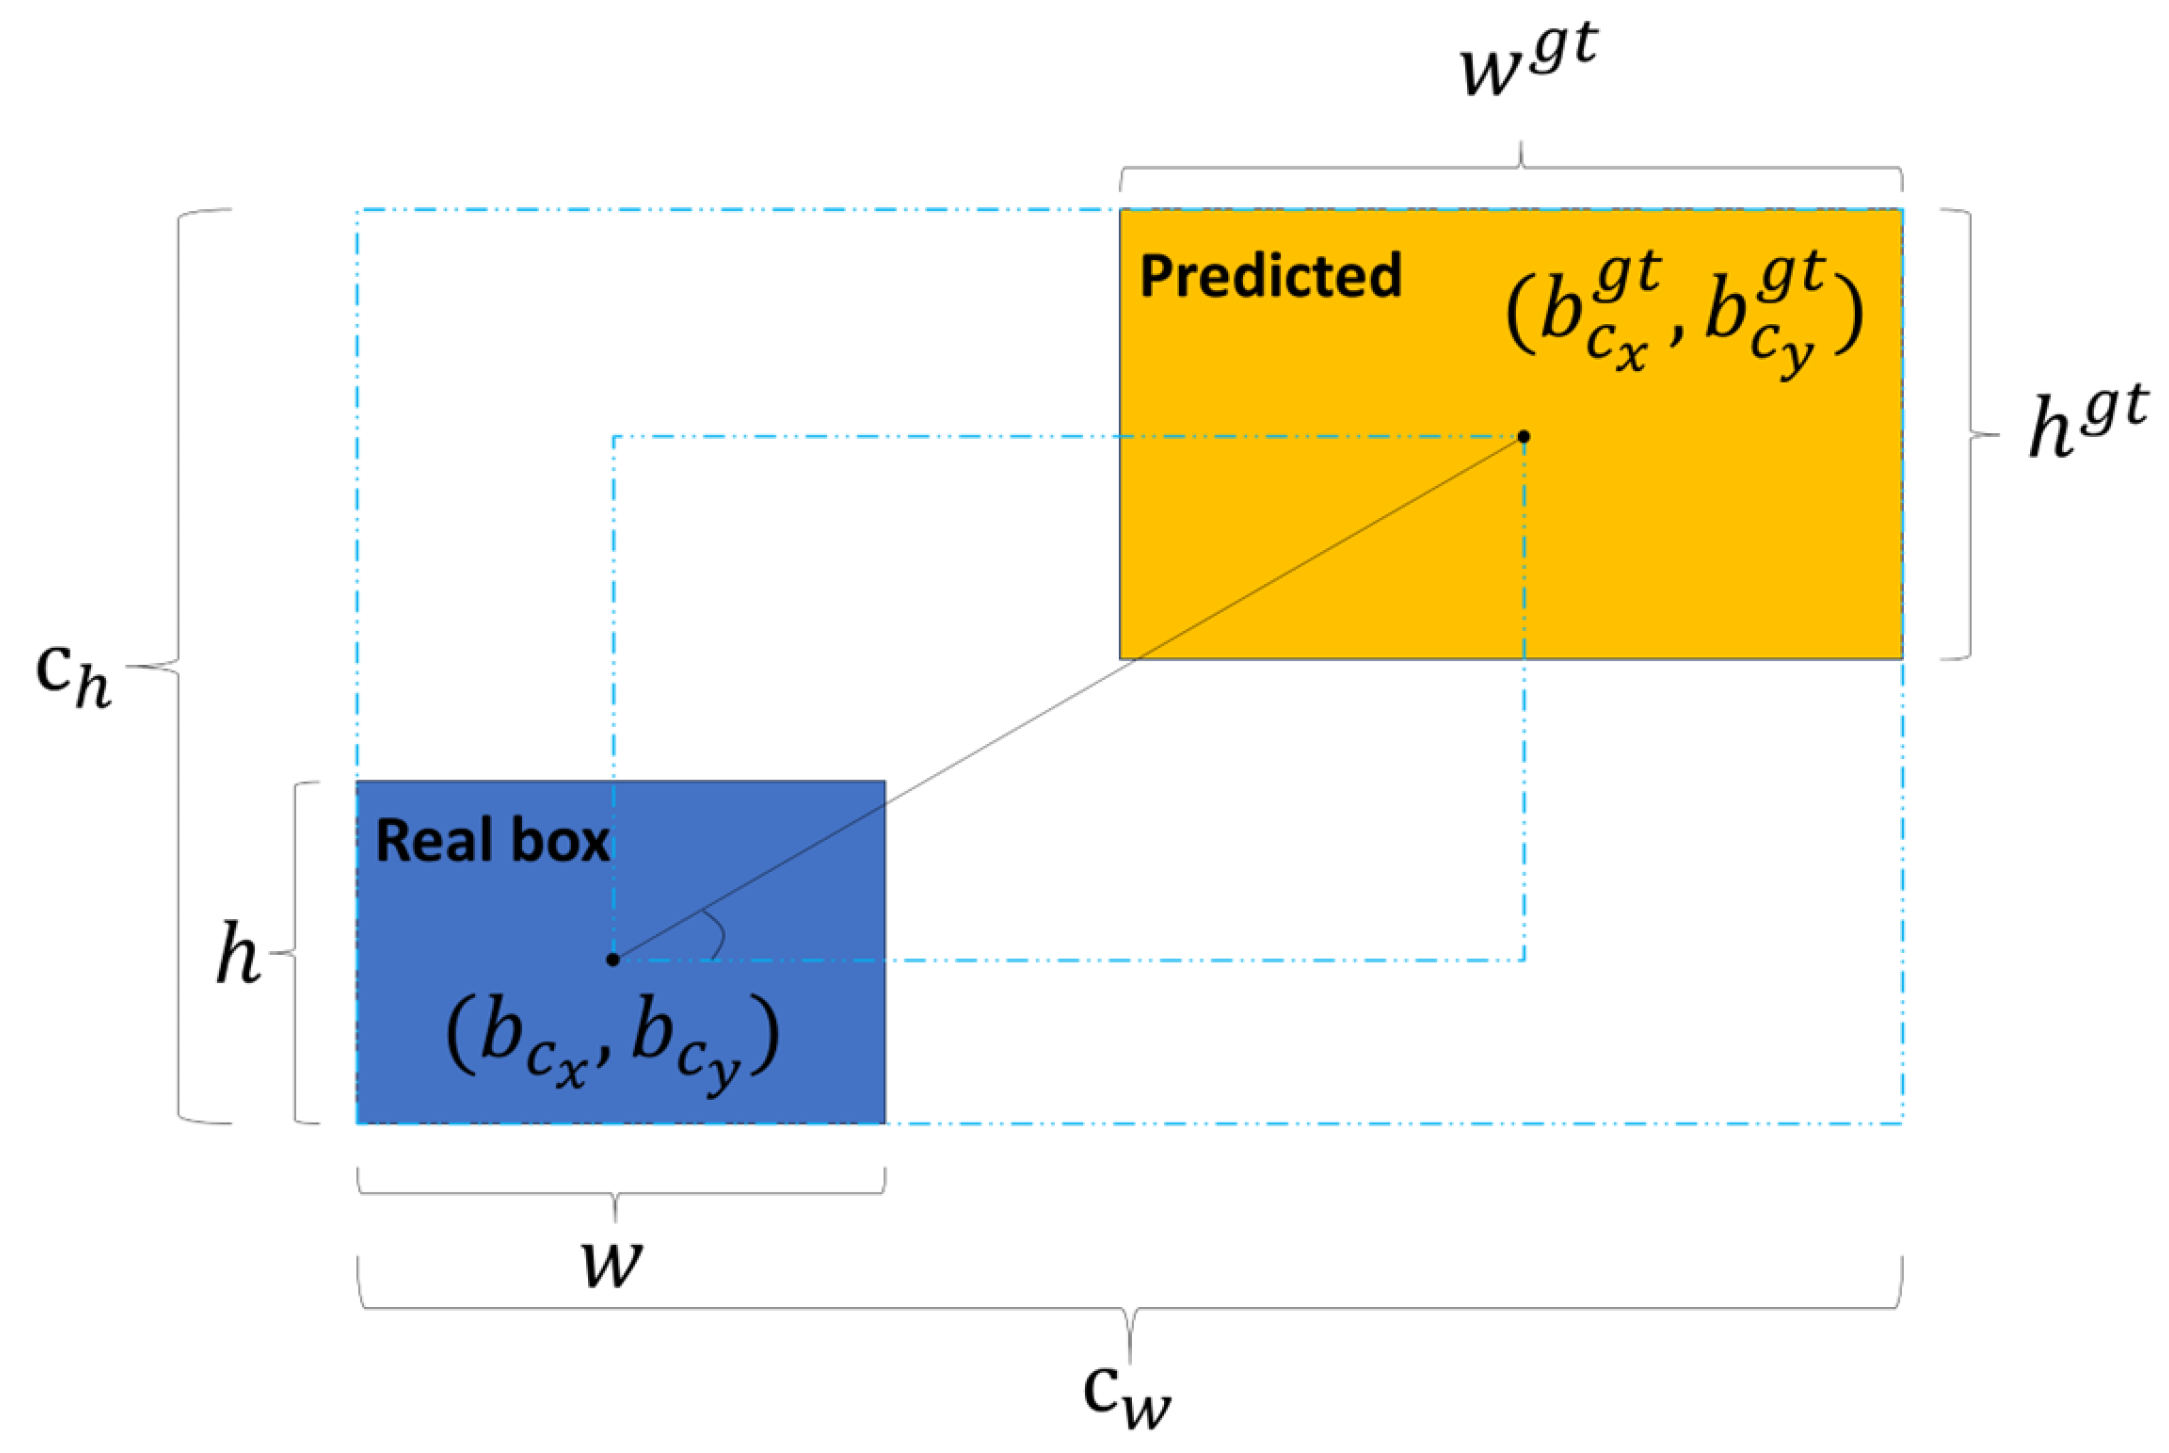
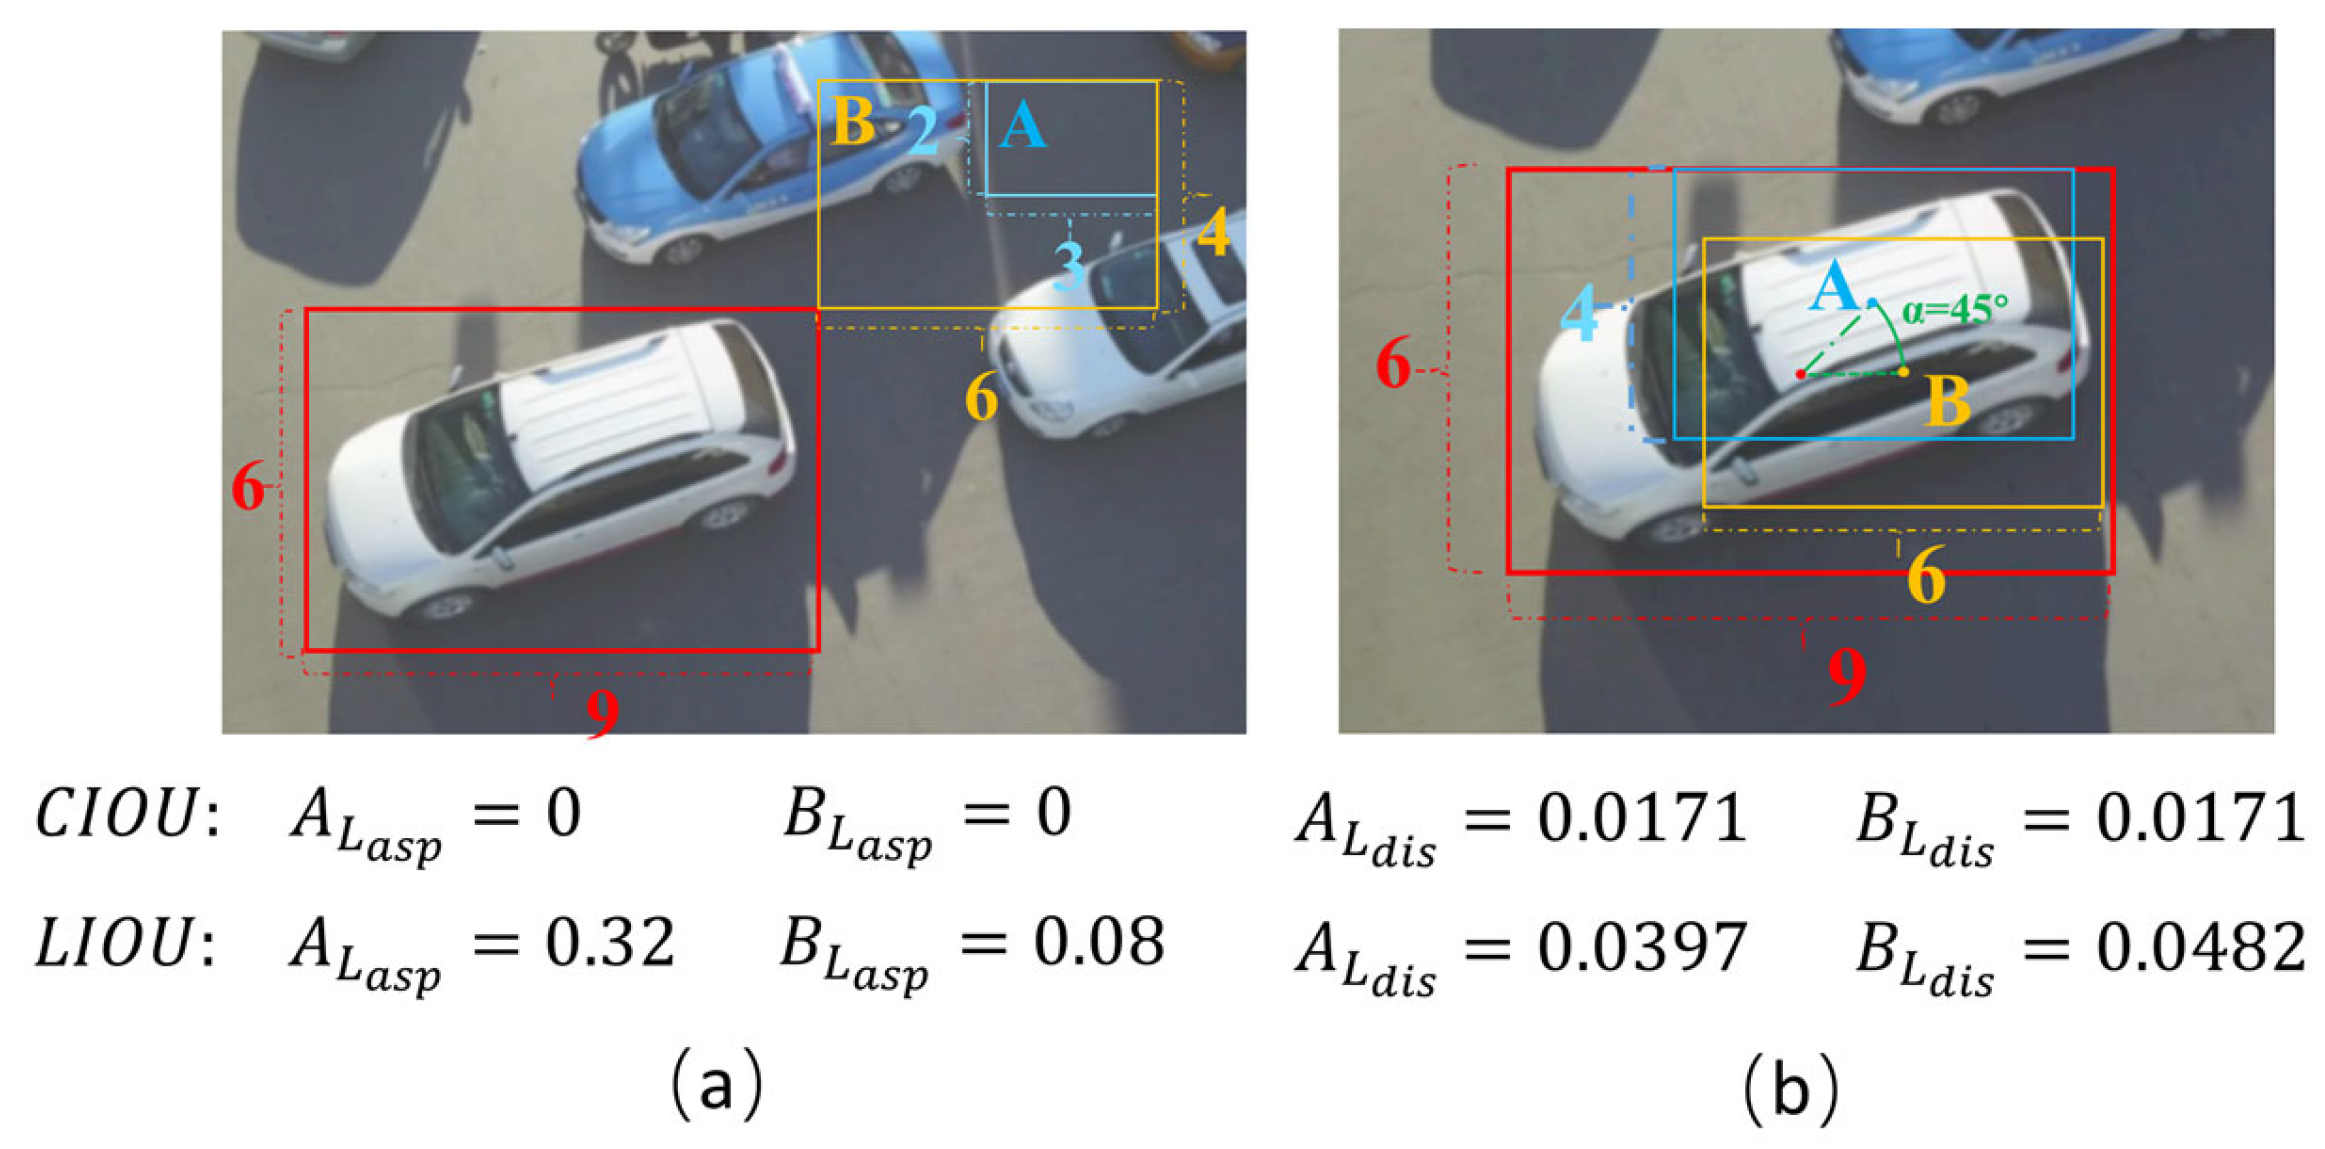
3.3. LIOU Loss Function
- When the predicted box has the same aspect ratio as the ground truth box, but with differing width and height values, the penalty term does not accurately reflect the true discrepancy between the two boxes.
- The gradient of height and width are calculated as shown in Equations (13) and (14).
4. Experiments
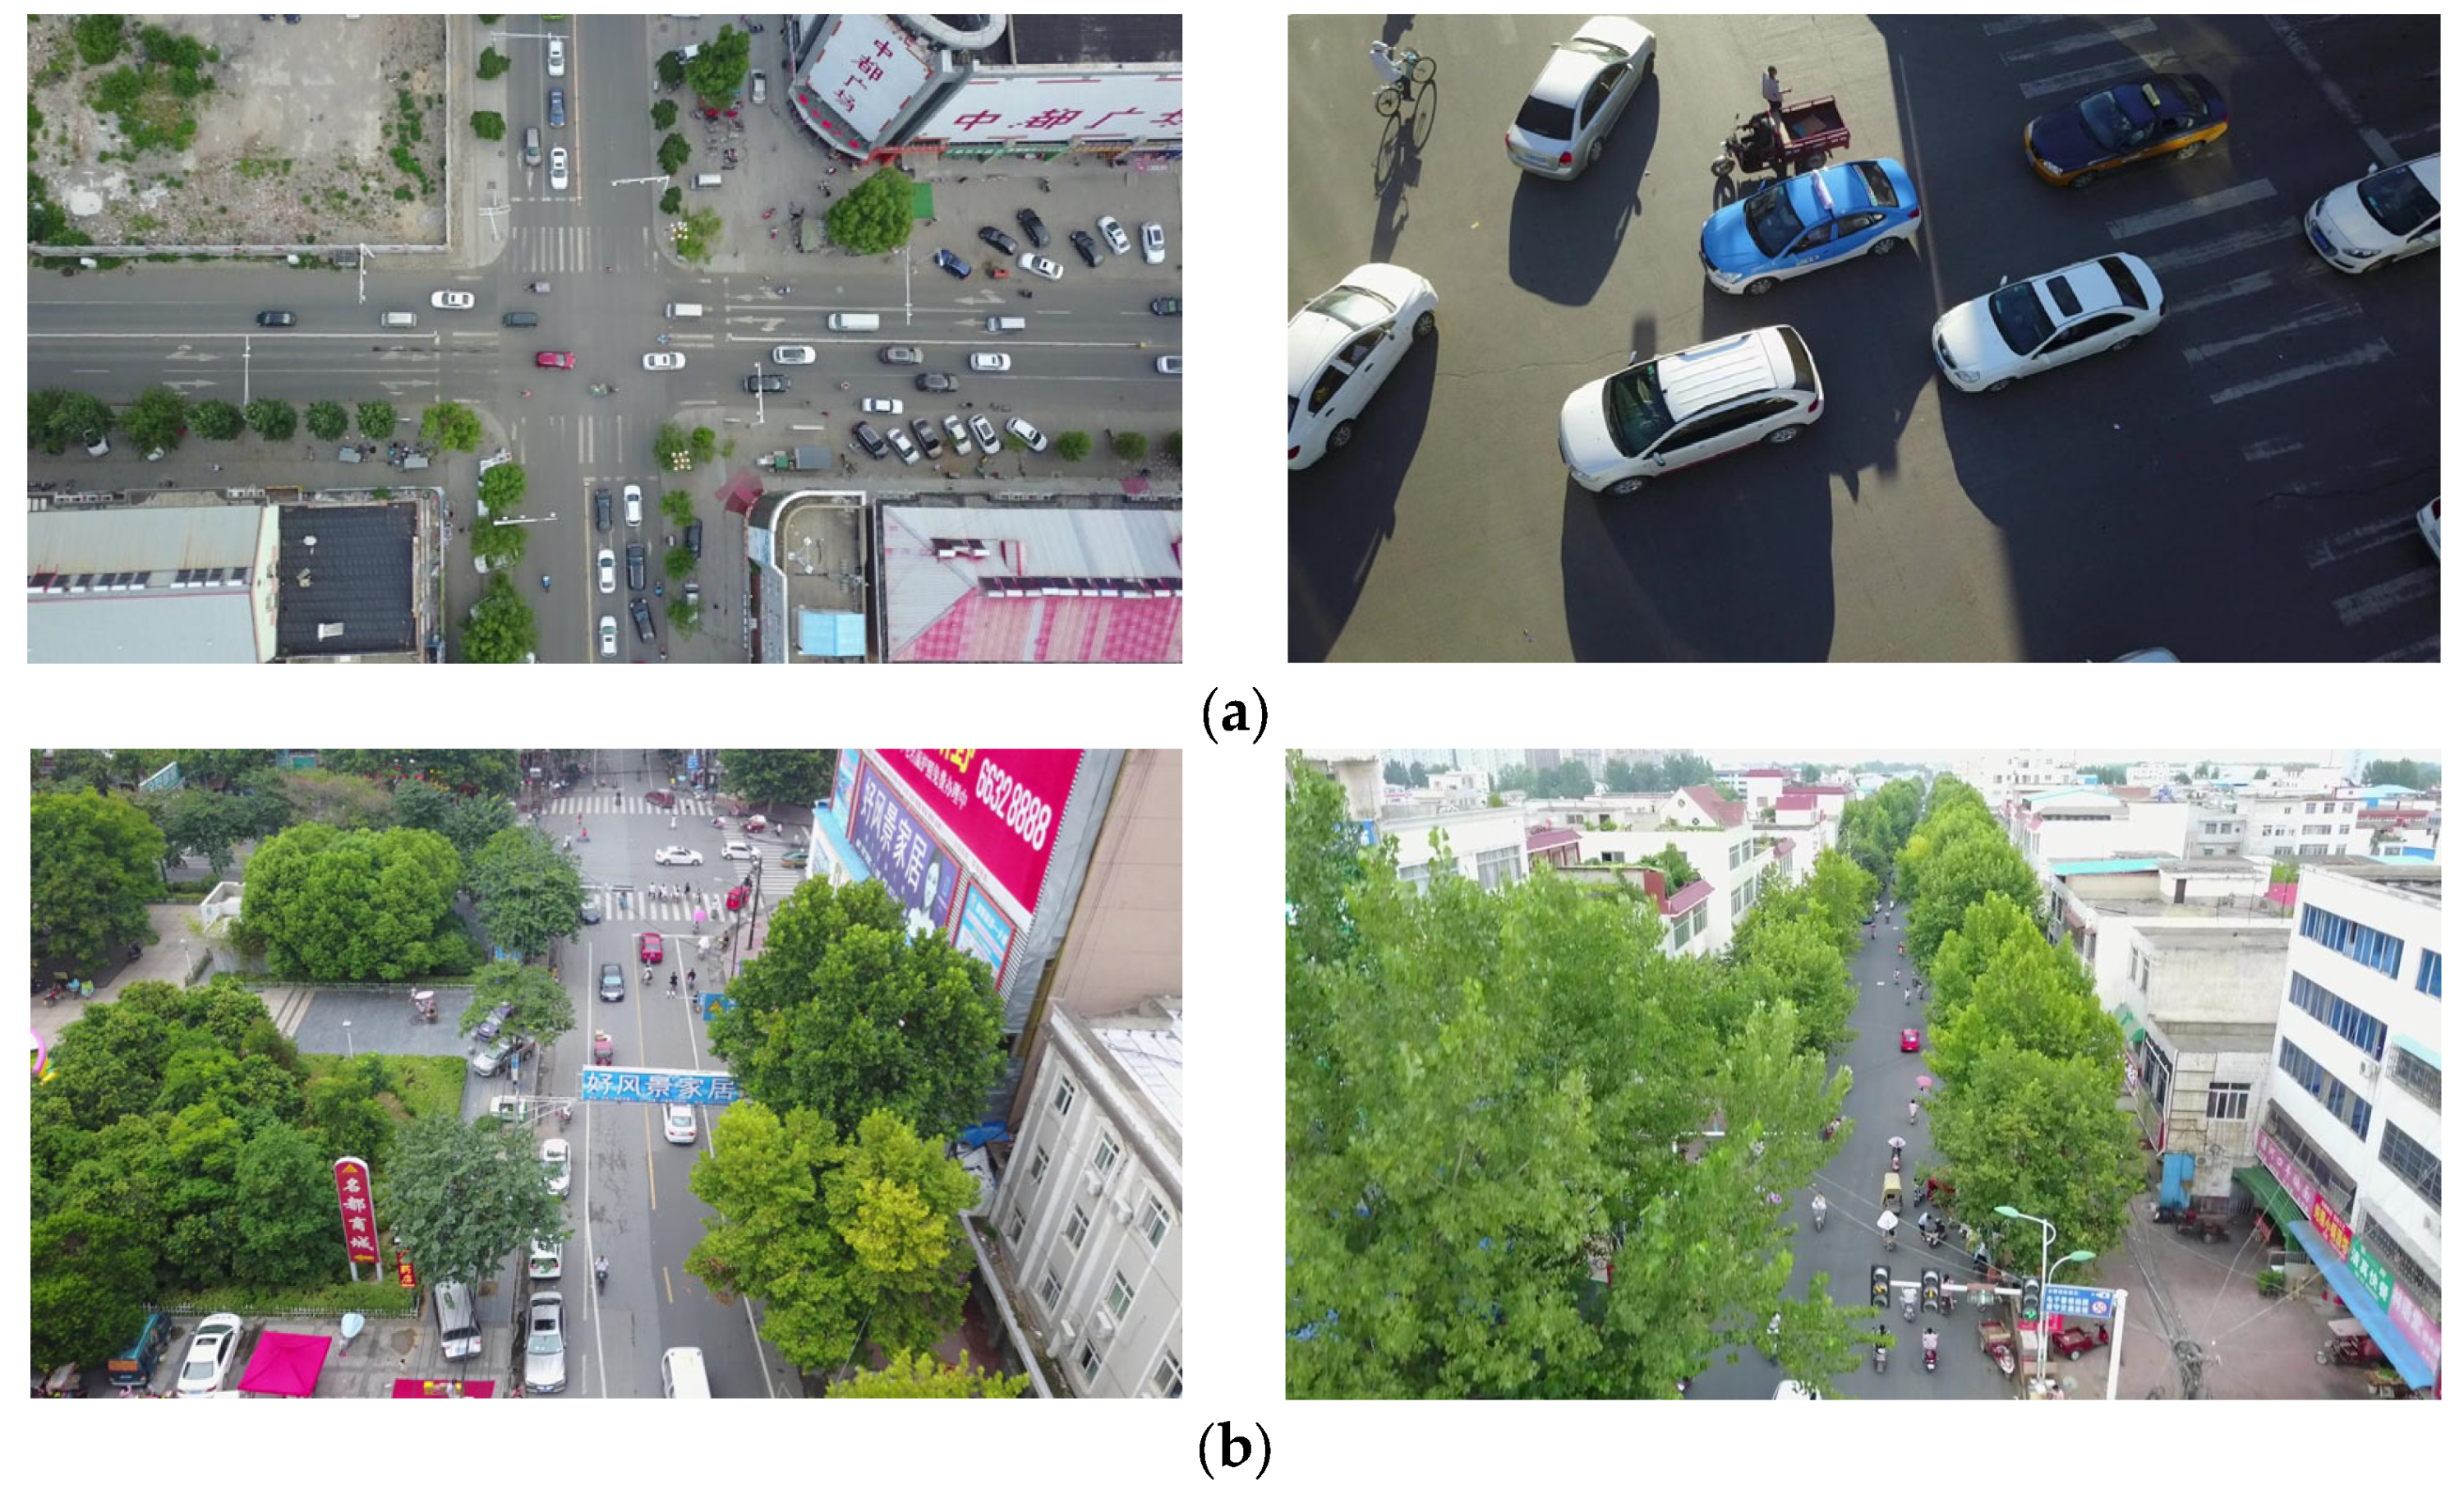
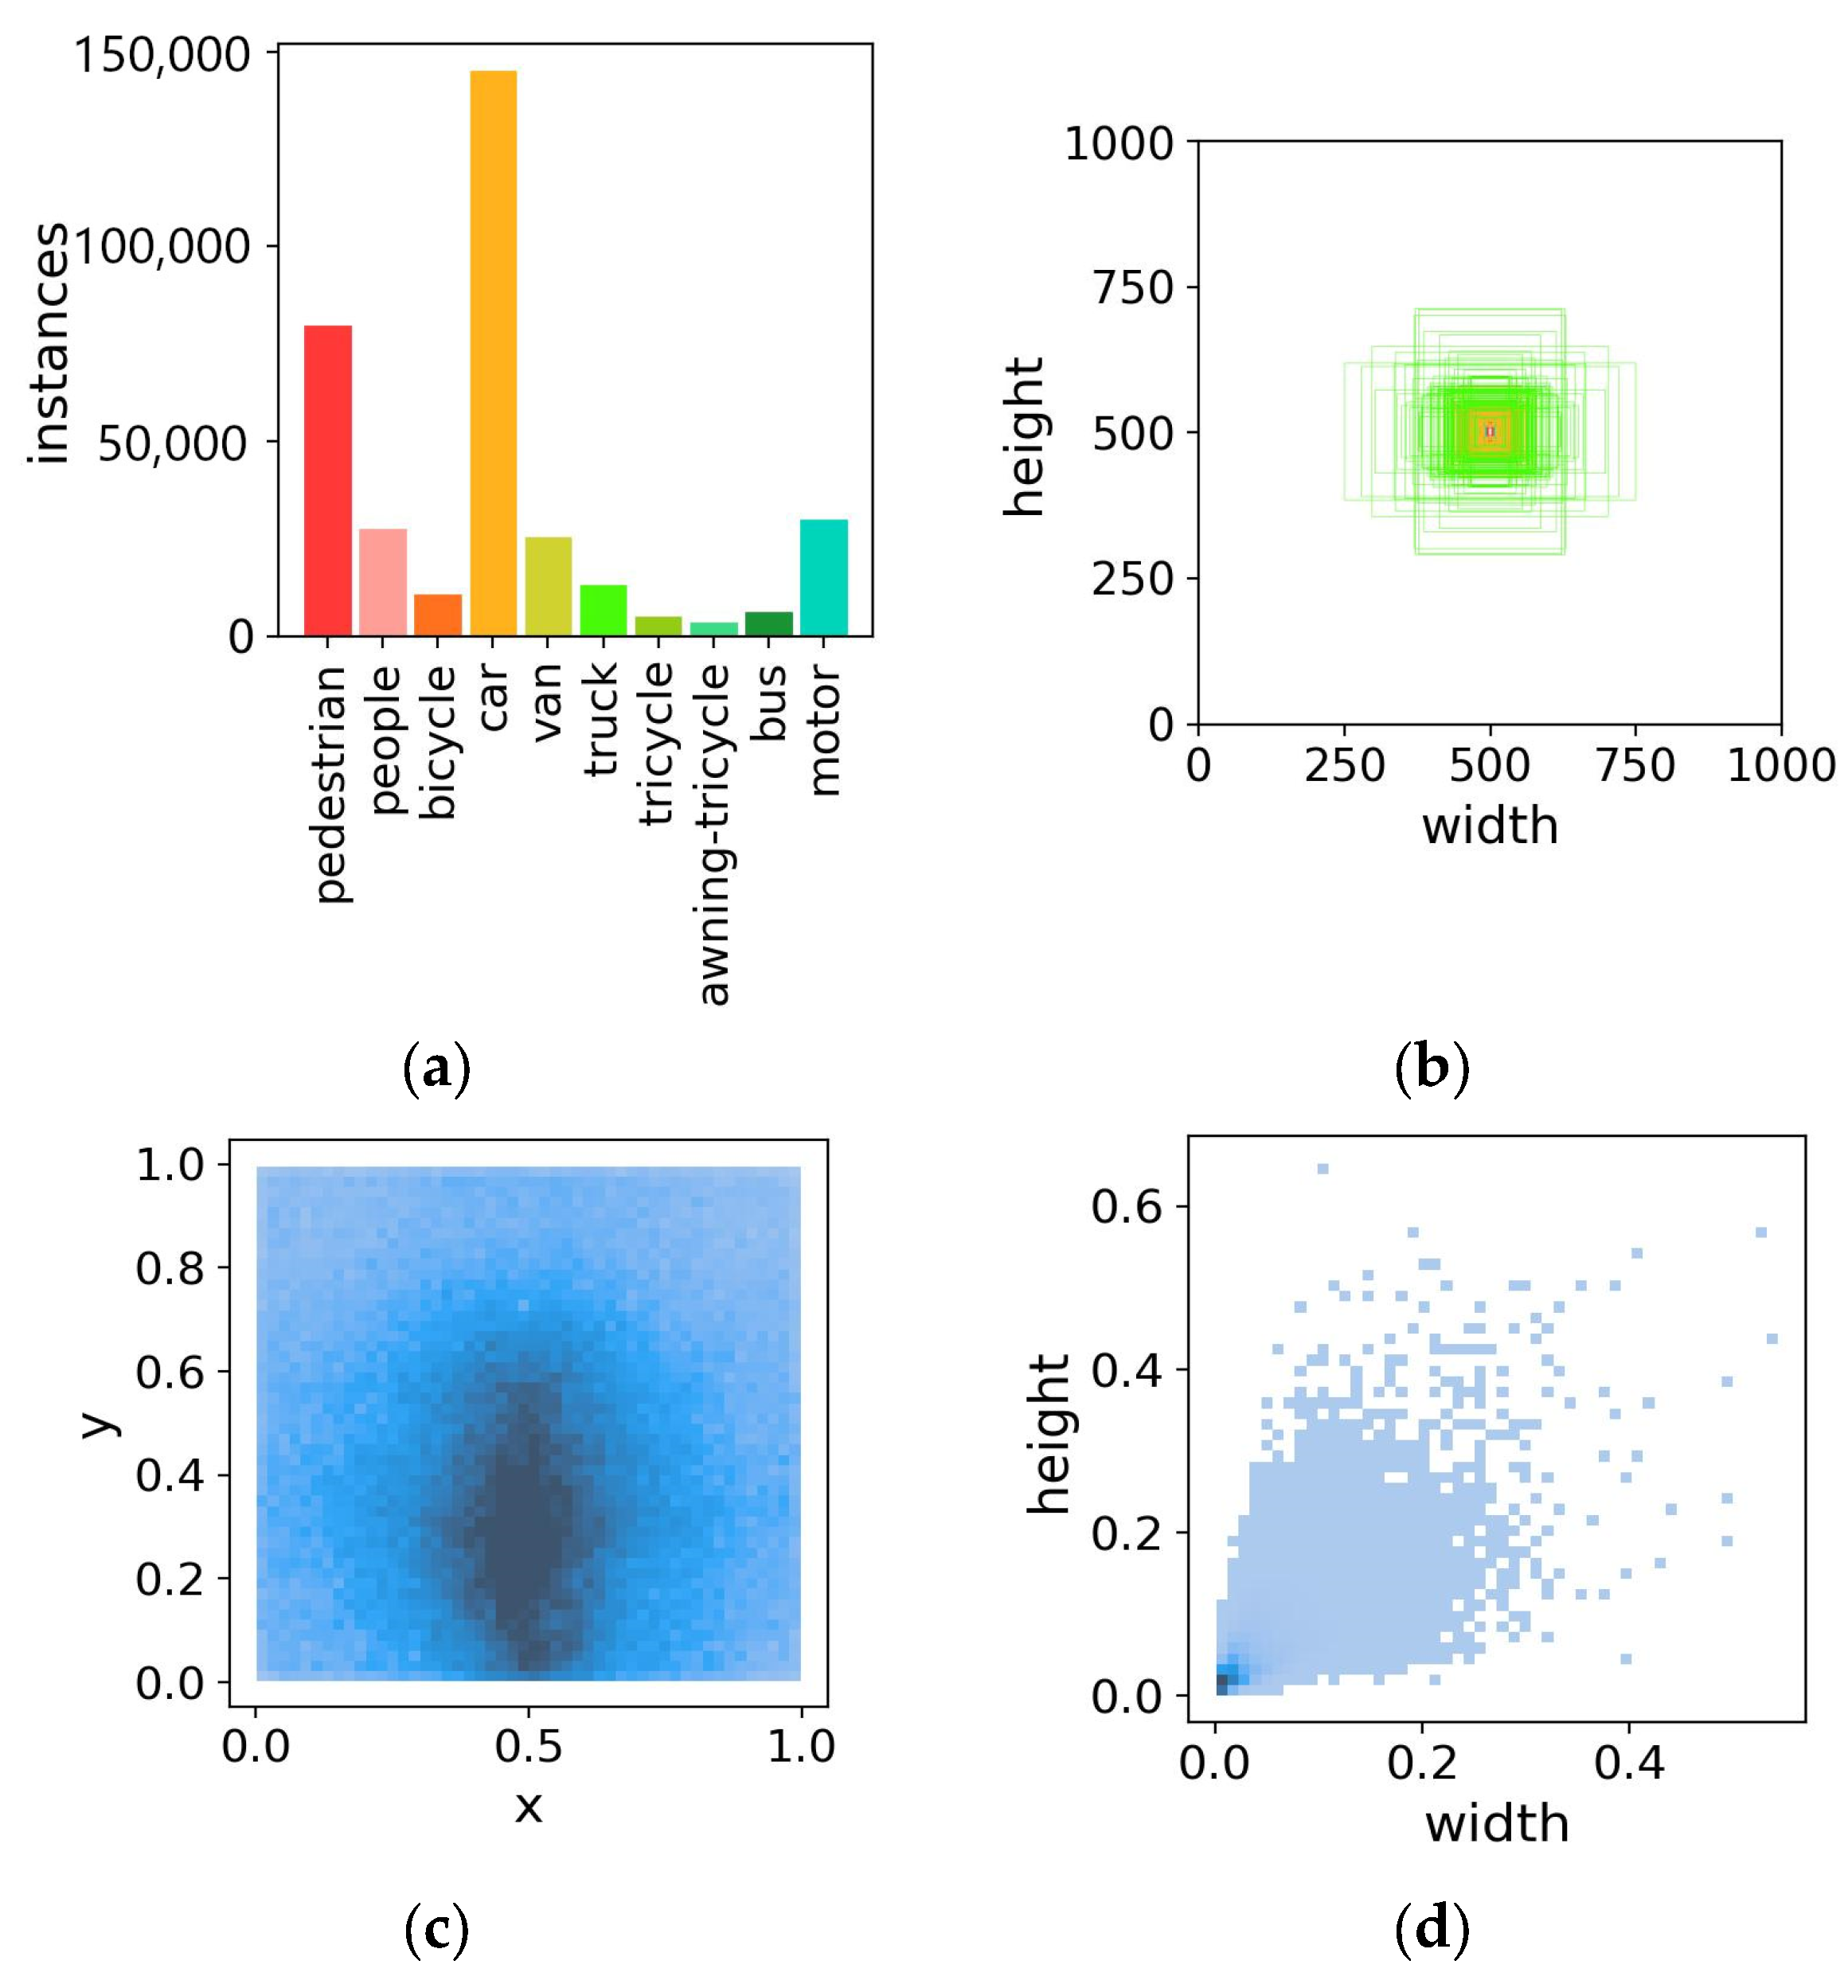
4.1. Dataset
4.2. Experimental Environment and Training Strategy
4.3. Evaluation Indicators
- mAP (mean Average Precision):
- AP (Average Precision):
- Average precision is the weighted average of precision (P) over all recall (R) values, with its calculation method outlined in Equation (17).
- Precision (P):
- Recall (R):
4.4. Experiment Results
4.4.1. Comparison with Large-Scale Networks
4.4.2. Comparison with Lightweight Networks
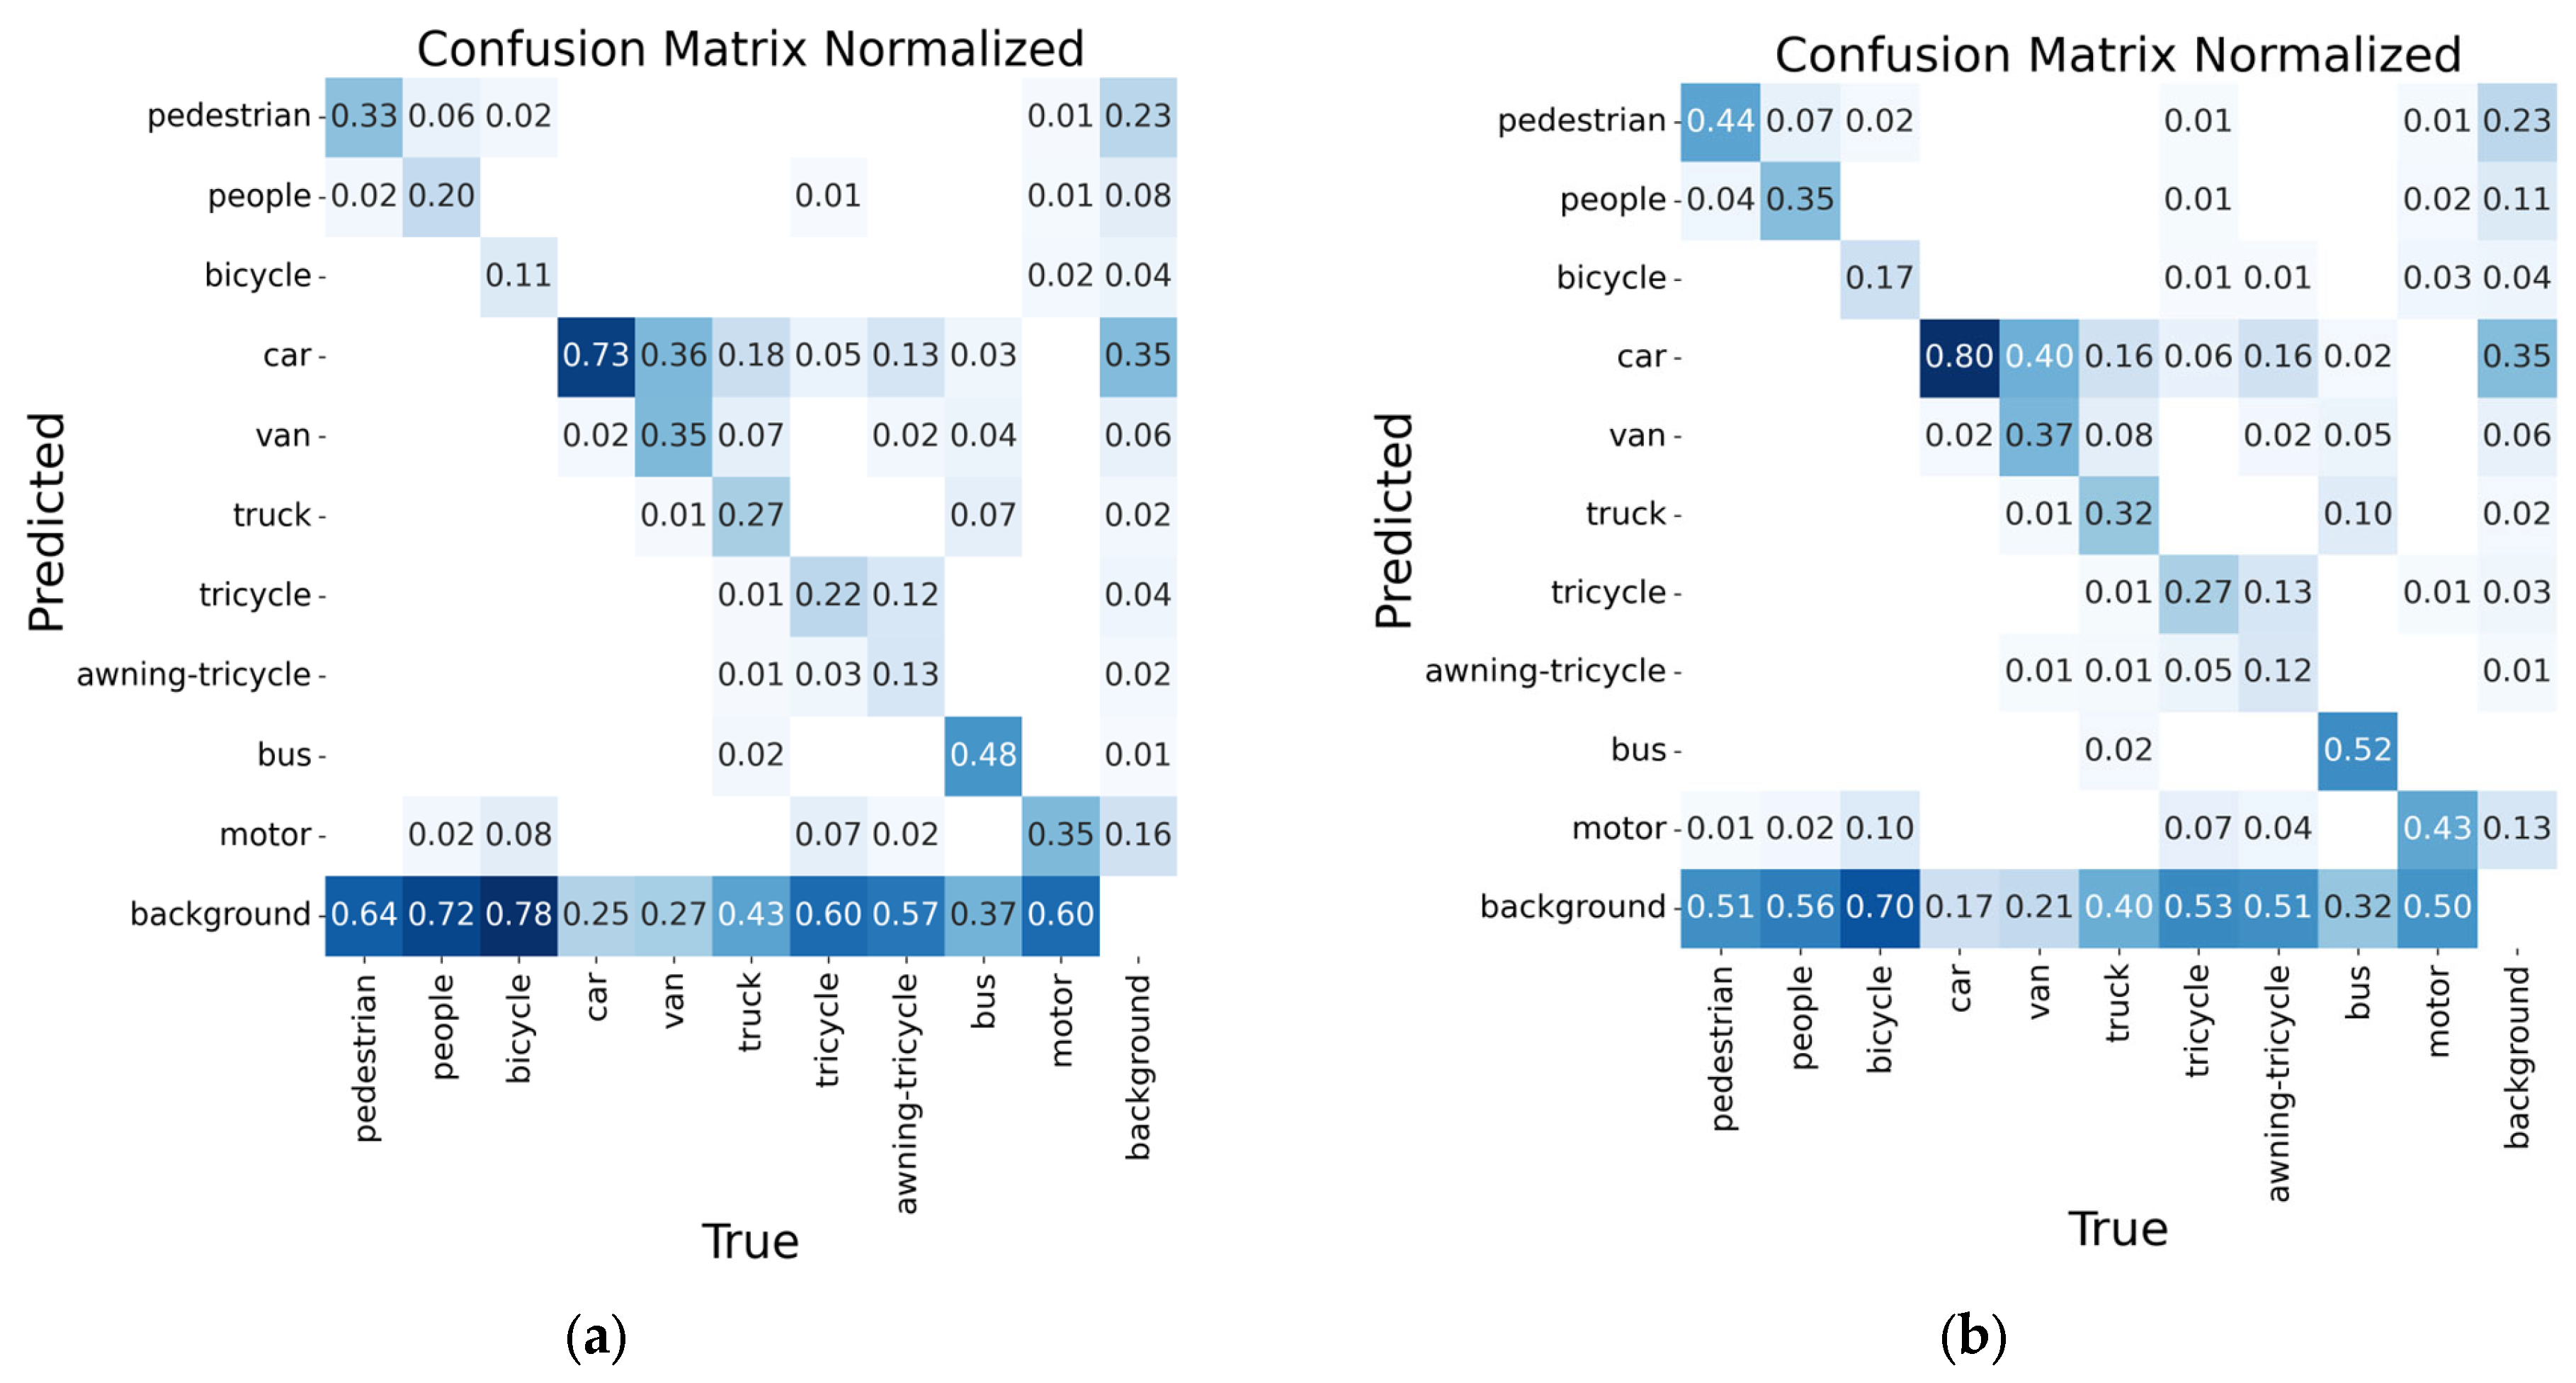
4.5. Visualization Analysis
5. Discussion
6. Conclusions
- Conducting two rounds of “processing” for multi-scale detection enhances detection accuracy, particularly in situations where there is a large presence of small objects.
- Leveraging fine-grained details effectively mitigates feature degradation during the convolution process, improving the model’s attention to small objects.
- By separating the aspect ratio component in the bounding box regression loss function, the process of regressing predicted bounding boxes is accelerated. Additionally, incorporating angle loss helps to avoid the “wandering” effect in predicted bounding boxes.
Author Contributions
Funding
Data Availability Statement
Conflicts of Interest
Abbreviations
| RPS-YOLO | Recursive Pyramid Structure-based YOLO |
| FPN | Feature Pyramid Network |
| RFP | recursive feature pyramid |
| FPS | Frames Per Second |
| C2f | CSP bottleneck with two convolutions |
| SC | Spatial and Channel |
| SCC2f | Spatial and Channel C2f |
| CAU | Channel Attention Unit |
| SAU | Spatial Attention Unit |
| CIOU | Complete IOU |
| LIOU | Localization IOU |
| IOU | Intersection Over Union |
| mAP | Mean Average Precision |
| FPS | Frames Per Second |
| UAV | unmanned aerial vehicle |
| SGD | Stochastic Gradient Descent |
| AP | Average Precision |
References
- Dalal, N.; Triggs, B. Histograms of oriented gradients for human detection. In Proceedings of the 2005 IEEE Computer Society Conference on Computer Vision and Pattern Recognition (CVPR’05), San Diego, CA, USA, 20–26 June 2005; pp. 886–893. [Google Scholar]
- Lowe, D.G. Distinctive image features from scale-invariant keypoints. Int. J. Comput. Vis. 2004, 60, 91–110. [Google Scholar] [CrossRef]
- Felzenszwalb, P.; McAllester, D.; Ramanan, D. A discriminatively trained, multiscale, deformable part model. In Proceedings of the 2008 IEEE Conference on Computer Vision and Pattern Recognition, Anchorage, AK, USA, 13–28 June 2008; pp. 1–8. [Google Scholar]
- Cai, Z.; Vasconcelos, N. Cascade r-cnn: Delving into high quality object detection. In Proceedings of the IEEE Conference on Computer Vision and Pattern Recognition, Salt Lake City, UT, USA, 18–22 June 2018; pp. 6154–6162. [Google Scholar]
- Girshick, R.; Donahue, J.; Darrell, T.; Malik, J. Rich feature hierarchies for accurate object detection and semantic segmentation. In Proceedings of the IEEE Conference on Computer Vision and Pattern Recognition, Columbus, OH, USA, 23–28 June 2014; pp. 580–587. [Google Scholar]
- He, K.; Gkioxari, G.; Dollár, P.; Girshick, R. Mask r-cnn. In Proceedings of the IEEE International Conference on Computer Vision, Venice, Italy, 22–29 October 2017; pp. 2961–2969. [Google Scholar]
- Ren, S.; He, K.; Girshick, R.; Sun, J. Faster R-CNN: Towards real-time object detection with region proposal networks. IEEE Trans. Pattern Anal. Mach. Intell. 2016, 39, 1137–1149. [Google Scholar] [CrossRef] [PubMed]
- Bochkovskiy, A.; Wang, C.-Y.; Liao, H.-Y.M. Yolov4: Optimal speed and accuracy of object detection. arXiv 2020, arXiv:2004.10934. [Google Scholar]
- Farhadi, A.; Redmon, J. Yolov3: An incremental improvement. In Proceedings of the Computer Vision and Pattern Recognition, Salt Lake City, UT, USA, 23 June 2018; pp. 1–6. [Google Scholar]
- Jocher, G.; Chaurasia, A.; Stoken, A.; Borovec, J.; Kwon, Y.; Michael, K.; Fang, J.; Wong, C.; Yifu, Z.; Montes, D. ultralytics/yolov5: v6. 2-yolov5 classification models, apple m1, reproducibility, clearml and deci. ai integrations. Zenodo 2022. [Google Scholar] [CrossRef]
- Li, C.; Li, L.; Jiang, H.; Weng, K.; Geng, Y.; Li, L.; Ke, Z.; Li, Q.; Cheng, M.; Nie, W. YOLOv6: A single-stage object detection framework for industrial applications. arXiv 2022, arXiv:2209.02976. [Google Scholar]
- Redmon, J. You only look once: Unified, real-time object detection. In Proceedings of the IEEE Conference on Computer Vision and Pattern Recognition, Las Vegas, NV, USA, 27–30 June 2016. [Google Scholar]
- Redmon, J.; Farhadi, A. YOLO9000: Better, faster, stronger. In Proceedings of the IEEE Conference on Computer Vision and Pattern Recognition, Honolulu, HI, USA, 21–26 July 2017; pp. 7263–7271. [Google Scholar]
- Varghese, R.; Sambath, M. YOLOv8: A Novel Object Detection Algorithm with Enhanced Performance and Robustness. In Proceedings of the 2024 International Conference on Advances in Data Engineering and Intelligent Computing Systems (ADICS), Chennai, India, 18–19 April 2024; pp. 1–6. [Google Scholar]
- Wang, A.; Chen, H.; Liu, L.; Chen, K.; Lin, Z.; Han, J.; Ding, G. Yolov10: Real-time end-to-end object detection. arXiv 2024, arXiv:2405.14458. [Google Scholar]
- Wang, C.-Y.; Bochkovskiy, A.; Liao, H.-Y.M. YOLOv7: Trainable bag-of-freebies sets new state-of-the-art for real-time object detectors. In Proceedings of the IEEE/CVF Conference on Computer Vision and Pattern Recognition, Vancouver, BC, Canada, 17–24 June 2023; pp. 7464–7475. [Google Scholar]
- Liu, W.; Anguelov, D.; Erhan, D.; Szegedy, C.; Reed, S.; Fu, C.-Y.; Berg, A.C. Ssd: Single shot multibox detector. In Proceedings of the Computer Vision–ECCV 2016: 14th European Conference, Amsterdam, The Netherlands, 11–14 October 2016; Proceedings, Part I 14. pp. 21–37. [Google Scholar]
- Ross, T.-Y.; Dollár, G. Focal loss for dense object detection. In Proceedings of the IEEE Conference on Computer Vision and Pattern Recognition, Honolulu, HI, USA, 21–26 July 2017; pp. 2980–2988. [Google Scholar]
- Carion, N.; Massa, F.; Synnaeve, G.; Usunier, N.; Kirillov, A.; Zagoruyko, S. End-to-end object detection with transformers. In Proceedings of the European Conference on Computer Vision, Glasgow, UK, 23–28 August 2020; pp. 213–229. [Google Scholar]
- Fang, W.; Zhang, G.; Zheng, Y.; Chen, Y. Multi-Task Learning for UAV Aerial Object Detection in Foggy Weather Condition. Remote Sens. 2023, 15, 4617. [Google Scholar] [CrossRef]
- Kong, Y.; Shang, X.; Jia, S. Drone-DETR: Efficient small object detection for remote sensing image using enhanced RT-DETR model. Sensors 2024, 24, 5496. [Google Scholar] [CrossRef] [PubMed]
- Tong, Z.; Jieyu, L.; Zhiqiang, D. UAV target detection based on RetinaNet. In Proceedings of the 2019 Chinese Control and Decision Conference (CCDC), Nanchang, China, 3–5 June 2019; pp. 3342–3346. [Google Scholar]
- Bao, Z. The UAV Target Detection Algorithm Based on Improved YOLO V8. In Proceedings of the International Conference on Image Processing, Machine Learning and Pattern Recognition, Guangzhou, China, 13–15 September 2024; pp. 264–269. [Google Scholar]
- Li, Y.; Fan, Q.; Huang, H.; Han, Z.; Gu, Q. A modified YOLOv8 detection network for UAV aerial image recognition. Drones 2023, 7, 304. [Google Scholar] [CrossRef]
- Wang, G.; Chen, Y.; An, P.; Hong, H.; Hu, J.; Huang, T. UAV-YOLOv8: A small-object-detection model based on improved YOLOv8 for UAV aerial photography scenarios. Sensors 2023, 23, 7190. [Google Scholar] [CrossRef] [PubMed]
- Guo, J.; Lou, H.; Chen, H.; Liu, H.; Gu, J.; Bi, L.; Duan, X. A new detection algorithm for alien intrusion on highway. Sci. Rep. 2023, 13, 10667. [Google Scholar] [CrossRef] [PubMed]
- Zhai, X.; Huang, Z.; Li, T.; Liu, H.; Wang, S. YOLO-Drone: An optimized YOLOv8 network for tiny UAV object detection. Electronics 2023, 12, 3664. [Google Scholar] [CrossRef]
- Lin, T.-Y.; Dollár, P.; Girshick, R.; He, K.; Hariharan, B.; Belongie, S. Feature pyramid networks for object detection. In Proceedings of the IEEE Conference on Computer Vision and Pattern Recognition, Honolulu, HI, USA, 21–26 July 2017; pp. 2117–2125. [Google Scholar]
- Liu, S.; Qi, L.; Qin, H.; Shi, J.; Jia, J. Path aggregation network for instance segmentation. In Proceedings of the IEEE Conference on Computer Vision and Pattern Recognition, Salt Lake City, UT, USA, 18–23 June 2018; pp. 8759–8768. [Google Scholar]
- Qiao, S.; Chen, L.-C.; Yuille, A. Detectors: Detecting objects with recursive feature pyramid and switchable atrous convolution. In Proceedings of the IEEE/CVF Conference on Computer Vision and Pattern Recognition, Nashville, TN, USA, 20–25 June 2021; pp. 10213–10224. [Google Scholar]
- Wu, Y.; He, K. Group normalization. In Proceedings of the European Conference on Computer Vision (ECCV), Munich, Germany, 8–14 September 2018; pp. 3–19. [Google Scholar]
- Krizhevsky, A.; Sutskever, I.; Hinton, G.E. ImageNet classification with deep convolutional neural networks. Commun. ACM 2017, 60, 84–90. [Google Scholar] [CrossRef]
- Zheng, Z.; Wang, P.; Liu, W.; Li, J.; Ye, R.; Ren, D. Distance-IoU loss: Faster and better learning for bounding box regression. In Proceedings of the AAAI Conference on Artificial Intelligence, New York, NY, USA, 7–12 February 2020; pp. 12993–13000. [Google Scholar]
- Cao, Y.; He, Z.; Wang, L.; Wang, W.; Yuan, Y.; Zhang, D.; Zhang, J.; Zhu, P.; Van Gool, L.; Han, J. VisDrone-DET2021: The vision meets drone object detection challenge results. In Proceedings of the IEEE/CVF International Conference on Computer Vision, Montreal, BC, Canada, 11–17 October 2021; pp. 2847–2854. [Google Scholar]
- Du, D.; Qi, Y.; Yu, H.; Yang, Y.; Duan, K.; Li, G.; Zhang, W.; Huang, Q.; Tian, Q. The unmanned aerial vehicle benchmark: Object detection and tracking. In Proceedings of the European Conference on Computer Vision (ECCV), Munich, Germany, 8–14 September 2018; pp. 370–386. [Google Scholar]
- Feng, C.; Zhong, Y.; Gao, Y.; Scott, M.R.; Huang, W. Tood: Task-aligned one-stage object detection. In Proceedings of the 2021 IEEE/CVF International Conference on Computer Vision (ICCV), Montreal, QC, Canada, 10–17 October 2021; pp. 3490–3499. [Google Scholar]
- Wang, J.; Zhang, W.; Cao, Y.; Chen, K.; Pang, J.; Gong, T.; Shi, J.; Loy, C.C.; Lin, D. Side-aware boundary localization for more precise object detection. In Proceedings of the Computer Vision–ECCV 2020: 16th European Conference, Glasgow, UK, 23–28 August 2020; Proceedings, Part IV 16. pp. 403–419. [Google Scholar]
- Zhao, Y.; Lv, W.; Xu, S.; Wei, J.; Wang, G.; Dang, Q.; Liu, Y.; Chen, J. Detrs beat yolos on real-time object detection. In Proceedings of the IEEE/CVF Conference on Computer Vision and Pattern Recognition, Seattle, WA, USA, 16–22 June 2024; pp. 16965–16974. [Google Scholar]
- Sun, W.; Dai, L.; Zhang, X.; Chang, P.; He, X. RSOD: Real-time small object detection algorithm in UAV-based traffic monitoring. Appl. Intell. 2021, 52, 8448–8463. [Google Scholar] [CrossRef]
- Zhang, Z. Drone-YOLO: An efficient neural network method for target detection in drone images. Drones 2023, 7, 526. [Google Scholar] [CrossRef]
- Duan, K.; Bai, S.; Xie, L.; Qi, H.; Huang, Q.; Tian, Q. Centernet: Keypoint triplets for object detection. In Proceedings of the IEEE/CVF International Conference on Computer Vision, Seoul, Republic of Korea, 27 October–2 November 2019; pp. 6569–6578. [Google Scholar]
- Yu, G.; Chang, Q.; Lv, W.; Xu, C.; Cui, C.; Ji, W.; Dang, Q.; Deng, K.; Wang, G.; Du, Y. PP-PicoDet: A better real-time object detector on mobile devices. arXiv 2021, arXiv:2111.00902. [Google Scholar]

| Network | mAP0.5 (%) | mAP0.5:0.95 (%) | Params (M) | GFLOPs |
|---|---|---|---|---|
| Faster R-CNN [7] | 35.7 | 20.1 | 41.2 | 268.5 |
| TOOD [36] | 41.0 | - | 31.81 | 144.40 |
| SABL [37] | 40.5 | 25.9 | 99.6 | 145.5 |
| RT-DETR [38] | 44.1 | 26.9 | 32.0 | 103.5 |
| RSOD [39] | 43.3 | - | 63.72 | 84.21 |
| Drone-Yolo-m [40] | 48.6 | - | 33.9 | - |
| CenterNet [41] | 32.7 | 18.0 | 32.7 | 109.3 |
| RPS-YOLO | 46.3 | 28.1 | 13.3 | 37.7 |
| Network | Precision/% | Recall/% | mAP0.5 (%) | mAP0.5:0.95 (%) | Params (M) | GFLOPs | FPS |
|---|---|---|---|---|---|---|---|
| YOLOv3-tiny [9] | 38.1 | 24.3 | 23.5 | 13 | 12.1 | 18.9 | 86 |
| YOLOv5s | 49.6 | 36.7 | 37.5 | 22.4 | 9.1 | 23.8 | 60 |
| YOLOv6s [11] | 47.8 | 35.5 | 36.4 | 21.9 | 16.3 | 44.0 | 52 |
| YOLOv8s | 50.6 | 37.2 | 38.1 | 22.7 | 11.1 | 28.5 | 56 |
| PP-PicoDet-L [42] | - | - | 34.2 | - | 3.30 | 8.9 | 67 |
| YOLOv10s [15] | 48.9 | 37.4 | 37.9 | 22.7 | 8.1 | 24.5 | 50 |
| RPS-YOLO | 55.3 | 44.3 | 46.3 | 28.1 | 13.3 | 37.7 | 49 |
| Network | mAP0.5 (%) | Params (M) | GFLOPs | FPS |
|---|---|---|---|---|
| YOLOv3-tiny | 26.9 | 12.1 | 18.9 | 86 |
| YOLOv5s | 29.8 | 9.1 | 23.8 | 60 |
| YOLOv6s | 29.9 | 16.3 | 44.0 | 52 |
| YOLOv8s | 31.9 | 11.1 | 28.5 | 56 |
| PP-PicoDet-L | 31.1 | 3.30 | 8.9 | 67 |
| YOLOv10s | 31.2 | 8.1 | 24.5 | 50 |
| RPS-YOLO | 35.3 | 13.3 | 37.7 | 49 |
| Baseline | RFP | SCC2f | LIOU | mAP0.5/% | mAP0.5:0.95/% | Params(M) | GFLOPs |
|---|---|---|---|---|---|---|---|
| YOLOv8s | 38.1 | 22.7 | 11.1 | 28.5 | |||
| √ | 44.0 | 26.0 | 12.7 | 36.7 | |||
| √ | √ | 45.9 | 27.5 | 13.3 | 37.7 | ||
| √ | √ | √ | 46.3 | 28.1 | 13.3 | 37.7 |
Disclaimer/Publisher’s Note: The statements, opinions and data contained in all publications are solely those of the individual author(s) and contributor(s) and not of MDPI and/or the editor(s). MDPI and/or the editor(s) disclaim responsibility for any injury to people or property resulting from any ideas, methods, instructions or products referred to in the content. |
© 2025 by the authors. Licensee MDPI, Basel, Switzerland. This article is an open access article distributed under the terms and conditions of the Creative Commons Attribution (CC BY) license (https://creativecommons.org/licenses/by/4.0/).
Share and Cite
Lei, P.; Wang, C.; Liu, P. RPS-YOLO: A Recursive Pyramid Structure-Based YOLO Network for Small Object Detection in Unmanned Aerial Vehicle Scenarios. Appl. Sci. 2025, 15, 2039. https://doi.org/10.3390/app15042039
Lei P, Wang C, Liu P. RPS-YOLO: A Recursive Pyramid Structure-Based YOLO Network for Small Object Detection in Unmanned Aerial Vehicle Scenarios. Applied Sciences. 2025; 15(4):2039. https://doi.org/10.3390/app15042039
Chicago/Turabian StyleLei, Penghui, Chenkang Wang, and Peigang Liu. 2025. "RPS-YOLO: A Recursive Pyramid Structure-Based YOLO Network for Small Object Detection in Unmanned Aerial Vehicle Scenarios" Applied Sciences 15, no. 4: 2039. https://doi.org/10.3390/app15042039
APA StyleLei, P., Wang, C., & Liu, P. (2025). RPS-YOLO: A Recursive Pyramid Structure-Based YOLO Network for Small Object Detection in Unmanned Aerial Vehicle Scenarios. Applied Sciences, 15(4), 2039. https://doi.org/10.3390/app15042039