Article

Sensory Shelf Life of Pasteurized Orange Juice Stored Under Different Temperature Levels Using Inverse Time Sampling and a Balanced Incomplete Block Design

by
Theofilos Frangopoulos
,
Antonios Koliouskas
and
Dimitrios Petridis
*
International Hellenic University, 57400 Sindos, Greece
*
Author to whom correspondence should be addressed.
Appl. Sci. 2025, 15(4), 1809; https://doi.org/10.3390/app15041809
Submission received: 5 December 2024 / Revised: 27 January 2025 / Accepted: 29 January 2025 / Published: 10 February 2025

Abstract

:
The sensory acceptability rate of pasteurized orange juices stored at different temperature levels was evaluated using a large-scale experiment with untrained consumers and an accelerated shelf-life testing method. Pasteurized orange juice samples were stored at 10, 20, 30 and 40 °C and tested for acceptance or rejection at consecutive time points using a reverse product preservation plan. From a total of 504 samples and the participation of 72 consumers, 155 failures and 109 passes were recorded. Due to the large number of samples (28) selected for testing from each consumer, a balanced incomplete block design was adopted to facilitate a very small number for evaluation (7 for each consumer) with minimal reduction in the reliability of the experiment and results. As expected, there was a gradual increasing trend of rejections at all temperature levels by time. Also, it was observed that pasteurized orange juices tended to be rejected by consumers at approximately 3 days before they would be microbiologically unsafe for consumption. Also, it was shown from the risk rate trend that higher storage temperatures are linked with very early perceptiveness of sensory defects during nearly the first 100 h of preservation. The present work constitutes essentially a very useful tool for the industry because it enables the proper adjustment of shelf life including both sensory and microbiological parameters, which results in fewer returned and deteriorated products.

1. Introduction

Orange (Citrus cinensis) juice is undoubtedly one of the most consumed products worldwide and this is mainly due to its nutritional value, as it is a source of vitamin C and other antioxidant compounds [1], but is also due to its distinguishing sensory characteristics, which can be attributed to the presence of a variety of aldehydes, esters, ketones, terpenes and alcohols. Plus, orange juice is the most widespread among fruit juices, representing almost 45% of the market worldwide [2].
Due to its global distribution, the need has emerged for increasing shelf life of orange juice, because fresh squeezed orange juice was estimated to have a shelf life of ~7 days due to microbiological and physicochemical deterioration [3]. For that reason, thermal pasteurization of citrus juices, which mainly focuses on enzyme inactivation and deteriorative microflora, is the most applied technique globally [4]. Although with thermal pasteurization of citrus juices safety is guaranteed, there is a significant impact on the sensory characteristics of the end product and more specifically on color, odor and taste, so proper selection of time and temperature combination in thermal processing is important [5].
Although it is very easy nowadays to evaluate with laboratory techniques how compromised is the microbiological quality of a product, evaluation of sensory deterioration is still challenging, but the correlation between microbiological and sensory quality, and more specifically safety and sensory shelf life, is extremely important [6,7]. Accelerated shelf-life testing (ASLT) is a reliable tool for establishing a product’s shelf life without the need for extensive time or tools, using temperature as an acceleration factor [8,9,10].
When accelerated shelf-life tests are used, products are typically stored under a variety of temperatures, and at distinctive time periods, measures are taken in order to evaluate possible defects of the products. Different types of pasteurized fruit juices, including orange, were evaluated sensorially stored at different temperatures in order to specify the threshold where the defect appears and the nature of it [11,12,13,14,15,16].
Balanced incomplete block designs (BIBDs) are essentially innovative short-term sensory test techniques that include untrained assessors and provide reliable results. More specifically, BIBDs are recommended when a large number of samples under testing induce sensory fatigue, leading to compromised results. For the use of BIBDs, a number of prerequisites need to be met such as: (1) at each sensory session, the panelists only evaluate a fraction (k) of the total number of samples (t), (2) all samples are evaluated the same number of times (r), (3) the number of encounters of a similar pair of samples is the same for every other pair, defined as (λ), (4) the number of blocks (b) each including a different fraction of samples, which is also equivalent to the number of participants, needed to run an overall cycle of the experiment [17,18,19].
So far, however, there has not been a large-scale sensory experiment using untrained consumers, which is the target group of the market, for the evaluation of the sensory shelf life of orange juice stored under different temperatures, and also the correlation between sensory and microbiological shelf life has not been investigated. Thus, the present study aims mainly to assess the consumer acceptance rate of pasteurized orange juice stored under different temperature levels and secondly to investigate whether rejections of orange juices based on sensory defects perceived by consumers appear within the microbiological safety limits. Due to the innovative character of the present work and the methodology used, literature regarding its content is scarce.

2. Materials and Methods

2.1. Materials

Commercial pasteurized orange juice was used in the present study and was manufactured at a local juice production factory in 500 mL PET (Polyethylene terephthalate) bottles. Directly after production, pasteurized orange juice bottles were stored under different temperatures in the company’s industrial refrigerators.

2.2. Sensory Evaluation

Based on our previous results regarding orange juice production [20], the company extracted the results of the microbiological shelf life of the product at 10, 20, 30 and 40 °C temperature levels for further use and chose to apply the exponential model, resulting in the following microbiological shelf life: 363, 159, 86 and 74 h or 15.1, 6.6, 3.3 and 3.1 days (10, 20, 30, 40 °C). It is reiterated that the microbiological shelf life of the fruit juices was based on measurements of the microbial load up to the 1000 cfu/mL APC (Aerobic Plate Count) limit for safe consumption and minimum risk purposes (20).
A large-scale experiment on the sensory evaluation of orange juices was therefore organized to answer the question whether consumers were able to intuitively assess the potential organoleptic degradation of products at different temperature levels (always within the 1000 cfu/mL APC safety limit) and at which specific preservation intervals this manifests itself. Based on the results of the previous work [20] concerning microbiological deterioration and color degradation, values of pH and colorimetric b* were statistically significant. Thus, consumers were asked to accept or reject each sample according to sensing of sourness and dark orange color.
To this end, a large-scale sensory experiment of fruit juice testing was organized with the participation of members of the company’s staff, numbering more than 100 employees of different specialties, the majority of whom belong to the category of typical consumers. This food industry has an old hall for performing sensory tests on its products. The hall has an oval table surrounded by 21 workstations. Six equally spaced panelists participated each time, and there were randomly ordered seven samples in plastic beakers each identified with a three-digit number, plus one beaker filled with water and another empty for other use. The reverse product preservation plan [21] was chosen, through which samples preserved at different initial times were finally synchronized and all appear ready for testing at time 0. Finally, 7 equivalent time intervals were selected at each temperature level, the ranges of which were adjusted according to the shelf life of the orange juice.
The inverse time sampling is a reverse preservation plan for the products, whereby samples are stored at successive predetermined times with countdown to day 0. A full comparative sensory check is therefore carried out at time 0 with the inclusion of all preserved samples at the previous times, as shown in the indicative Scheme 1 below:
For example, in the reverse time plot, the first sample is preserved for 24 days, the second sample for 18 days and so on and at the end of the preservation period, i.e., at time 0, all samples are ready for a comparative sensory test and/or physico-chemical measurements. The sensory shelf life is based on the decision by the consumer to reject or not to reject a product and is statistically investigated by applying survival analysis, i.e., estimating the lifetime until the event of interest (rejection) takes place. The consumer tests samples of different shelf lives in experimental time-reversal designs and decides whether or not to buy some of them (product acceptance/rejection). The minimum number of consumers participating in similar sensory tests is between 50 and 200. The recording of the responses includes left and right censored data or even intervals. The non-parametric survival analysis is calculated using the maximum likelihood equation, which describes the joint probability of the observations of a sample of n consumers:
L = i R S r i i L 1 S I i i I ( S ( I i S r i )
where L and R are, respectively, the groups of left and right censored items and I is the interval group of observations. This equation without the left-censored items and with exact recording times is applied in this research.
Thus, on the basis of the final shelf life that was recorded per temperature, up to the limit of 1000 APC (cfu/mL) units, the following calendar table was established (Table 1):
For the 10 °C level, the time intervals were divided into 52 h, for the 20 °C level, they were divided into 24 h and for the last two, 30 and 40 °C, they were divided into 12 and 10 h, respectively. For example, sample 19 refers to 60 h of preservation at 30 °C, and the sample 13 refers to 144 h at 20 °C. Because in this reverse sensory scheme 28 samples (7 × 4) were synchronized to time 0 to be tested by each panelist, this number was considered extremely high and a Balanced Incomplete Block (BIB) design was adopted (plan 11.39, p. 482, Cochran and Cox 1957) [18], shown in Table 2 and including the following characteristics:
Each consumer tastes only 7 different samples, randomly selected using the JMP statistical program, and in total 36 individuals are required, but to enhance the reliability of the results, the experiment was performed twice. The experimental BIB design includes t = 28 treatments (samples), k = 7 treatments per panelist, b = 36 panelists, n = 9 individual samples per combined level (time by temperature) of the calendar table and λ = 2 similar paired encounters (Table 2). Each consumer was given a simple questionnaire with 7 different 3-digit codes corresponding to 7 treatments in order after randomization, asking whether after each individual trial he would buy the particular juice, i.e., whether the sample is acceptable (Y) or rejected (N). Before the start of the trials, the consumer was also offered a sample of fresh juice, and if rejected, the sensory procedure for the consumer was immediately terminated (invalid). For the execution of the experiment, only the staff members who were used to consuming at least one fruit juice per three-day period were chosen for the experiment.

2.3. Statistical Analysis

The Kaplan–Meier method was used for the sensory test, while the log-rank and Kruskal–Wallis tests of homogeneity were used to examine non-parametric differences between the samples. All statistical analyses were performed via JMP 17.2 (Statistical Discovery LLC, Cary, NC, USA) software. Probability values less than the reference level of 0.05 were considered statistically significant.

3. Results

Sensory Evaluation of Orange Juice at Different Storage Temperature Levels and Time

The results of the sensory analysis of the 72 consumers were recorded and presented in Table 3, in which the acceptance (pass) or rejection (failure) of the samples at different time intervals and at each temperature level (different coloring) is indicated in each row. First, it can be observed that when a storage period at a temperature level included one or more passes, only the last observed decision was recorded. For example, in the second row and 10 °C time period, only the acceptance of >260 h was marked, and for the 40 °C time period, only the acceptance of >30 h was noted. Secondly, when a time interval included both passes and failures, only that when the first failure occurred was taken into account for the estimation of the shelf life of the orange juices. For example, in row 43 and at the 10 °C temperature level, only the 156-h rejection was recorded.
The second run of the experiment facilitated the recording of 18 (9 × 2) replicates per treatment, and their allocation to the pass and failure frequencies is described at the end of the worksheet. As expected, there was a gradual increasing trend of rejections at all temperature levels by time and particularly a two-fold rise in rejections (13) was revealed in the last 364-h time interval at 10 °C. This observation was expected, because it is known also in literature that liking and desirability of orange juices declines with increasing storage times or temperature [14,15].
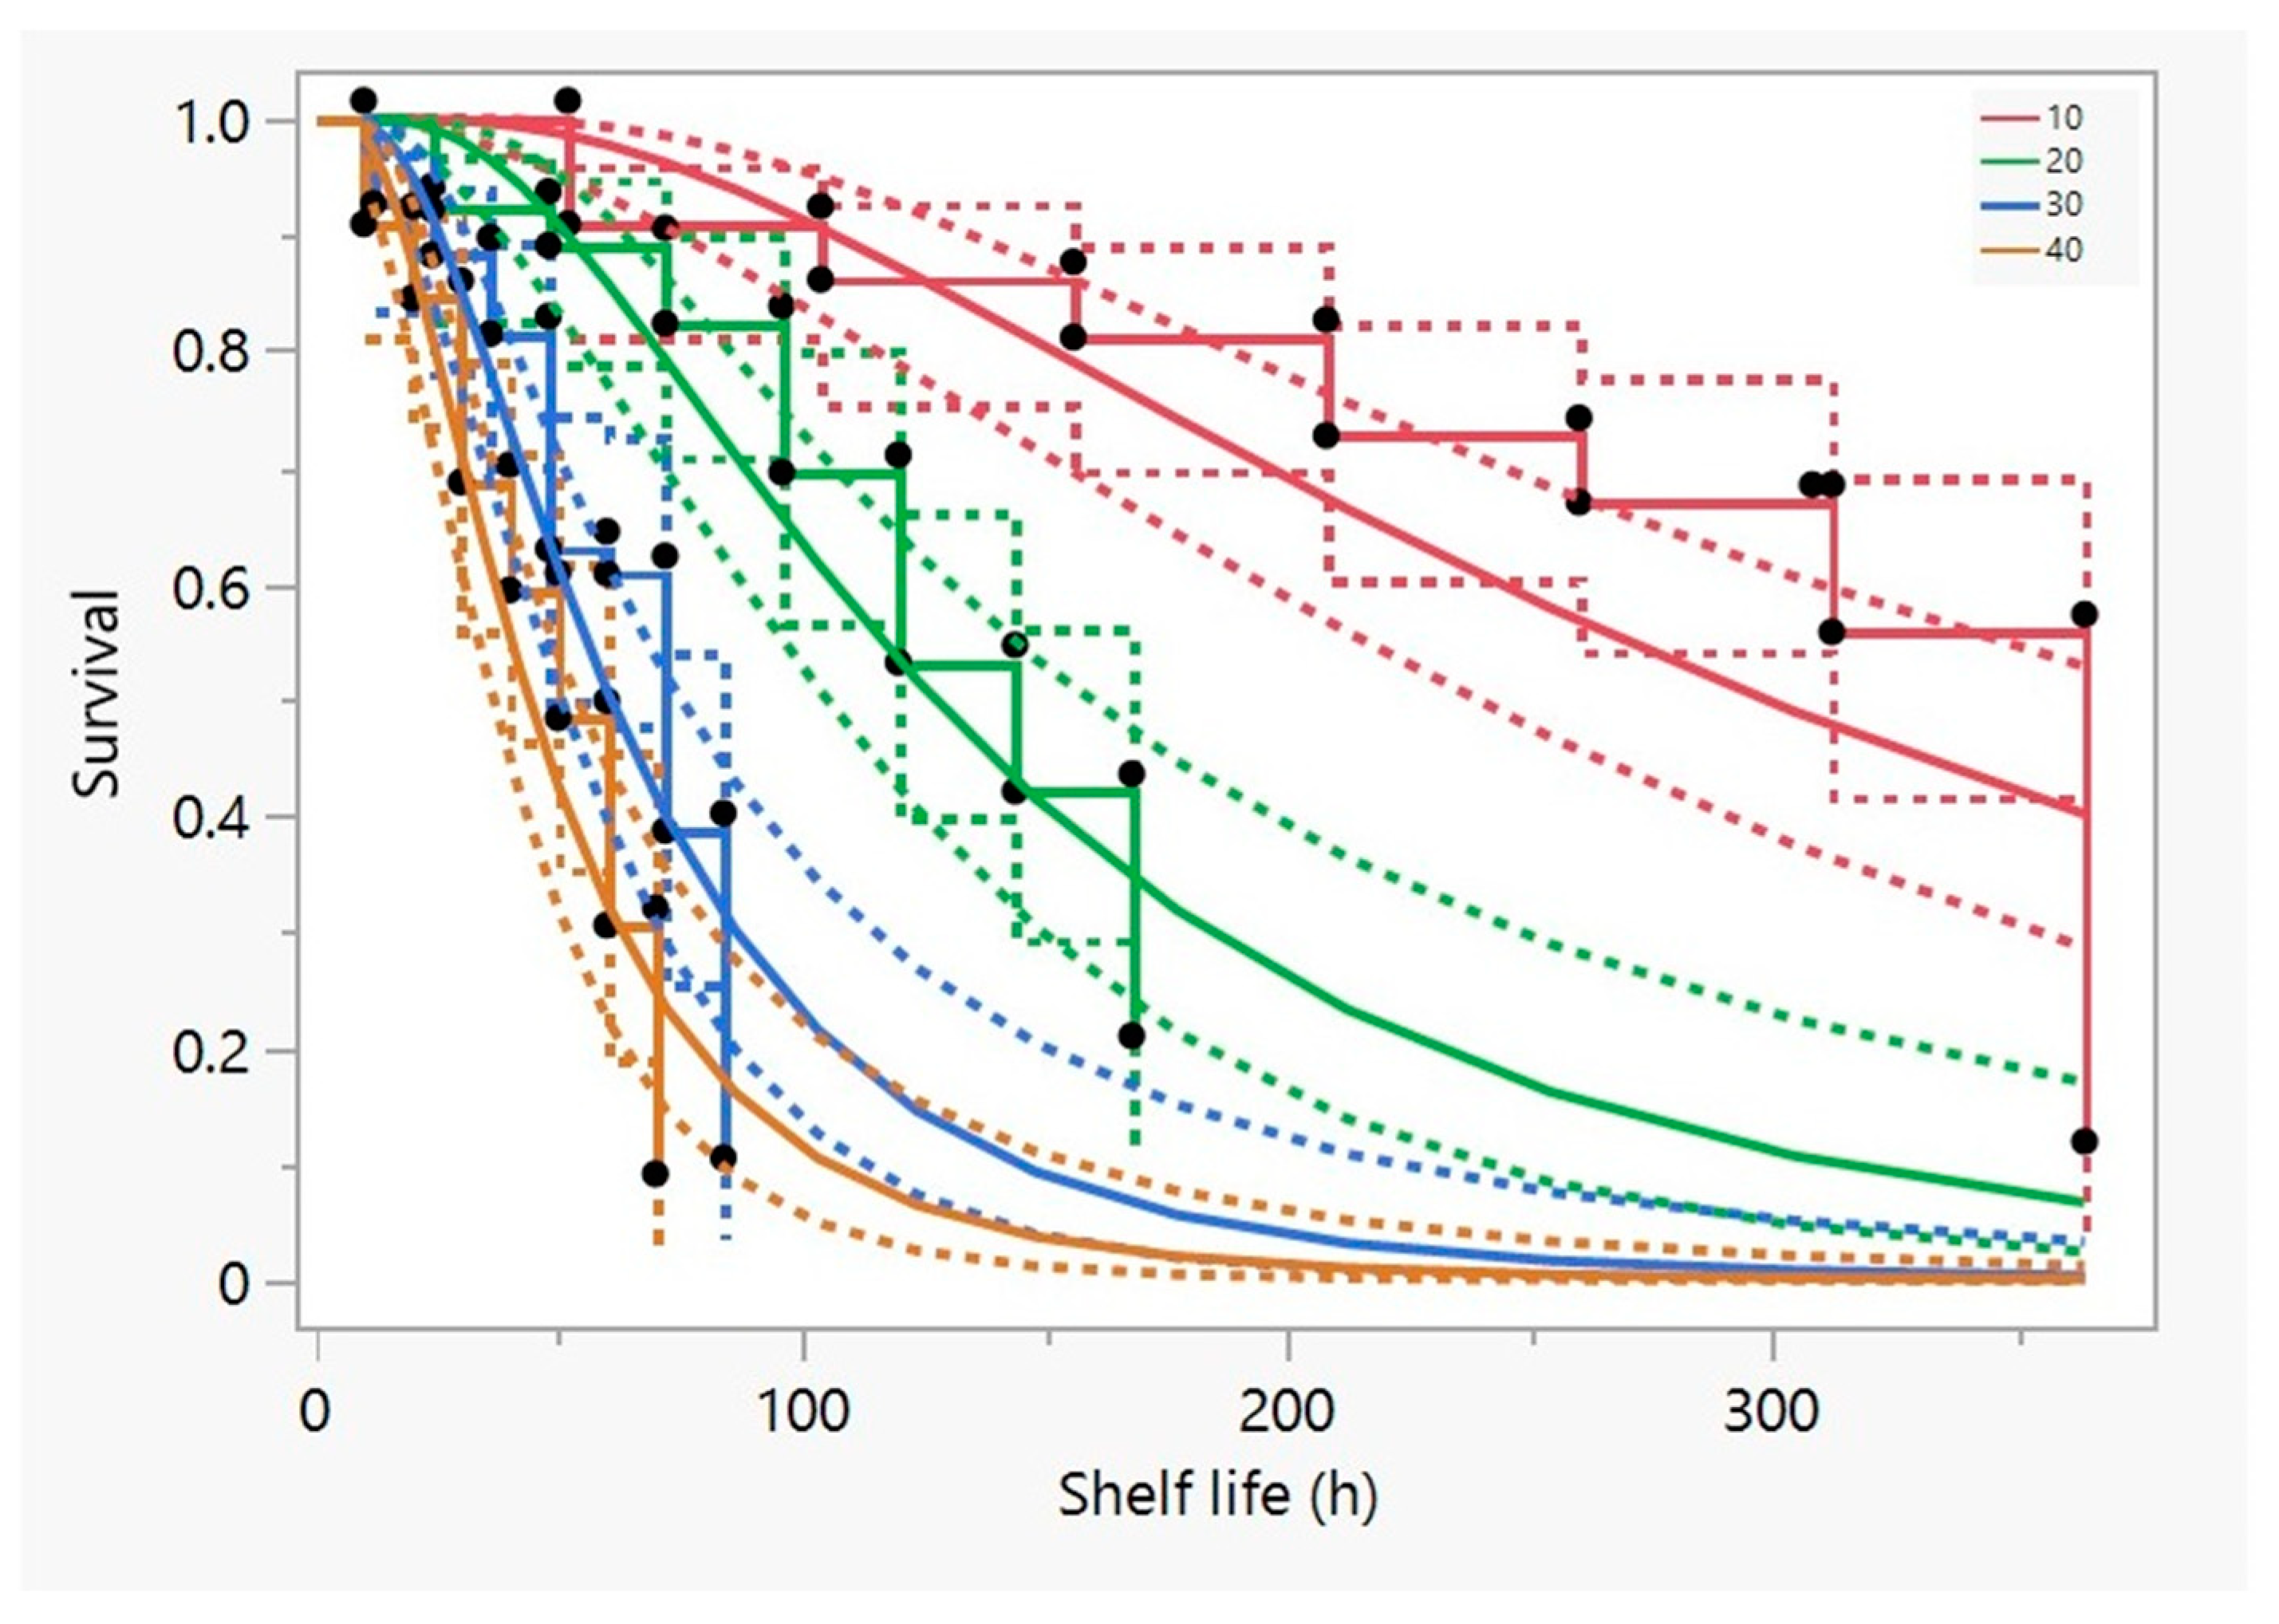
The failure rate of the juices as a function of lifetime is illustrated by the survival curves (Figure 1), showing steep decreasing trends of survival at temperatures 30 °C and 40 °C, a mild decreasing trend at 20 °C and a very slow rate at 10 °C. The curves represent the rate of the survival change by applying the lognormal distribution together with 95% confidence intervals.
In summary, from a total of 504 samples and with the participation of 72 consumers, 155 failures and 109 passes were recorded, with the number of rejections increasing with temperature rise (Table 4). Using the Kaplan–Meier estimator, the sensory shelf life of orange juices is 287.9 h (11.9 d) at 10 °C, 126.8 h (5.3 d) at 20 °C and much lower at higher temperature levels of 30 and 40 °C (63 and 48.2 h, 2.6 and 2 d, respectively) (Table 4). In the study of Klimczak et al. (2011) [11], orange juice was stored for 12 months at 18, 28 and 38 °C, and while there was no obvious deterioration during preservation at 18 degrees after 1 year, undesirable organoleptic characteristics were observed at the highest preservation temperature levels after only 6 months. The very high shelf life of the product used in the study above was maybe due to processing parameters. In another study of Oliveira et al. (2011) [12], where pasteurized mango juices were stored at 25, 35 and 45 °C for 120 days, it was reported that sensory aroma and color were kept stable at lower temperature levels throughout the whole storage time, but on the contrary, at higher temperature levels, consumers were able to detect deterioration even from the first days, which was also observed in the present study. The rise of rejections, which is more apparent at high temperature levels, was due to the degradation of thermosensitive nutrients such as vitamin C and others that lead to degradation of sensory characteristics such as aroma, flavor and taste [22,23,24]. The data in Table 5, which presents the comparison between the sensory and the microbiological shelf life, show that the sensory shelf life corresponds to 12, 5.3, 2.6 and 2.0 days (Temperature levels: 10, 20, 30, 40 °C), all of which were lower compared to the microbiological shelf life: 15.1, 6.6, 3.6 and 3.1 days (exponential model), and 16.4, 7.2, 4.5 and 3.2 days (polynomial model) [17]. This deviation was mainly due to the more rapid degradation kinetics of enzymatic reactions than that of microbiological components. This means basically that the juice maybe presented unwanted sensory characteristics within its microbiological shelf life. This is very important for the industry because if they take into account both microbiological and sensory shelf life while adjusting the expiration date of the pasteurized orange juice, they will minimize returned products. More specifically, off-flavors and unwanted aromas of orange juice are mainly attributed to the generation of 4-vinylguaiacol (4VG) after prolonged storage at higher temperatures [25]. According to the work of Kopuncova et al. (2022) [26], which assessed the most prominent types of off-flavor and off-taste chemical compounds that were generated during long-term storage of orange juice at high temperatures, four compounds and more specifically dimethyl sulphide, 4-vinylguaiacol, α-terpineol and furaneol were identified.
Table 6 provides information on the shelf life of juices and more specifically on the median shelf life (h) per temperature level, including also the 95% confidence intervals and the quartiles of the median. The log-rank and Kruskal–Wallis test of homogeneity between temperature levels showed strong statistical significance (p < 0.0001) (Table 7), indicating different median survival times, and judging by the size of the overlap of both the quartiles and the confidence limits, a survival decrease at the levels: 10 > 20 > 30 = 40 is apparent (in the last two temperature levels, the confidence limits of survival overlap significantly).
The analytical survival rate of orange juice data (Table 8) indicated the shelf life and the survival rate per temperature level. The term “pass” and “failure” correspond to the “acceptance” or “rejection” of a sample. So, depending on the rejection rate that a company considers acceptable, the corresponding shelf life can be calculated. Thus, if the firm considers the minimum acceptance rate for its product to be around 50% (e.g., 50% of the consumers will reject the product) the predicted sensory shelf life (h) is: 312 h at 10 °C (44.2% failure), 120 h at 30 °C (46.83% failure), 60 h at 30 °C (39.2%) and 50 h at 40 °C (51.6%). In the study of Buve et al. (2016) [16], where strawberry juice was stored at different temperature levels, it was shown that for an acceptance rate 50% the predicted sensory shelf life (h) was ~2016, ~1344, ~672, ~336 for 20, 28, 38 and 42 °C. Although direct comparison with the results of the present study was not adequate due to the differences between the products, it was observed that in both experiments increasing storage temperature reduces by half the time needed for the consumers to perceive sensory defects. Similarly, for a more stringent failure rate of <20% or survival rate > 80% (only 20% of the consumers will reject the product), the sensory shelf life varied as follows: 156 h at 10 °C (19% failure), 72 h at 20 °C (18% failure), 36 h at 30 °C (18.6% failure) and 20 h at 40 °C (15.5% failure). In other words, it seems that preservation of the orange juice at 10 °C facilitated an adequate sensory and microbiologically safe shelf life. However, it is very useful and crucial that these data on the sensory failure (rejection) rate assessment of products be linked with objective instrumental measurement [27].
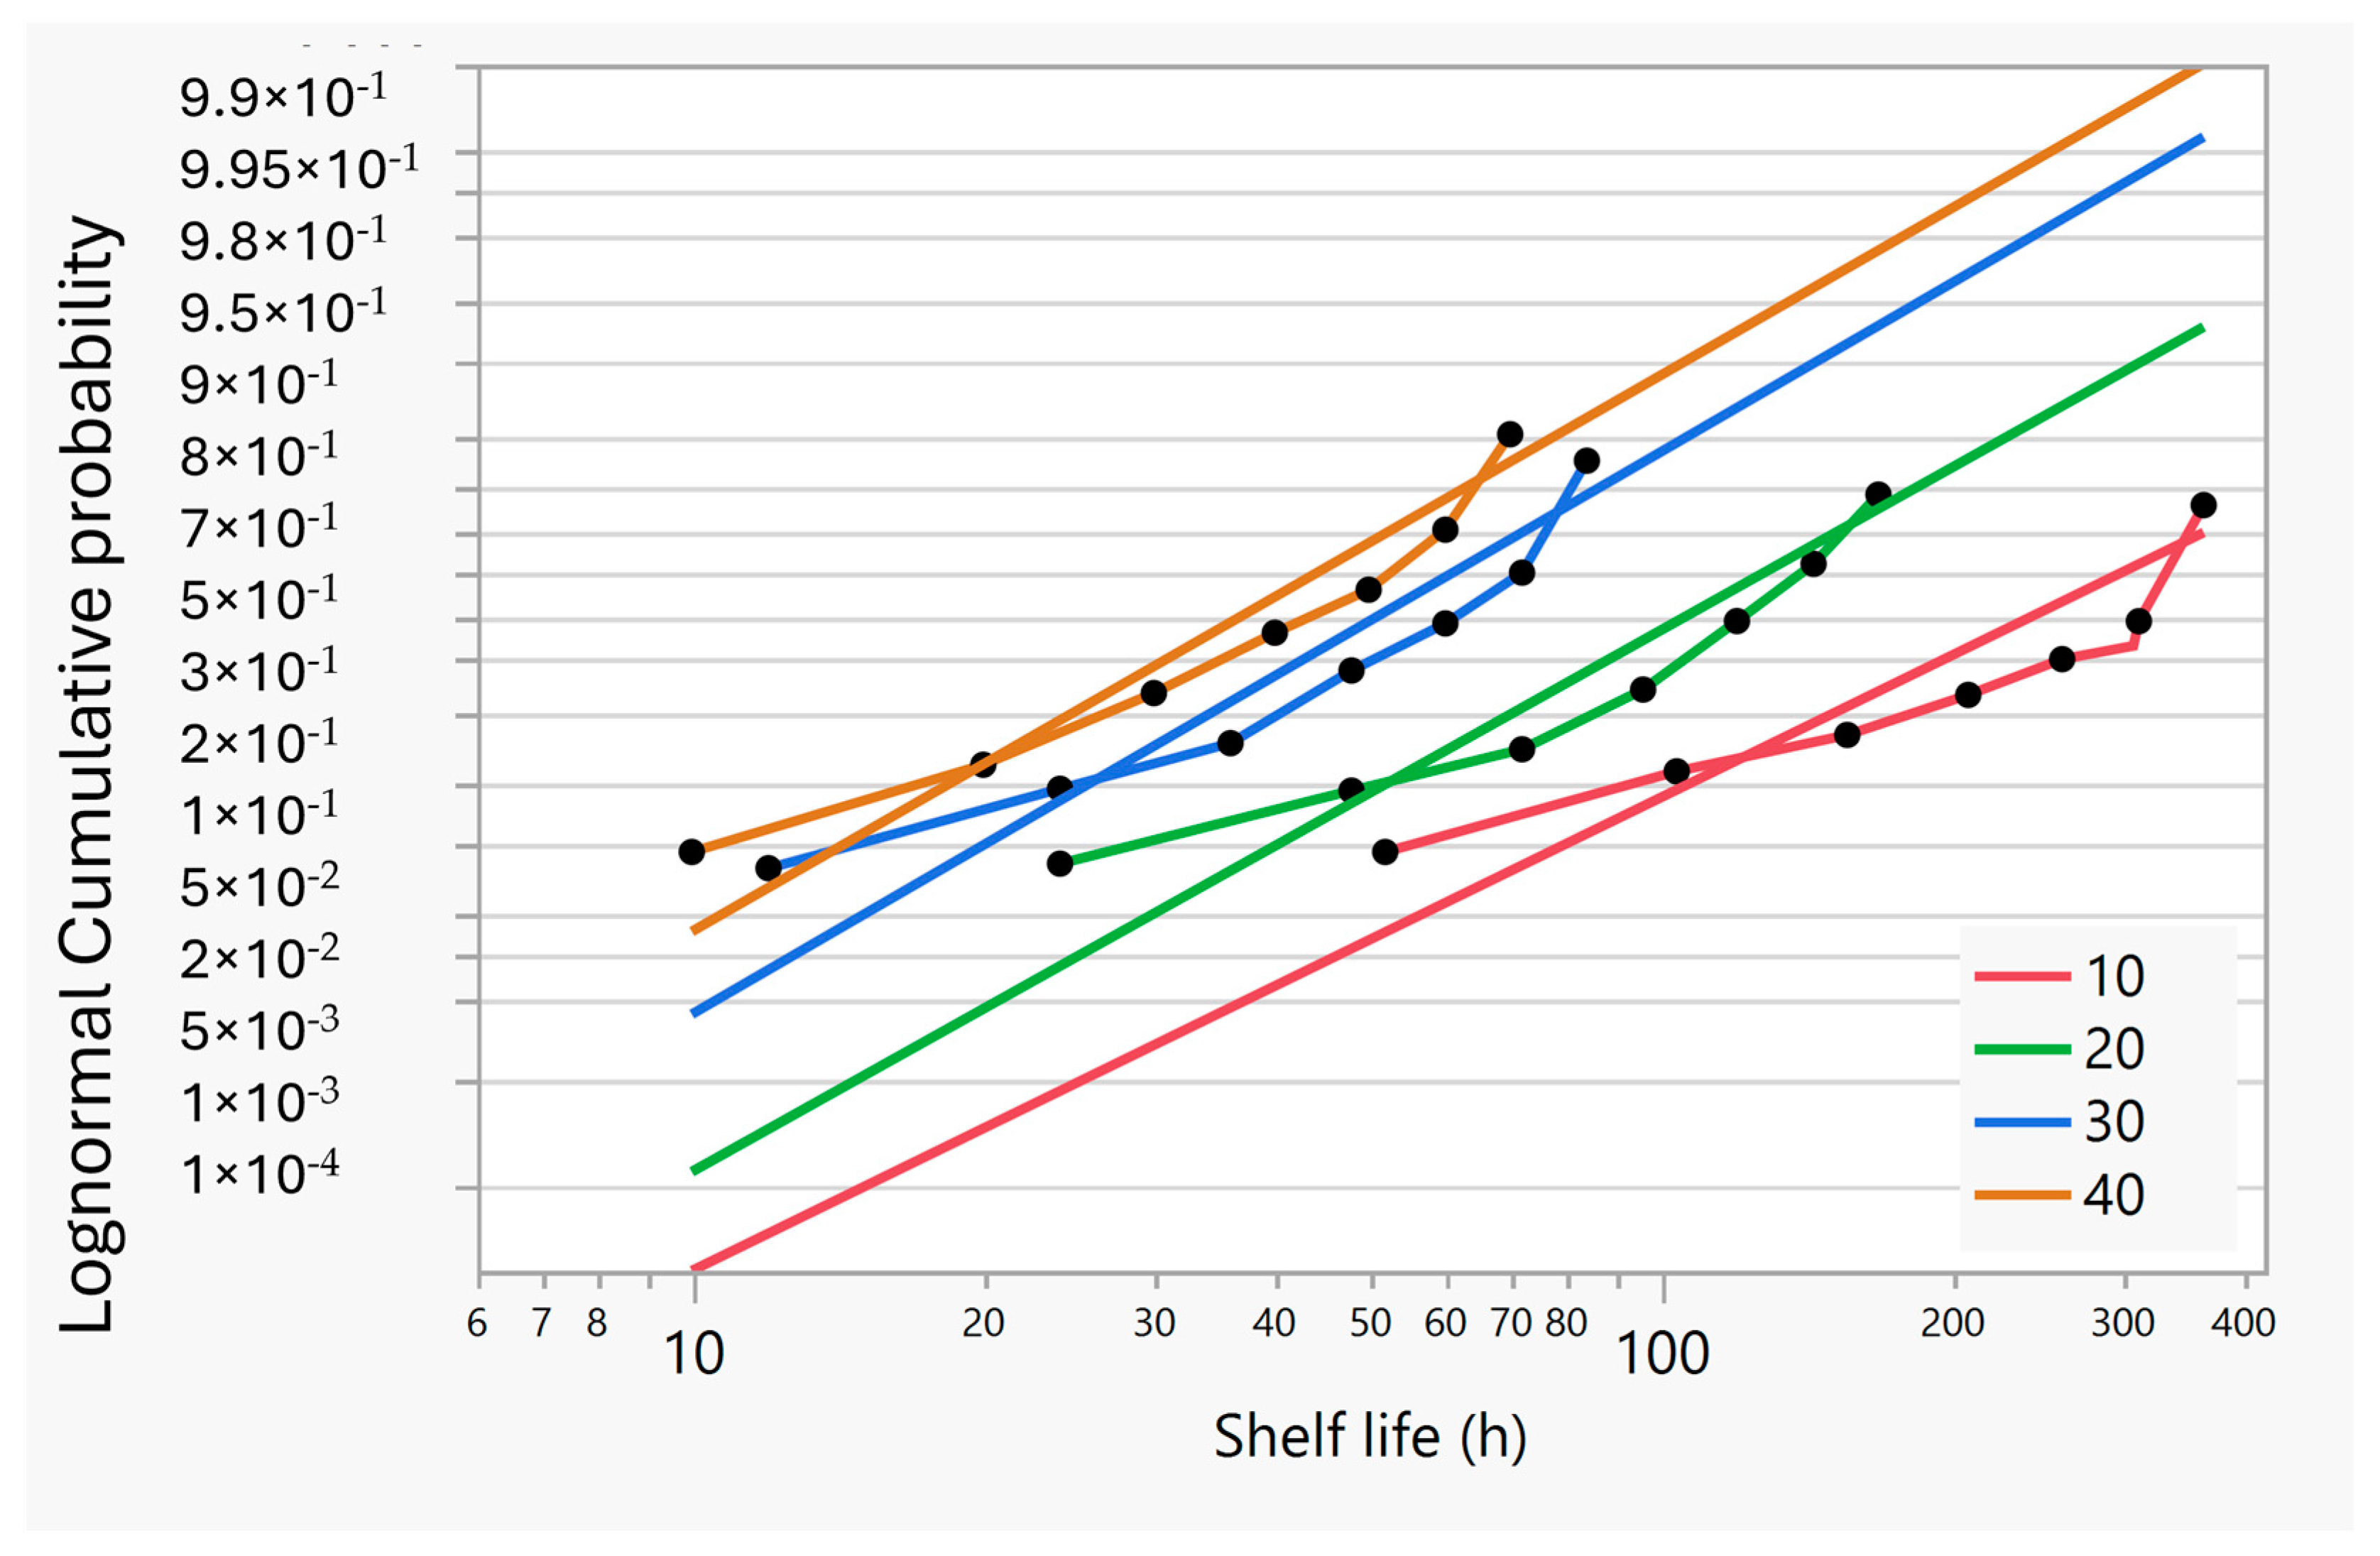
As an alternative approach, various regression models were attempted (exponential, weibull, lognormal), which revealed lognormal as the best fit performed at each temperature level (Figure 2).
Although the study points were not scattered equally on either side of the regression lines at all temperature levels (Figure 2), the estimates of the average shelf life in the table of parameters of the lognormal distribution yielded comparatively reliable results. In particular, the lognormal values of the survival times (h) were very close to those of the exponential model and thus indicated a second reliable model for fitting and predicting the sensory shelf-life data (Table 9).
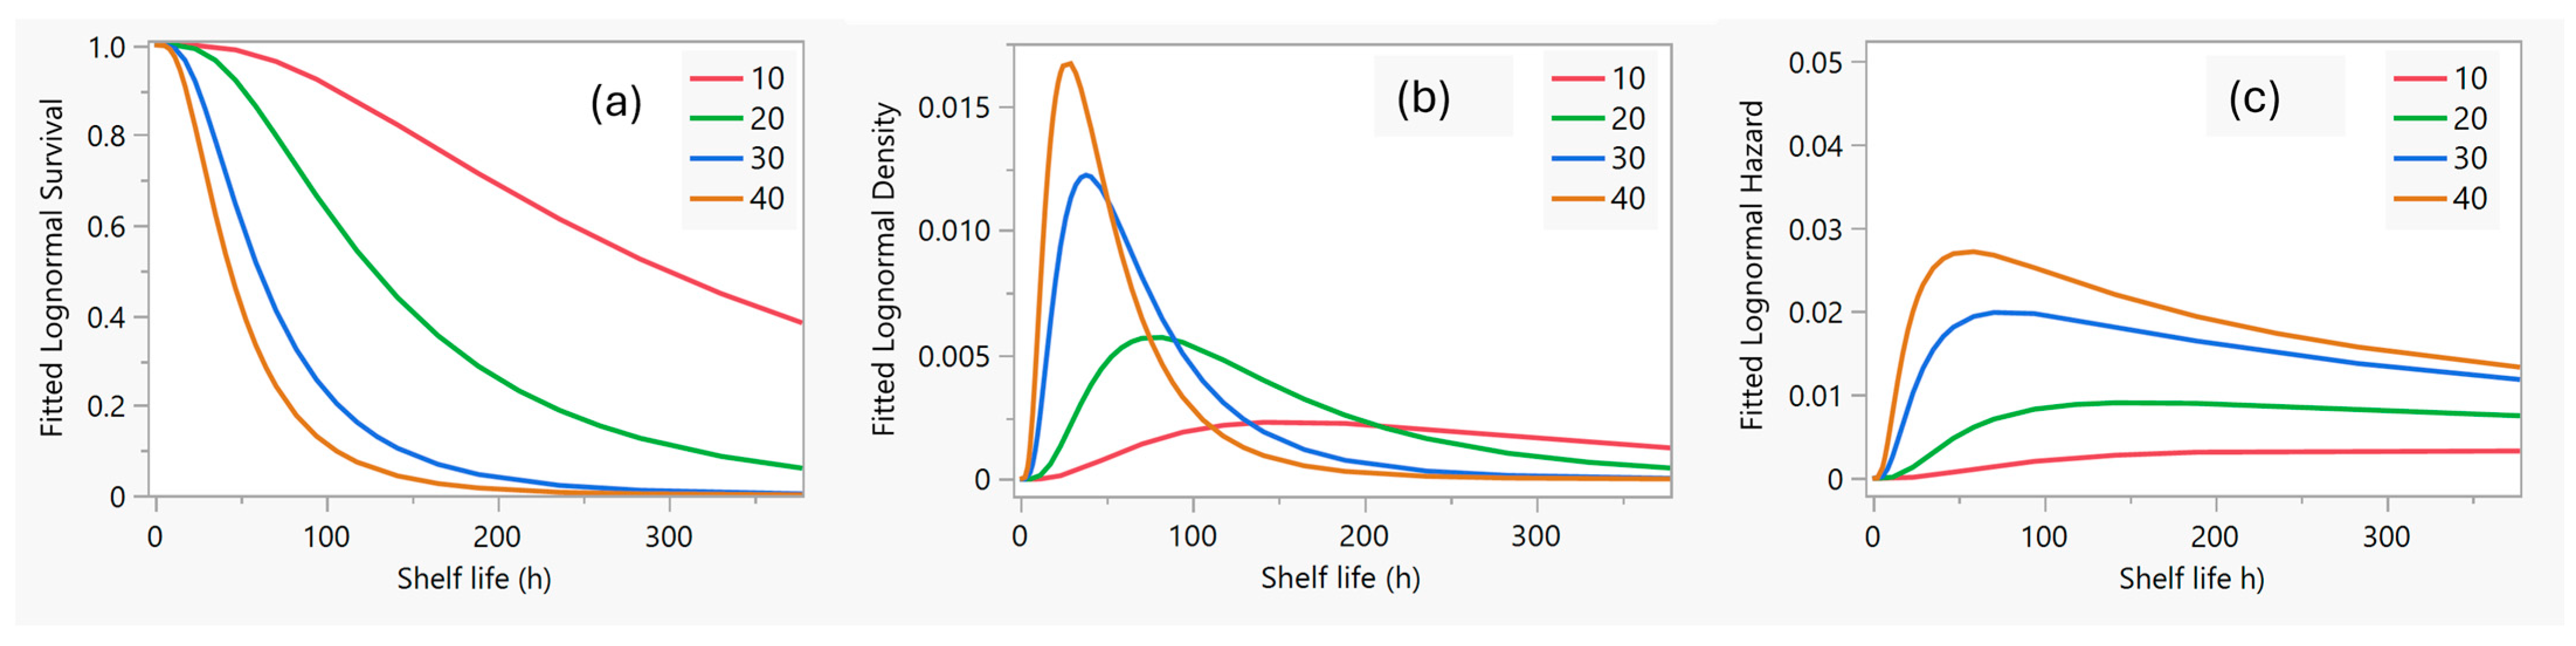
After applying the log-normal transformation, the fitted distributions of the analytical characteristics of survival time were obtained (Figure 3): At 80% survival, the shelf-life curves of the two highest temperatures started to differentiate remarkably with a 10-h difference from 40 to 30 °C, which doubled at 50% survival. Furthermore, at 20 and 10 °C and at 80% survival rate, the difference was significant (approximately 80 and 180 h, respectively) and became very large at 50% (approximately 175 and 300 h, respectively) (Figure 3a). This is in agreement with the results found by Buve et al. (2016) [16], where it was observed that acceptability rates do not have the same extrapolation with temperature levels. In the density distribution graph (Figure 3b), the peak of the 40 °C density curve was observed at 28 h, and, respectively, at 38, 76 and 150 h at the other temperature levels, showing the strong effect of heat stress on sensory shelf life, the magnitude of which was determined by the area occupied by the distribution spreads in the shelf life, which were very limited at high temperatures (30, 40 °C) and extended at lower temperatures (Figure 3b). The risk rate showed initially a steep upward trend at higher temperatures and peaked in less than 80 h, in contrast to the lower temperatures that showed a lower rate, which was extremely low at 10 °C (Figure 3c).

4. Conclusions

In the present study, an accelerated shelf-life testing method with temperature as an acceleration factor was used to evaluate the sensorial acceptability of orange juices stored at different temperature levels for prolonged time periods. The panel was comprised of untrained consumers, and data revealed that they were able to perceive sensory defects very early in the preservation period, which was related with the storage temperature of juices. Increasing temperature by 10 °C led generally to the reduction by half of the sensory shelf life provided that acceptance rate was around ~50%. Moreover, if considering the results from our previous study [20] dealing with the microbiological shelf life of pasteurized orange juices, it was observed that pasteurized orange juices tended to be sensorially rejected by consumers ~3 days before they would be microbiologically unstable for consumption. These results indicate that it is very important, much more for microbiologically safe products like orange juices, when manufacturing companies and government agencies try to establish shelf-life to take into account the sensory shelf life in order to not have losses of products and complaints about overall quality.

Author Contributions

Conceptualization, D.P. and A.K.; methodology, D.P. and A.K.; software, D.P. and T.F.; validation, D.P., A.K. and T.F.; formal analysis, D.P. and T.F.; investigation, D.P. and A.K.; resources, A.K.; data curation, D.P. and T.F.; writing—original draft preparation, T.F. and D.P.; writing—review and editing, T.F. and D.P.; visualization, D.P. and A.K.; supervision, D.P.; project administration, D.P.; funding acquisition, D.P., A.K. and T.F. All authors have read and agreed to the published version of the manuscript.

Funding

This research received no external funding.

Institutional Review Board Statement

Not applicable.

Informed Consent Statement

Not applicable.

Data Availability Statement

The original contributions presented in the study are included in the article; further inquiries can be directed to the corresponding author.

Conflicts of Interest

The authors declare no conflicts of interest.

References

  1. Dhenge, R.; Alinovi, M.; Lolli, V.; Aldini, A.; Rinaldi, M. Evaluation of quality parameters of orange juice stabilized by two thermal treatments (helical heat exchanger and ohmic heating) and non-thermal (high-pressure processing). Food Control 2022, 141, 109–150. [Google Scholar] [CrossRef]
  2. Pan, X.; Bi, S.; Lao, F.; Wu, J. Factors affecting aroma compounds in orange juice and their sensory perception: A review. Food Res. Int. 2021, 169, 112835. [Google Scholar] [CrossRef]
  3. Rodrigues, P.V.; Vieira, D.M.; Martins, P.C.; Martins, V.G.; Castro, M.C.R.; Machado, A.V. Evaluation of Active LDPE Films for Packaging of Fresh Orange Juice. Polymers 2023, 15, 50. [Google Scholar] [CrossRef] [PubMed]
  4. Yıldız, D.; Benzer Gürel, D.; Çağındı, O.; Kayaardı, S. Heat treatment and microwave applications on homemade sour cherry juice: The effect on anthocyanin content and some physicochemical properties. Curr. Plant Biol. 2023, 29, 100242. [Google Scholar] [CrossRef]
  5. Kumar, V.; Kohli, D.; Naik, B.; Ratore, A.; Kumar Gupta, A.; Masood Khan, J.; Irfan, M.; Preet, M.S.; Chatterjee, N.; Rustagi, S. Effect of heat treatment on the quality of citrus juices. J. King Saud Univ. Sci. 2023, 35, 102819. [Google Scholar] [CrossRef]
  6. Hough, G.; Garitta, L. Methodology for sensory shelf-life estimation: A review. J. Sens. Stud. 2012, 27, 137–147. [Google Scholar] [CrossRef]
  7. Giménez, A.; Ares, F.; Ares, G. Sensory shelf-life estimation: A review of current methodological approaches. Food Res. Int. 2012, 49, 311–325. [Google Scholar] [CrossRef]
  8. Haouet, M.N.; Tommasino, M.; Mercuri, M.L.; Benedetti, F.; Bella, S.D.; Framboas, M.; Pelli, S.; Altissimi, M.S. Experimental accelerated shelf life determination of a ready-to-eat processed food. Ital. J. Food Saf. 2019, 11, 6919. [Google Scholar] [CrossRef] [PubMed]
  9. Pedro, A.M.; Ferreira, M.M. Multivariate accelerated shelf-life testing: A novel approach for determining the shelf-life of foods. J. Chemom. 2006, 20, 76–83. [Google Scholar] [CrossRef]
  10. Nurhayati, R.; Susanto, A.; Khasanah, Y. Shelf life prediction for canned gudeg using accelerated shelf life testing (ASLT) based on Arrhenius method. IOP Conf. Ser. Mater. Sci. Eng. 2019, 193, 012025. [Google Scholar] [CrossRef]
  11. Klimczak, I.; Małecka, M. Evaluation of sensory profile and p-vinylguaiacol (pvg) content in orange juices during storage at different temperature. J. Food Qual. 2011, 34, 30–39. [Google Scholar] [CrossRef]
  12. Oliveira, A.; Ramos, A.M.; Minim, V.P.R.; Chaves, J.B.P. Sensory stability of whole mango juice: Influence of temperature and storage time. Food Sci. Technol. 2012, 32, 819–825. [Google Scholar] [CrossRef]
  13. Kishore, K.; Pathak, K.A.; Shukla, R.; Bharali, R. Effect of storage temperature on physico-chemical and sensory attributes of purple passion fruit (Passiflora edulis Sims). J. Food Sci. Technol. 2011, 48, 484–488. [Google Scholar] [CrossRef]
  14. Song, Q.; Rune, C.J.B.; Thybo, A.K.; Clausen, M.P.; Orlien, V.; Giacalone, D. Sensory quality and consumer perception of high pressure processed orange juice and apple juice. Lwt 2023, 173, 114303. [Google Scholar] [CrossRef]
  15. Polydera, A.C.; Stoforos, N.G.; Taoukis, P.S. Quality degradation kinetics of pasteurised and high pressure processed fresh Navel orange juice: Nutritional parameters and shelf life. Innov. Food Sci. Emerg. Technol. 2005, 6, 1–9. [Google Scholar] [CrossRef]
  16. Buvé, C.; Van Bedts, T.; Haenen, A.; Kebede, B.; Braekers, R.; Hendrickx, M.; Van Loey, A.; Grauwet, T. Shelf-life dating of shelf-stable strawberry juice based on survival analysis of consumer acceptance information. J. Sci. Food Agric. 2018, 98, 3437–3445. [Google Scholar] [CrossRef] [PubMed]
  17. dos Santos Navarro, R.D.C.; Minim, V.P.R.; da Silva, A.N.; Simiqueli, A.A.; Della Lucia, S.M.; Minim, L.A. Balanced incomplete block design: An alternative for data collection in the optimized descriptive profile. Food Res. Int. 2014, 64, 289–297. [Google Scholar] [CrossRef]
  18. Cochran, W.G.; Cox, G.M. Experimental Design, 2nd ed.; John Wiley and Sons: New York, NY, USA, 1957; p. 615. [Google Scholar]
  19. ISO 29842:2024; Sensory analysis—Methodology—Balanced incomplete block designs. ISO: Geneva, Switzerland, 2024.
  20. Frangopoulos, T.; Koliouskas, A.; Petridis, D. The Effect of Accelerated Storage Temperature Conditions on the Shelf Life of Pasteurized Orange Juice Based on Microbiological, Physicochemical, and Color Attributes. Appl. Sci. 2024, 14, 10870. [Google Scholar] [CrossRef]
  21. Surkan, S.; Albani, O.; Ramallo, L. Influence of storage conditions on sensory shelf life of yerba mate. J. Food Qual. 2009, 32, 58–72. [Google Scholar] [CrossRef]
  22. Zhang, J.; Han, H.; Xia, J.; Gao, M. Degradation kinetics of vitamin C in orange and orange juice during storage. Adv. J. Food Sci. Technol. 2016, 12, 555–561. [Google Scholar] [CrossRef]
  23. Burdurlu, H.S.; Koca, N.; Karadeniz, F. Degradation of vitamin C in citrus juice concentrates during storage. J. Food Eng. 2006, 74, 211–216. [Google Scholar] [CrossRef]
  24. Li, X.; Ren, J.N.; Fan, G.; Pan, S.Y. Changes of aroma compounds and qualities of freshly-squeezed orange juice during storage. J. Food Sci. Technol. 2018, 55, 4530–4543. [Google Scholar] [CrossRef] [PubMed]
  25. Bauersachs, E.; Walser, V.; Reglitz, K.; Dawid, C.; Steinhaus, M. Peracetic acid residues in orange juice can lead to a 5-vinylguaiacol-induced clove-like off-flavor via Baeyer-Villiger oxidation of hesperidin. Food Chem. 2024, 440, 138252. [Google Scholar] [CrossRef]
  26. Kopuncová, M.; Sádecká, J.; Kolek, E.; Dimitrov, F.; Tobolková, B.; Durec, J.; Blaško, J. Aroma stability and sensory aspects of commercially produced orange juice: Gas chromatography–olfactometry study. Chem. Pap. 2022, 76, 4941–4953. [Google Scholar] [CrossRef]
  27. Gámbaro, A.; Fiszman, S.; Giménez, A.; Varela, P.; Salvador, A. Consumer acceptability compared with sensory and instrumental measures of white pan bread: Sensory shelf-life estimation by survival analysis. J. Food Sci. 2004, 69, S401–S405. [Google Scholar] [CrossRef]
Scheme 1. Inverse preservation plan process stages.
Applsci 15 01809 sch001
Figure 1. Survival curves with 95% confidence intervals (dashed lines) of pasteurized orange juice stored at different temperature levels.
Applsci 15 01809 g001
Figure 2. Cumulative failure probability versus shelf life of pasteurized orange juice at each storage temperature level of the lognormal transformation.
Applsci 15 01809 g002
Figure 3. Fitted distributions of the analytical characteristics of survival time using lognormal transformation at each temperature level (a) survival curves as a function of shelf life (h), (b) density curves as a function of shelf life (h), (c) hazard curves as a function of shelf life (h).
Applsci 15 01809 g003
Table 1. Time intervals for orange juice sampling at the corresponding storage temperatures (h in blue color).
HoursTemperature (°C)
10 20 30 40
15282415122210
210494816242320
3156107217362430
4208119618482540
52601212019602650
63121314420722760
73641416821842870
Table 2. A balanced incomplete block design adapted for the sensory requirements of each consumer (b).
bt = 28, k = 7, b = 36, n = 9, λ = 2
Τreatments (t)
14789142328
215910111524
3681315161821
47121317222425
54101617202627
62111819222628
713612192327
823514202125
912810121625
102369111317
11451213151926
12371618192024
136101421222426
1411152022232527
15151718182728
1627912212627
17381013222728
186121415172028
19481117192125
201131418232526
212456162223
22341011121418
23191416171922
2412413202428
2535817232426
2656710192528
271678112026
289101319202123
29281415192527
30391516252628
3158912182022
3211121621232428
331347152122
34571113141627
3546918242527
36271015171823
Table 3. Αcceptances (Y) and rejections (N) of orange juices at different storage times and temperature levels.
1020304010203040
Time (h)52104156208260312364244872961201441681224364860728410203040506070
1 Y YYY Y Y N>364>168 70
2Y Y YYN N Y >2609612>30
3 N Y N YY Y N 31214484
4 Y YY N Y YY >364>14436>40
5 N N YY Y YN 20872>7260
6 N Y NY N Y N104>964810
7N N Y N Y Y N Y 52120>6020
8 YY Y YN Y >260>16884>40
9NY N Y Y Y Y 5224>24>40
10 YY Y Y N Y Y >31296>36
11 YY YY N Y Y >260>14412>50
12 Y Y NYN Y 364 48>30
13 Y N N YY N N >31272>8430
14 Y N N YN Y Y >961220
15Y N YN N NN260>2084860
16 Y Y N N YY 36412084>60
17 Y Y Y Y Y NN>208>144 60
18 Y Y NY N N N>3121683670
19 Y N N Y Y N N >308248440
20Y YN Y Y NN >52168>4840
21 Y YYN Y NN 31252>2410
22 YY YYY Y Y >208>168>48
23N N Y NY N N 52482410
24NN Y N Y Y N52144>7270
25 Y Y N Y YY Y >26024>36>50
26 YYN Y Y Y 364>72>60>70
27Y YNY N N N 364967250
28 YY Y YNN Y >14472>20
29 Y Y YY Y N Y >104>168>6030
30 Y Y YY YY Y>156>48>24>70
31 Y YY N N Y N >2601204810
32 YY N YN N >1202430
33Y YN N Y YY 208 >84>10
34 Y Y Y NY Y Y >364144>24>60
35 Y N Y N YN Y 312>484840
36 Y N Y Y YN Y 364>7248>20
37 N NYY N Y Y208168 >20
38N N YYY N N 52>961230
39 Y Y Y NN Y N >312>14412
40 N NY Y Y NY 364120>3630
41 N Y YN Y NY 208>723650
42 N N NN Y Y N104964870
43Y N N N Y N Y 156120>6020
44 YY N Y NY Y 260>16872>40
45NY Y N Y Y N 52725>2440
46 NN N Y N Y Y 10496>36
47 YY NN Y N N >2601206050
48 Y N NNY N 364 2430
49 Y N NY N N 3121688430
50 N Y Y NY N N 96>7210
51Y Y YN N NN>260 4860
52 Y N Y N N NN 3641208450
53 N N Y N Y NN15624 60
54 Y Y YY Y N N>312>1687270
55 Y Y N Y Y N Y >2089684>40
56Y YN N Y YN >521684850
57 Y YYY Y YY >312 >24>20
58 YY YYY Y N >208>16848
59Y Y N YY Y Y >52168>60>10
60YY N N N Y N2081447270
61 Y Y N N YN N >260243630
62 NNY N Y Y 26072>60>70
63Y YNY Y Y N Y 364>9672>50
64 NY YNN Y 4872>20
65 Y Y NY Y Y N >104168>6060
66 N Y YY NN N156>48>2440
67 Y YY N Y N Y >26012072>10
68 YY N YY N >1208470
69Y YY N Y Y 364 >8410
70 Y Y Y NN Y N >260144>2460
71 Y Y Y Y NY N >208>48>4830
72 Y N Y Y YY N 364>72>4820
NO64554713524887954411411146596101014
YES12141313141151316141010119131414714741213912884
18181818181818181818181818181818181818181818181818181818
Table 4. Survival time (h) at different temperature levels using the Kaplan–Meier estimator.
Temperature Level (°C)FailuresPassesMedian Time (h)DaysSE
103531287.91213.8
203826126.85.36.0
30392963.02.63.0
40432348.22.02.7
Combined155109168.9 9.6
Table 5. Comparison of sensory with microbial shelf life of pasteurized orange juice.
Temperature Level (℃)Survival Time (Days)
Sensory Shelf LifeMicrobiological Shelf Life
Exponential ModelPolynomial Model
101215.116.4
205.36.67.2
302.63.64.5
402.03.13.2
Table 6. Sensory shelf life of pasteurized orange juice at different temperature levels.
Temperature Level (°C)Median Time (h)Days−95%+95%25% Failures75% Failures
1036415.2312364208364
201446.012016896168
30723.048844884
40502.140603070
Combined120 8414452312
Table 7. Homogeneity test of survival data between temperature levels.
Homogeneityχ2DFp
Log-rank153.123<0.0001
Kruskal–Wallis110.823<0.0001
Table 8. Analytical survival rate of pasteurized orange juice shelf life (h) at each temperature level.
Temperature Level (°C)Shelf Life (h)SurvivalFailureSENumber FailedNumber Passedat Risk
1001000066
520.910.090.046366
1040.860.140.043257
1560.810.190.053152
2080.730.270.065548
2600.670.330.0631038
3080.670.330.060125
3120.560.440.074624
3640.120.880.0611314
2001000064
240.920.080.035064
480.890.110.042459
720.820.180.054453
960.70.30.067445
1200.530.470.078234
1440.420.580.075524
1680.210.790.077714
3001000068
120.930.070.035068
240.880.120.043863
360.810.190.054452
480.630.370.0610444
600.610.390.071730
720.390.610.078322
840.110.890.068311
4001000066
100.910.090.046366
200.850.150.054557
300.690.310.069248
400.590.410.065537
500.480.520.075327
600.310.690.077219
700.090.910.057310
Table 9. Lognormal distribution parameters of pasteurized orange juice shelf life stored at different temperature levels.
Temperature (°C)ParameterEstimateHDaysLower 95%Upper 95%Number Failed
10μ5.729812.45.485.9635
10σ0.829812.40.641.0435
20μ4.85127.55.34.665.0738
20σ0.7127.55.30.570.938
30μ4.1160.82.53.934.3239
30σ0.6760.82.50.550.8639
40μ3.7901.83.63.9843
40σ0.6801.80.560.8643
Disclaimer/Publisher’s Note: The statements, opinions and data contained in all publications are solely those of the individual author(s) and contributor(s) and not of MDPI and/or the editor(s). MDPI and/or the editor(s) disclaim responsibility for any injury to people or property resulting from any ideas, methods, instructions or products referred to in the content.

