Abstract
The mineral deposits in Namibia’s Erongo region are renowned and frequently associated with complex geological environments, including calcrete-hosted paleochannels and hydrothermal alteration zones. Mineral extraction is hindered by high operational costs, restricted accessibility and stringent environmental regulations. To address these challenges, this study proposes an integrated approach that combines satellite remote sensing and machine learning to map and identify mineralisation-indicative zones. Sentinel 2 Multispectral Instrument (MSI) and Landsat 8 Operational Land Imager (OLI) multispectral data were employed due to their global coverage, spectral fidelity and suitability for geological investigations. Normalized Difference Vegetation Index (NDVI) masking was applied to minimise vegetation interference. Spectral indices—the Clay Index, Carbonate Index, Iron Oxide Index and Ferrous Iron Index—were developed and enhanced using false-colour composites. Principal Component Analysis (PCA) was used to reduce redundancy and extract significant spectral patterns. Supervised classification was performed using Support Vector Machine (SVM), Random Forest (RF) and Maximum Likelihood Classification (MLC), with validation through confusion matrices and metrics such as Overall Accuracy, User’s Accuracy, Producer’s Accuracy and the Kappa coefficient. The results showed that RF achieved the highest accuracy on Landsat 8 and MLC outperformed others on Sentinel 2, while SVM showed balanced performance. Sentinel 2’s higher spatial resolution enabled improved delineation of alteration zones. This approach supports efficient and low-impact mineral prospecting in remote environments.
1. Introduction
The Erongo region in central-western Namibia is globally recognised for its abundant natural resources and, in particular, large uranium deposits that position Namibia among the world’s leading producers [1]. Its complex geological framework, shaped by extensive tectonic development, hosts diverse mineralisation settings, including pegmatitic intrusions linked to rare earth elements and lithium-bearing minerals [2], hydrothermal alteration systems and calcrete-hosted paleochannel uranium deposits such as Tumas and Langer Heinrich [3], as well as granite-hosted deposits like Rössing and Husab [4]. The region’s mineral potential is closely tied to its location within the Damara Orogenic Belt [5], characterised by varied lithological units, shear zones, lineaments and structural dislocations conducive to ore-forming processes.
Despite these resources, mineral exploitation faces logistical and environmental constraints, including a semi-arid climate, rugged terrain, sparse population and ecological sensitivity, particularly within areas such as the Namib-Naukluft National Park and ephemeral river systems [6,7]. Traditional ground surveys, though geologically sound, are costly, time-consuming and often impractical in early-stage exploration, especially where infrastructure and accessibility are limited. Satellite-based remote sensing offers a rapid, cost-effective and non-invasive alternative for detecting surface mineralogical and structural properties [8]. Multispectral sensors such as Landsat 8’s Operational Land Imager (OLI) and Sentinel 2’s Multispectral Instrument (MSI) provide moderate spatial and spectral resolution across the visible to Shortwave infrared (SWIR) ranges [9,10], enabling the enhancement of reflectance features of alteration minerals like kaolinite, haematite, muscovite and chlorite [11], through spectral indices and band ratios.
Recent advances in remote sensing have transformed lithological mapping from simple empirical band ratios to sophisticated image-processing and machine learning frameworks that exploit multispectral and hyperspectral data for geological discrimination. Techniques such as Principal Component Analysis (PCA), Independent Component Analysis (ICA) and Minimum Noise Fraction (MNF) enhance lithological separability by isolating spectral variance associated with mineralogical and textural differences [12]. PCA, in particular, reduces data redundancy and accentuates alteration anomalies even under partial vegetation or soil cover, improving geological interpretability [13]. Numerous studies have confirmed that PCA-enhanced Landsat 8 and Advanced Spaceborne Thermal Emission and Reflection Radiometer (ASTER) composites effectively differentiate felsic, mafic and metasedimentary units in arid environments [14,15], while Sentinel 2’s finer spatial and spectral detail further improves delineation of lithological contacts, alteration halos and structurally controlled mineralisation features [14]. Complementarily, digital image processing techniques such as band ratioing and supervised classification further enhance spectral discrimination and feature extraction even under partial soil or vegetation cover [16]. The integration of Sentinel 2 and Landsat 8 datasets maximises their complementary spectral and spatial strengths, enabling enhanced mineral targeting across complex terrains. Parallel progress in machine learning classification has greatly increased mapping accuracy by modelling non-linear spectral relationships and handling high-dimensional datasets. Algorithms such as Random Forest (RF) [17], Support Vector Machine (SVM) [18] and Maximum Likelihood Classification (MLC) [19], alongside others evaluated in global studies [20], are among the most widely employed for lithological and alteration mapping. RF is robust to noise and overfitting, SVM performs well with limited training data and non-linear separability and MLC remains useful for probabilistic class delineation where spectral normality is assumed. Comparative investigations, including those by Pal et al. [21], Thomas et al. [22] and Abay et al. [23], have demonstrated that RF and SVM generally outperform traditional classifiers, yielding higher thematic consistency in complex terrains. Consequently, integrating multispectral imagery (Sentinel 2 and Landsat 8) with PCA-based feature extraction and machine learning algorithms provides a scalable, data-driven and operationally efficient solution for lithological and hydrothermal alteration mapping in semi-arid regions such as Erongo.
Namibia’s Minerals Policy [24], Vision 2030 [25] and the Harambee Prosperity Plan II [26], promote non-invasive and technologically advanced exploration methods that align with sustainable mineral governance. Addressing gaps in region-specific frameworks, this study develops and evaluates an integrated approach combining Sentinel 2 and Landsat 8 imagery, spectral indices, Principal Component Analysis (PCA) and machine learning classification to improve the mapping of hydrothermal alteration zones in the Erongo region. The objectives of this study are fourfold. First, we calculate and apply four spectral indices, namely the Clay Index, Ferrous Iron Index, Carbonate Index and Iron Oxide Index, in order to spatially delineate potential alteration zones. Second, we create composites from these indices and apply Principal Component Analysis (PCA) to strengthen mineral identification from multispectral imagery. Third, we conduct supervised classifications of the PCA-derived composites using Random Forest (RF), Support Vector Machine (SVM) and Maximum Likelihood Classification (MLC). Finally, we validate the mapped mineral zones by comparing them with documented mineral deposit occurrences.
2. Materials and Methods
2.1. Study Area
The Erongo region lies in central-western Namibia between latitudes 21° S and 23° S, bounded by the Atlantic Ocean to the west and the inland terrain to the east, as seen in Figure 1. It forms part of the Central Zone of the Damara Orogenic Belt, a late-Proterozoic to early-Palaeozoic mobile belt that developed from the collision between the Congo and Kalahari cratons. The belt records multiple episodes of deformation, metamorphism and magmatism between 750 Ma and 480 Ma [5,27], giving rise to a complex lithological framework that exerts a primary control on mineralisation.
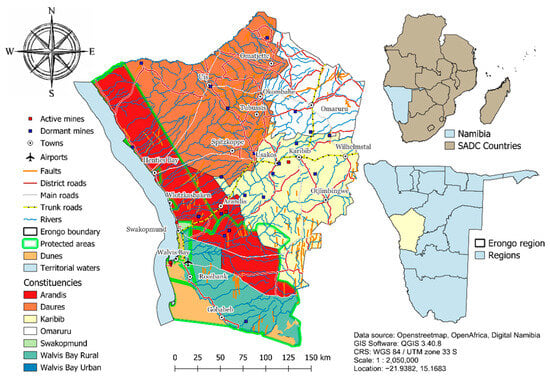
Figure 1.
Map of Erongo region, Namibia, showing administrative boundaries, infrastructure, land features and mining activity.
The region’s bedrock comprises metasedimentary and igneous formations of the Damara Supergroup, including schists, marbles, quartzites and calc-silicate rocks intruded by voluminous granitic bodies such as the Erongo, Salem, Okombahe and Omatjete batholiths [28]. The Erongo Granite Complex, emplaced at approximately 130 Ma, forms a circular ring massif consisting of syenitic, monzonitic and granitic phases hosting miarolitic pegmatites enriched in Li–Be–Ta–Sn–Nb–U–Th minerals [2,29]. To the north-west, the Brandberg Massif, Namibia’s highest mountain, represents a Cretaceous granitic intrusion of similar petrogenetic origin [30]. Surrounding these intrusions are metasedimentary units of the Kuiseb Formation and metavolcanic sequences of the Nosib and Swakop Groups, locally metamorphosed to amphibolite facies [28].
Towards the west, the terrain grades into Namib Desert plains mantled by calcrete and aeolian deposits, where palaeochannel-hosted uranium systems such as Langer Heinrich and Tumas occur through secondary mobilisation and precipitation of uranium under oxidising arid conditions [3,30]. Eastward, the lithologies transition into folded schists and gneisses intersected by dolerite dykes and quartz veins, frequently associated with hydrothermal alteration halos rich in clays, iron oxides and carbonates [4,31]. North-northeast-trending faults, domal uplifts and ring fractures strongly influence the localisation of mineralisation, fluid flow and alteration zoning [31].
Major mineral occurrences include uranium (Rössing, Husab, Langer Heinrich, Tumas) [3,4,31], lithium- and tin-bearing pegmatites near Uis [2]. Gold deposits at Navachab and Karibib, along with additional occurrences near Otjimbingwe and copper showings around Omaruru, reflect structurally controlled mineralisation along the Damara Belt [32]. These are spatially aligned with granitic intrusions, shear zones and palaeodrainage systems that define key exploration corridors.
Key settlements like Karibib, Omaruru, Arandis, Swakopmund and Walvis Bay are strategically located along major mining and transport corridors, serving as industrial and logistical hubs supporting exploration and ore export [33]. Elevations range from sea level to about 2200 m across the Erongo and Brandberg massifs. Ecologically sensitive zones such as the Walvis Bay wetlands and Namib-Naukluft National Park necessitate low-impact exploration approaches [34].
Figure 2 presents a simplified geological map compiled from the Geological Survey of Namibia dataset. It delineates the main lithostratigraphic units and overlays the locations of active and historical mines obtained from the Ministry of Mines and Energy (MME) [35].
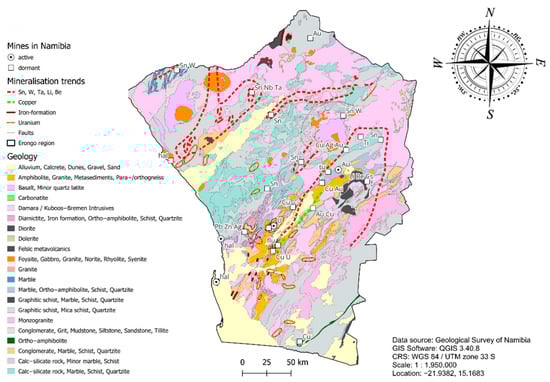
Figure 2.
Geological map of the Erongo Region, Namibia, illustrating the principal lithological units, the relevant mines in Namibia and what has been extracted by them.
The region’s arid climate, cloud-free skies and low atmospheric moisture amplify spectral contrast and radiometric quality [36], favouring remote-sensing techniques such as band ratioing, spectral index analysis and Principal Component Analysis (PCA) for lithological mapping and hydrothermal alteration detection.
2.2. Data Sources and Acquisition
This study utilised both satellite and ancillary geospatial data to support the identification of alteration minerals and mineral mapping within the Erongo region of Namibia. Using Table 1, the primary satellite datasets included Landsat 8 Operational Land Imager (OLI) imagery with a 30-m spatial resolution, sourced from the United States Geological Survey (USGS) Earth Explorer and Sentinel 2A and 2B Multispectral Instrument (MSI) imagery with spatial resolutions ranging from 10 to 20 m, obtained from the Copernicus Open Access Hub. All imageries were carefully selected from the dry season, between 7 September and 30 September 2024 for Landsat 8 and 30 September to 1 November 2024 for Sentinel 2, to minimise atmospheric interference and ensure minimal cloud cover, thereby improving the reliability of spectral analysis and classification. The coverage from both sensors is presented in Figure 3, while Figure 4 illustrates the methodological framework adopted for data pre-processing, spectral index generation, PCA and classification. The spectral and spatial characteristics of the Landsat 8 and Sentinel 2 bands are summarised in Table 2, detailing their wavelengths, spatial resolutions and geological relevance for mineral discrimination.

Table 1.
Geospatial datasets used in this study, including data type and source for satellite imagery, mineral occurrences and administrative boundaries.
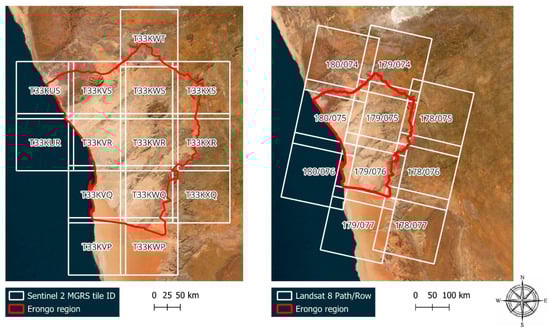
Figure 3.
Satellite scene coverage of the Erongo region showing Sentinel 2 MGRS tile IDs (left) and Landsat 8 Path/Row scenes (right).
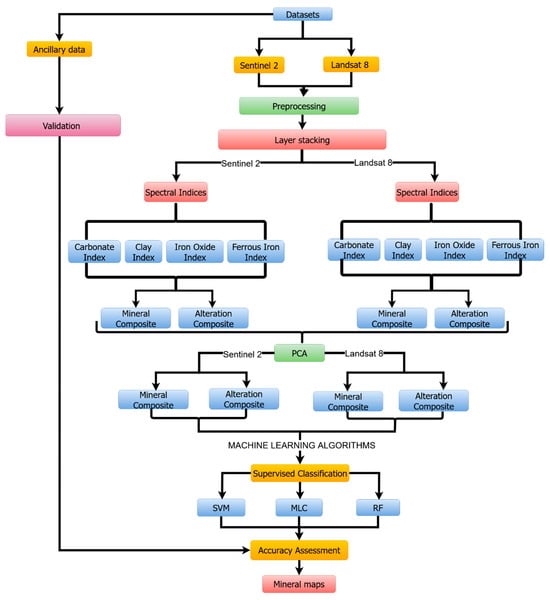
Figure 4.
Methodological framework for mineral exploration in the Erongo region using Sentinel 2 and Landsat 8 imagery. The process covers preprocessing, spectral index generation, PCA and supervised classification (SVM, MLC, RF), followed by accuracy assessment.
Table 2.
Spectral and spatial characteristics of the Landsat 8 and Sentinel 2 bands utilised in this study, including resolution, wavelength (or central wave) and band descriptions.
The exclusive use of Landsat 8 and Sentinel 2 imagery in this study was based on their complementary spectral coverage, open accessibility and proven reliability in geological and mineral mapping applications, particularly within arid and semi-arid environments [10,20].
Ancillary data were also integrated to enhance spatial accuracy and support classification processes. A shapefile of the Erongo region, sourced from Digital Namibia, was used to subset the satellite imagery to the specific study area. Known mineral occurrence points were obtained from the Geological Survey Department of the Ministry of Mines and Energy in Namibia, where these points served as ground reference data for validating the classification outputs during accuracy assessment.
2.3. Preprocessing
Prior to analysis, both Landsat 8 and Sentinel 2 datasets underwent a series of preprocessing steps to ensure spatial consistency and spectral integrity. Image preparation began with layer stacking of selected spectral bands. As presented in Table 2, for Landsat 8, Bands 2 through 7 were stacked to capture the visible, near-infrared (NIR) and shortwave infrared (SWIR) regions essential for mineral discrimination. In the case of Sentinel 2, the bands selected included Blue, Green, Red, NIR, SWIR1 and SWIR2. Since Sentinel 2 bands vary in spatial resolution, all bands were resampled to a common 10-metre resolution to facilitate uniform analysis and integration. Following band stacking, both datasets were clipped to the administrative boundary of the Erongo region using the region’s shapefile. This step ensured that subsequent analyses were spatially focused on the designated study area.
2.3.1. Atmospheric Correction
All satellite imageries used in this study were pre-processed to surface reflectance. Landsat 8 Level 2 Science Products (L2SP) downloaded from the USGS Earth Explorer were atmospherically corrected using the Land Surface Reflectance Code (LaSRC) and delivered as surface reflectance (SR) data. Similarly, Sentinel 2 Level 2A products, obtained from the Copernicus Open Access Hub were corrected to Bottom-of-Atmosphere (BOA) reflectance using the Sen2Cor (Telespazio VEGA Deutschland GmbH, Darmstadt, Germany) processor. As both datasets were already corrected, no further radiometric correction was necessary. The images were ready for subsequent spectral index calculation, Principal Component Analysis (PCA) and classification.
2.3.2. Vegetation Masking
To isolate bare earth and exposed lithological units from vegetated surfaces, the Normalised Difference Vegetation Index (NDVI) [41] was calculated for both Landsat 8 and Sentinel 2 imagery. NDVI is a widely used spectral index for quantifying vegetation cover, defined as (1):
A threshold of NDVI < 0.3 was applied to mask out vegetated areas, retaining only pixels representing bare ground or sparsely vegetated surfaces for spectral analysis. This threshold was selected to exclude dense vegetation while preserving mineralogical signals from exposed terrain relevant to hydrothermal alteration mapping. The resulting NDVI mask was applied to both Landsat 8 and resampled Sentinel 2 composites to ensure consistency across datasets.
2.4. Composite Creation and Principal Component Analysis (PCA)
To enhance the spectral discrimination of mineralogical and alteration zones, a set of targeted spectral indices was computed for both Landsat 8 and Sentinel 2 imagery. These indices were carefully selected based on their proven ability to highlight key mineralogical features commonly associated with hydrothermal alteration processes such as clay minerals, carbonates and iron oxides. Each index exploits specific spectral absorption characteristics in the SWIR, NIR and visible regions, enabling improved surface differentiation of geologically relevant materials. The selected indices are highlighted in Table 3, all of which have been validated in previous remote-sensing studies related to mineral and alteration mapping conducted across varied environmental conditions, including vegetated and semi-arid terrains [42,43].
Table 3.
Landsat 8 and Sentinel 2 band combinations used for generating spectral indices, including Carbonate Index (CarbI), Clay Index (CI), Ferrous Iron Index (FII) and Iron Oxide Index (IOI).
2.4.1. Spectral Index Calculation
For the following mineral indices, using Landsat 8, band ratios were applied: the Carbonate Index (B7/B6) to identify carbonate-bearing lithologies, Clay Index (B6/B7) to emphasise clay-rich zones, Ferrous Iron Index (B6/B5) for highlighting ferrous iron minerals and Iron Oxide Index (B4/B2) for detecting ferric iron content. Sentinel 2-based mineral indices included the Carbonate Index (B12/B11), Clay Index (B11/B12), Ferrous Iron Index (B11/B8) and Iron Oxide Index (B4/B2), making use of the higher spatial resolution and broader spectral range of the MSI sensor. Based on these indices, two composite images were created for each sensor to improve the spectral discrimination of mineralogical and alteration features, as presented in Table 4. The mineral composite consisted of a configuration combining the Clay Index, Ferrous Iron Index and Iron Oxide Index, while the alteration composite used the Carbonate Index, Ferrous Iron Index and Iron Oxide Index in the RGB channels.
Table 4.
RGB band combinations used to generate mineral and alteration composites from Landsat 8 and Sentinel 2 imagery, based on Clay Index, Ferrous Iron Index, Iron Oxide Index and Carbonate Index inputs.
The selection of these four indices was guided by the diagnostic absorption and reflectance properties of alteration-related minerals in the visible near-infrared (VNIR) and shortwave infrared (SWIR) regions. The Carbonate Index exploits absorption near 2.33 µm caused by CO32− molecular vibrations in calcite and dolomite-bearing rocks (B7/B6 for Landsat 8; B12/B11 for Sentinel 2). The Clay Index targets Al–OH absorption features around 2.20 µm, typical of kaolinite, montmorillonite and illite minerals (B6/B7 for Landsat 8; B11/B12 for Sentinel 2). The Ferrous Iron Index captures Fe2+ electronic transitions in the NIR–SWIR range (B6/B5 for Landsat 8; B11/B8 for Sentinel 2), allowing discrimination of ferrous-bearing silicates such as biotite, chlorite and pyroxene. The Iron Oxide Index relies on the high reflectance contrast between the visible red and blue regions (B4/B2) that characterises ferric oxides (Fe3+) like hematite, limonite and goethite [22,23,51].
To validate their effectiveness, the computed indices were cross compared with known mineral occurrences obtained from the Geological Survey of Namibia and further examined through Principal Component Analysis (PCA). Areas showing high index values that spatially coincided with documented alteration zones, such as around Rössing and Husab, confirmed that the indices successfully enhanced relevant mineral spectral responses within the Erongo geological context.
2.4.2. Principal Component Analysis (PCA)
Following the index calculation, Principal Component Analysis (PCA) was performed separately for each composite group for both Landsat 8 and Sentinel 2. The PCA transformation served to reduce data dimensionality while enhancing spectral variance among alteration and mineral signatures. For each dataset, three principal components (PC1, PC2 and PC3), which accounted for the majority of variance, were extracted and recombined into false-colour RGB composites. These outputs were used in subsequent interpretation and classification procedures.
2.5. Supervised Classification
To categorise mineral and alteration features, supervised classification techniques were employed using three widely recognised and robust algorithms, Maximum Likelihood Classifier (MLC), Support Vector Machine (SVM) and Random Forest (RF). These classifiers were selected due to their proven performance in remote sensing-based geological mapping and their complementary methodological strengths. MLC was chosen for its probabilistic approach and long-standing application in land cover and mineral classification tasks, particularly where training data is assumed to follow a normal distribution [52]. SVM was included due to its capacity to handle high-dimensional and non-linearly separable data, making it well-suited for distinguishing subtle spectral variations in PCA-transformed imagery [53]. RF was selected for its ensemble learning approach, robustness to overfitting and effectiveness in handling noisy or correlated features, which are common in Multispectral datasets [54]. Applying all three classifiers independently to both Landsat 8 and Sentinel 2 PCA composites allowed for comparative performance assessment and ensured classification reliability across varying spectral and spatial resolutions.
Sample Training and Classifications (MLC, SVM and RF)
Sample creation was a critical step in this process. Regions of Interest (ROIs) were manually digitised as training polygons directly on each of the PCA composites. These samples were drawn to represent four key mineralogical classes: Clay-rich zones, Iron oxide-rich zones, Quartz-rich or Silica-dominated zones and Hydrothermal alteration zones. The selection of these ROIs was guided by visual interpretation of the enhanced spectral contrasts produced by the PCA colour composites supplemented with overlays of known mineral occurrence points to assess accuracy and geological validity. A stratified sampling strategy was adopted to ensure balanced representation across all four mineralogical classes. A total of 160 training samples were collected with 40 samples per class, aligning with remote sensing best practice recommendations of acquiring 30–50 well-distributed samples per class for robust classification according to Congalton & Green [55]. This approach facilitates accurate spectral signature learning and minimises class imbalance during classifier training, thereby enhancing classification performance [56]. The classification process was implemented using the Semi-Automatic Classification Plugin (SCP) in QGIS [57]. For each sensor, the classification was carried out on both the Landsat 8 and Sentinel 2 PCA Composites. Each classifier was applied independently to assess the consistency and performance of different algorithmic approaches across varying spatial resolutions and spectral inputs. The resulting classification outputs were symbolised using distinct colour codes assigned to each class to facilitate visual interpretation and thematic mapping.
Despite the fact that carbonate-bearing surfaces were detected through the Carbonate Index, PCA composites and alteration maps, they were not classified as a separate mineralogical class during the supervised classification stage. The exclusion of carbonate-bearing surfaces from the final classification was informed by several considerations. Such as the spectral contrast of carbonate minerals at the spatial resolutions of Landsat 8 (30 m) and Sentinel 2 (10–20 m) is weak and overlaps with the reflectance of bright lithologies such as quartz and feldspar, making reliable separation difficult, which is a limitation widely documented in multispectral remote-sensing studies [51,58]. The carbonate occurrences within the Erongo region are spatially restricted compared with the more extensive hydrothermal alteration zones that dominate the area. The primary objective of the classification was to delineate alteration-related mineral assemblages, specifically clays, iron oxides and ferrous minerals that are more directly associated with hydrothermal processes and mineralisation [13,59,60].
2.6. Validation and Accuracy Assessment
To evaluate the reliability of the classification outputs, an accuracy assessment was performed using known mineral occurrence points obtained from the Geological Survey Department of the Ministry of Mines and Energy (MME), Namibia. These points represent documented mineral occurrences distributed across the Erongo region and served as independent reference data for validating the classification results. A total of 434 validation points were used to examine the spatial correspondence between predicted mineralogical classes and actual mineral sites. The validation data were overlaid on each classified raster generated by the Maximum Likelihood Classification (MLC), Support Vector Machine (SVM) and Random Forest (RF) algorithms to verify spatial agreement.
Due to limited site access and environmental sensitivity in protected regions like Namib-Naukluft National Park, direct field verification was not conducted. As a result, the study used reliable secondary field-validated datasets that were assembled from confirmed geological exploration and geochemical investigations carried out by the Namibian Geological Survey, offering a strong basis for accuracy evaluation based on remote sensing. Confusion matrices were created from the validation points, and the Kappa Coefficient, which measures the agreement between the classified and reference data, as well as Overall Accuracy (OA), Producer’s Accuracy (PA) and User’s Accuracy (UA), were used to quantify classification performance. The thematic reliability of the classification results is supported by the observed spatial correlation between high-spectral-index zones, confirmed mineral resources and PCA-enhanced anomalies.
Pegmatitic intrusions, calcrete-hosted uranium deposits, quartz-feldspar veins, and hydrothermally altered zones linked to the Erongo and Brandberg ring-complexes are among the several mineralisation types that are distinctive of the Erongo Terrane and are included in the validation points [3,29,30]. The location of alteration minerals and ore deposits is greatly influenced by these geological structures, which were created by several intrusive and metasomatic events. According to a spatial comparison, clay-rich zones found via classification often align with phyllitic metasedimentary sequences, contact aureoles and worn margins of granitic and rhyolitic massifs, suggesting argillic alteration along structural conduits. Similarly, mapping fracture systems and oxidised gossan caps near ring-complex intrusions correlates to distinct classes that are dominated by iron oxide and silica. The Erongo region’s geological plausibility is strengthened by the spatial coherence between recorded occurrences and identified mineralogical zones, which also supports the classification outputs’ application for reconnaissance-scale mineral targeting.
2.7. Software and Tools
A combination of geospatial and statistical software tools (see Table 5) was employed throughout the study to facilitate data processing, analysis and visualisation. QGIS version 3.40.8, integrated with the Semi-Automatic Classification Plugin (SCP), served as the primary geospatial platform. It was used for key tasks including Principal Component Analysis (PCA), training samples (ROI) creation, supervised classification and thematic map generation. For statistical analysis, Jupyter Notebook (Python 3.12.7) was utilised to compute confusion matrices, calculate classification performance metrics such as Overall Accuracy, User’s and Producer’s Accuracy and the Kappa Coefficient, as well as to generate PCA scree plots, heatmaps and eigenvector visualisations. Draw.io was used to develop the methodology flowchart, which visually summarised the analytical workflow from data acquisition through to classification and validation.
Table 5.
Software tools and their specific applications in the study workflow, including preprocessing, PCA, training sample creation, classification, accuracy assessment and improvement of linguistic quality.
3. Results
3.1. Spectral Indices for Mineral Detection
The Clay Index, Ferrous Iron Index, Carbonate Index and Iron Oxide Index were developed from Landsat 8 and Sentinel 2 data to improve mineral identification.
3.1.1. Landsat 8 Indices
Carbonate Index (CI)
In Figure 5, elevated CI values (>1.07; light green–cyan) plot chiefly over the Karibib Formation belts in the southeast and southwest and locally along mapped Damara-age structures where calc-silicate/marble and carbonate veining are expected. Moderate values (0.98–1.07) occur as irregular belts across central Erongo, consistent with mixed metasedimentary packages (marble interbedded with schist or quartzite) and secondary carbonate precipitation on weathered granitic terrains. Low values (<0.89; dark blue–black) dominate the Erongo and Salem granite complexes and other non-carbonate units in the west and north. At 30 m resolution, anomalies represent broad carbonate domains rather than discrete veins and correspond spatially to the marble/calc-silicate tracts on the geological map.
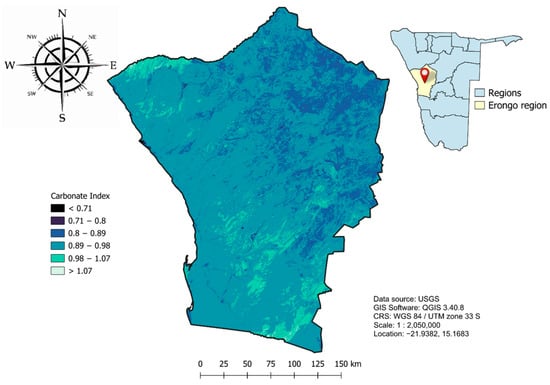
Figure 5.
Carbonate Index map of the Erongo region, Namibia, derived from Landsat 8 imagery, illustrating the spatial variability of carbonate-bearing mineral zones across the study area.
Given the 30 m spatial resolution of Landsat 8 and the regional-scale map representation (~1:2,050,000), these carbonate anomalies are interpreted as broad lithological or alteration zones rather than discrete outcrops. The patterns shown in Figure 5 correlate spatially with the mapped marble belts and metamorphic complexes on the geological map in Figure 2, supporting the regional validity of the CI interpretation while acknowledging that finer-scale features (fracture-controlled veins) fall below the detection threshold.
Clay Index
Figure 6 represents the inverse expression of the Carbonate Index, highlighting the same SWIR spectral relationship from an opposite perspective. In this ratio, higher values correspond to stronger absorption in Band 6 (1.57–1.65 µm) relative to Band 7 (2.11–2.29 µm), a behaviour characteristic of hydroxyl-bearing clay minerals such as kaolinite, illite and montmorillonite. The map displays predominantly low to moderate index values (1.01–1.16; peach to pink shades) across much of the region, indicating a diffuse but widespread distribution of clay minerals associated with background weathering. Higher index values (>1.30; bluish tones), particularly in the southwestern and north-central areas, likely represent argillic and phyllic alteration zones where clays have been enriched through hydrothermal processes. Low index values (<1.01; red to orange tones) found in the southern and northern margins correspond to non-clay lithologies such as granites, basalts, quartzites, marbles and calc-silicate units, where the clay component is minimal. These patterns, which display an inverse spatial relationship with the Carbonate Index map, demonstrate how both indices act as mutual spectral checks within the 2.1–2.3 µm SWIR range with high carbonate absorption corresponding to low clay responses and vice versa. This complementary behaviour validates the consistency of the carbonate-clay spectral domain and provide reliable proxies for identifying lithological transitions, alteration halos and potential mineralisation zones.
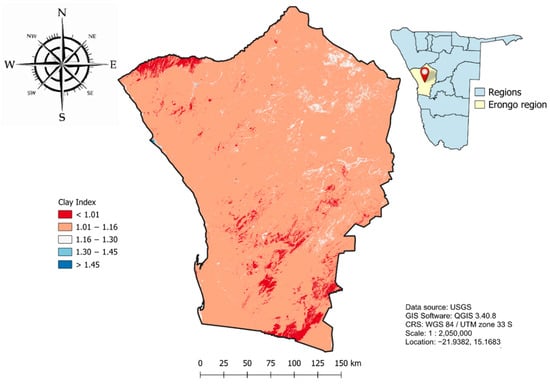
Figure 6.
Clay Index map of the Erongo region, Namibia, derived from Landsat 8 imagery, highlighting the spatial distribution of clay-rich mineral zones across the study area.
Ferrous Iron Index
The Ferrous Iron Index map (Figure 7) reveals a varied distribution of ferrous iron (Fe2+) concentrations across the Erongo region. Moderate index values (0.85–1.25; light to medium blue) dominate much of the terrain, reflecting the widespread occurrence of Fe-bearing silicates such as biotite, chlorite and amphibole within metamorphic and volcanic formations. Elevated values (>1.43; dark blue) are observed mainly in the southwestern and central-eastern zones, corresponding to mafic and intermediate lithologies, including basalts and amphibolites of the Erongo Volcanic Complex, as well as localised alteration corridors where Fe-silicates and magnetite accumulate. These high-index zones may signify both primary magmatic enrichment and secondary hydrothermal overprinting. Lower values (<0.85; light grey) occur in the northwestern and northeastern parts of the region, coinciding with felsic granitic and quartz-rich rocks of the Erongo complexes, which are naturally depleted in ferrous iron. The spatial correspondence between high-index areas and mapped mafic units on the geological map (Figure 2) supports the interpretation that the ferrous anomalies primarily reflect lithological variation rather than purely hydrothermal alteration.
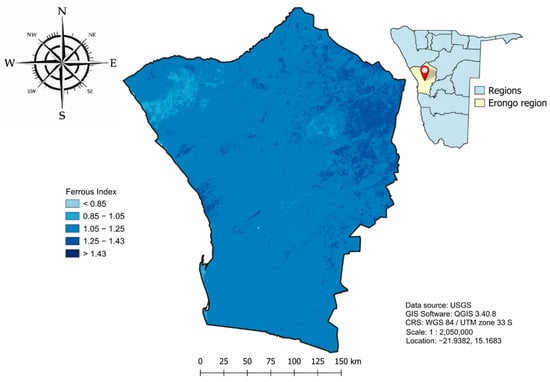
Figure 7.
Ferrous Iron Index map of the Erongo region, Namibia, derived from Landsat 8 imagery, illustrating the distribution and relative intensity of ferrous iron-bearing minerals across the study area.
Iron Oxide Index
The Iron Oxide Index map (Figure 8) shows elevated values (1.18–1.64; yellow to orange shades) across much of the central and eastern terrain, reflecting extensive surface oxidation associated with ferric iron minerals such as hematite, goethite and limonite. These features occur predominantly over the Erongo Granite Complex, where prolonged subaerial weathering has produced iron-stained and lateritic crusts. Extremely high values (>1.87; dark red) in the southern and southeastern parts correspond to ferruginous calcretes and lateritic soils developed along the Damara metasedimentary belt, consistent with oxidised surficial deposits rather than discrete ore bodies. Moderate to high index values may also indicate gossanous ridges and weathered felsic units capped by ferric coatings, as reported in similar arid terrains [15,23,51]. In contrast, low index values (<1.18; light yellow) in the northwest coincide with quartz-rich and less-weathered granitic terrains. The overall pattern corresponds well with the distribution of ferruginous and lateritic surfaces mapped on the regional geological map (Figure 2), confirming that these anomalies represent widespread surface oxidation and weathering typical of arid granitic provinces.
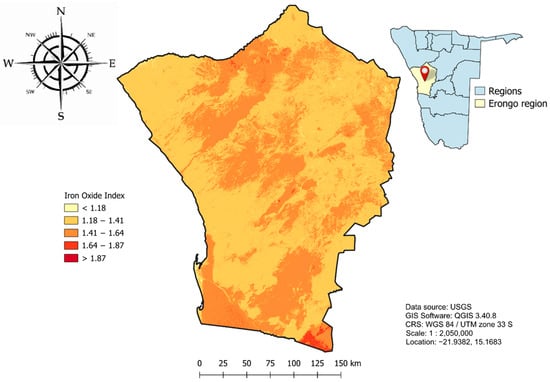
Figure 8.
Iron Oxide Index map of the Erongo region, Namibia, derived from Landsat 8 imagery, indicating spatial variations in iron oxide content across the study area.
3.1.2. Sentinel 2 Indices
Carbonate Index
The Sentinel 2 Carbonate Index map (Figure 9) shows high values (>1.01; light green) in the southwestern and southeastern sectors, coinciding with marble and calc-silicate units of the Karibib Formation and zones of hydrothermal carbonate veining along Damara-aged structures [31]. This ratio took advantage of the diagnostic reflectance of carbonates around 2.2 µm (Band 12) relative to the lower reflectance of Band 11 (1.61 µm), allowing discrimination from silicate and oxide surfaces. Moderate values (0.88–1.01; turquoise to blue) in the central belt represent mixed assemblages of carbonate and silicate rocks or transitional gneiss–marble zones where secondary carbonate veins are common. Low values (<0.88; deep blue to navy) in the north and east correspond to non-carbonate lithologies such as granites, gneisses and schists of the Erongo and Salem complexes, as illustrated on the geological map (Figure 2). This pattern confirms that Sentinel 2 and Landsat 8 indices capture the same regional carbonate distribution but with improved spatial definition due to Sentinel 2’s 10–20 m resolution.
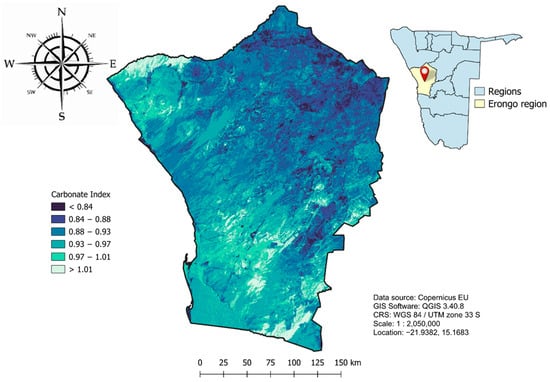
Figure 9.
Carbonate Index map of the Erongo region, Namibia, derived from Sentinel 2 imagery, illustrating the spatial variability of carbonate-bearing mineral zones across the study area.
Clay Index
The Sentinel 2 Clay Index map (Figure 10) highlights strong spatial variability in phyllosilicate content across the Erongo region. High index values (>1.13; blue to dark blue) are concentrated in the eastern and central sectors, corresponding to metasedimentary and schistose units of the Kuiseb and Karibib formations that contain abundant kaolinite, illite and montmorillonite. These results agree with mineralogical descriptions of the Damara Supergroup reported by Goslin [28], confirming that these zones represent clay-rich metamorphic terrains. Extensive low index values (<1.07; red to orange) in the south and southwest coincide with granitic intrusions of the Erongo complexes, where clay content is minimal. Intermediate index values (light blue to white) mark transitional contacts and deformation corridors, reflecting partial alteration or mixed lithologies along structural pathways, consistent with observations by Bousbih et al. [60]. The distribution of high-index areas aligns closely with the phyllosilicate-bearing units mapped on the regional geological map (Figure 2), substantiating the spectral interpretation.
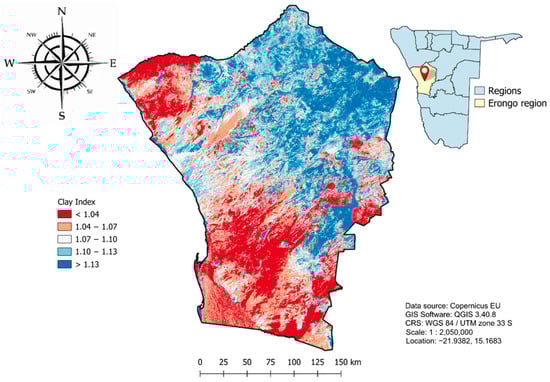
Figure 10.
Clay Index map of the Erongo region, Namibia, derived from Sentinel 2 imagery, highlighting the spatial distribution of clay-rich mineral zones across the study area.
Ferrous Index
The Sentinel 2 Ferrous Iron Index map (Figure 11) displays a gradational pattern from light to dark blue tones, with elevated values (>1.48) concentrated in the central and southeastern parts of the Erongo region. These high-index zones correspond to ferrous-rich mafic and intermediate lithologies, including basalts, gabbros and amphibolites of the Erongo Volcanic Complex and the Salem Suite, which characteristically contain Fe-bearing silicates such as pyroxene, biotite and amphibole. Moderately high values (1.32–1.48) extend outward from these cores, delineating transition zones between mafic intrusive and metasedimentary host rocks. Lower index values (<1.10) occur mainly in the northern and northwestern areas, aligning with felsic and silicic lithologies such as granites and quartzites, where Fe2+ content is minimal. The spatial correlation between the high-index anomalies and mapped mafic units on the geological map (Figure 2) confirms the lithological origin of the ferrous signal, consistent with the Landsat 8 results. Similar relationships between elevated ferrous responses and mafic lithologies have been reported in arid terrains by Abay et al. [23] and Baid et al. [15].
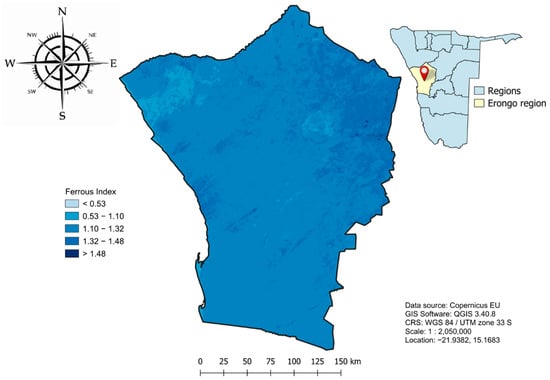
Figure 11.
Ferrous Iron Index map of the Erongo region, Namibia, derived from Sentinel 2 imagery, illustrating the distribution and relative intensity of ferrous iron-bearing minerals across the study area.
Iron Oxide Index
Sentinel 2’s Iron Oxide Index map (Figure 12) shows moderate to high index values (orange to red) across much of the Erongo region, with the most intense concentrations in the south-central and southeastern zones. These areas correspond to ferruginous and lateritic surfaces containing ferric oxides such as hematite, goethite and limonite, primarily formed through meteoric alteration and supergene weathering under arid climatic conditions. Such processes are typical of granitic and metamorphic terrains subjected to prolonged surface oxidation and desilication, as reported by Baid et al. [15]. Lower index values (light yellow) occur sporadically in the western and northern margins, corresponding to quartz-rich and less-weathered lithologies with reduced iron oxide content. The spatial pattern aligns with ferruginous surfaces mapped across granitic and metasedimentary units on the regional geological map (Figure 2), confirming a predominantly surficial, weathering driven origin for these anomalies.
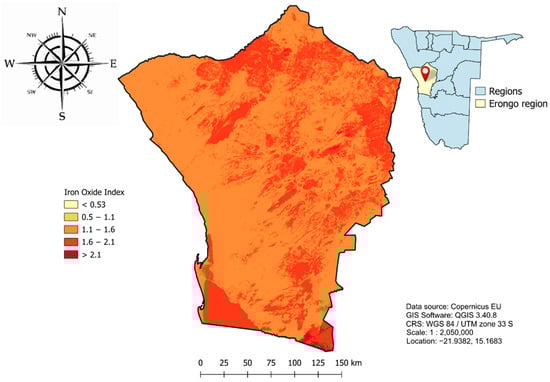
Figure 12.
Iron Oxide Index map of the Erongo region, Namibia, derived from Sentinel 2 imagery, indicating spatial variations in iron oxide content across the study area.
3.2. Principal Component Analysis (PCA) Results
The covariance matrix for the Landsat 8 spectral indices presented in Figure 13 shows that Band 3 (Iron Oxide Index) records the highest variance (0.0079), contributing the most unique spectral information. Bands 1 (Carbonate Index) and 2 (Ferrous Iron Index) exhibit lower variances of 0.0014 and 0.0036, respectively. Off-diagonal covariance values are generally low and negative, indicating limited redundancy, while Band 1 and Band 3 show a weak negative covariance (−0.0005). The correlation matrix reveals strong negative correlations between Band 1 and Bands 2 (r = −0.7569) and 3 (r = −0.5844), suggesting variability with some spectral overlap, whereas Bands 2 and 3 are nearly uncorrelated (r = −0.0880), indicating complementary spectral contributions.
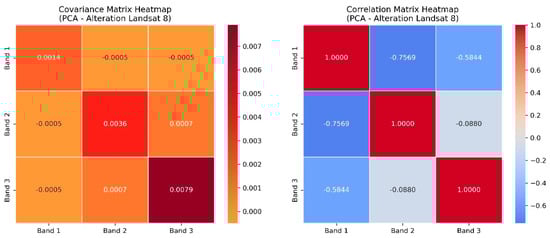
Figure 13.
Covariance matrix heatmap (left) and correlation matrix heatmap (right) for the Landsat 8 alteration composite, showing inter-band relationships between Bands 1–3 prior to Principal Component Analysis (PCA).
In Figure 14, loading plots highlight the dominant bands for each principal component. Band 3 aligns closely with PC1, primarily capturing Iron Oxide-related spectral variation, while Band 2 is strongly associated with PC2, representing Ferrous Iron-bearing minerals. Band 1 contributes modestly to both PC1 and PC2 but becomes more prominent in PC3, which retains Carbonate-related information. In the PC1 vs. PC3 plot, Band 3 maintains a strong influence, whereas Band 2 shows weaker loadings. The PC2 vs. PC3 plot displays near-orthogonality between Bands 1 and 2, reflecting their statistical independence in the transformed space.
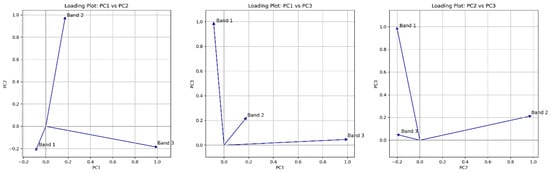
Figure 14.
Principal component loading plots for the Landsat 8 alteration composite, showing relationships between Bands 1–3 across PC1 vs. PC2 (left), PC1 vs. PC3 (centre) and PC2 vs. PC3 (right) from the Principal Component Analysis (PCA).
The scree plot and eigenvalue bar chart for the Landsat 8 modification composite in Figure 15 show a cumulative explained variance of 100%, with PC1, PC2 and PC3 accounting for 62.5%, 27.7% and 9.8% of the spectral variance, respectively. PC1’s high variance reflects strong spectral contrasts from Iron Oxides, while PC2 captures variations linked to Ferrous Iron-bearing zones. The steep drop in variance from PC1 to PC2 and the further decline to PC3 indicate that the first two components hold most of the geological information. PC3’s minor contribution likely reflects residual noise or weak carbonate signals.
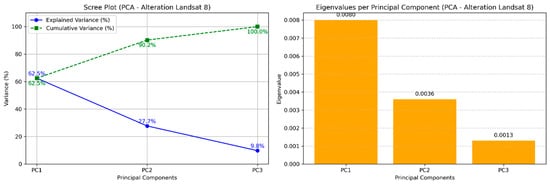
Figure 15.
Scree plot showing explained and cumulative variance (left) and eigenvalue distribution (right) for the first three principal components of the Landsat 8 alteration composite, derived from Principal Component Analysis (PCA).
The Landsat 8 PCA composite (PC1 = Red, PC2 = Green, PC3 = Blue) displayed in Figure 16, enhances spectral variability linked to alteration minerals by reducing redundancy. Distinct colour zones indicate varied mineralogical compositions: pink to magenta tones in central and southwestern Erongo correspond to Clay-rich alteration zones (kaolinite, montmorillonite, phyllosilicates), consistent with hydrothermal processes noted by Das [61]. Green areas, dominant in the central and northeastern sectors, reflect iron oxide enrichment, while deep blue to cyan tones along structural lineaments and ring features, particularly in the northwest, are likely associated with Silica-rich or Quartz-dominant lithologies such as silcrete or quartz veins.
- Landsat 8: Mineral Composites

Figure 16.
Alteration composite map of the Erongo region, Namibia, derived from Landsat 8 imagery using Principal Component Analysis (PCA) of Bands 1–3, illustrating spectral variations linked to hydrothermal alteration zones.
The covariance matrix for the Landsat 8 mineral composite (Clay Index = Band 1, Ferrous Iron Index = Band 2, Iron Oxide Index = Band 3) presented in Figure 17 shows that Band 3 again holds the highest variance (0.0079), followed by Band 2 (0.0036) and Band 1 (0.0019). Low off-diagonal covariance values (0.0005–0.0007) indicate moderate redundancy. The correlation matrix reveals a significant negative correlation between Band 1 and Band 3 (r = −0.6042), weaker negative correlations between Band 1 and Band 2 (r = −0.4413) and between Band 2 and Band 3 (r = −0.4484).
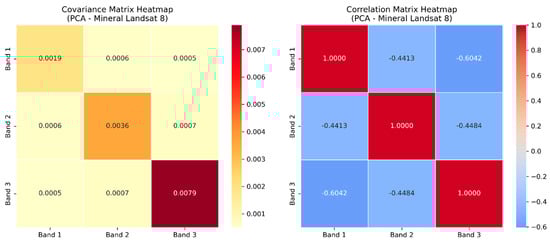
Figure 17.
Covariance matrix heatmap (left) and correlation matrix heatmap (right) for the Landsat 8 mineral composite, showing inter-band relationships between Bands 1–3 prior to Principal Component Analysis (PCA).
In Figure 18, the PCA loading plots confirm that Band 3 strongly influences PC1, Band 2 dominates PC2 and Band 1 contributes most to PC3. The PC2 vs. PC3 plot shows near-orthogonal vector alignment, indicating each principal component captures distinct spectral variance dimensions. This separation enables clearer discrimination between Iron Oxides (PC1), Ferrous Iron-bearing minerals (PC2) and Clay-related lithologies (PC3).
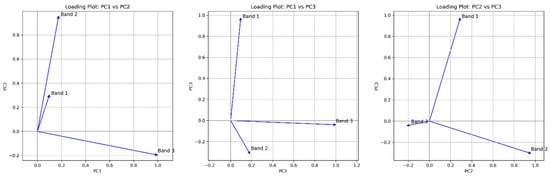
Figure 18.
Principal component loading plots for the Landsat 8 mineral composite, showing relationships between Bands 1–3 across PC1 vs. PC2 (left), PC1 vs. PC3 (centre) and PC2 vs. PC3 (right) from the Principal Component Analysis (PCA).
The eigenvalue analysis on Figure 19, indicates that PC1 explains 60.2% of total variance (eigenvalue = 0.0085), PC2 accounts for 27.2% (0.0036) and PC3 for 12.6% (0.0017), meaning that the first two PCs capture over 87% of the spectral variation. This demonstrates the efficiency of dimensionality reduction, with PC1 and PC2 retaining most of the geological signal. Iron Oxides are the most spectrally dominant feature, followed by Ferrous Iron, while clay minerals, though less influential, are captured in PC3.
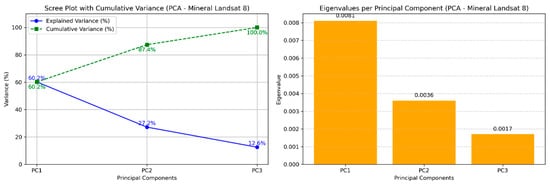
Figure 19.
Scree plot showing explained and cumulative variance (left) and eigenvalue distribution (right) for the first three principal components of the Landsat 8 mineral composite, derived from Principal Component Analysis (PCA).
From Figure 20, it can be seen that the Landsat 8 mineral composite PCA map (PC1 = Red, PC2 = Green, PC3 = Blue) visually reflects this spectral heterogeneity. Red and magenta tones, concentrated in southern and central Erongo, indicate strong PC1 and PC3 responses linked to Clay-rich alteration zones. Green patches, in the northeast, correspond to Iron Oxide zones with high PC2 loadings and blue to cyan areas align with PC3 responses along structural features and ring complexes in the north. This distribution aligns with previous observations by Shirmard et al. [34], confirming PCA’s utility in isolating key mineralogical signatures for exploration targeting.
- Sentinel 2: Alteration Composites

Figure 20.
Mineral composite map of the Erongo region, Namibia, derived from Landsat 8 imagery using Principal Component Analysis (PCA) of Bands 1–3, highlighting spectral variations associated with different mineralogical zones.
The statistical relationships between the Sentinel 2 alteration indices, the Carbonate Index (Band 1), Ferrous Iron Index (Band 2) and Iron Oxide Index (Band 3), were examined using covariance and correlation matrices, as observed in Figure 21. The covariance matrix shows that Band 1 has the highest variance (15.2896), indicating that the Carbonate Index contributes most to the spectral variability in the composite. Bands 2 and 3 have markedly lower variances of 0.0072 and 0.0227, respectively, indicating more moderate contributions. Off-diagonal covariance values, such as −0.0048 between Bands 1 and 2 and 0.0021 between Bands 2 and 3, suggest minimal shared variance, implying that Bands 2 and 3 retain distinct spectral information despite the dominance of Band 1.
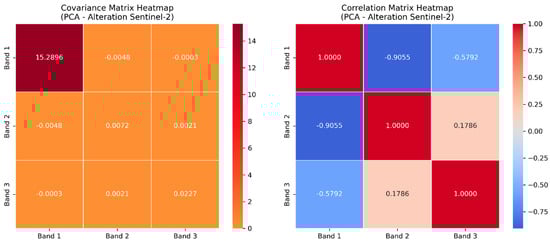
Figure 21.
Covariance matrix heatmap (left) and correlation matrix heatmap (right) for the Sentinel 2 alteration composite, showing inter-band relationships between Bands 1–3 prior to Principal Component Analysis (PCA).
The correlation matrix highlights strong negative relationships between Bands 1 and 2 (r = −0.9055) and a moderate negative correlation between Bands 1 and 3 (r = −0.5792). A weak positive association is observed between Bands 2 and 3 (r = 0.1786), reflecting significant variability, particularly in the Carbonate Index.
Loading plots in Figure 22 show Band 1 with a significant negative loading on PC1 in the PC1–PC2 plot, indicating its dominant influence on the first principal component. Band 2 has a strong loading on PC2, whereas Band 3 exhibits minimal influence on either axis. In the PC1–PC3 plot, Band 1 remains the primary contributor to PC1, while Band 3 becomes the main contributor to PC3. The PC2–PC3 plot reinforces Band 2’s association with PC2 and shows Band 3’s consistent contribution to PC3. These patterns indicate that PC1 represents carbonate-bearing mineral responses, PC2 reflects Ferrous Iron signatures and PC3 retains weaker spectral variability potentially linked to Iron Oxides or secondary interactions.
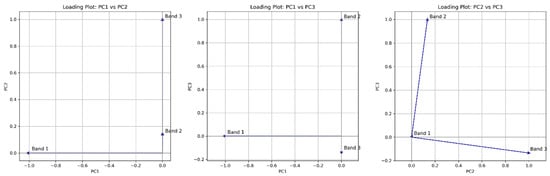
Figure 22.
Principal component loading plots for the Sentinel 2 alteration composite, showing relationships between Bands 1–3 across PC1 vs. PC2 (left), PC1 vs. PC3 (centre) and PC2 vs. PC3 (right) from the Principal Component Analysis (PCA).
The scree plot and eigenvalue bar chart shown in Figure 23 confirm the spectral dominance of carbonate-related features. PC1’s eigenvalue of 15.2896 accounts for 99.8045% of total spectral variance, while PC2 and PC3 contribute only 0.1501% and 0.0454%, respectively. The sharp variance drop between PC1 and PC2 suggests that nearly all relevant spectral information is contained within the first component.
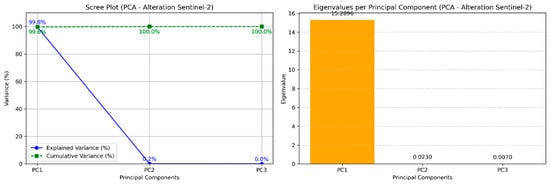
Figure 23.
Scree plot showing explained and cumulative variance (left) and eigenvalue distribution (right) for the first three principal components of the Sentinel 2 alteration composite, derived from Principal Component Analysis (PCA).
In the PCA composite image in Figure 24, red tones (PC1) correspond to areas with prominent carbonate-related features, often linked to lithological variation, alteration zones or Iron-rich surfaces. The green channel (PC2) emphasises intermediate responses, possibly reflecting Clay alteration zones or vegetation anomalies, while blue tones (PC3) highlight lineaments, alteration fringes and subtle structural features. Complex spectral patterns, particularly mixtures of magenta, green and blue, in the northern and central Erongo region suggest zones of intense alteration and structural complexity, potentially associated with mineralisation [35].
- Sentinel 2: Mineral Composites

Figure 24.
Alteration composite map of the Erongo region, Namibia, derived from Sentinel 2 imagery using Principal Component Analysis (PCA) of Bands 1–3, illustrating spectral variations linked to hydrothermal alteration zones.
For the Sentinel 2 mineral composite, covariance analysis as seen in Figure 25 shows that Band 3 (Iron Oxide Index) contributes the most independent spectral information, with the highest variance (0.0228). Band 2 (Ferrous Iron Index) follows with 0.0080, while Band 1 (Clay Index) has a lower variance of 0.0045. Off-diagonal covariance values (0.0015–0.0024) indicate minimal linear correlation. The correlation matrix reveals a strong negative association between Bands 1 and 3 (r = −0.7405), a weak association between Bands 1 and 2 (r = −0.1755) and a moderate negative correlation between Bands 2 and 3 (r = −0.5317), reflecting moderate variability and the inverse relationship of Band 3 with the other indices.
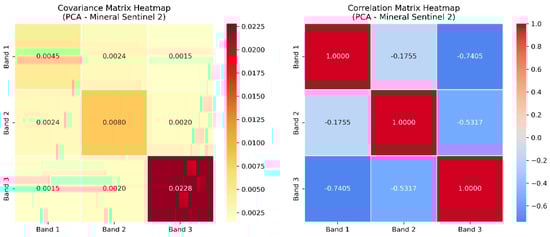
Figure 25.
Covariance matrix heatmap (left) and correlation matrix heatmap (right) for the Sentinel 2 mineral composite, showing inter-band relationships between Bands 1–3 prior to Principal Component Analysis (PCA).
Loading plots in Figure 26 show Bands 2 and 3 with strong loadings along PC1 in the PC1–PC2 plot, indicating that Iron Oxide signatures dominate the variation captured by PC1, with lesser contributions from Ferrous Iron and Clay. In the PC1–PC3 plot, Band 1 increasingly aligns with PC3, while Band 3 continues to dominate PC1. The PC2–PC3 plot positions Band 2 firmly with PC2, Band 1 with PC3 and Band 3 primarily with PC1. These patterns indicate that PC1 captures Iron Oxide responses, PC2 reflects ferrous Iron variation and PC3 retains residual variance associated with clay-bearing features.
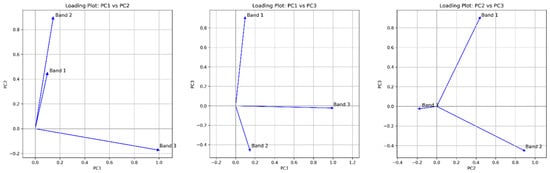
Figure 26.
Principal component loading plots for the Sentinel 2 mineral composite, showing relationships between Bands 1–3 across PC1 vs. PC2 (left), PC1 vs. PC3 (centre) and PC2 vs. PC3 (right) from the Principal Component Analysis (PCA).
Eigenvalue analysis illustrated in Figure 27 shows PC1 (0.0232) accounts for 65.7% of total variance, PC2 (0.0088) for 24.8% and PC3 (0.0033) for 9.4%, giving a cumulative explained variance of 100%. The steep drop between PC1 and PC2 indicates that most spectral information is concentrated in PC1, with PC2 and PC3 capturing secondary mineralogical signatures.
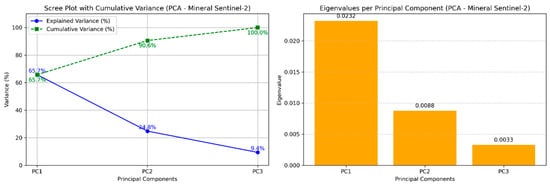
Figure 27.
Scree plot showing explained and cumulative variance (left) and eigenvalue distribution (right) for the first three principal components of the Sentinel 2 mineral composite, derived from Principal Component Analysis (PCA).
The Sentinel 2 mineral composite PCA image from Figure 28 reveals red-dominated zones in the southern and western areas, associated with Ferric Iron Oxides or certain Clays. Green tones (PC2) highlight carbonate- or phyllosilicate-bearing lithologies, often indicative of mineral-rich areas, while blue tones (PC3) accentuate structural features such as quartz veins, siliceous masses and zones with distinct mineralogical assemblages. Central and northern Erongo display prominent purple, pink and cyan tones, indicating overlapping mineral signatures, contact zones and structurally controlled alteration. Circular features in the northwest may correspond to intrusive bodies or ring complexes linked to mineralisation and hydrothermal activity, while bright central anomalies may signal exposed mineralised surfaces warranting further investigation.
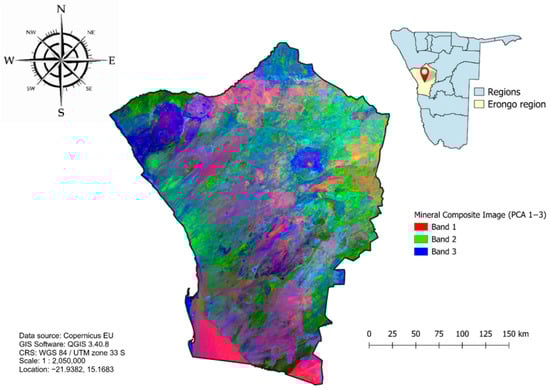
Figure 28.
Mineral composite map of the Erongo region, Namibia, derived from Sentinel 2 imagery using Principal Component Analysis (PCA) of Bands 1–3, highlighting spectral variations associated with different mineralogical zones.
3.3. Supervised Classification Results
3.3.1. Landsat 8 Classifications
The spatial distribution of mineralogical classes derived from Landsat 8 imagery was estimated using three supervised classifiers: Maximum Likelihood Classification (MLC), Random Forest (RF) and Support Vector Machine (SVM). Each algorithm delineated four main classes, clay, hydrothermally altered, iron-oxide and silica–quartz-vein zones, whose respective areal extents are summarised in Table 6. Among these, the clay zones form the largest class, ranging from 17,511.9 km2 (RF) to 30,114.1 km2 (MLC). Hydrothermally altered zones show intermediate coverage between 16,760.5 km2 (SVM) and 21,391.4 km2 (RF). Iron-oxide zones occupy the smallest areas (3173–7125 km2), while silica and quartz-vein zones extend over moderate areas (12,943–18,495 km2). Overall, MLC yields the most extensive mapping, whereas RF provides more conservative delineations, illustrating how classifier design influences lithological discrimination in the Erongo region.
Table 6.
Area (km2) distribution of mineral classes, clay zones, hydrothermally altered zones, iron oxide zones and silica and quartz vein zones, derived from Landsat 8 imagery using Maximum Likelihood Classification (MLC), Random Forest (RF) and Support Vector.
As shown in Figure 29, the southern and southwestern parts of the Erongo region are predominantly covered by Clay zones, occupying 30,114.1 km2, representing the most extensive class in the area. Hydrothermally altered zones, covering 17,161.5 km2 and displayed in yellow, occur across the northeast and central-east as scattered patches or narrow structural corridors adjacent to Clay and Iron Oxide zones. Iron Oxide zones, which occupy 3173.0 km2 and appear in red, are concentrated in the northeastern and central parts of the region, forming broad clusters. Silica and quartz vein zones (12,943.4 km2) are less extensive, occurring as isolated patches in the central, western and northwestern sectors, with minor occurrences in the south.
- Maximum Likelihood Classification (MLC)

Figure 29.
Mineral classification map of the Erongo region, Namibia, derived from Landsat 8 imagery using the Maximum Likelihood Classification (MLC) algorithm, showing clay zones, hydrothermally altered zones, iron oxide zones and silica and quartz vein zones.
The RF classification shown in Figure 30 depicts the southern half of the Erongo region as being dominated by clay zones (17,511.9 km2), forming large, continuous patterns in the southwestern and south-central areas. Hydrothermally altered zones (21,391.4 km2) occur in dense belts along the eastern, northeastern and central borders. Iron oxide zones (5992.8 km2) are widely mapped across the central and northern belts, forming nearly continuous coverage. This distribution suggests intense oxidative alteration and the presence of goethite and haematite, commonly associated with gossans and weathered parts of sulphide-rich ore complexes [62]. Silica- and quartz-rich zones (18,495.9 km2) are dispersed across the central, southwest and northwest regions, primarily as NE–SW trending patches and silicified surfaces rather than discrete linear veins.
- Random Forest (RF)

Figure 30.
Mineral classification map of the Erongo region, Namibia, derived from Landsat 8 imagery using the Random Forest (RF) algorithm, showing clay zones, hydrothermally altered zones, iron oxide zones and silica and quartz vein zones.
The SVM classification shown in Figure 31 reveals that clay-rich zones (22,757.3 km2) dominate the southern half of the region, particularly the southwestern and south-central areas. Hydrothermally altered zones (16,760.5 km2) are less extensive but are distinctly visible in the central, eastern and northeastern sectors. Iron oxide zones (7125.2 km2) occur mainly in the central and northern parts, radiating outward from a central axis a pattern consistent with base-metal occurrences within the Khan and Karibib formations [31]. Silica and quartz-rich zones (16,749.1 km2) are distributed throughout the region but are most prominent in the northwest and central areas. These features primarily appear as NE–SW trending patches of silcrete, quartz reefs and silica-cemented rocks near tin-bearing pegmatites, gold-bearing quartz reefs and epithermal feeder systems [63]. Rather than continuous vein structures, these silica-enriched zones represent broad silicified surfaces and quartz dominant lithologies structurally aligned with the regional Damara deformation trends.
- Support Vector Machine (SVM)

Figure 31.
Mineral classification map of the Erongo region, Namibia, derived from Landsat 8 imagery using the Support Vector Machine (SVM) algorithm, showing clay zones, hydrothermally altered zones, iron oxide zones and silica and quartz vein zones.
3.3.2. Sentinel 2 Classifications
The Sentinel 2-based classification produced comparable but more spatially refined results than Landsat 8, owing to its higher spatial and spectral resolution. Three supervised classifiers, Maximum Likelihood Classification (MLC), Random Forest (RF) and Support Vector Machine (SVM), were applied to delineate clay, hydrothermally altered, iron-oxide and silica–quartz-vein zones. The areal extent of each mineralogical zone extracted from Sentinel 2 imagery is summarised in Table 7. Clay zones cover extensive areas ranging from 6845.7 km2 (MLC) to 23,729.0 km2 (RF), whereas hydrothermally altered zones occupy 13,073.3–21,753.6 km2, depending on the algorithm. Iron-oxide zones are the smallest class, spanning only 1758.6–2271.1 km2, while silica and quartz-vein zones dominate the classification, ranging from 24,319.3 km2 (RF) to 40,207.7 km2 (MLC). The results highlight the sensitivity of Sentinel 2 data to lithological variability, with SVM yielding the most detailed detection of alteration features and RF producing more conservative but spatially coherent delineations.
Table 7.
Area (km2) distribution of mineral classes, clay zones, hydrothermally altered zones, iron oxide zones and silica and quartz vein zones, derived from Sentinel 2 imagery using Maximum Likelihood Classification (MLC), Random Forest (RF) and Support Vector.
Figure 32 shows clay zones (6845.7 km2) covering the western, southern and central parts of the region in continuous stretches. Hydrothermal alteration zones (14,230.5 km2) occur primarily in the northeast and central-east, forming elongated belts or compact clusters. Iron oxide zones (2108.6 km2) are concentrated in similar areas. Silica- and quartz-rich zones (40,207.7 km2) dominate the north-central to eastern corridor, occurring mainly as broad NE–SW trending silicified and quartz-dominant patches rather than discrete vein systems. These zones broadly coincide with quartzite ridges and silicified metasedimentary belts shown on the regional geological map (Figure 2), reflecting silicification along structural corridors rather than confirmed vein-type mineralisation. Their alignment with the Damara deformation fabric nonetheless suggests structurally controlled silica enrichment likely associated with past hydrothermal activity.
- Maximum Likelihood Classification (MLC)

Figure 32.
Mineral classification map of the Erongo region, Namibia, derived from Sentinel 2 imagery using the Maximum Likelihood Classification (MLC) algorithm, showing clay zones, hydrothermally altered zones, iron oxide zones and silica and quartz vein zones.
The RF results from Figure 33 highlight extensive clay zones (23,729.0 km2) across the southern and southwestern parts of the region, extending into the south-central terrain. Hydrothermally altered zones (13,073.3 km2) form irregular belts and halos in the northeastern and central-eastern regions, surrounding dominant quartz and iron oxide classes. Iron oxide zones (2271.1 km2) are concentrated in the southern, central and far northern areas, while silica- and quartz-rich zones (24,319.3 km2) are mapped across the central, eastern and northwestern areas, exhibiting broad coverage with locally vein-like or patchy silicified patterns. These silica-enriched features correspond to quartzite and silicified metasedimentary belts observed on the geological map, reflecting pervasive silicification and quartz enrichment.
- Random Forest (RF)

Figure 33.
Mineral classification map of the Erongo region, Namibia, derived from Sentinel 2 imagery using the Random Forest (RF) algorithm, showing clay zones, hydrothermally altered zones, iron oxide zones and silica and quartz vein zones.
In the SVM classification from Figure 34, clay zones (8819.3 km2) dominate the south-central and southeast regions, with substantial coverage also in the southwest. Hydrothermal zones (21,753.6 km2) occur in structured belts and alteration halos in the northeastern and eastern corridors. Iron Oxide zones (1758.6 km2) are distributed across the central, northern and southeastern areas, while silica and quartz-rich zones (31,761.0 km2) dominate the northwest and central-west.
- Support Vector Machine (SVM)

Figure 34.
Mineral classification map of the Erongo region, Namibia, derived from Sentinel 2 imagery using the Support Vector Machine (SVM) algorithm, showing clay zones, hydrothermally altered zones, iron oxide zones and silica and quartz vein zones.
3.4. Classification Accuracy Assessment
Table 8 summarises the accuracy assessment for the three supervised classifiers, MLC, RF and SVM, applied to Landsat 8 data for mapping hydrothermal alteration and associated mineral zones. The evaluation focused on User’s Accuracy (UA), Producer’s Accuracy (PA) and Overall Accuracy (OA) derived from confusion matrices.
Table 8.
Confusion matrices and classification accuracies for Landsat 8 mineral mapping in the Erongo region using Maximum Likelihood Classification (MLC), Random Forest (RF) and Support Vector Machine (SVM). Matrix–cell values represent the number of correctly and incorrectly classified pixels, while Producer’s Accuracy (PA) and User’s Accuracy (UA) are expressed as percentages (%).
3.4.1. Maximum Likelihood Classification (MLC)
The MLC model exhibited relatively low performance in terms of UA. Clay zones and silica & quartz zones achieved UA values of only 35.00% and 38.46%, respectively, while hydrothermally altered zones reached 37.63%. These low UA values indicate considerable misclassification from the user’s perspective. In contrast, the PA for hydrothermal zones was high at 89.93%, suggesting that truest hydrothermal pixels were correctly identified. However, PA values for silica & quartz zones (3.24%) and Clay zones (11.86%) were poor, revealing a tendency to under-represent spectrally similar or minority classes while overclassifying dominant classes.
3.4.2. Random Forest (RF) Classification
The RF classifier outperformed the other methods in overall accuracy. UA improved substantially, with clay zones at 10.00%, silica & quartz zones at 46.15% and hydrothermal zones at 41.05%. PA remained high for hydrothermal zones (87.15%) and slightly improved for silica and quartz zones (3.10%), although still low. Clay zones had a lower PA (8.69%) compared to MLC, suggesting RF reduces user-side confusion but may still miss small or spectrally mixed Clay-rich features. RF produced the most balanced results, showing resilience to non-linear separability and class imbalances common in satellite-based mineral exploration.
3.4.3. Support Vector Machine (SVM) Classification
SVM performance was intermediate between MLC and RF. UA for hydrothermal zones was the lowest of the three methods at 32.89%, with silica & quartz zones at 38.46% and clay zones at 17.50%. PA for hydrothermal zones was 86.80%, similar to the other methods, but PA for clay zones (10.00%) and silica & quartz zones (2.53%) was poor. These results suggest SVM was less effective at handling complex class boundaries and was more prone to overfitting in mixed-pixel conditions, leading to weaker thematic separation than RF, particularly for minority classes.
Accuracy Assessment of Sentinel 2 Classifications
The classification performance of Sentinel 2 imagery for mineral mapping was evaluated using three supervised algorithms: Maximum Likelihood Classification (MLC), Random Forest (RF)and Support Vector Machine (SVM) as seen in Table 9. The target classes included hydrothermally altered zones, clay-rich zones, silica & quartz zones and iron oxide zones. Accuracy metrics, Overall Accuracy (OA), Producer’s Accuracy (PA) and User’s Accuracy (UA) were derived from the confusion matrices to quantify thematic reliability and spatial correspondence with reference data.
Table 9.
Confusion matrices and classification accuracies for Sentinel 2 mineral mapping in the Erongo region using Maximum Likelihood Classification (MLC), Random Forest (RF) and Support Vector Machine (SVM). Matrix–cell values represent the number of correctly and incorrectly classified pixels, while Producer’s Accuracy (PA) and User’s Accuracy (UA) are expressed as percentages (%).
Among the classifiers, MLC recorded the highest OA at 70.51%, outperforming SVM (67.05%) and RF (60.00%). The consistently high PA values for hydrothermal zones (MLC- 89.60%, RF-92.50%, SVM-91.78%) indicate strong detection capability across all algorithms, with UA also performing well (MLC-77.10%, SVM-70.52%, RF-65.00%). These results suggest that Sentinel 2’s finer spatial resolution (10–20 m) provided the spectral sensitivity needed to accurately delineate hydrothermal alteration features, while MLC and SVM maintained superior thematic consistency and RF demonstrated greater omission minimisation for this class. Clay-rich zones presented greater classification challenges, reflecting high spectral overlap with surrounding lithologies. SVM achieved the best performance for this class, with PA of 18.18% and UA of 55.00%, considerably higher than MLC (PA-12.94%, UA-27.50%) and RF (PA-14.28%, UA-20.00%). This improvement suggests that SVM’s decision boundary optimisation was better suited to separating subtle clay spectral responses, even under conditions of spectral mixing.
Silica & quartz zones were poorly detected by all classifiers, with PA remaining below 6%, indicating difficulties in mapping their full spatial extent. RF still achieved the highest UA (46.15%) for this class, suggesting limited but notable thematic consistency despite low recall. This likely reflects the tendency of RF to better capture discrete high-reflectance outcrop pixels, with reduced spatial coverage. Iron oxide zones proved the most difficult to classify, with PA and UA near zero for all algorithms, indicating almost complete omission and misclassification. The poor separability of these zones is likely due to their spectral similarity to other alteration products and the subdued iron oxide spectral signal in parts of the Erongo region.
The analysis demonstrates that hydrothermal zones are rigidly detected in Sentinel 2 data by all classifiers, while SVM offers the most balanced performance across key alteration types, particularly in clay-rich areas where spectral ambiguity is high. RF, although slightly less consistent in thematic accuracy, showed advantages in isolated cases such as silica & quartz identification. These findings underscore the advantages of Sentinel 2’s high-resolution, multi-band spectral capability for mineral mapping in complex geological environments and highlight the importance of algorithm selection when targeting specific alteration signatures.
Accuracy Assessment of Landsat 8 Classifications
Table 10 shows that Landsat 8 classification accuracy was consistently low across all three supervised classifiers. Random Forest (RF) achieved the highest overall accuracy (38.25%), followed by Maximum Likelihood Classification (MLC) at 37.33% and Support Vector Machine (SVM) at 31.57%. Kappa coefficients were low or negative (MLC = 0.0261, RF = −0.0029, SVM = −0.0050), indicating minimal agreement beyond chance. Expected agreement (PE) values were similarly low (RF = 0.3843, SVM = 0.3191). These results suggest that Landsat 8’s coarse spatial resolution (30 m) and broad spectral bands limit its effectiveness for detailed mineral discrimination in complex terrains like the Erongo region, with all classifiers struggling to separate spectrally similar alteration zones.
Table 10.
Classification accuracy metrics for Landsat 8 mineral mapping in the Erongo region using Maximum Likelihood Classification (MLC), Random Forest (RF) and Support Vector Machine (SVM), showing Overall Accuracy, Kappa Coefficient and Expected Agreement (PE).
Accuracy Assessment of Sentinel 2
Table 11 shows that Sentinel 2 achieved notably higher classification accuracy across all algorithms. Maximum Likelihood Classification (MLC) attained the highest overall accuracy (70.51%), followed by Support Vector Machine (SVM) at 67.05% and Random Forest (RF) at 60.14%. These improvements reflect Sentinel 2’s finer spatial resolution (10 m) and narrow spectral bands, which enhance mineralogical class separability. Kappa coefficients, though modest, were higher than Landsat 8 results, with SVM recording 0.1419, RF 0.0986 and MLC 0.0813. Expected agreement (PE) ranged from 0.5578 (RF) to 0.6789 (MLC). Sentinel 2, particularly in combination with SVM, proved more effective for detecting subtle spectral variations in the Erongo region’s alteration zones.
Table 11.
Classification accuracy metrics for Sentinel2 mineral mapping in the Erongo region using Maximum Likelihood Classification (MLC), Random Forest (RF) and Support Vector Machine (SVM), showing Overall Accuracy, Kappa Coefficient and Expected Agreement (PE).
4. Discussion
4.1. Accuracy Assessment
The accuracy assessment revealed moderate to low quantitative results across classifiers, particularly for Landsat 8, where overall accuracies ranged between 31% and 38%, compared to 60% to 70% for Sentinel 2. Although numerically modest, these values are consistent with previous geological remote-sensing studies, where accuracies often remain below 70% owing to spectral confusion, mixed-pixel effects and sensor-resolution limits [15]. Such accuracies are generally acceptable for reconnaissance-scale mineral mapping in arid terrains, where subtle mineralogical variations and overlapping spectral responses constrain class separability [64].
The moderate spatial resolution of Landsat 8 (30 m) increased spectral mixing within heterogeneous pixels, limiting detection of narrow alteration corridors and vein-type features typical of the Erongo terrain, an effect also observed by Mwaniki et al. [65]. Furthermore, spectral similarity among alteration minerals, especially between clay, iron-oxide and silica-rich surfaces, produced overlapping reflectance responses that challenged classifier discrimination [14,66]. The lack of in situ spectral or geochemical calibration further reduced separability, as surface conditions in semi-arid regions vary with oxidation, roughness and illumination [67].
4.2. Effectiveness of PCA in Alteration Mineral Detection
Principal Component Analysis (PCA) proved highly effective in enhancing spectral signatures of key alteration minerals [68]. Through transforming correlated Landsat 8 and Sentinel 2 bands into orthogonal components, PCA reduced redundancy and maximised geological variance [13]. The RGB composite of PC1 (Clays), PC2 (Iron Oxides) and PC3 (Carbonates) enabled clear visual discrimination of hydrothermal and supergene alteration.
PCA effectively highlighted spatially coherent zones of kaolinite, montmorillonite, haematite, goethite, calcrete and calcite, which correspond with mapped alteration and sedimentary systems known to host uranium mineralisation in the Erongo region. These include the Tumas paleochannel and the Rössing Dome corridor, where calcrete and albite-hosted uranium deposits have been documented [3,4]. The spectral coherence between PCA-derived features and these geological units, visible on the regional geological map (Figure 2), supports their interpretation as uranium-bearing pathways rather than random spectral anomalies. These findings are consistent with PCA-enhanced alteration mapping in arid mineral provinces, such as the Gobi Desert [69], where PCA outperformed traditional false-colour composites by isolating hydrothermal and sedimentary mineral signatures.
While PCA is a powerful reconnaissance tool, it reflects relative spectral variance and does not confirm mineral identity. Interpretation is empirical and benefits from integration with spectral libraries, geological maps, or field data. When combined with validation datasets and spectral indices, as in this study, PCA provides a robust platform for detecting alteration minerals [65].
4.3. Validation of Spectral Indices
While PCA highlighted broad spectral anomalies, targeted mineral detection was enhanced using four diagnostic indices: the Carbonate Index, Clay Mineral Index, Ferrous Iron Index and Iron Oxide Index. These indices infer the presence of ferric oxides, hydroxyl-bearing clays and carbonates based on characteristic spectral absorption and reflectance features in the visible to shortwave infrared region, rather than direct mineral identification. The interpretation is therefore proxy-based, with each index serving as an indicator of potential surficial mineralisation or hydrothermal alteration. This approach follows established methods for lithological discrimination in arid environments, as demonstrated by [49,58].
The Carbonate Index effectively delineated calcrete-rich palaeochannels in central and north-western Erongo, with values > 1.2 corresponding to palaeodrainage and hydrological lows favourable for calcrete-hosted uranium, consistent with similar applications in arid Iran [51]. The Clay Mineral Index enhanced kaolinite- and montmorillonite-bearing zones linked to weathering and hydrothermal halos, paralleling findings by Testa et al. [66] in arid, low-vegetation terrains. The Ferrous Iron Index detected Fe2+-rich minerals such as pyroxenes and amphiboles, with high values (>1.05) aligning with mafic dykes, greenstone belts and magnetic anomalies, confirming its discriminative power in mixed lithologies [23]. The Iron Oxide Index successfully isolated ferric-rich surfaces associated with gossanous caps and weathered sulphides, values >1.2 corresponded to fault-controlled ridges and fracture zones, consistent with Thomas et al. [22] and corroborated by mapped gossans in the Khan River corridor and Rössing Dome.
When integrated with PCA, these indices significantly improved interpretation: high PC2 with the Iron Oxide Index confirmed gossanous ridges, PC1 with the Clay Index refined phyllic alteration halos and PC3 with the Carbonate Index validated calcrete deposits and palaeochannel systems. The combined approach also identified unmapped anomalies coherent with structural patterns in slope and hillshade data, defining new exploration targets. Operationally scalable and geologically rigid, the PCA–index integration supports semi-automated, data-driven targeting in semi-arid, inaccessible terrains such as Erongo.
4.4. Limitations of the Study
Several interrelated factors influenced this study’s outcomes, such as spatial and spectral resolution constraints, classifier performance, vegetation interference, absence of direct field validation and methodological transferability. The moderate resolution of Landsat 8 (30 m) and Sentinel 2 (10 m in select bands) was suitable for regional mapping but inadequate for detecting narrow alteration features, vein systems and micro-fracture networks. Higher-resolution commercial sensors (WorldView-3, GeoEye-1) could enhance lithological discrimination and structural mapping, though cost and accessibility were prohibitive. Spectrally, both sensors lacked the narrowband coverage required to distinguish similar minerals such as, kaolinite vs. illite and calcite vs. dolomite or to apply advanced analyses such as spectral unmixing [15,70]. Hyperspectral datasets, Hyperspectral Mapper (HyMap), Airborne Visible/Infrared Imaging Spectrometer (AVIRIS), and Environmental Mapping and Analysis Program (EnMAP) could improve mineral fingerprinting [71]. Classifier-specific limitations also affected accuracy: Maximum Likelihood Classification (MLC) struggled with spectral overlap in Landsat 8 but excelled with Sentinel 2, Support Vector Machine (SVM) was sensitive to class imbalance and transitional zones and Random Forest (RF) performed best on Landsat 8 but underperformed on Sentinel 2, with limited interpretability due to the absence of feature importance analysis. Sparse vegetation in the semi-arid Erongo region [72], still hampered mineral detection along ephemeral rivers and paleochannels, NDVI-based masking reduced but did not eliminate this effect, occasionally omitting mineralised zones under seasonal or sparse cover. Most critically, the absence of direct field validation reduced confidence and constrains the confirmatory accuracy of mineral classification, as outputs were verified only against secondary datasets prone to spatial errors and outdated information. Lastly, while effective in Erongo, this approach may require adaptation for other regions with different vegetation cover, weathering intensity and spectral backgrounds [73].
4.5. Broader Implications
This study demonstrates how Earth Observation (EO) can promote sustainable, non-invasive mineral exploration in Namibia by reducing costly and logistically difficult field surveys in remote and sensitive areas. Using Landsat 8 and Sentinel 2 data with PCA, targeted spectral indices and supervised classifiers (MLC, RF, SVM), the framework enables large-scale reconnaissance with minimal ecological disturbance, aligning with the Minerals Policy of 2003 [24] and Environmental Management Act of 2007 [74]. The method is scalable, cost-effective and supports data-driven targeting, as shown in Erongo, with potential application to underexplored regions such as Kunene [75], Karas [76] and Omaheke [77]. It shortens exploration timelines, lowers costs, improves target confidence and enhances investment appeal, enabling prospectivity mapping to guide licensing and attract foreign investment. Though tailored to Erongo, it is transferable to other arid and semi-arid provinces in Africa [78], Australia [79] and Central Asia [80]. With expanding initiatives like Digital Earth Africa and GMES & Africa and growing EO data access, Namibia is positioned to lead in spatial-based exploration for sustainable resource development.
5. Conclusions
This study demonstrated the viability of a cost-effective and non-invasive mineral exploration framework for Namibia’s Erongo region by integrating Landsat 8 and Sentinel 2 imagery, mineral-sensitive spectral indices, Principal Component Analysis (PCA) and supervised classification algorithms (MLC, RF, SVM). Spectral indices targeting Carbonates, Iron Oxides, Ferrous Iron and Clays proved effective in delineating hydrothermal alteration zones, with Sentinel 2 outperforming Landsat 8 in detecting Ferric and Clay alteration due to its finer spatial (10 m) and spectral (SWIR) resolution. PCA enhanced spectral separability, with the first three components capturing over 95% of variance and producing composites that clearly differentiated lithological boundaries and alteration halos. Classifier performance was sensor-dependent: RF achieved the highest accuracy for Landsat 8, while MLC excelled with Sentinel 2, highlighting the importance of aligning algorithm choice with sensor characteristics. The integrated multi-sensor approach offers a reproducible, scalable and transferable methodology applicable to other underexplored mineral-rich regions, supporting Namibia’s Minerals Policy [24], Environmental Management Act [74] and continental EO programmes such as GMES & Africa. Limitations, including moderate spatial resolution, lack of field validation and vegetation interference, can be addressed in future research through hyperspectral or higher-resolution imagery, targeted ground surveys, improved classifier interpretability and temporal analyses to mitigate seasonal effects. Such advances would not only enhance classification accuracy but also enable the development of a national spectral library, region-specific spectral archives and operational Earth Observation processing centres, thereby strengthening Namibia’s geospatial infrastructure and consolidating its leadership in sustainable, technology-driven mineral exploration across Africa.
Author Contributions
R.T.B.: Conceptualisation, Methodology, Software, Writing—original draft. O.G.A.: Conceptualisation, Supervision, Writing—review & editing. All authors have read and agreed to the published version of the manuscript.
Funding
This open-access publication was funded by the Institutional Research and Publications Committee (IRPC-FEBE) of the Namibia University of Science and Technology (NUST).
Institutional Review Board Statement
Not applicable.
Informed Consent Statement
Not applicable.
Data Availability Statement
Data used for this study will be provided by the corresponding author upon reasonable request.
Acknowledgments
The valuable contributions of the Department of Land and Spatial Sciences, Namibia University of Science and Technology, Namibia Statistic Agency’s Digital Namibia platform and Namibia’s Ministry of Mines and Energy in providing access to some of the data used in this study are acknowledged.
Conflicts of Interest
The authors declare no conflicts of interest.
Abbreviations
The following abbreviations are used in this manuscript:
| ASTER | Advanced Spaceborne Thermal Emission and Reflection Radiometer |
| AVIRIS | Airborne Visible/Infrared Imaging Spectrometer |
| CarbI | Carbonate Index |
| CI | Clay Index |
| EnMAP | Environmental Mapping and Analysis Program |
| FII | Ferrous Iron Index |
| HyMap | Hyperspectral Mapper |
| IOI- | Iron Oxide Index |
| GIS | Geographic Information System |
| MLC | Maximum Likelihood Classification |
| NIR | Near-Infrared |
| OA | Overall Accuracy |
| PA | Producer’s Accuracy |
| PE | Expected Agreement |
| PCA | Principal Component Analysis |
| PRISMA | Preferred Reporting Items for Systematic reviews and Meta-Analyses |
| RF | Random Forest |
| RGB | Red, Green, Blue |
| ROI | Region of Interest |
| RS | Remote Sensing |
| SCP | Semi-Automatic Classification Plugin |
| SWIR | Shortwave Infrared |
| SVM | Support Vector Machine |
| UA | User’s Accuracy |
| USGS | United States Geological Survey |
| VNIR | Visible and Near-Infrared |
References
- El Obeid, S. Uranium in Namibia: Yellowcake Fever; Notes de l’Ifri; French Institute of International Relations (Ifri): Paris, France, 2021; Available online: https://www.ifri.org/sites/default/files/migrated_files/documents/atoms/files/elobeid_uranium_namibia_2021.pdf (accessed on 10 June 2025).
- Goodenough, K.M.; Shaw, R.A.; Borst, A.M.; Nex, P.; Kinnaird, J.A.; van Lichtervelde, M.; Essaifi, A.; Koopmans, L.; Deady, E.A. Lithium pegmatites in Africa: A review. Econ. Geol. 2025, 120, 513–539. [Google Scholar] [CrossRef]
- Wilde, A. Towards a mineral systems model for surficial uranium mineralization based on deposits in the Erongo district of Namibia. Minerals 2023, 13, 149. [Google Scholar] [CrossRef]
- Shaba, T. Textural Variations in Uranium-Bearing Sheeted Leucogranites, with Specific Attention to “Oxidation Halos” from the Rössing Mine, Namibia. Master’s Dissertation, University of the Witwatersrand, Johannesburg, South Africa, 2022. Available online: https://www.proquest.com/dissertations-theses/textural-variations-uranium-bearing-sheeted/docview/3161877132/se-2?accountid=50177 (accessed on 16 July 2025).
- Olasehinde, A.; Yusuf, A.; Usman, M.; Tabale, R.; Mbiimbe, E.; Daspan, R. Exploring Africa’s lithium wealth: Geological insights, mineralization processes and sustainable development prospects. Dutse J. Pure Appl. Sci. 2025, 10, 315–332. [Google Scholar] [CrossRef]
- Henschel, J.R.; Jürgens, N. Ecology of psammophily in the Namib dunes. ResearchGate 2024. preprint. Available online: https://www.researchgate.net/publication/382335900 (accessed on 16 July 2025).
- EnvironClim Consulting Services. Environmental Assessment Scoping Report for the Establishment of Mining Activities of Base and Rare Metals and Industrial Minerals on Mining Claims: 70010, 70011 & 70012, Omaruru District, Erongo Region (Final Submission); Ministry of Environment, Forestry and Tourism: Windhoek, Namibia, 2025. Available online: https://eia.meft.gov.na/screening/2852_environmental_assessment_scoping_report_updated_pdf.pdf (accessed on 16 July 2025).
- Rani, K. Mineral exploration using remote sensing. In Remote Sensing for Geophysicists; Gupta, M., Ed.; CRC Press: Boca Raton, FL, USA, 2025; pp. 79–94. [Google Scholar] [CrossRef]
- Osinowo, O.O.; Gomy, A.; Isseini, M. Mapping hydrothermal alteration mineral deposits from Landsat 8 satellite data in Pala, Mayo Kebbi Region, Southwestern Chad. Sci. Afr. 2021, 11, e00687. [Google Scholar] [CrossRef]
- Chaves, M.E.D.; Picoli, M.C.A.; Sanches, I.D. Recent Applications of Landsat 8/OLI and Sentinel-2/MSI for Land Use and Land Cover Mapping: A Systematic Review. Remote Sens. 2020, 12, 3062. [Google Scholar] [CrossRef]
- Hegab, M.A.E. A multi-disciplinary approach for uranium exploration using remote sensing and airborne gamma-ray spectrometry data in the Gebel Duwi area, Central Eastern Desert, Egypt. Sci. Rep. 2024, 14, 19739. [Google Scholar] [CrossRef]
- Shirmard, H.; Farahbakhsh, E.; Pour, A.B.; Muslim, A.M.; Müller, R.D.; Chandra, R. Integration of Selective Dimensionality Reduction Techniques for Mineral Exploration Using ASTER Satellite Data. Remote Sens. 2020, 12, 1261. [Google Scholar] [CrossRef]
- Masoumi, F.; Eslamikshi, T.; Honarmand, M.; Abkar, A.A. A Comparative Study of Landsat-7 and Landsat-8 Data Using Image Processing Methods for Hydrothermal Alteration Mapping. Resour. Geol. 2016, 67, 72–88. [Google Scholar] [CrossRef]
- Girija, R.R.; Mayappan, S. Mapping of Mineral Resources and Lithological Units: A Review of Remote Sensing Techniques. Int. J. Image Data Fusion 2019, 10, 79–106. [Google Scholar] [CrossRef]
- Baid, S.; Tabit, A.; Algouti, A.; Algouti, A.; Nafouri, I.; Souddi, S.; Aboulfaraj, A.; Ezzahzi, S.; Elghouat, A. Lithological Discrimination and Mineralogical Mapping Using Landsat-8 OLI and ASTER Remote Sensing Data: Igoudrane Region, Jbel Saghro, Anti Atlas, Morocco. Heliyon 2023, 9, e17363. [Google Scholar] [CrossRef]
- Hennessy, A.; Clarke, K.; Lewis, M. Hyperspectral classification of plants: A review of waveband selection generalisability. Remote Sens. 2020, 12, 113. [Google Scholar] [CrossRef]
- Salman, H.A.; Kalakech, A.; Steiti, A. Random Forest Algorithm Overview. Deleted J. 2024, 69, 79. [Google Scholar] [CrossRef]
- Support Vector Machine. NV5 Geospatial Documentation; NV5 Geospatial: Broomfield, CO, USA, 2024; Available online: https://www.nv5geospatialsoftware.com/docs/SupportVectorMachine.html (accessed on 15 October 2025).
- Esri. Maximum Likelihood Classification (Spatial Analyst Tool); Esri: Redlands, CA, USA, 2025; Available online: https://pro.arcgis.com/en/pro-app/latest/tool-reference/spatial-analyst/maximum-likelihood-classification.htm (accessed on 15 October 2025).
- Wang, D.; Chen, J.; Dai, X. Extracting Geological and Alteration Information and Predicting Antimony Ore Based on Multisource Remote Sensing Data in Huangyangling, Xinjiang. Front. Earth Sci. 2024, 12, 1366727. [Google Scholar] [CrossRef]
- Pal, M.; Rasmussen, T.; Porwal, A. Optimized lithological mapping from multispectral and hyperspectral remote sensing images using fused multi-classifiers. Remote Sens. 2020, 12, 177. [Google Scholar] [CrossRef]
- Thomas, A.; Radzuma, T.; Mukosi, N.C. Usefulness of Sentinel-2 Satellite Data to Aid in Geoscientific Mapping Work: A Case Study of Giyani Greenstone Belt Area. Episodes 2022, 46, 407–419. [Google Scholar] [CrossRef]
- Abay, H.H.; Legesse, D.; Suryabhagavan, K.V.; Atnafu, B. Mapping of Ferric (Fe3+) and Ferrous (Fe2+) Iron Oxides Distribution Using ASTER and Landsat 8 OLI Data, in Negash Lateritic Iron Deposit, Northern Ethiopia. Geol. Ecol. Landsc. 2024, 8, 223–240. [Google Scholar] [CrossRef]
- Ministry of Mines and Energy. Minerals Policy of Namibia; Government of the Republic of Namibia: Windhoek, Namibia, 2003. Available online: https://www.npc.gov.na/wp-content/uploads/2022/06/Minerals-Policy-Of-Namibia.pdf (accessed on 4 June 2025).
- Office of the President. Namibia Vision 2030: Policy Framework for Long-Term National Development (Main Document); Office of the President: Windhoek, Namibia, 2004. Available online: https://www.npc.gov.na/vision-2030 (accessed on 4 June 2025).
- Government of the Republic of Namibia. Harambee Prosperity Plan II: 2021–2025 (HPP II): A Roadmap for Economic Recovery and Inclusive Growth; Office of the President: Windhoek, Namibia, 2021; Available online: https://www.kas.de/documents/279052/279101/Der+Harambee+Prosperity+Plan+II.pdf/ (accessed on 4 June 2025).
- Environmental Research Consultancy. Geography; Erongo Regional Council: Swakopmund, Namibia, 2015; Available online: https://www.erc.com.na/erongo-region/geography/ (accessed on 25 May 2025).
- Goslin, L.M. Deformation and Partial Melting in the Central Zone of the Damara Orogen, Namibia. Master’s Thesis, University of the Witwatersrand, Johannesburg, South Africa, 2023. Available online: https://www.proquest.com/docview/3161868049 (accessed on 18 July 2025).
- Falster, A.U.; Simmons, W.B.; Webber, K.L.; Boudreaux, A.P. Mineralogy and Geochemistry of the Erongo Sub-Volcanic Granite-Miarolitic-Pegmatite Complex, Erongo, Namibia. Can. Mineral. 2018, 56, 425–449. [Google Scholar] [CrossRef]
- Chudasama, B.; Porwal, A.; Wilde, A.; González-Álvarez, I.; Aranha, M.; Akarapu, U.; Hirsch, M.; Becker, E. Bedrock Topography Modeling and Calcrete-Uranium Prospectivity Analysis of Central Erongo Region, Namibia. Ore Geol. Rev. 2019, 114, 103109. [Google Scholar] [CrossRef]
- Gray, T.M. The Geological Setting of Uranium Mineralisation in the Rössing Area, Namibia. Ph.D. Dissertation, University of the Witwatersrand, Johannesburg, South Africa, 2015. Available online: https://hdl.handle.net/10539/32822 (accessed on 18 July 2025).
- Shilunga, J.; Kisters, A. The Karibib Region as an Emerging Gold District in the Damara Belt, Namibia: A Review and Regional Interpretation of Controls on Mineralization. Miner. Depos. 2025, 60. [Google Scholar] [CrossRef]
- Namibweb. Erongo Region|Namibia. Available online: https://www.namibweb.com/erongoregion.htm (accessed on 25 May 2025).
- Pulfrich, A.; Kemper, J. Environmental Impact Assessment for the Proposed Meob Bay Tourism Development, Namibia: Marine Biodiversity Specialist Study; Pisces Environmental Services (Pty) Ltd.: McGregor, South Africa, 2022; Prepared for Namibian Affirmative Management and Businesses (NAMAB) (Pty) Ltd., on behalf of Knight Piésold Consulting (Pty) Ltd.; Available online: https://www.knightpiesold.com/sites/pa/assets/File/meob-bay/Annexure%20G_Marine%20Ecology%20Specialist%20Report.pdf (accessed on 5 June 2025).
- Ministry of Mines and Energy. Services–Ministry of Mines and Energy; Government of the Republic of Namibia: Windhoek, Namibia, 2025. Available online: https://www.mme.gov.na/services/ (accessed on 20 October 2025).
- Mariathasan, V.; Bezuidenhoudt, E.; Olympio, K.R. Evaluation of Earth Observation Solutions for Namibia’s SDG Monitoring System. Remote Sens. 2019, 11, 1612. [Google Scholar] [CrossRef]
- U.S. Geological Survey. EarthExplorer; U.S. Department of the Interior: Reston, VA, USA, n.d. Available online: https://earthexplorer.usgs.gov/ (accessed on 15 October 2025).
- Copernicus Data Space Ecosystem. Browser; European Space Agency: Paris, France, n.d.; Available online: https://browser.dataspace.copernicus.eu/ (accessed on 15 October 2025).
- Ministry of Mines and Energy/Geological Survey of Namibia. Earth Data Namibia/GSN; Ministry of Mines and Energy: Windhoek, Namibia, 2025. Available online: https://www.mme.gov.na/gsn/ (accessed on 15 October 2025).
- Namibia Statistics Agency. Digital Namibia; Namibia Statistics Agency: Windhoek, Namibia, 2025; Available online: https://digitalnamibia.nsa.org.na/ (accessed on 15 October 2025).
- GISGeography. What Is NDVI (Normalized Difference Vegetation Index)? 2025. Available online: https://gisgeography.com/ndvi-normalized-difference-vegetation-index/ (accessed on 15 October 2025).
- Hede, A.N.H.; Syafrizal, S.; Khairo, D.F. Comparison of Landsat-8 and Sentinel-2 Imagery for Identifying Hydrothermal Alteration in a Vegetated Area. In Proceedings of the International Symposium on Earth Science and Technology 2021, Fukuoka, Japan, 8–9 December 2021; Kyushu University: Fukuoka, Japan, 2021. Available online: https://www.researchgate.net/publication/363271601_Comparison_of_Landsat-8_and_Sentinel-2_Imagery_for_Identifying_Hydrothermal_Alteration_in_a_Vegetated_Area (accessed on 15 October 2025).
- Mandanici, E.; Bitelli, G. Preliminary Comparison of Sentinel-2 and Landsat 8 Imagery for a Combined Use. Remote Sens. 2016, 8, 1014. [Google Scholar] [CrossRef]
- Abdelaziz, R.; Abd El-Rahman, Y.; Wilhelm, S. Landsat-8 Data for Chromite Prospecting in the Logar Massif, Afghanistan. Heliyon 2018, 4, e00542. [Google Scholar] [CrossRef]
- Hung, T.L.; Thanh, N.S.; Kha, V.T. An Automatic Method for Clay Minerals Extraction from Landsat 8 OLI Data: A Case Study in Chi Linh City, Hai Duong Province. In Environmental Science and Engineering; Springer: Cham, Switzerland, 2023; pp. 105–119. [Google Scholar] [CrossRef]
- Shirkhani, M.; Ghaderi, M.; Rashidnejad-Omran, N. Hyperspectral vs. Multispectral Remote Sensing: ASTER and PRISMA Performance in Mapping IOA Deposits in the Bafq Mining District, Iran. Ore Geol. Rev. 2025, 164, 106923. [Google Scholar] [CrossRef]
- Pandey, A.C.; Swain, S.K.; Dwivedi, C.S. Mapping Iron Oxides with Landsat-8/OLI Imagery from Iron Ore Deposit in Singhbhum Shear Zone, Eastern India: Its Implication to Mineral Exploration. Ore Energy Resour. Geol. 2025, 12, 100089. [Google Scholar] [CrossRef]
- Majasalmi, T.; Rautiainen, M. The Potential of Sentinel-2 Data for Estimating Biophysical Variables in a Boreal Forest: A Simulation Study. Remote Sens. Lett. 2016, 7, 427–436. [Google Scholar] [CrossRef]
- Sekandari, M.; Masoumi, I.; Pour, A.B.; Muslim, A.M.; Rahmani, O.; Hashim, M.; Zoheir, B.; Pradhan, B.; Misra, A.; Aminpour, S.M. Application of Landsat-8, Sentinel-2, ASTER and WorldView-3 Spectral Imagery for Exploration of Carbonate-Hosted Pb-Zn Deposits in the Central Iranian Terrane (CIT). Remote Sens. 2020, 12, 1239. [Google Scholar] [CrossRef]
- Ge, W.; Cheng, Q.; Jing, L.; Wang, F.; Zhao, M.; Ding, H. Assessment of the Capability of Sentinel-2 Imagery for Iron-Bearing Minerals Mapping: A Case Study in the Cuprite Area, Nevada. Remote Sens. 2020, 12, 3028. [Google Scholar] [CrossRef]
- Pour, A.B.; Hashim, M. Hydrothermal Alteration Mapping from Landsat-8 Data, Sar Cheshmeh Copper Mining District, South-Eastern Islamic Republic of Iran. J. Taibah Univ. Sci. 2015, 9, 155–166. [Google Scholar] [CrossRef]
- Delaney, B.; Tansey, K.; Whelan, M. Satellite Remote Sensing Techniques and Limitations for Identifying Bare Soil. Remote Sens. 2025, 17, 630. [Google Scholar] [CrossRef]
- Maynard, L. Advanced Machine Learning and Low-Dimensionality Projection Techniques for Enhanced GNSS Interference and Spoofing Detection. Ph.D. Dissertation, University of Colorado Colorado Springs, Colorado Springs, CO, USA, 2025. Available online: https://www.proquest.com/docview/3167798896 (accessed on 17 September 2025).
- Kuhn, S. Machine Learning for Mineral Exploration: Prediction and Quantified Uncertainty at Multiple Exploration Stages. Ph.D. Thesis, University of Tasmania, Tasmania, Australia, 2021. [Google Scholar] [CrossRef]
- Congalton, R.G.; Green, K. Assessing the Accuracy of Remotely Sensed Data; CRC Press: Boca Raton, FL, USA, 2019. [Google Scholar] [CrossRef]
- Da Silva, C.N.; Da Silva, J.M.P.; Castro, C.J.N. Methodological Guidelines for the Use of Geoprocessing Tools: Spatial Analysis Operations—Kernel, Buffer and the Remote Sensing Image Classification. Agric. Sci. 2015, 6, 707–716. [Google Scholar] [CrossRef]
- Congedo, L. Semi-Automatic Classification Plugin: A Python tool for the download and processing of remote sensing images in QGIS. J. Open Source Softw. 2021, 6, 3172. Available online: https://semiautomaticclassificationmanual.readthedocs.io/pl/latest/introduction.html (accessed on 15 October 2025). [CrossRef]
- Zaini, N.; Van der Meer, F.; Van der Werff, H. Determination of Carbonate Rock Chemistry Using Laboratory-Based Hyperspectral Imagery. Remote Sens. 2014, 6, 4149–4172. [Google Scholar] [CrossRef]
- Abubakar, A.J.; Hashim, M.; Pour, A.B. Identification of Hydrothermal Alteration Minerals Associated with Geothermal System Using ASTER and Hyperion Satellite Data: A Case Study from Yankari Park, NE Nigeria. Geocarto Int. 2017, 34, 597–625. [Google Scholar] [CrossRef]
- Bousbih, S.; Zribi, M.; Pelletier, C.; Gorrab, A.; Lili-Chabaane, Z.; Baghdadi, N.; Aissa, N.B.; Mougenot, B. Soil Texture Estimation Using Radar and Optical Data from Sentinel-1 and Sentinel-2. Remote Sens. 2019, 11, 1520. [Google Scholar] [CrossRef]
- Das, D. Understanding the Aqueous History of Gale Crater, Mars as Recorded by B and Li in Ca-Sulfate Veins. Ph.D. Dissertation, McGill University, Montréal, QC, Canada, 2022. Available online: https://www.proquest.com/docview/2838440060 (accessed on 18 July 2025).
- Dunn, S.C.; von der Heyden, B.P. Gold Remobilization in Gossans of the Amani Area, Southwestern Tanzania. Ore Geol. Rev. 2021, 131, 104033. [Google Scholar] [CrossRef]
- Muyongo, A. Geochemical and Mineralogical Characterisation of the Inca Uranium Mineralisation in the Central Zone of the Damara Belt, Namibia. Master’s Thesis, University of Namibia, Windhoek, Namibia, 2020. Available online: http://hdl.handle.net/11070/2929 (accessed on 18 July 2025).
- Chakraborty, R.; Rachdi, I.; Thiele, S.; Booysen, R.; Kirsch, M.; Lorenz, S.; Gloaguen, R.; Sebari, I. A spectral and spatial comparison of satellite-based hyperspectral data for geological mapping. Remote Sens. 2024, 16, 2089. [Google Scholar] [CrossRef]
- Mwaniki, M.; Schellmann, G.; Möller, M. A Comparison of Landsat 8 (OLI) and Landsat 7 (ETM+) in Mapping Geology and Visualising Lineaments: A Case Study of Central Region Kenya. Int. Arch. Photogramm. Remote Sens. Spatial Inf. Sci. 2015, XL-7/W3, 897–903. [Google Scholar] [CrossRef]
- Testa, F.; Villanueva, C.; Cooke, D.; Zhang, L. Lithological and Hydrothermal Alteration Mapping of Epithermal, Porphyry and Tourmaline Breccia Districts in the Argentine Andes Using ASTER Imagery. Remote Sens. 2018, 10, 203. [Google Scholar] [CrossRef]
- Chen, Y.; Wang, Y.; Zhang, F.; Dong, Y.; Song, Z.; Liu, G. Remote sensing for lithology mapping in vegetation-covered regions: Methods, challenges, and opportunities. Minerals 2023, 13, 1153. [Google Scholar] [CrossRef]
- Cortea, I.M.; Ghervase, L.; Rădvan, R.; Serițan, G. Assessment of Easily Accessible Spectroscopic Techniques Coupled with Multivariate Analysis for the Qualitative Characterization and Differentiation of Earth Pigments of Various Provenance. Minerals 2022, 12, 755. [Google Scholar] [CrossRef]
- Chen, C.; Gao, L.; Xie, F.; Li, S.; Xia, F. Extracting Hydrothermally Altered Information Using WorldView-3 Data: A Case Study of Huitongshan, NW Gansu, China. Front. Earth Sci. 2023, 11, 1250591. [Google Scholar] [CrossRef]
- Abera, M.G. Characterization of Rock Samples Using SWIR-LWIR Hyperspectral Imaging Techniques–An Example of the High Sulfidation Epithermal System of Rodalquilar, Southeast Spain. Master’s Thesis, University of Twente, Enschede, The Netherlands, 2018. Available online: https://www.researchgate.net/publication/343381799_CHARACTERIZATION_OF_ROCK_SAMPLES_USING_SWIR-LWIR_HYPERSPECTRAL_IMAGING_TECHNIQUES (accessed on 14 June 2025).
- Shaik, R.U.; Periasamy, S.; Zeng, W. Potential Assessment of PRISMA Hyperspectral Imagery for Remote Sensing Applications. Remote Sens. 2023, 15, 1378. [Google Scholar] [CrossRef]
- SS Consultants. Environmental Scoping and Assessment Report: For the Proposed Mineral Exploration of Base and Rare Metals, Dimension Stone, Industrial Minerals and Precious Metals on Exclusive Prospecting License No. 9490, Dorob National Park, Erongo Region–Namibia (ECC Application No. 005078); Ministry of Environment, Forestry and Tourism: Windhoek, Namibia, 2025. Available online: https://eia.meft.gov.na/screening/5078_esa_report_epl9490_final_reduced.pdf (accessed on 14 June 2025).
- Huang, J.; Yu, Y. Understory Terrain Estimation by Synergizing Ice, Cloud and Land Elevation Satellite-2 and Multi-Source Remote Sensing Data. Remote Sens. 2024, 16, 4770. [Google Scholar] [CrossRef]
- Republic of Namibia. Environmental Management Act, 2007 (Act No. 7 of 2007); Legal Assistance Centre: Windhoek, Namibia, 2007; Available online: https://www.lac.org.na/laws/annoSTAT/Environmental%20Management%20Act%207%20of%202007.pdf (accessed on 14 June 2025).
- Nghoongoloka, A.; Takahashi, R.; Manalo, P.; Agangi, A.; Sato, H.; Mocke, H.; Nopeia, M.; Blamey, N.; Enno, T.; Bowell, R. Genesis of Sediment-Hosted Copper and Silver Mineralization at the Omatapati Prospect, Kaoko Belt, Opuwo District, Kunene Region, Namibia. Resour. Geol. 2024, 74. [Google Scholar] [CrossRef]
- Connelly, D.; Walker, P.W.A.; Gallagher, M.S. Haib Copper Project, Karas Region, Namibia: Amended NI 43-101 Technical Report–Preliminary Economic Assessment; P&E Walker Consultancy CC; METS Engineering; Deep-South Resources Inc.: West Perth, WA, USA, 2024; Available online: https://www.koryxcopper.com/wp-content/uploads/2024/01/J5329-Haib-Amended-PEA-January-17-2024_clean.pdf (accessed on 11 June 2025).
- Resilient Environmental Solutions. Environmental Assessment for Exclusive Prospecting License 7415 near Gobabis: Draft Scoping Report for First Round Public Consultation; Resilient Environmental Solutions: Windhoek, Namibia, 2021; Available online: https://the-eis.com/elibrary/sites/default/files/downloads/literature/2357_SR_EPL%207415%20near%20Gobabis.pdf (accessed on 14 June 2025).
- Kübler, S.; Rucina, S.; Aßbichler, D.; Eckmeier, E.; King, G. Lithological and Topographic Impact on Soil Nutrient Distributions in Tectonic Landscapes: Implications for Pleistocene Human–Landscape Interactions in the Southern Kenya Rift. Front. Earth Sci. 2021, 9, 611687. [Google Scholar] [CrossRef]
- Perring, C.S.; Hronsky, J.M.A.; Crowe, M. Phanerozoic History of the Pilbara Region: Implications for Iron Mineralisation. Aust. J. Earth Sci. 2022, 69, 757–775. [Google Scholar] [CrossRef]
- Wang, W.; Wang, X.; Zhang, B.; Wang, Q.; Liu, D.; Han, Z.; Laolo, S.; Souksan, P.; Liu, H.; Zhou, J.; et al. National-Scale Geochemical Baseline of 69 Elements in Laos Stream Sediments. Minerals 2022, 12, 1360. [Google Scholar] [CrossRef]
Disclaimer/Publisher’s Note: The statements, opinions and data contained in all publications are solely those of the individual author(s) and contributor(s) and not of MDPI and/or the editor(s). MDPI and/or the editor(s) disclaim responsibility for any injury to people or property resulting from any ideas, methods, instructions or products referred to in the content. |
© 2025 by the authors. Licensee MDPI, Basel, Switzerland. This article is an open access article distributed under the terms and conditions of the Creative Commons Attribution (CC BY) license (https://creativecommons.org/licenses/by/4.0/).