Article

Numerical Modelling of Steel Angles with Double-Shear Splice Connections Under Compression

1
Energy Development Research Institute, China Southern Power Grid, No. 11 Kexiang Road, Science City, Guangzhou 510663, China
2
State Key Laboratory of Safety and Resilience of Civil Engineering in Mountain Area, Chongqing 400045, China
3
School of Civil Engineering, Chongqing University, Chongqing 400045, China
4
Southwest Electric Power Design Institute Co., Ltd., China Power Engineering and Consulting Group, 16 Dongfeng Road, Chenghua District, Chengdu 610021, China
*
Author to whom correspondence should be addressed.
Appl. Sci. 2025, 15(24), 13141; https://doi.org/10.3390/app152413141
Submission received: 3 November 2025 / Revised: 9 December 2025 / Accepted: 11 December 2025 / Published: 14 December 2025
(This article belongs to the Special Issue Design, Fabrication and Applications of Steel Structures)

Abstract

Steel angles connected by bolts have been commonly used in transmission towers. Due to the limited length of steel angles, double-shear splice connections are generally adopted to connect steel angles in main members. The stability of this type of members remains unclear as a result of the presence of discontinuity and is difficult to evaluate using existing design methods. This study presents numerical simulations of steel angles with double-shear splice connections under axial compression. Numerical models are established for discontinuous steel angles and validated against published experimental results. Parameters including splice steel ratio, discontinuity location, slenderness ratio, and width-to-thickness ratio on the axial compression load capacity of steel angles are evaluated. A design equation is proposed based on numerical results to quantify the axial load capacity of discontinuous steel angles. Comparisons with experimental data and values calculated using Chinese design code demonstrate that the proposed equation can predict the ultimate load capacity of discontinuity steel angles with better accuracy than the design method in the Chinese code. Finally, a design equation is further simplified by eliminating the effect of parameters with limited influence on ultimate load under axial compression.

1. Introduction

Steel-lattice transmission towers serve as critical infrastructures for long-distance electricity transmission [1,2]. The usable length of individual steel angles is constrained by manufacturing and transportation limitations, and thus double-shear splice connections are generally used for main steel angles for ease of fabrication [3,4]. The load capacity of steel angles with double-shear splice connections plays a crucial rule in the overall behaviour of towers [5,6]. Besides, connection behaviours are significantly influenced by bolt design and construction details [7,8,9]. However, current Chinese design codes lack detailed provisions to ensure sufficient member lengths and adequate connection capacity [10]. Therefore, the absence of specific design methods and the need to predict the load capacity of bolted connections necessitate essential research to quantify the axial compression behaviour of steel angles with double-shear splice connections.
For equal-leg steel angles under axial compression, researchers have investigated influential parameters and modified design methods using experimental tests and numerical models. Shi et al. [11,12,13] analysed local buckling behaviour of high-strength equal-leg steel angles under axial compression. Design methods were also modified by comparing simulation results with AISC and Eurocode 3 provisions. Li et al. [14] determined the width-to-thickness ratio limit and the strength reduction factor of axially compressed equal-leg angles with varying slenderness ratios and proposed modifications for the design method in the Chinese code. However, transport or fabrication limitations necessitate appropriate connections to extend main steel angles in transmission towers. Li et al. [15] and Yang et al. [16] investigated K-joints through full-scale experimental tests and developed calculation methods to predict their load capacity. Zhou et al. [17,18] studied the behaviour of axially compressed steel dual-angle with cruciform welding filler plates by numerical simulations and established methods for failure mode identification and capacity calculation. Kozak et al. [19] investigated lattice cell towers in mountainous terrain by using finite element modelling to compare bolted splice with open gusseted joints in angle members and to analyse towers with various cross-sections. Eom et al. [20,21] conducted tension test on high-strength bolted end-plate connections for connecting steel angles vertically and found out that bolt fracture was the primary failure mode, but the plate thickness also influenced connection behaviour. However, loss of bolt pretension caused higher stiffness degradation in cruciform connections than in splice connections [22]. Additionally, welding residual stresses and fewer bolts in end-plate connections affected the load capacity of connections. Thus, the design and construction methods for bolted connections require further investigations.
Several researchers have also developed design methods for axial compression behaviour of steel angles with double-shear bolted connections [23,24,25,26,27,28,29,30]. Samia et al. [31,32] developed a database of double-shear bolted connections with various parameters, and then predicted the load capacity and failure modes using several machine-learning models. Qian et al. [3] integrated deep learning with image processing to detect and quantify bolt loosening angles, thereby enhancing the efficiency in stability assessment. However, these studies primarily focused on steel plate bolted connections, and have not been extended to steel angle bolted connections, particularly double-shear splice connections. Li et al. [5] investigated the axial tension behaviour of bolted angle connections and developed machine-learning models for strength prediction based on established database, but it did not include the study on compression behaviour or corresponding parametric analysis. Xu et al. [9] conducted finite element analysis to investigate the axial buckling capacity of equal-leg double-bolted steel angle connections, analysing the effects of slenderness ratio, specification of steel angles, and presence of discontinuity on load capacity. However, it did not account for the influence of diagonal bracings in transmission towers or other factors such as splice steel ratio and discontinuity location. Zhang et al. [10] tested discontinuous equal-leg angles with a splice ratio of 1.1 under axial compression, and evaluated the effects of connection length-width ratio, width-to-thickness ratio, and slenderness ratio, whereas the number of bolts and discontinuity location were not considered. Relationships between effective lengths and support stiffness were established through numerical models to revise the design method in DL/T 5486–2020. Li et al. [33] investigated the axial compression behaviour of double-shear spliced steel angles, and evaluated the accuracy of design methods in the Chinese code by comparing the results of spliced and non-spliced specimens. The results demonstrated that the ultimate load capacity of main steel angle increased with splice steel ratio and bolt connection length within the studied range. To date, no effective methods exist to predict the load capacity of steel angles with double-shear splice connections under axial compression, particularly considering the limitation of diagonal bracings and the influence of splice steel ratio, discontinuity location, slenderness ratio, and width-to-thickness ratio.
This study investigates the behaviour of discontinuous steel angles subjected to axial compression through numerical modelling. In the numerical model, discontinuous main steel angles connected with double-shear splice connection are established, and diagonal steel angles are also simulated. The effects of splice steel ratio, discontinuity location, slenderness ratio, and width-to-thickness ratio on load capacity are studied. Existing design methods in relevant national codes are adopted to evaluate the ultimate load capacity of discontinuous steel angles. Comparisons with test data show that the design method may overestimate the load capacity of discontinuous steel angles. Based on the numerical result, a design method is developed to predict the ultimate load capacity of discontinuous steel angles in compression. The accuracy of the proposed method is examined through comparison with experimental results. The proposed method provides a useful reference for design of discontinuous steel angles in transmission towers.

2. Existing Experimental Investigations

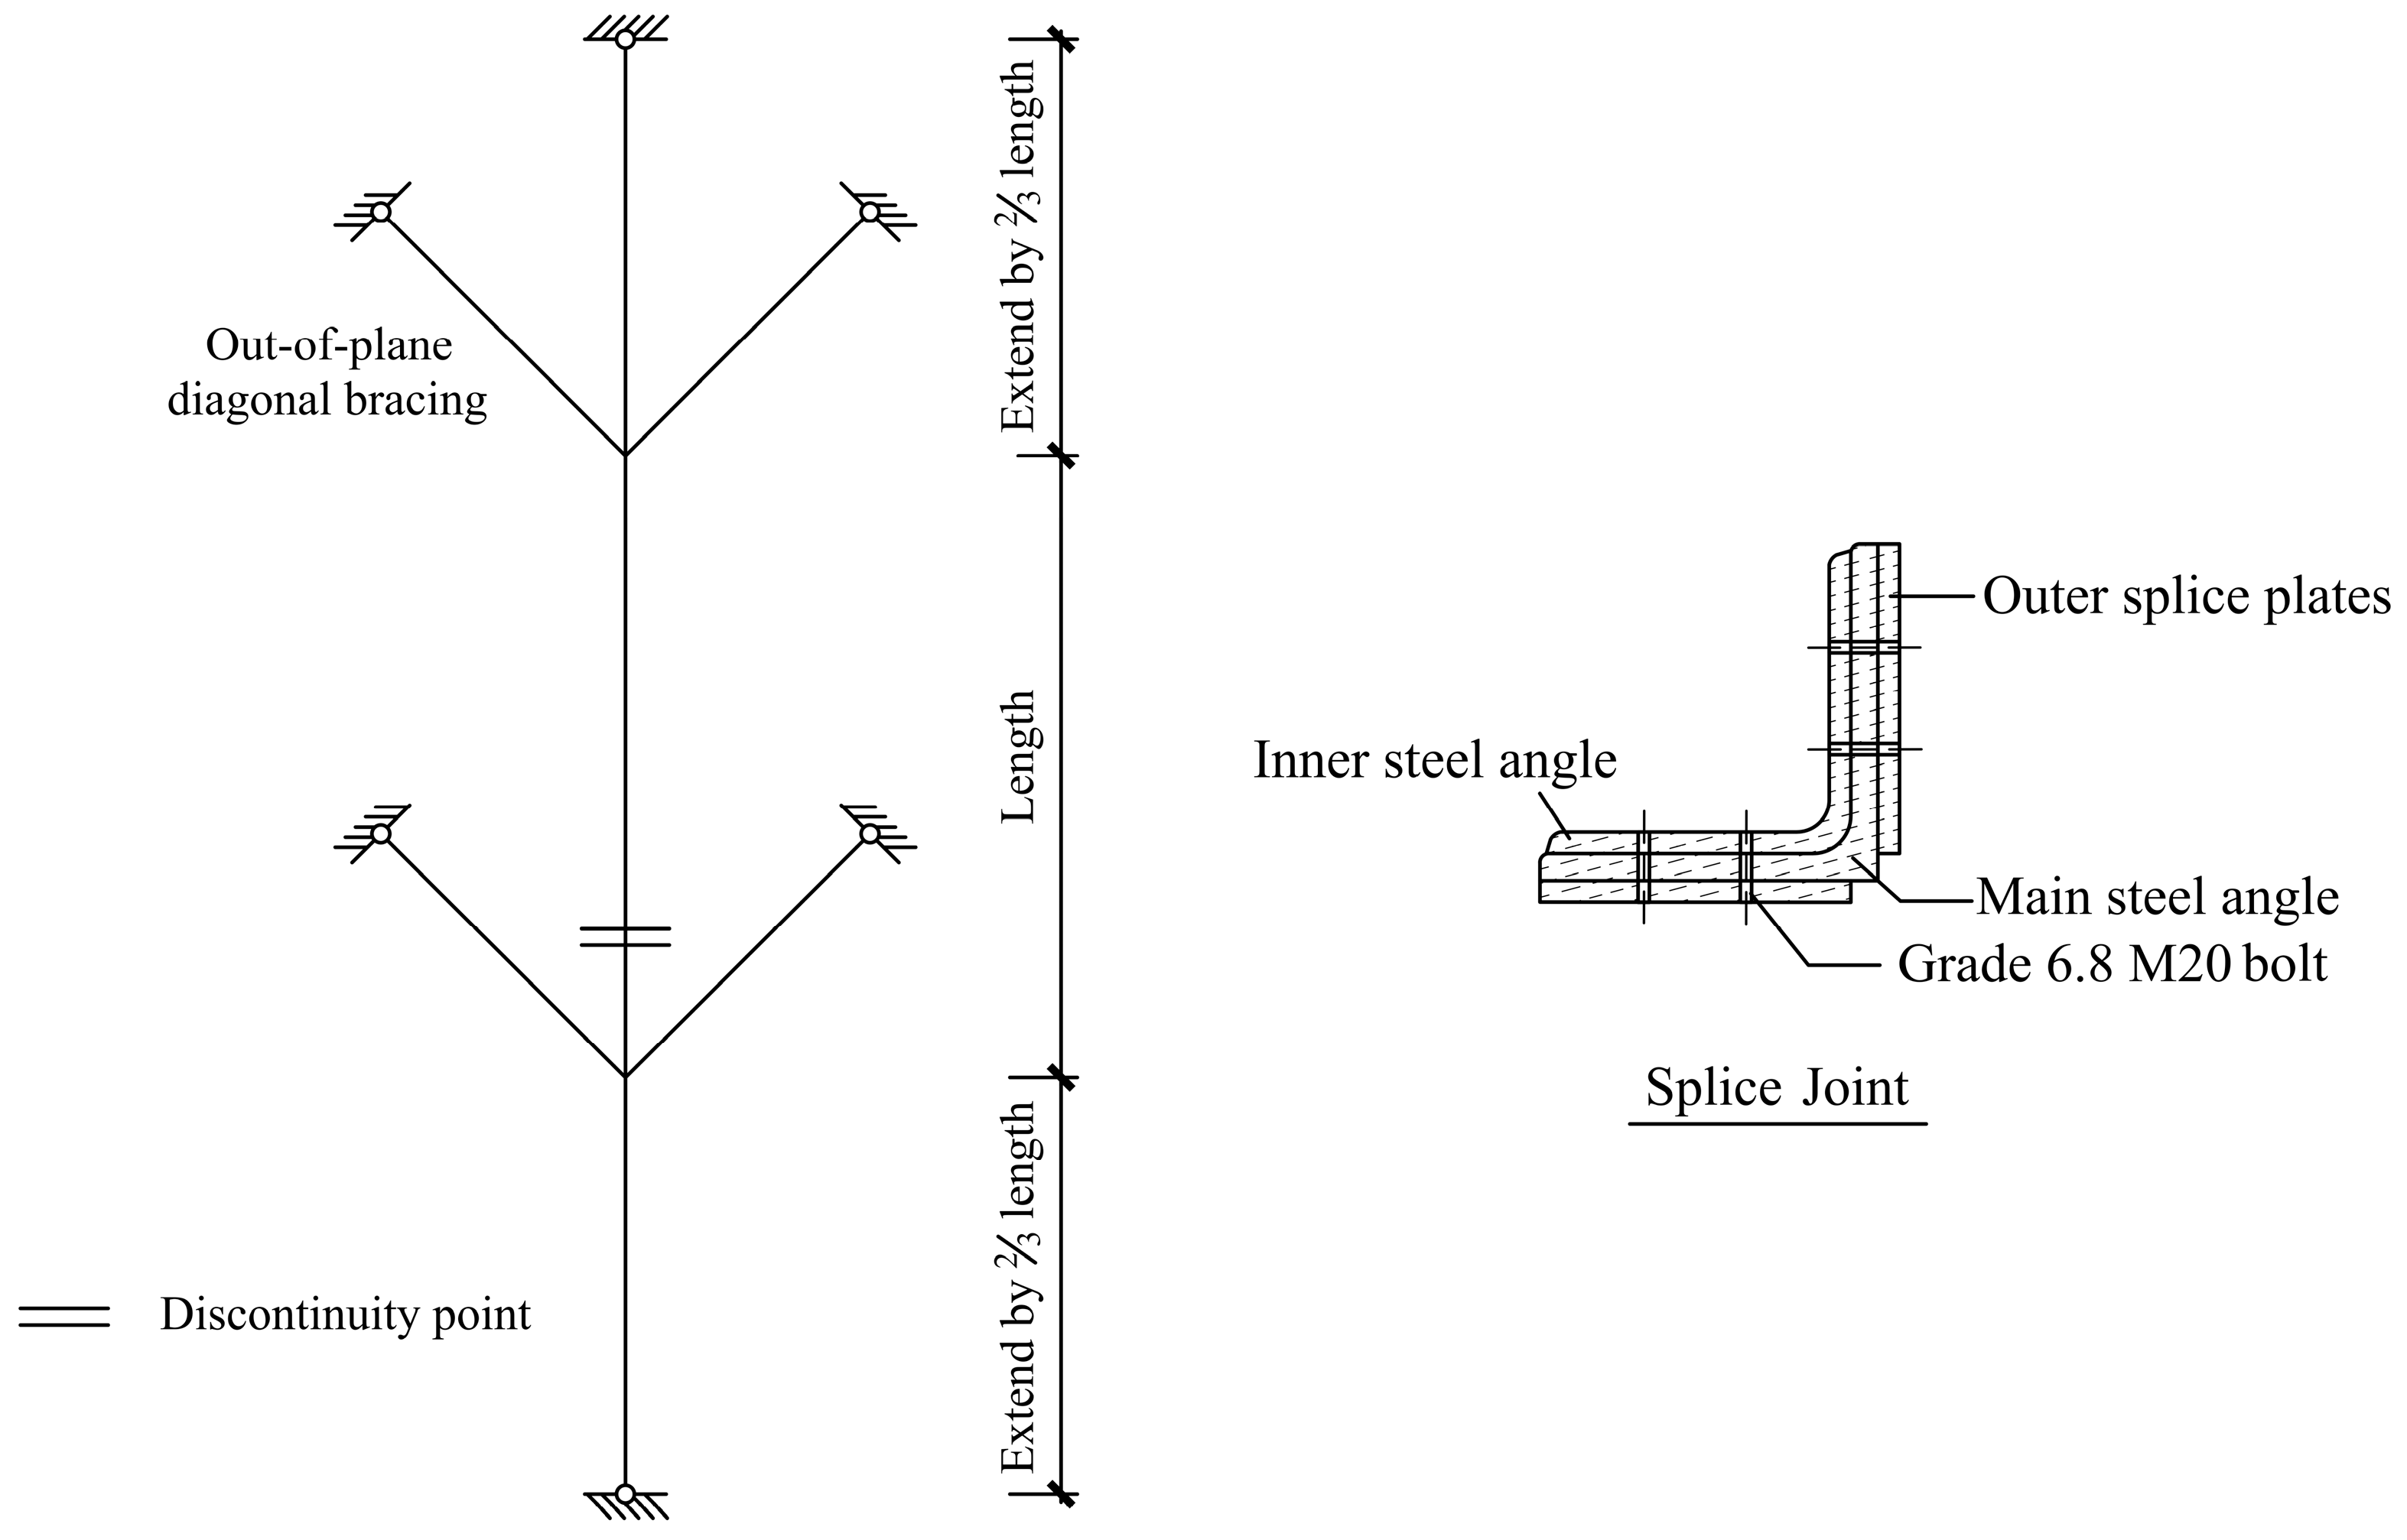
To investigate the compression behaviour of discontinuous main steel angles in transmission towers, Li et al. [33] designed a series of Q355 equal-leg angles with double-shear splice connections. Figure 1 shows the geometric configuration of specimens and the details of double-shear splice connections. The discontinuity point was located at 360 mm away from the segment end. Each specimen comprised discontinuous main steel angle connected by double-shear splice connections, along with four diagonal steel angles bolted to the main members to serve as bracings. Grade 6.8 M20 bolts were used for all connections. Steel angle L125 × 10 was designed as the main angle, and the diagonal bracings were designed using L63 × 5 sections with a length of 1000 mm. The total length of the main angle was 1364 mm, including the double-shear splice connection, and the associated slenderness ratio was 55 about its weakest axis. The splice steel ratio ranged from 1.1 to 1.3, and the number of bolts used at each end of the connection ranged between 3 and 5, and therefore, the total number of bolts at the discontinuous point was four times this value. Detailed dimensions of the specimens and mechanical properties of steel are presented in Table 1 and Table 2, respectively. Specimen B0 was an intact main steel angle serving as the control specimen. The discontinuous specimens were designated as follows: B is the number of bolts per leg; A denotes the splice steel ratio, which represents the ratio of the gross area at splice joint, comprising the inner steel angle and outer splice plates, to the cross-sectional area of the upper main steel angle. Based on the experimental results of Li et al. [33], numerical simulations are conducted to investigate the axial compression behaviour of double-shear spliced main steel angles.

3. Numerical Modelling of Discontinuous Steel Angles

3.1. Establishment of Numerical Models

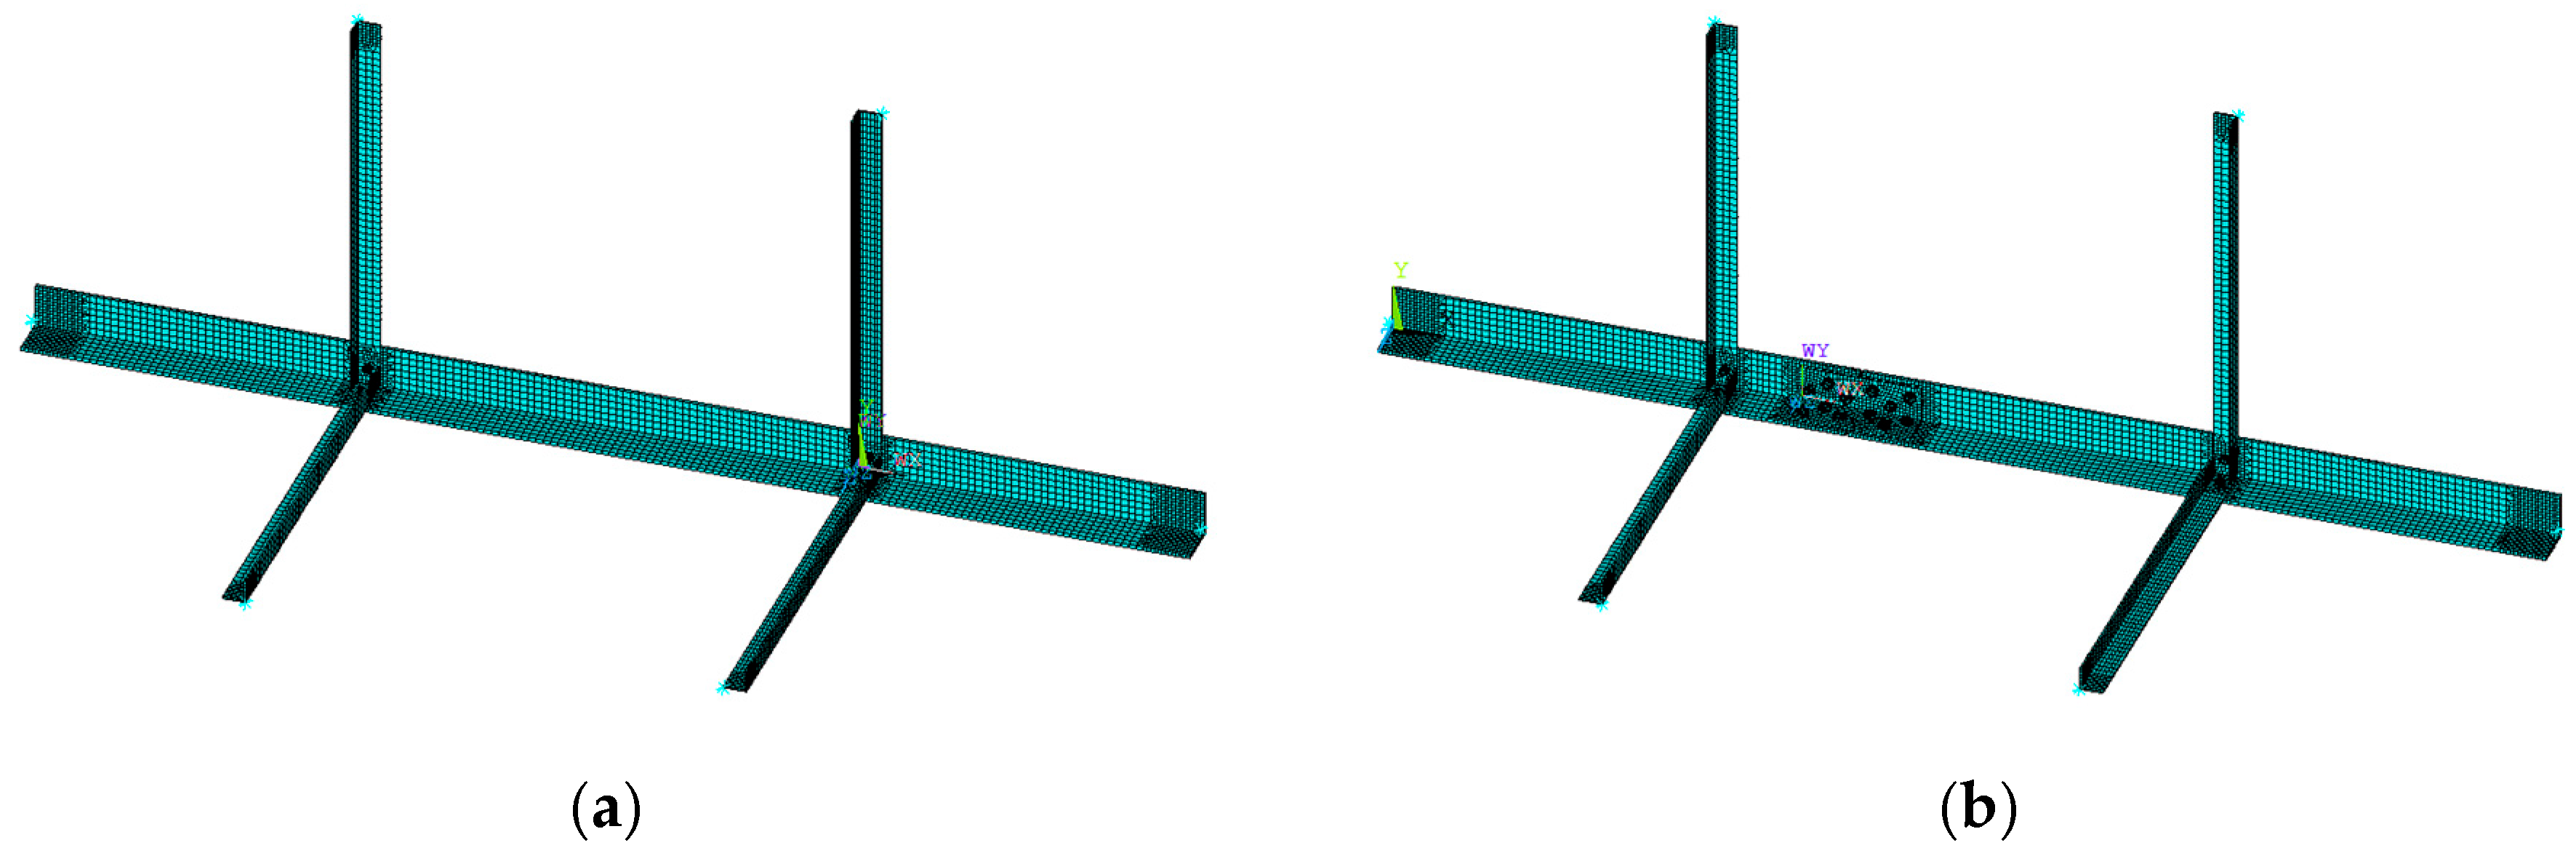
The numerical model of discontinuous steel angles with double-shear splice connections is established using ANSYS 2025R2 [34]. Figure 2 presents the numerical model for an intact primary steel angle and a discontinuous steel angle. All components, including steel angles, bolts, and spliced steels, are simulated by 8-node SOLID185 elements featuring three degrees of freedom per node to accurately capture axial compression behaviour. The total number of bolts used in the double-shear splice connections exceeded 12, and they were arranged in an interlaced pattern. Due to the tight arrangement and the fact that shear force is the primary load, the connection can be regarded as a rigid joint in this study. To simplify the calculation, bolt slippage effects are neglected at connections by setting bolt hole diameters equal to bolt shank diameters. The bolt-hole interfaces are coupled, but the rotational degrees of freedom are released about the bolt axis, thereby simulating realistic deformation behavior. A rigid domain is established at the loaded end with a reference point located at the cross-sectional centroid where axial compression loads are applied. All translational degrees of freedom are restrained at the support with partial rotational freedoms released. Material properties including the yield strength, elastic modulus, cross-sectional area of main angles, splice steels, and diagonal bracings are assigned based on experimental data, as listed in Table 2. Grade 6.8 bolts are modelled with a yield strength of 600 MPa and Poisson’s ratio of 0.3. The bilinear kinematic hardening (BKIN) constitutive model is adopted for steel, with the tangent modulus set to be 2% of the elastic modulus. Standard contact, which employs Augmented Lagrangian algorithm, was defined for all critical interfaces, including the bolt-outer splice plate and outer splice plate-main member interfaces.
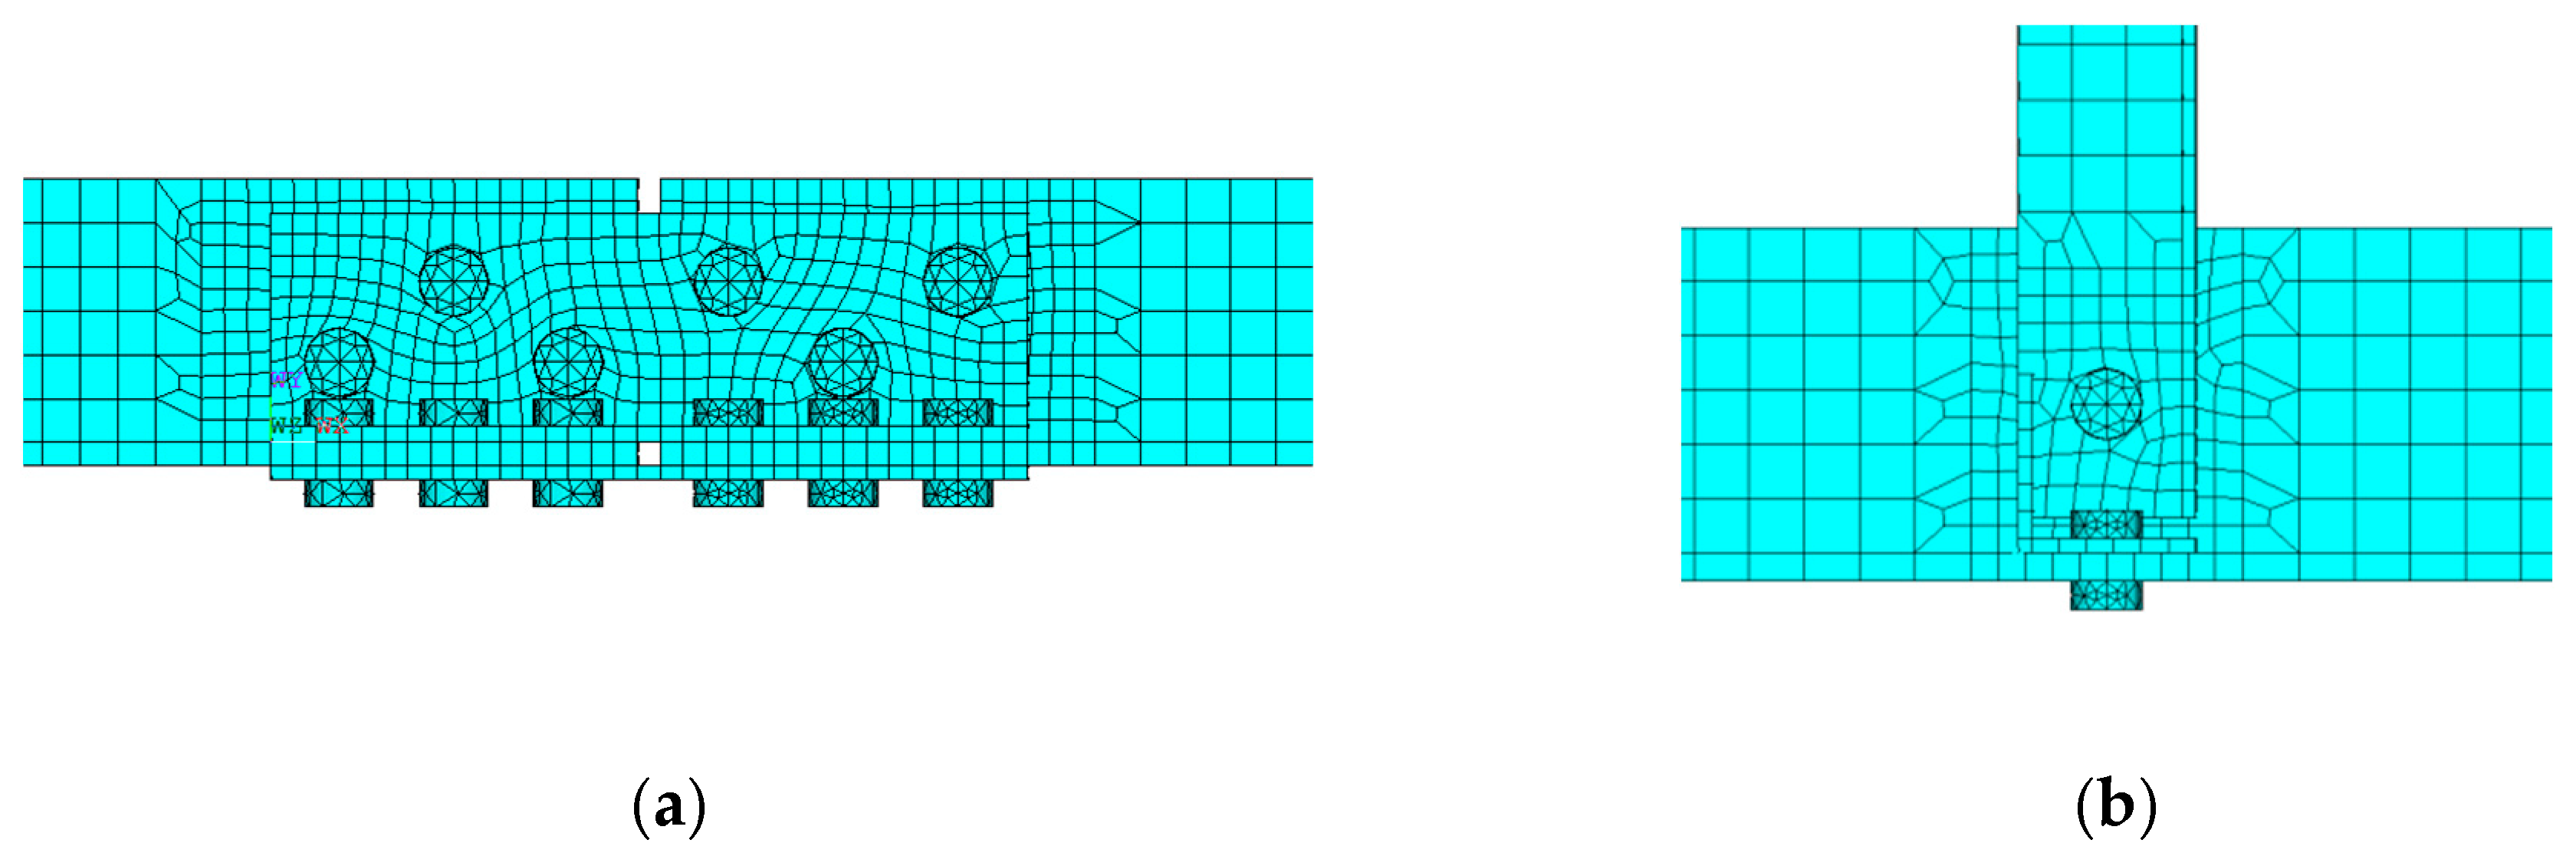
Hexahedral elements are used for main angles, diagonal bracings, and splice steels, and tetrahedral elements are applied to bolts. Local mesh refinement is implemented around bolts and restraints to improve calculation accuracy, as shown in Figure 3. The accuracy and efficiency of finite element models are governed by mesh quality. For meshing, the hexahedral mapped mesh is employed for regular geometries to optimize computational efficiency with fewer elements, whereas the tetrahedral swept mesh is utilized for more complex regions to take advantage of its generation speed and geometric versatility. After multiple simulations, it is determined that the global mesh size is set at 18 mm, with a refined size of 9 mm in critical regions, to achieve computational efficiency. During loading, arc-length method is adopted to account for the geometric nonlinearity of steel angles by activating the large deformation option NLGEOM. The displacement-control axial loading is imposed to the main steel angles, and the analysis is terminated at an ultimate axial displacement of 100 mm to prevent non-convergence. The ultimate load and displacements at key sections are extracted and compared with the experimental results from Li’s tests, which shows good agreement.

3.2. Model Validation

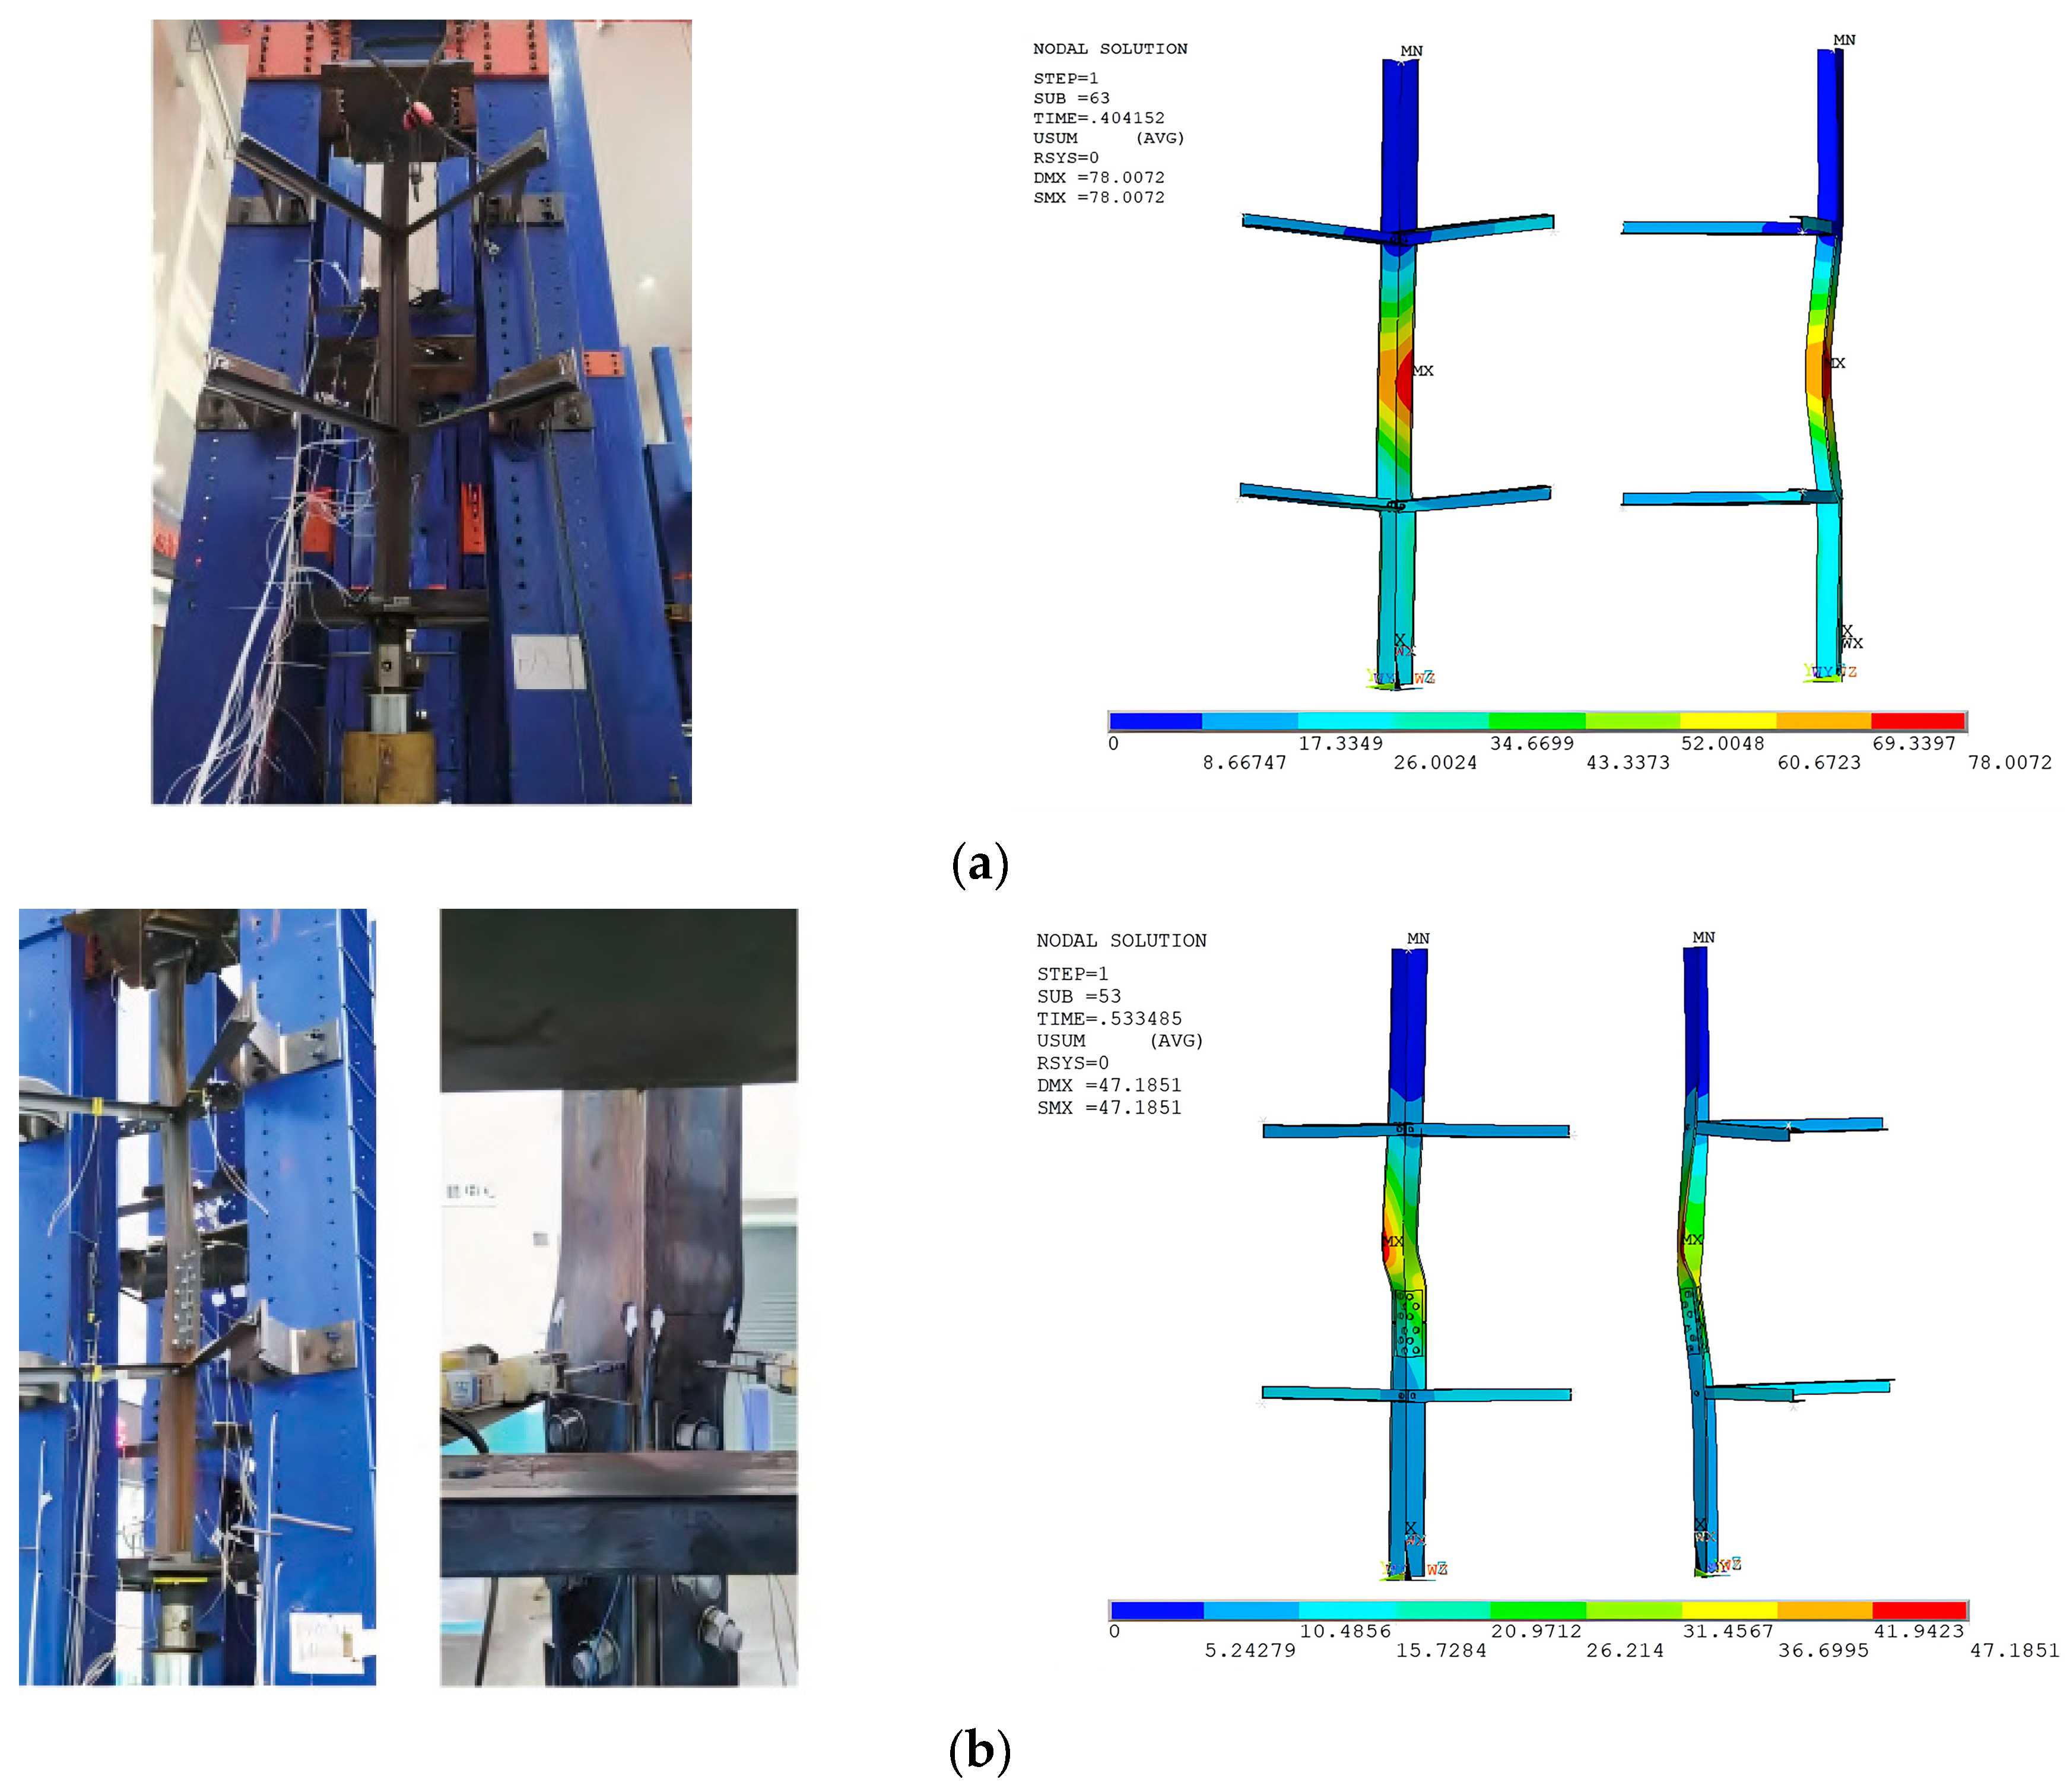
Numerical simulations are performed for all steel angles. Table 3 compares the load capacities obtained from the numerical model and experimental tests by Li et al. [33]. It can be seen from the table that the test results of steel angles are in good agreement with the numerical results, with an average error of around 5.2%. The numerical model slightly overestimates the ultimate load capacity of steel angles under axial compression. The difference between numerical and experimental load capacities might result from the differences in boundary conditions, possible loading eccentricities in the experimental test and initial defect in the specimen, whereas the finite element model represents an idealized structural member. Besides the load capacity of steel angles, the failure mode can also be obtained from the numerical model. Figure 4 shows the comparisons of experimental and numerical failure modes of steel angles under axial compression. Final failure of intact primary steel angles was caused by flexural-torsional buckling about the minor axis near the mid-height. However, the torsional deformation at the mid-span was effectively restrained by diagonal bracings [33]. For steel angles with double-shear splice connections, the dominant failure mode is characterised by flexural-torsional buckling. For steel angles with 4 or 5 bolts per leg, buckling of diagonal bracing may occur at the connection. Numerical results show that the failure modes and locations agree well with experimental observations, demonstrating the reliability of the numerical mode. Therefore, the numerical model in the present study can simulate the ultimate load capacity and failure mode of discontinuous steel angles under axial compression with reasonably good accuracy.

4. Parametric Study

4.1. Effect of Splice Steel Ratio

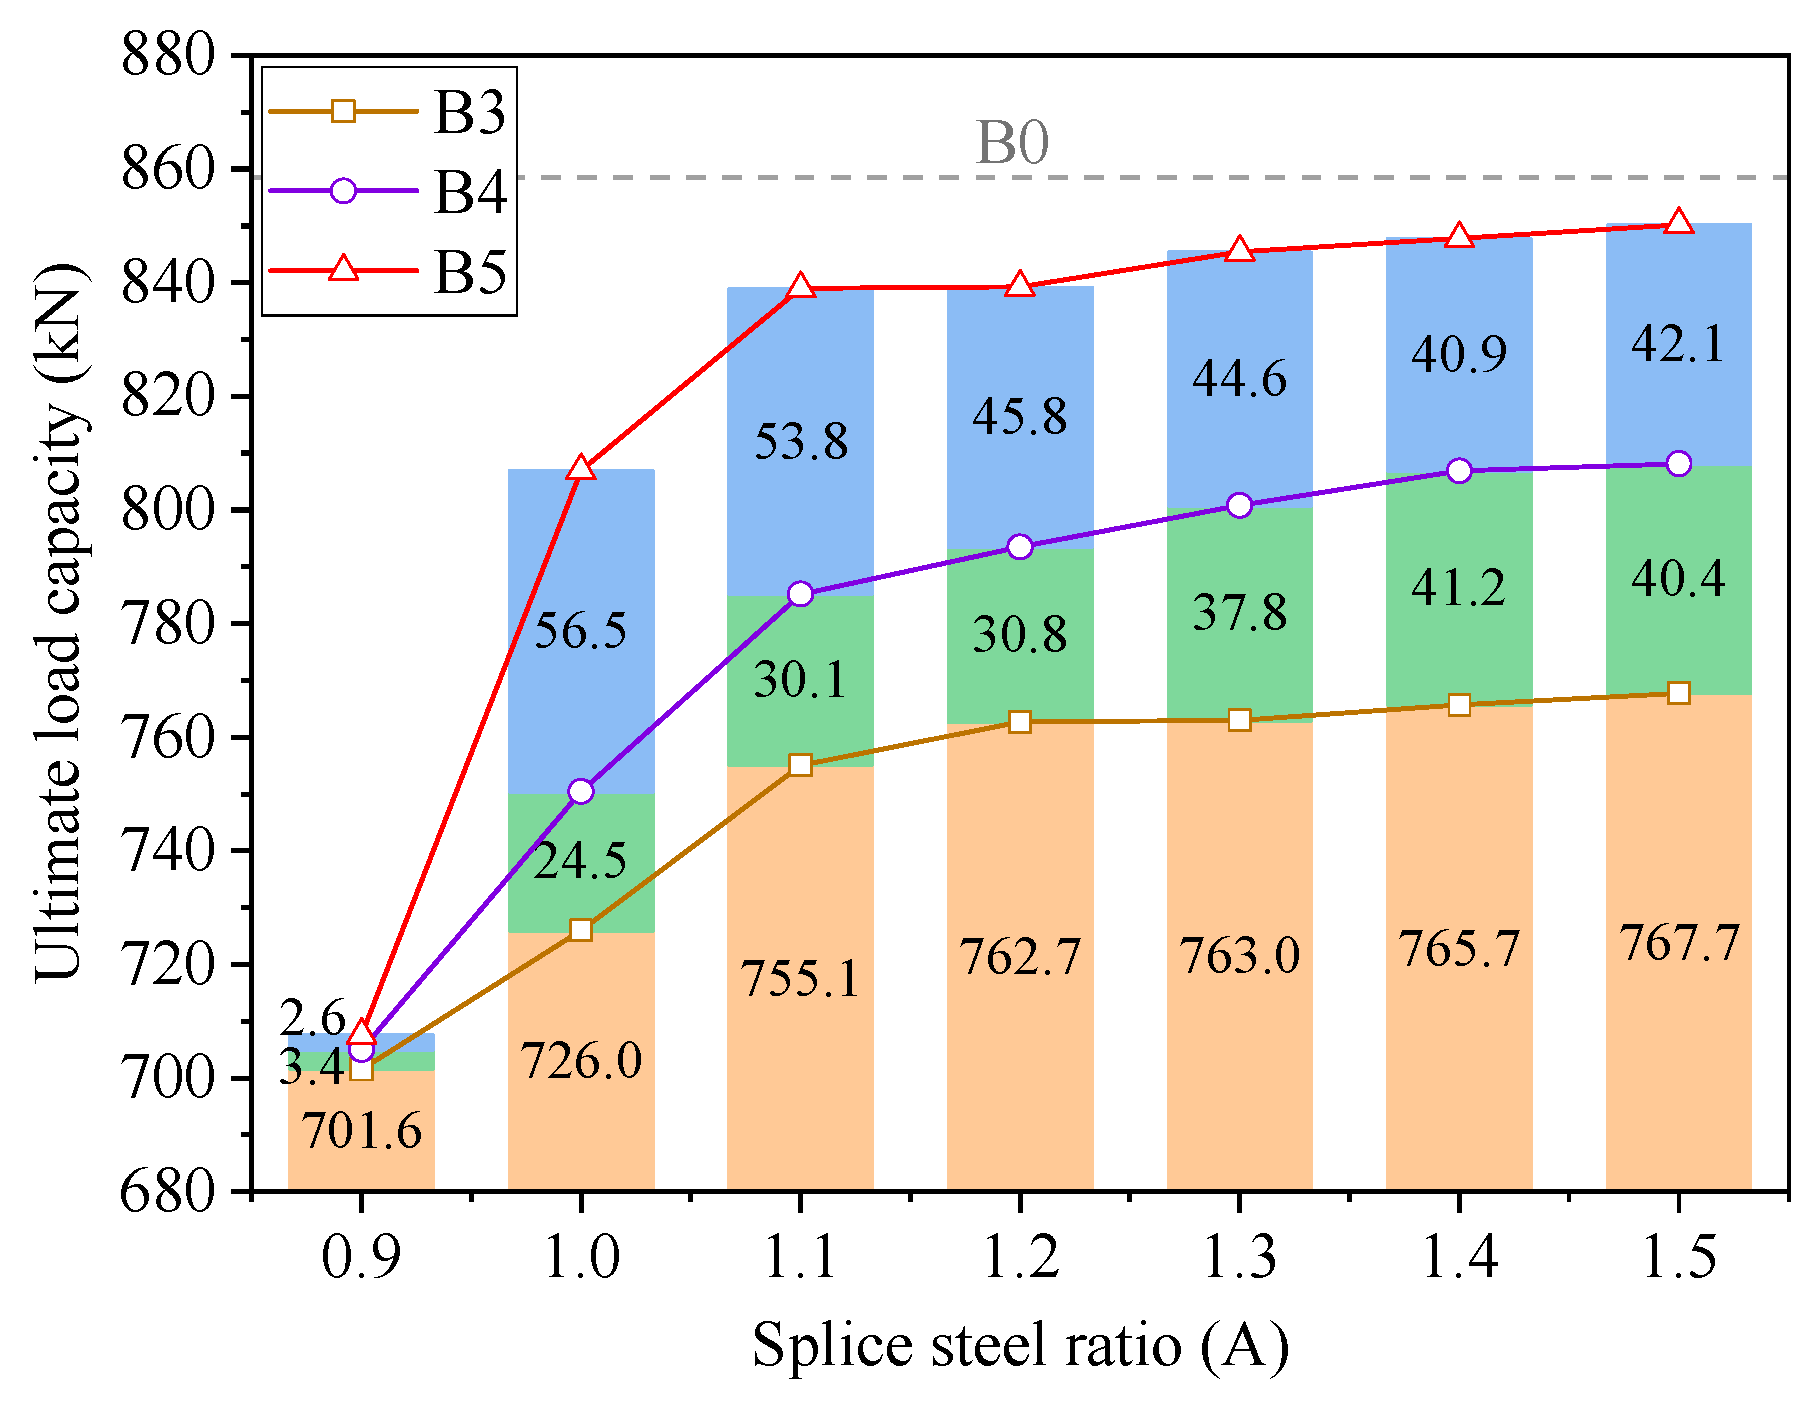
Based on the verified numerical model, the effect of splice steel ratio on compression behaviour of discontinuous steel angles is investigated using ANSYS. Figure 5 shows the ultimate load capacities obtained from the numerical model. It can be observed that all spliced specimens develop lower capacities than the intact specimen B0. Among them, specimen B5-A1.5 reached an ultimate load capacity closest to that of B0. It can also be observed that specimens with 3 to 5 bolts per leg developed considerably increased load capacities, with an average increase of approximately 12.5%, as the splice steel ratio increases from 0.9 to 1.1. However, when the splice steel ratio exceeds 1.1, its beneficial effect on load capacity becomes less significant, approximately 2.0%. Therefore, increasing the splice steel ratio within this range only marginally enhances the axial load capacity of spliced steel angles. In addition, increasing the number of bolts per leg can also lead to increases in the ultimate load capacity. This improvement is slightly influenced by the number of bolts at a splice steel ratio of 0.9, but the influence is more significant when the ratio exceeds 1.0. Notably, increasing the bolt number from 4 to 5 results in an improvement of approximately 6.0%, higher than the improvement of 4.5% achieved by increasing the bolts from 3 to 4.
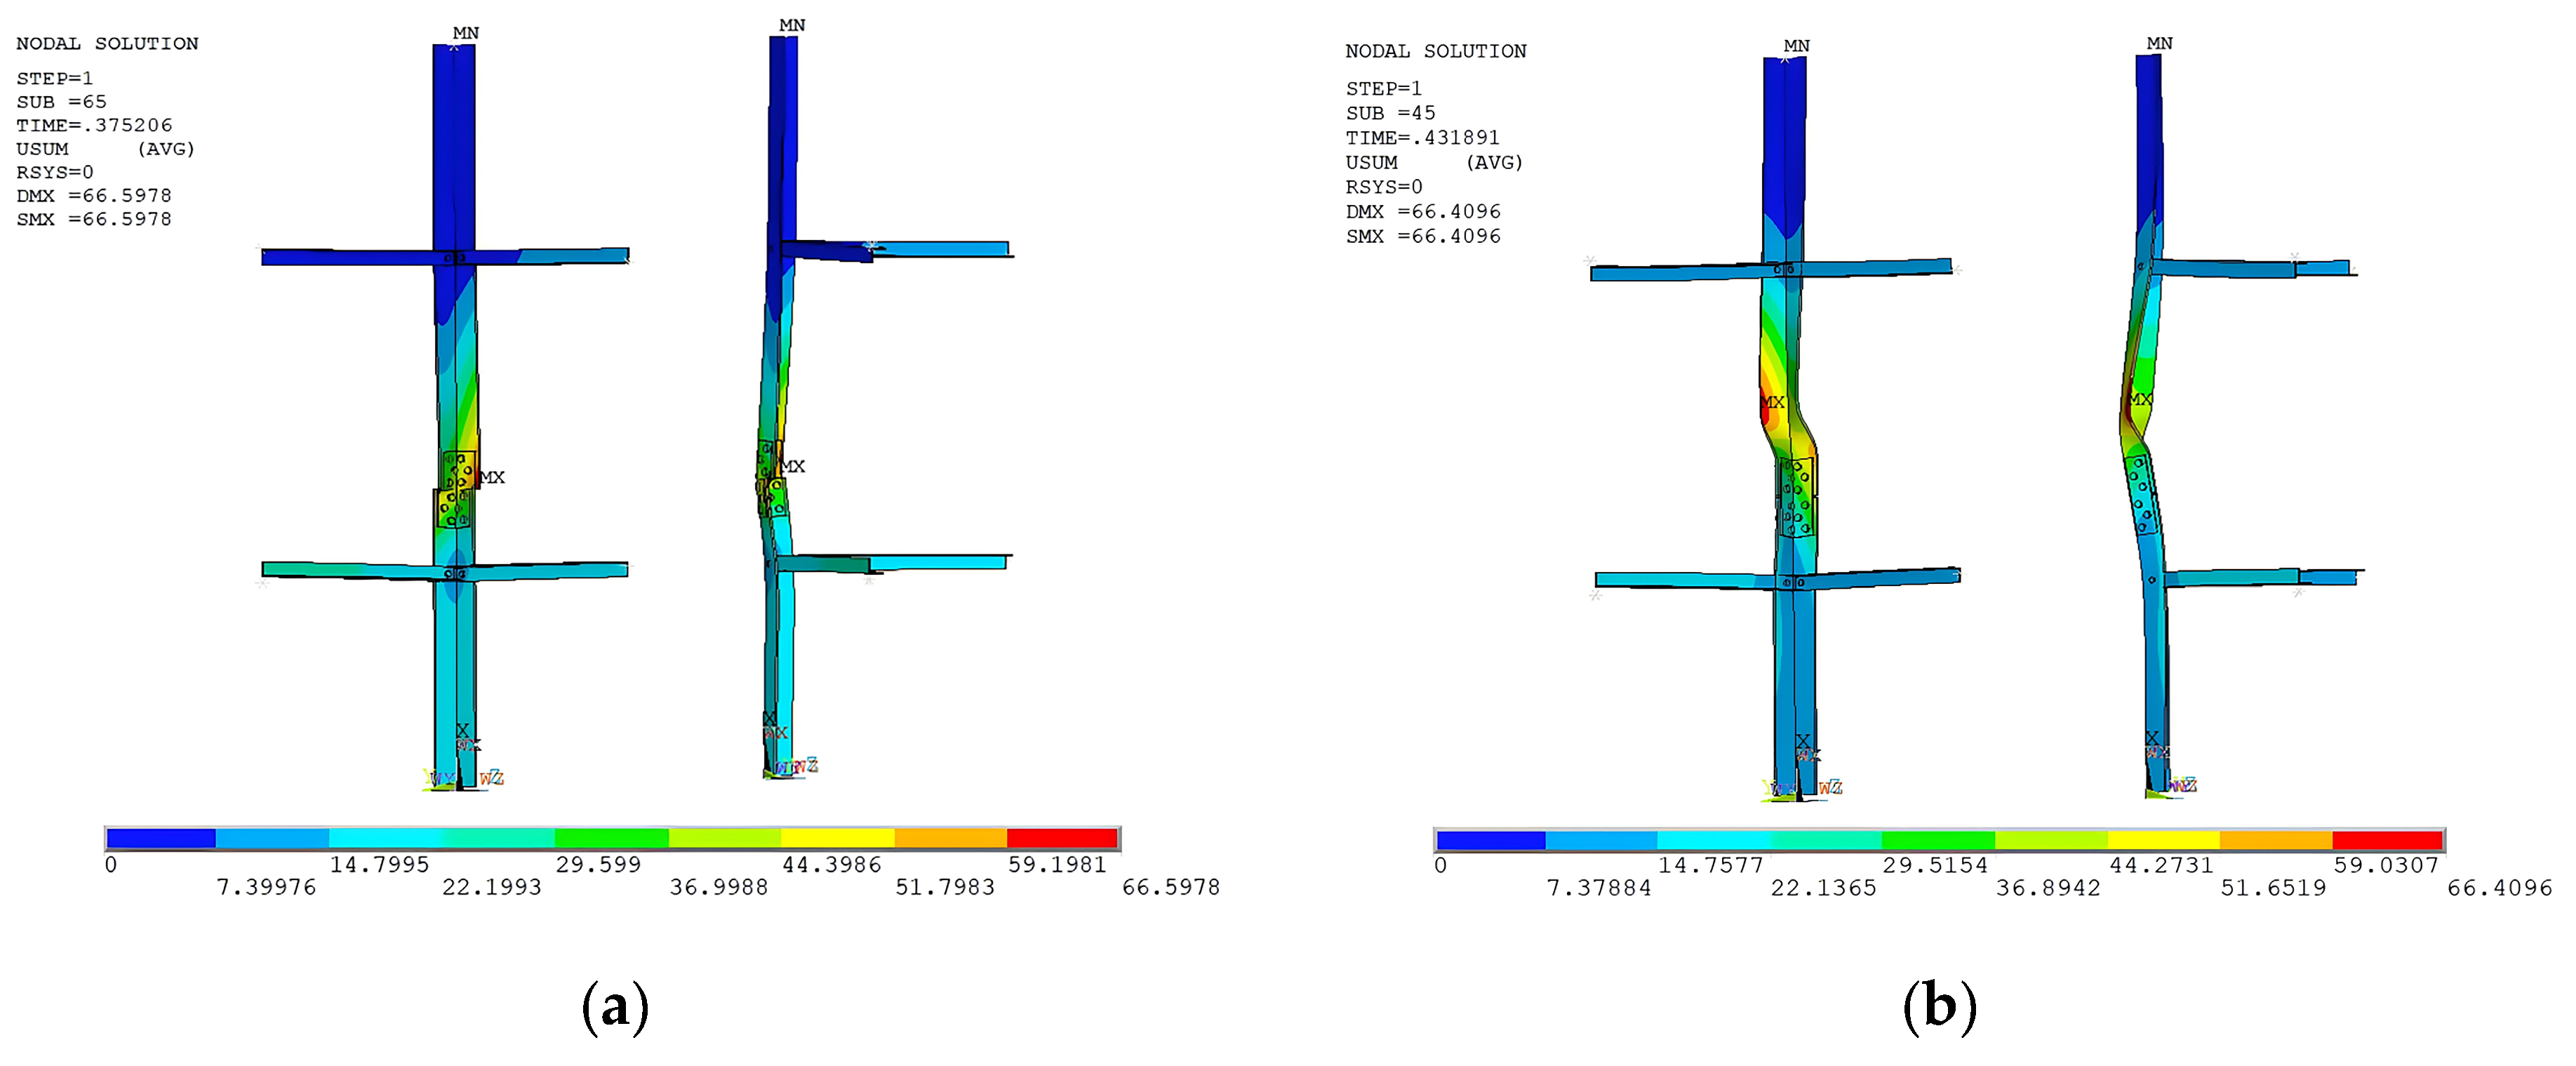
Two different failure locations can be observed from the numerical model, namely, at the mid-height and the end of main steel angles. However, only failure at the mid-height is analysed in this section as its influence on load capacity is more significant. Figure 6 illustrates the failure modes at the spliced steel with a splice steel ratio of 0.9 and at mid-height with a splice steel ratio of 1.5, respectively. It can be observed that for specimens with a splice steel ratio of 0.9 and 3, 4 or 5 bolts per leg, failure occurs within the spliced region. This failure originates from the smaller area of spliced steel and stress concentration at the discontinuity, and eventually induced failure mode under axial compression. However, the failure is moved to the mid-height when the splice steel ratio is increased to 1.5, indicating that a splice steel ratio of 1.5 enables the spliced steel angles to possess adequate strength and stiffness against buckling.

4.2. Effect of Discontinuity Location

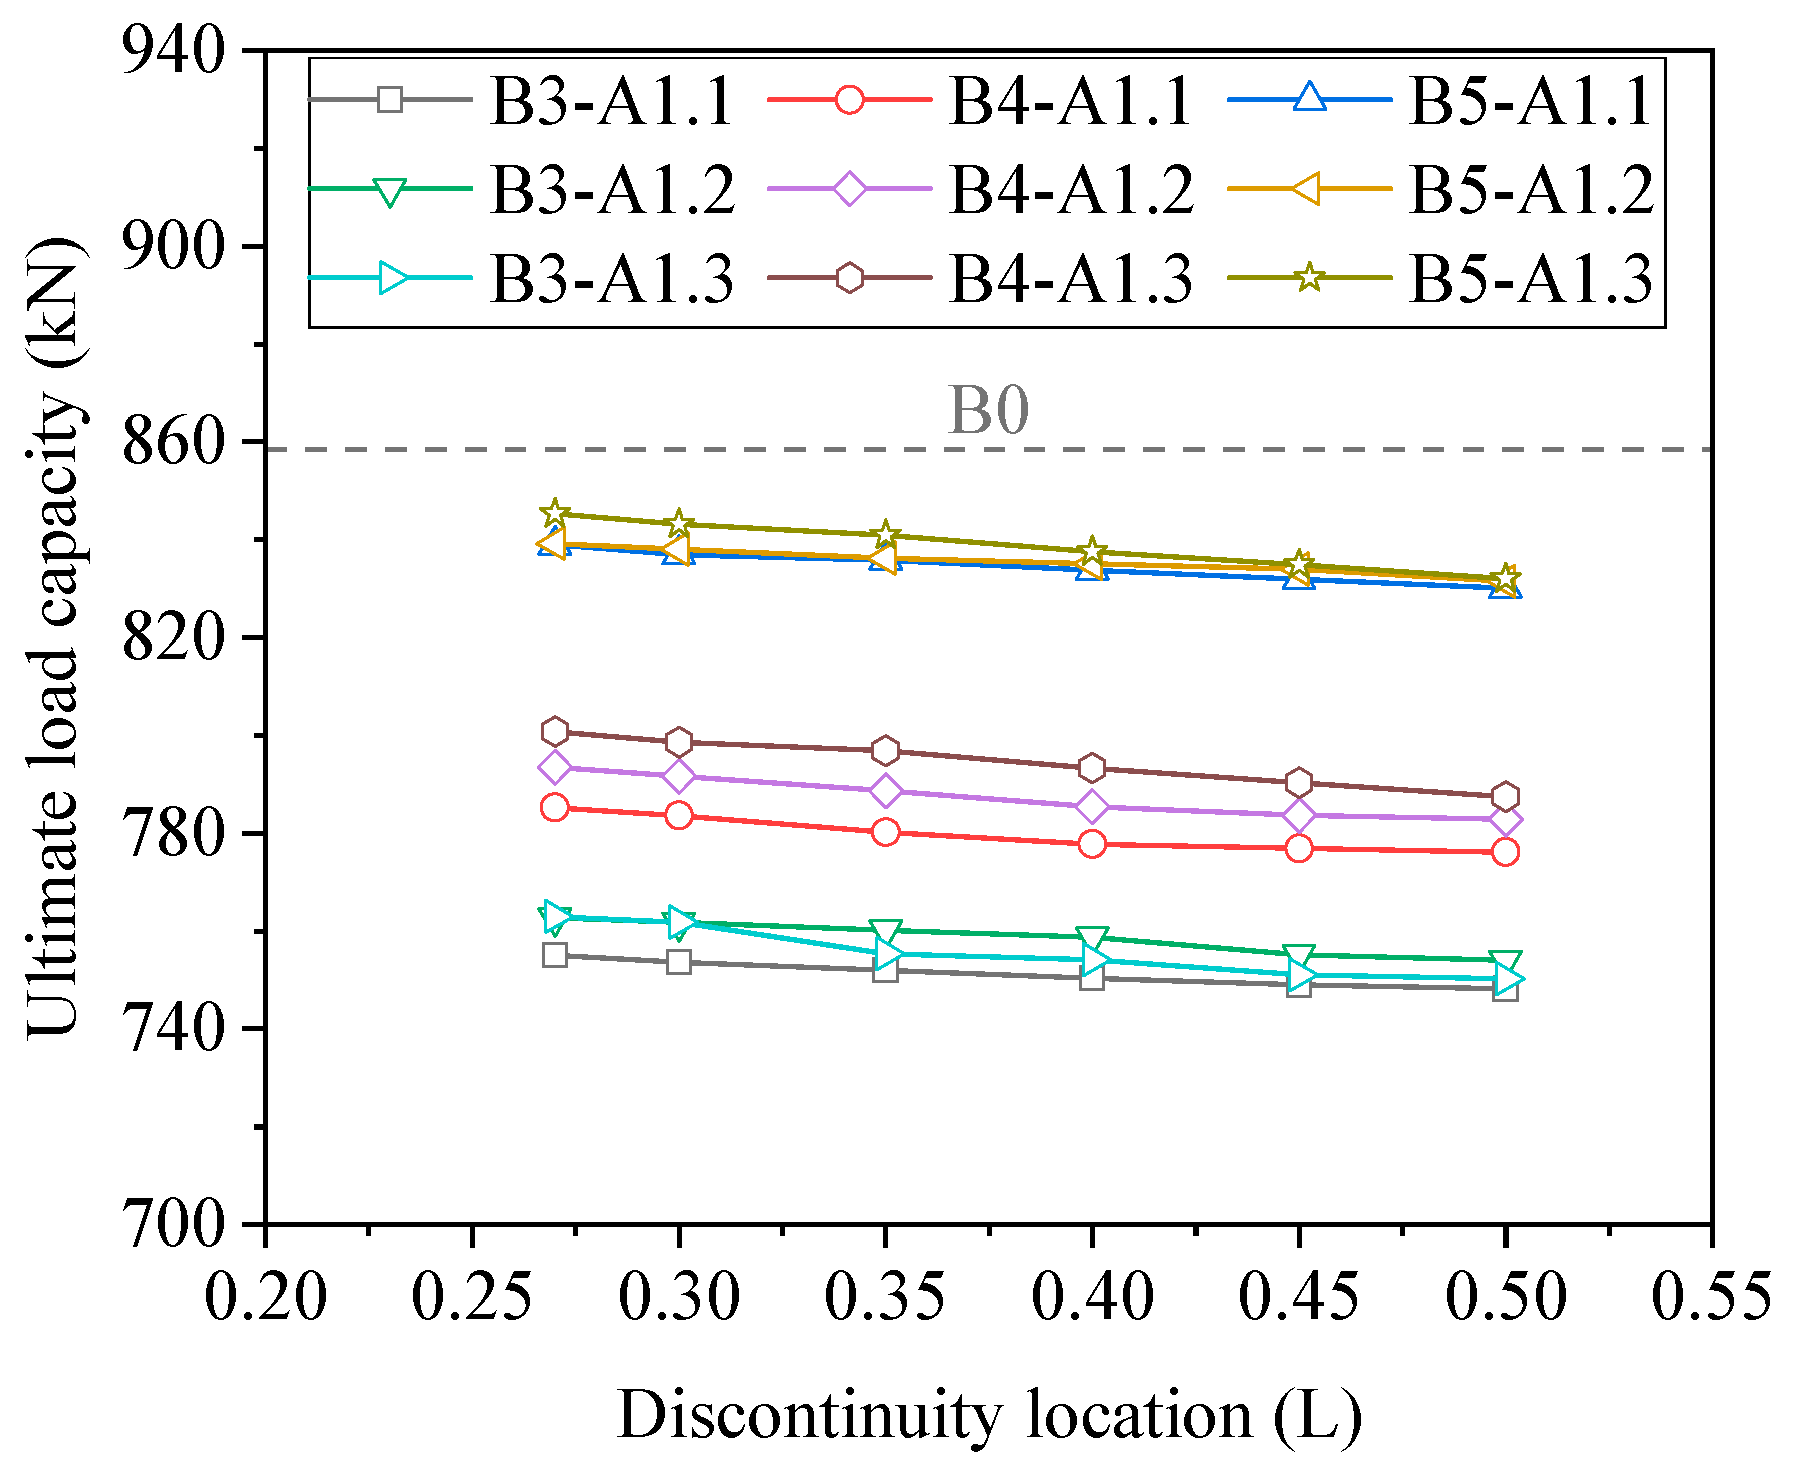
To investigate the influence of discontinuity location on load capacity, numerical simulations are conducted in which the discontinuity location increases from 0.27 L to 0.50 L measured from the bottom end. Note that L corresponds to the height of discontinuity location measured from the bottom end of the main steel angles. All parameters except the discontinuity location are kept constant in numerical models to quantify its influence on axial compression behaviour. Figure 7 shows the ultimate load capacities of main steel angles with different discontinuity locations. A general decrease in load capacity can be observed as the discontinuity location moves from the bottom end towards the mid-height, due to combined weakening effects at the discontinuity and the critical mid-span section. With increasing distance of discontinuity from the bottom end, specimens with splice steel ratios ranging from 1.1 to 1.3 exhibits decreases in load capacity from 0.6% to 1.7% Thus, the influence of discontinuity location on load capacity is insignificant.
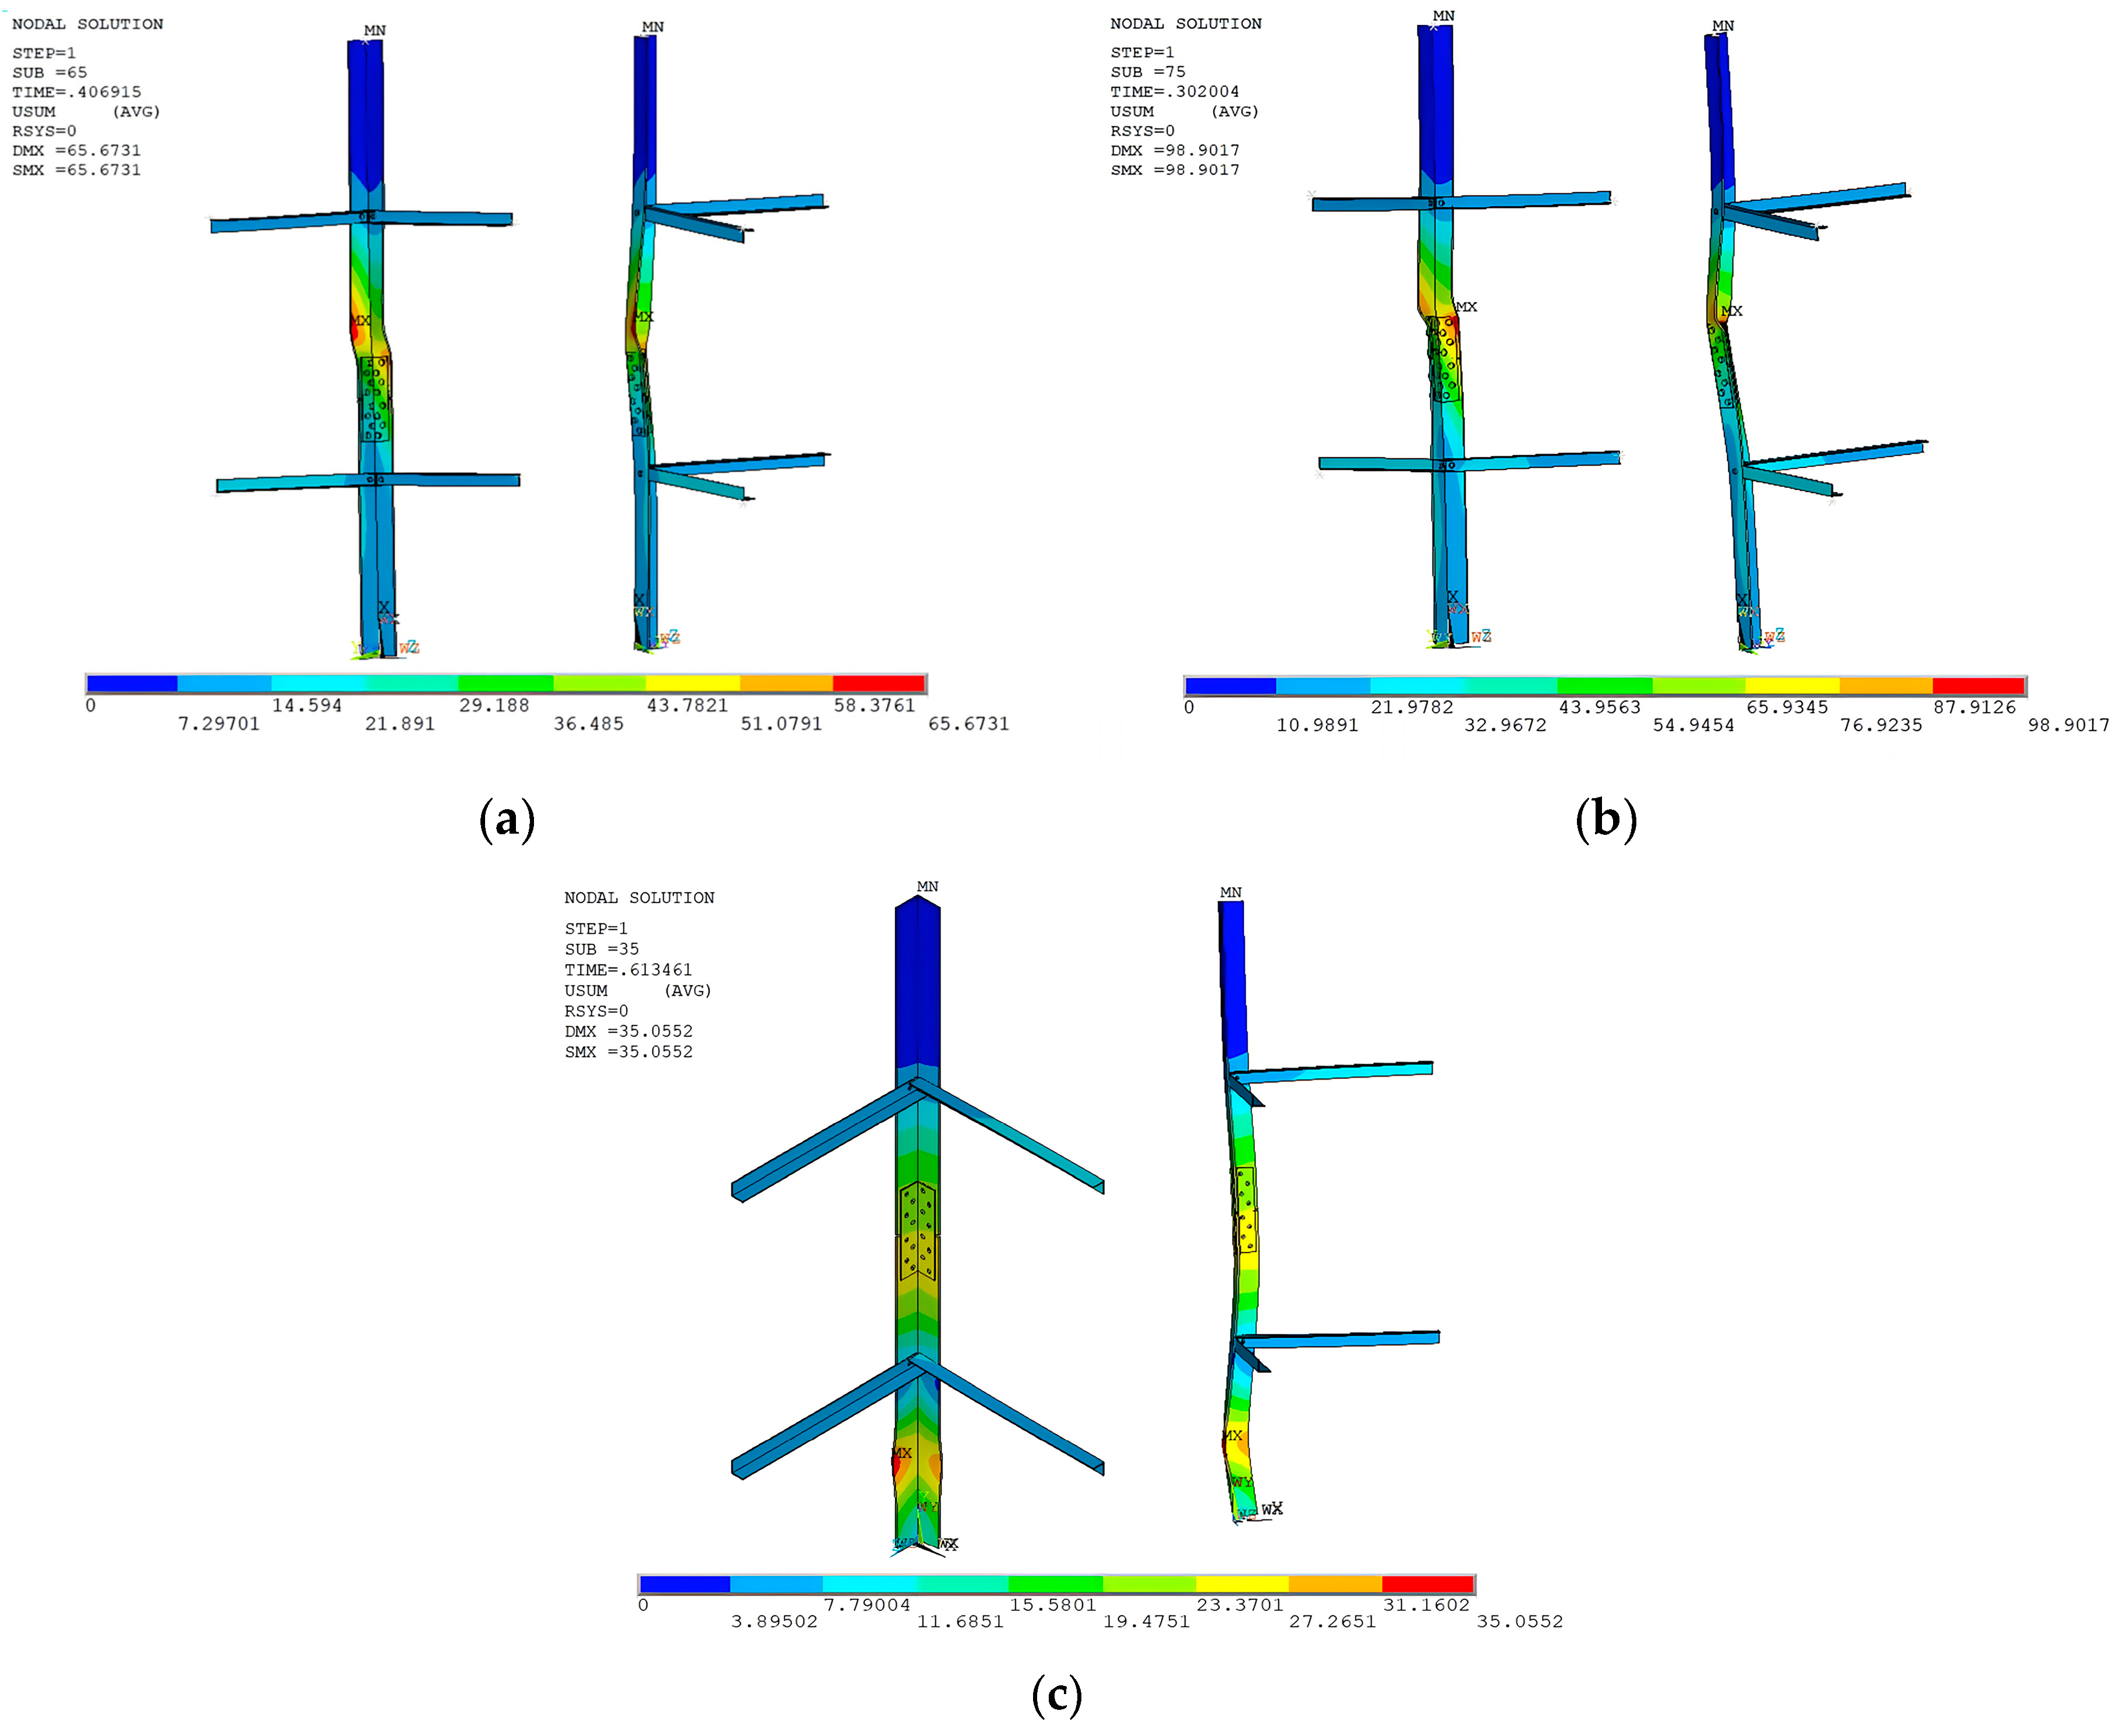
Figure 8 illustrates the failure modes of steel angles with 4 bolts per leg and a splice steel ratio of 1.1, considering discontinuity locations at 0.30 L, 0.40 L and 0.50 L. Similar failure modes are observed for specimens with various bolt numbers and splice steel ratios. When the discontinuity is positioned at 0.27 L or 0.30 L, the mid-height is not covered by spliced steel, resulting in failure at mid-height. As the discontinuity location moves towards the mid-height between 0.35 L and 0.45 L, the spliced steel strengthens the central section, causing failure to be relocated to the end of spliced steel. It should be noted that, when the discontinuity is located at the mid-height, the specimen exhibits minor torsional deformations followed by localised flexural-torsional buckling within the extended section, due to the symmetric configuration about the discontinuity.

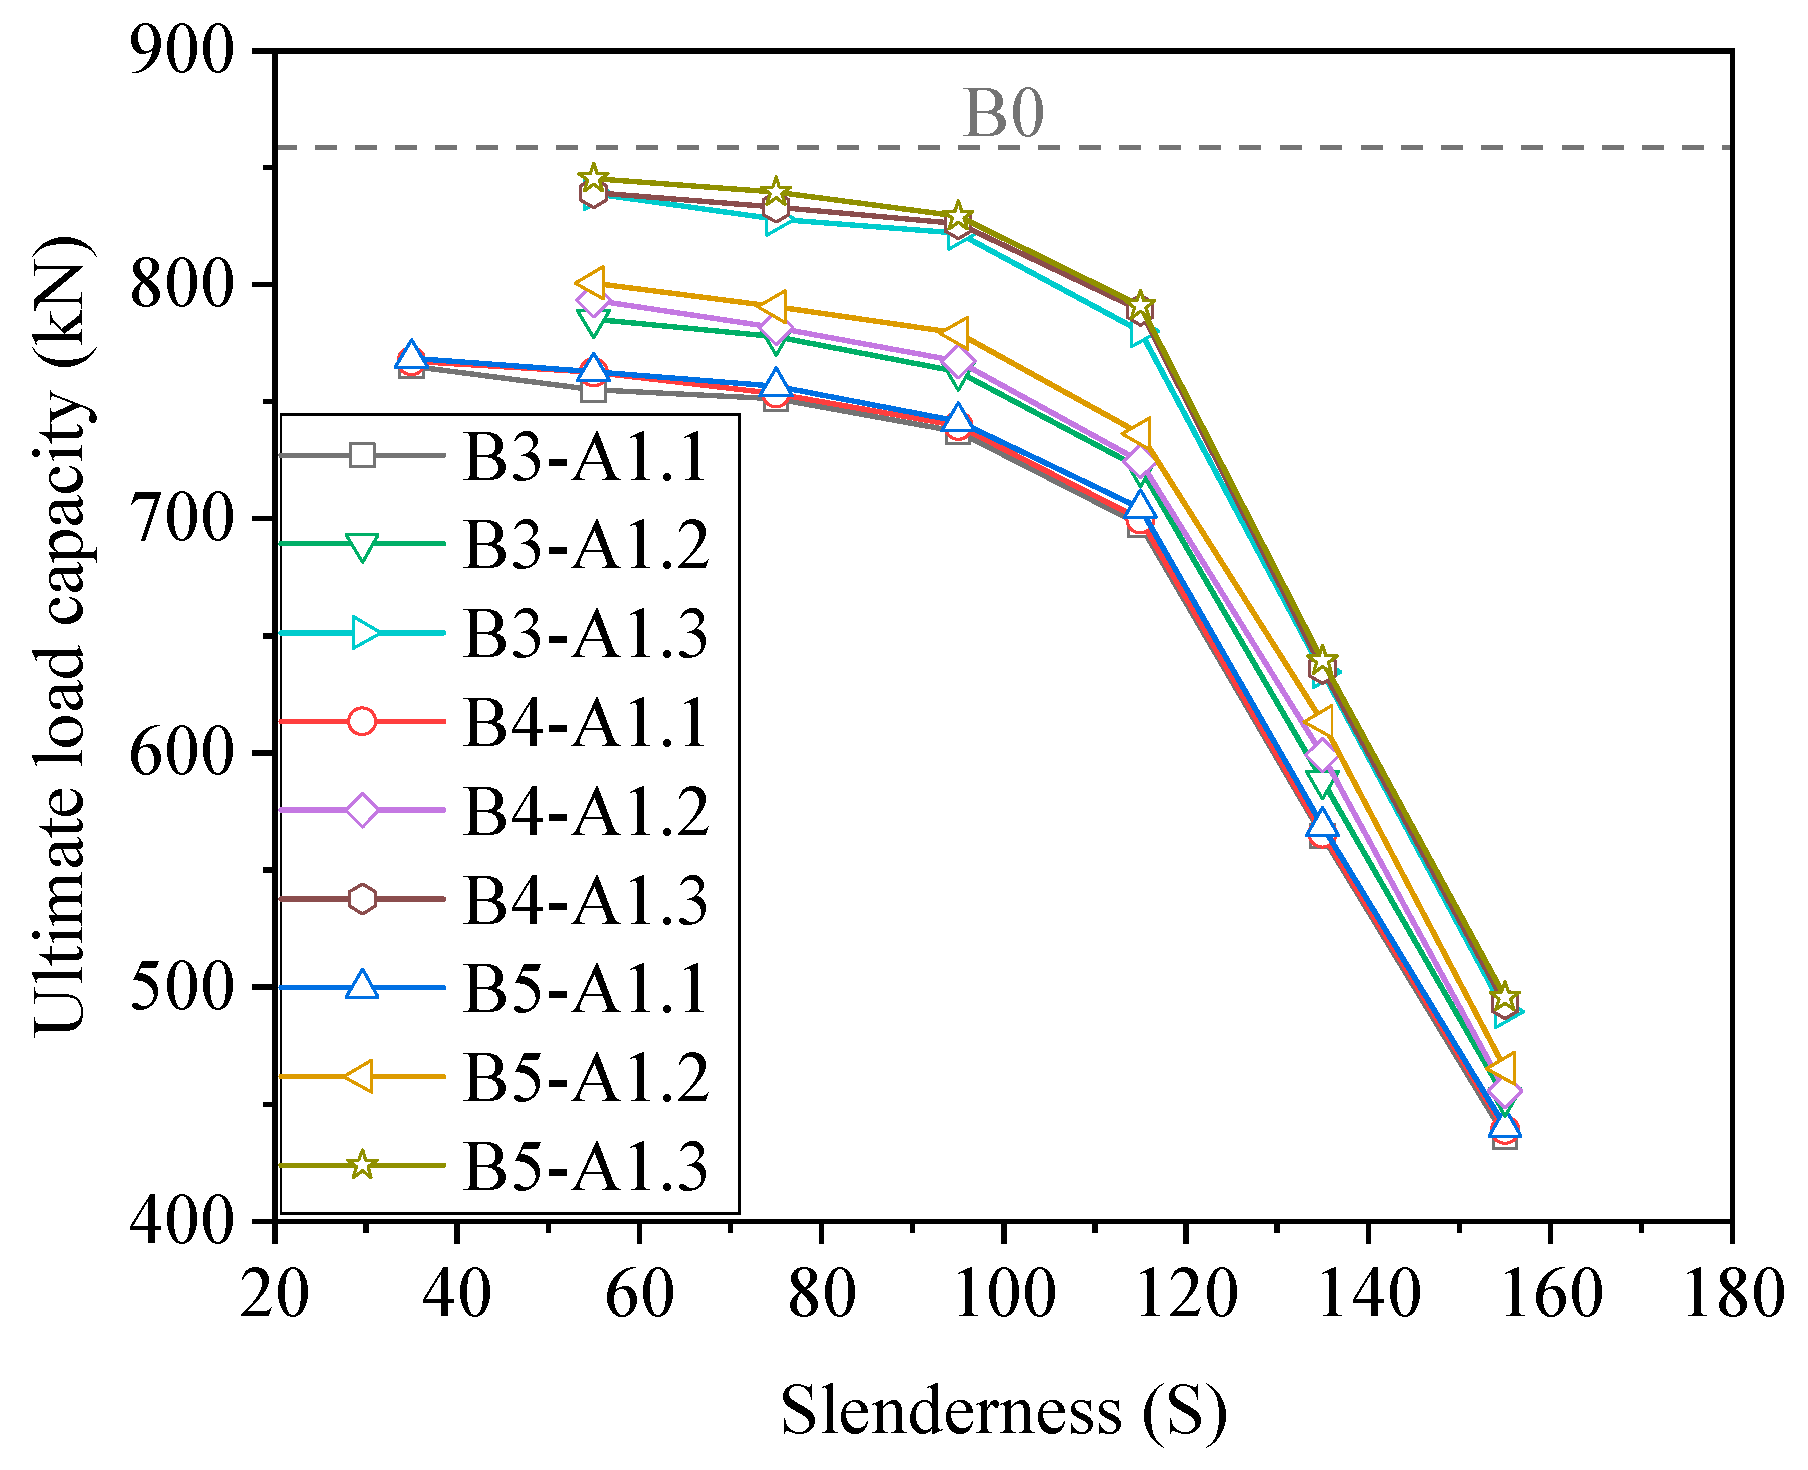
4.3. Effect of Slenderness Ratio

In this section, the slenderness ratio is increased from 35 to 155, whereas all other parameters such as the dimensions of steel angles are remained the same. Figure 9 shows the effect of slenderness ratio on the axial compression load capacity of specimens. All specimens exhibit a significant reduction in ultimate load capacity as slenderness ratio increases from 35 to 155. Specimens with 5 bolts per leg can achieve the highest load capacity in the group of the same slenderness. Numerical results indicate that the slenderness ratio less than 115 minimally influences the load capacity of spliced steel angles, and the load capacity decreases by approximately 7.8% on average. When the slenderness ratio exceeds 115, the load capacity decreases substantially by 37.3% on average as the ratio increased to 155. Specimen B5-A1.2 shows the most significant decrease of 6.0% in the slenderness ratio ranging from 55 to 115 and the largest reduction of 37.6% in the slenderness ratio ranging from 115 to 155.
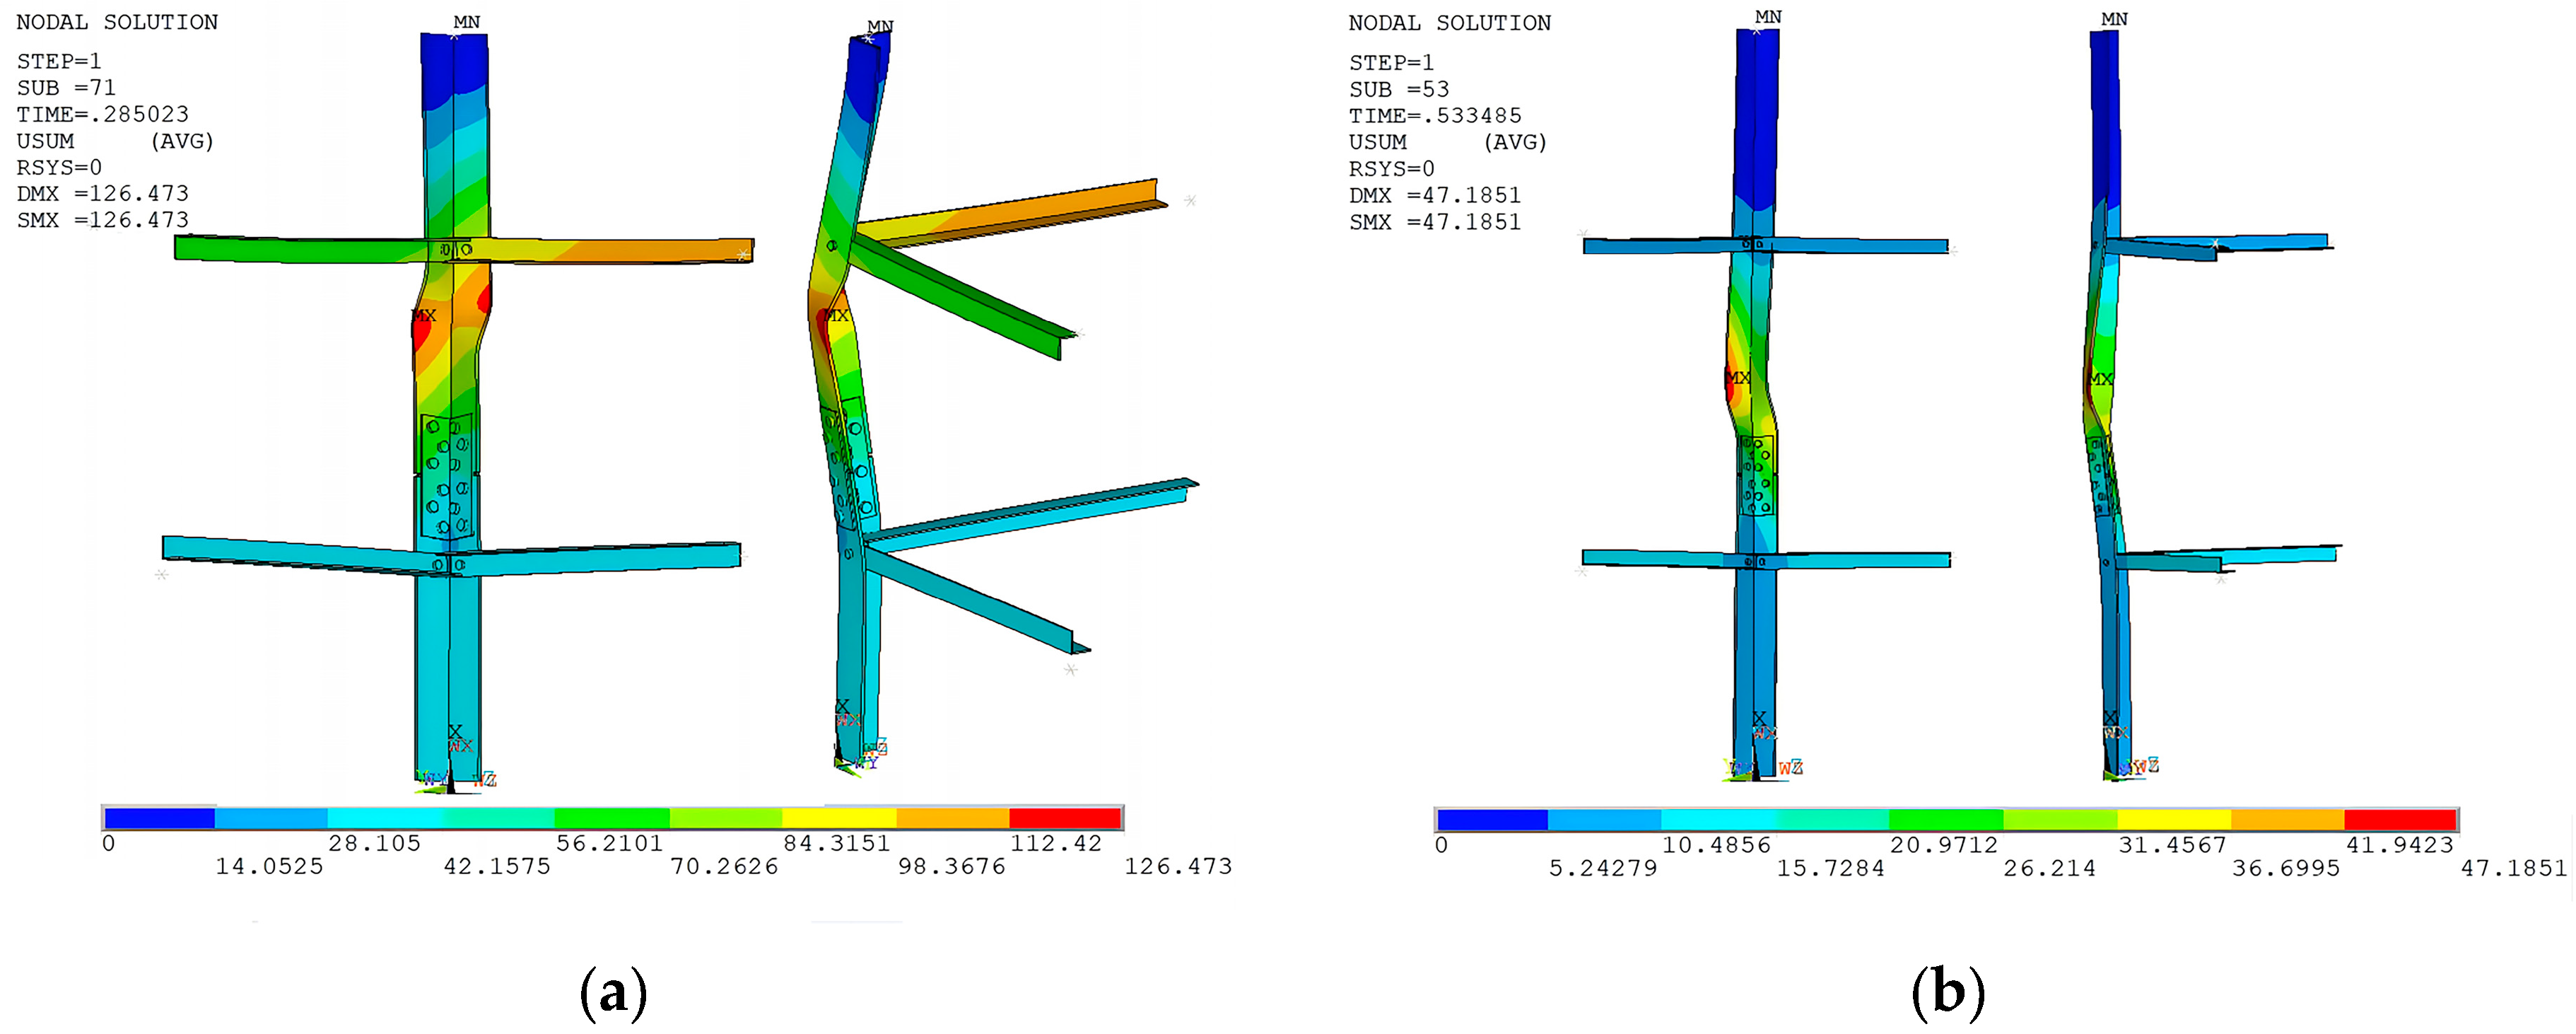
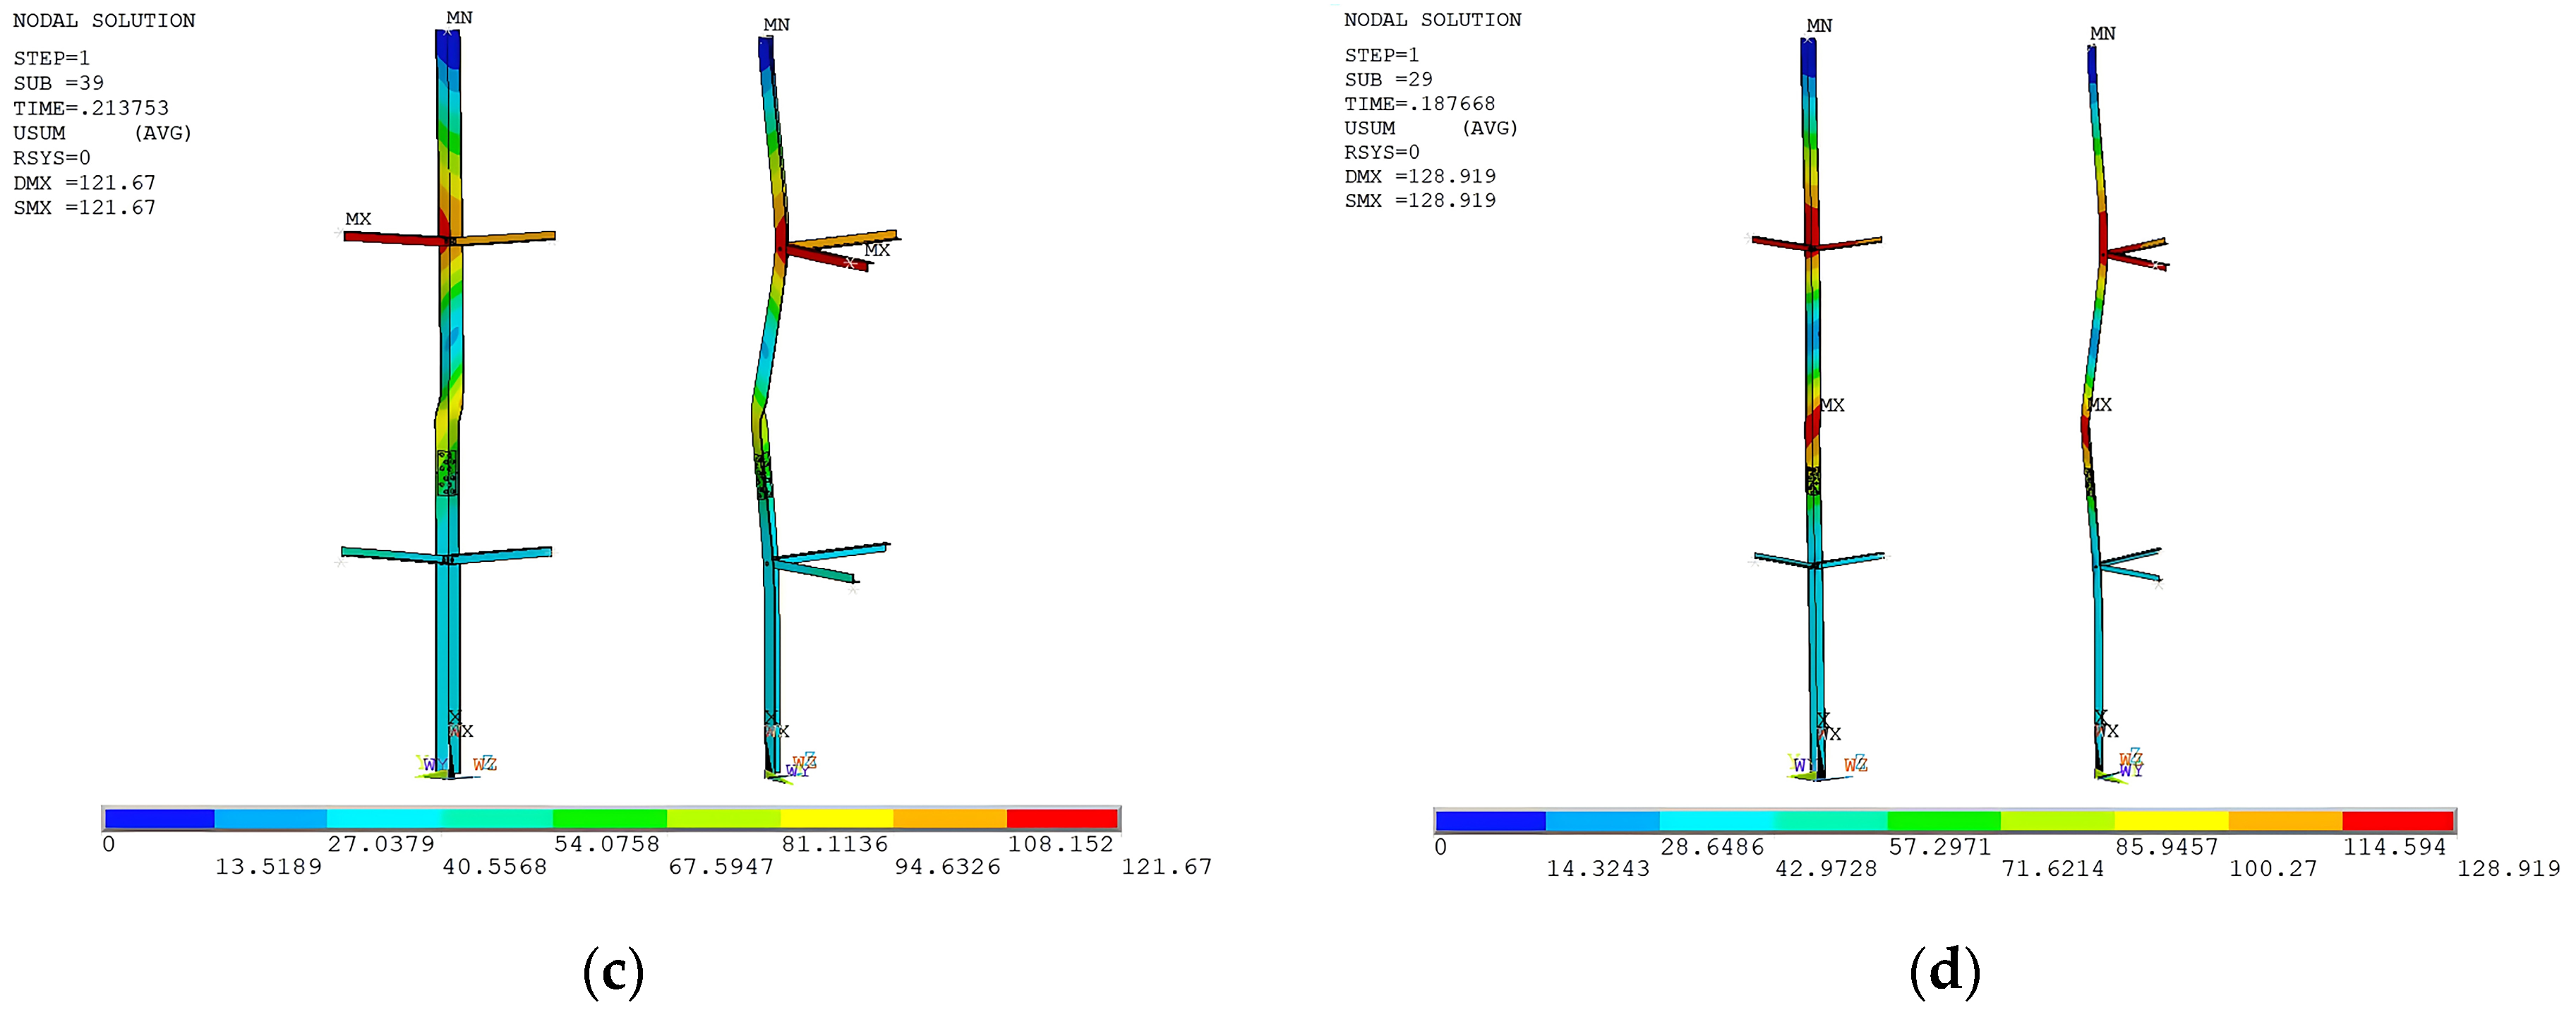
Figure 10 shows the failure mode of specimens with different slenderness ratios. Figure 10a–c exhibit a combined failure mode of flexural-torsional and local buckling, whereas the member in Figure 10d fails only in flexural-torsional buckling. In the designation, S represents the slenderness ratio, defining as the segment length between diagonal members divided by the minimum radius of gyration of the cross-section. It can be found that specimens with slenderness ratios below 95 fails in flexural-torsional buckling and local buckling near the mid-height. In contract, substantial out-of-plane deformations can be observed for specimens with slenderness ratios greater than 115, and final failure results from flexural-torsional buckling. As the slenderness ratio increases from 55 to 155, the failure mode shifts from a combination of flexural-torsional buckling and local buckling to flexural-torsional buckling at the critical slenderness ratio of 115. This phenomenon can be attributed to the low flexural stiffness of slender members leading to flexural-torsional buckling failure due to global instability and amplified second-order effects, whereas stocky members fail in local and flexural-torsional buckling resulting from insufficient local stability and subsequent stress redistribution.

4.4. Effect of Width-to-Thickness Ratio

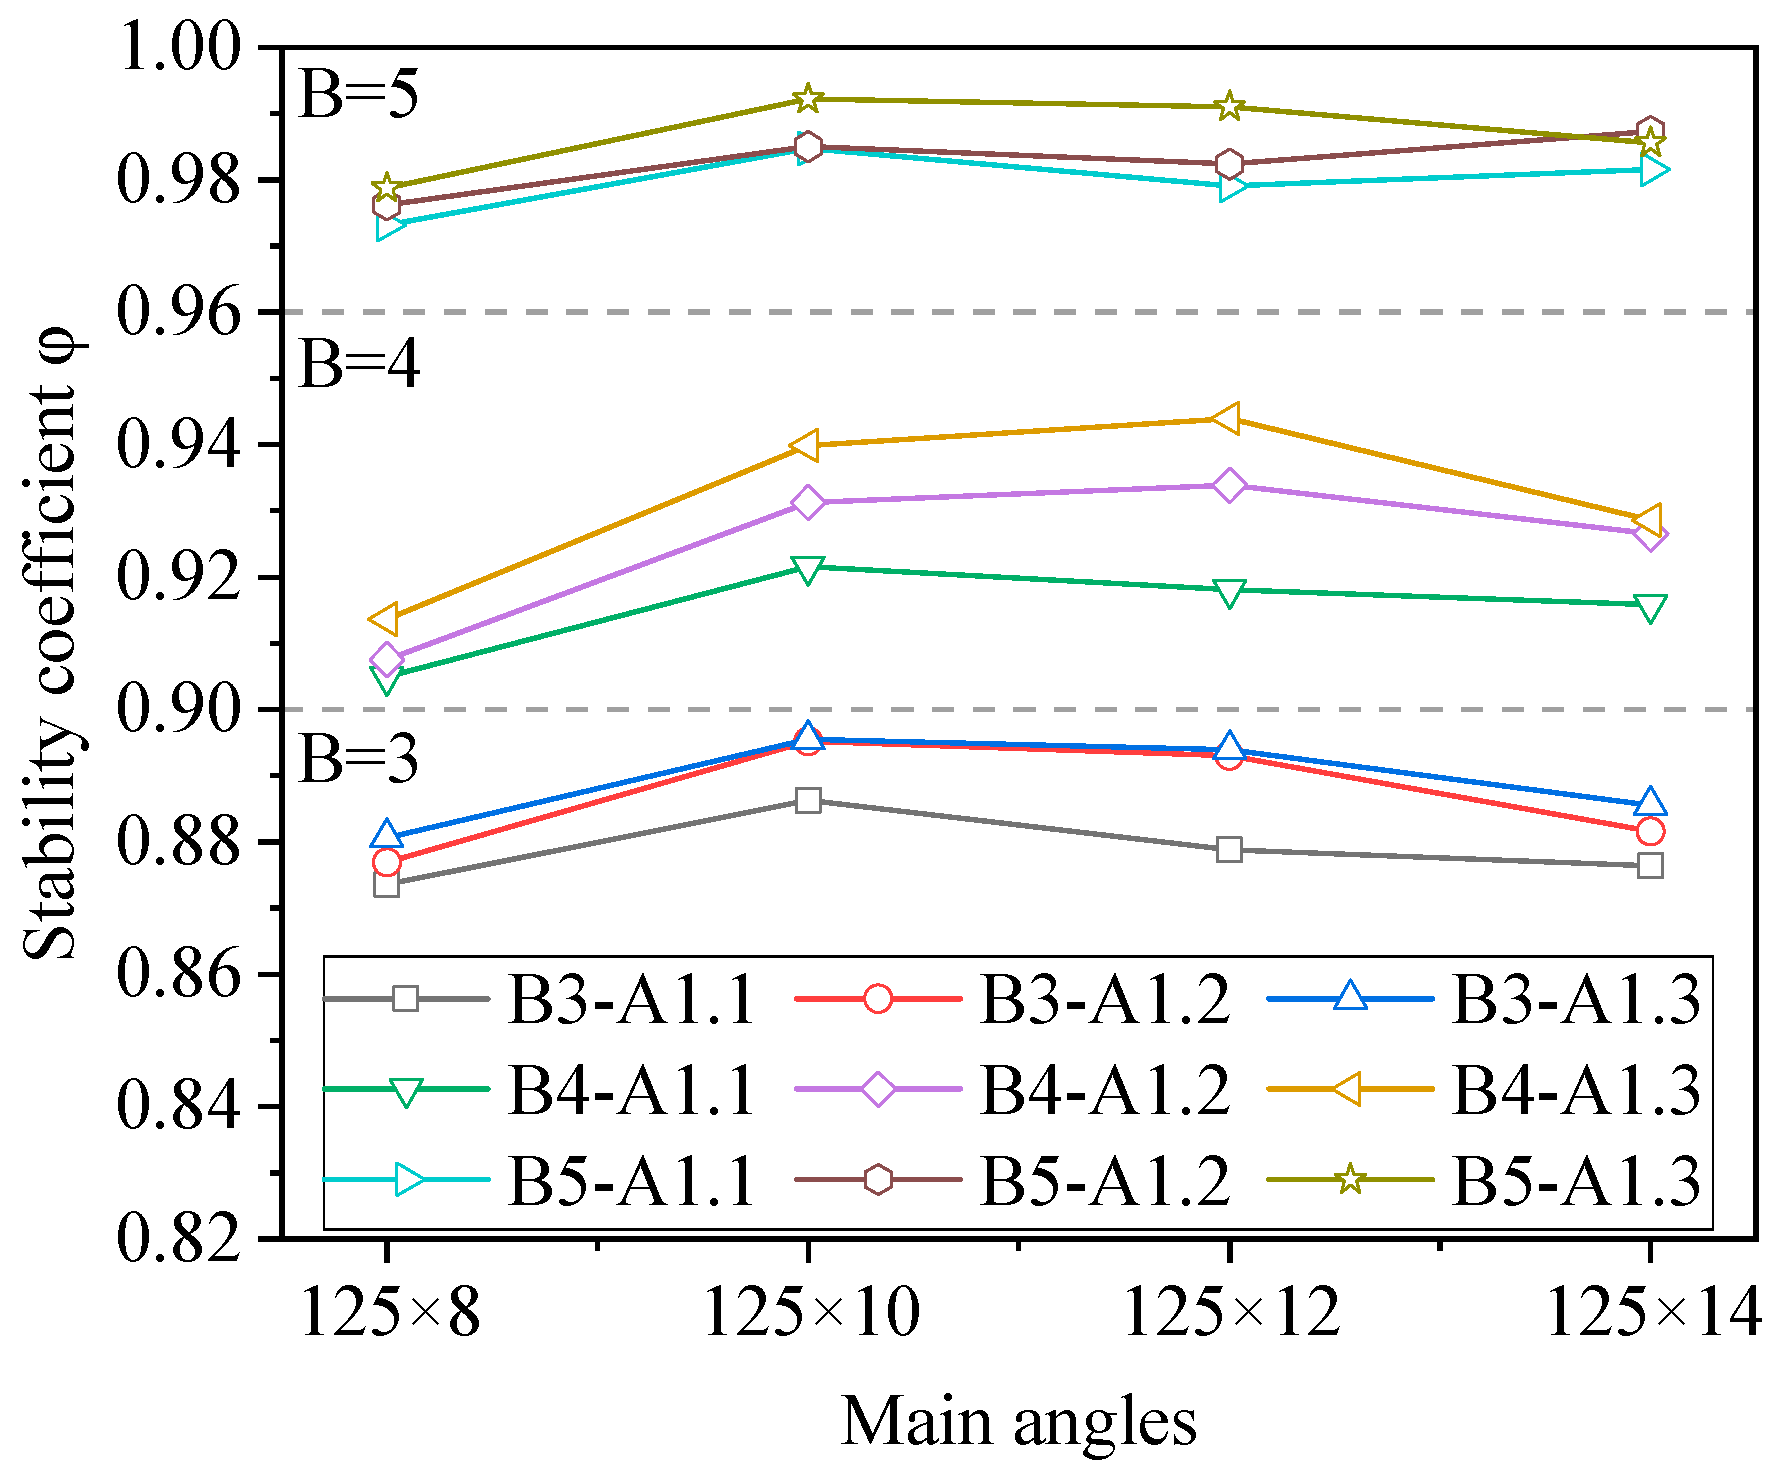
The validated numerical model is also used to investigate the influence of width-to-thickness ratio of steel angles on load capacity. In the simulation, all other parameters are kept constant, and four equal-leg angles L125 × 8, L125 × 10, L125 × 12 and L125 × 14 are selected, corresponding to width-to-thickness ratios of 15.6, 12.5, 10.4, 8.9, respectively. The stability coefficient φ for axial compression is calculated using Equation (1), as suggested in GB 50017-2017 [35]. Simulated results show that the variation of width-to-thickness ratio does not have a significant effect on the failure mode of steel angles, but a larger ratio reduces the stability coefficient due to local deformations at the leg.
φ = N f y A
where N is the axial compressive load, A is the gross cross-sectional area of steel angles, and f y is the yield strength of steel angles.
Figure 11 shows the influence of width-to-thickness ratio on stability coefficient φ of specimens under axial compression. It can be observed that there are no significant differences in the stability coefficient φ of specimens with different cross-sections. For steel angles L125 × 8 with splice steel ratios of 1.1, 1.2 or 1.3, the stability coefficient is lower than that of intact specimen B0 with L125 × 10. It indicates that a higher width-to-thickness ratio of L125 × 8 can facilitate the development of flexural-torsional buckling failure. The increase of cross-sections from L125 × 8 to L125 × 14, which reduces the width-to-thickness ratio of the steel angles from 15.6 to 8.9, leads to an average increase of about 1.2% in the stability coefficient. For specimens with 4 bolts per leg, enlarging the cross-sectional dimensions results in an appropriately 3.0% increase in stability coefficient φ . Specimens with either 3 or 5 bolts per leg exhibit negligible variations in the stability coefficient φ due to cross-sectional changes. Section L125 × 8, which has the maximum width-to-thickness ratio of 15.6 among these four sections, consistently attains a lower stability coefficient φ compared to other sections under identical conditions due to its susceptibility to local buckling. When splice steel ratio is increased to 1.3, stability coefficient φ exhibits an increase of approximately 1.0%, becoming slightly higher than those observed at lower splice steel ratios. It indicates that increasing the splice steel ratio enhances the stability coefficient φ for steel angles with different width-to-thickness ratios, thereby improving corresponding load capacity.

5. Design Methods for Discontinuous Steel Angles

5.1. Stability Coefficient

The stability of steel angle under axial compression can be calculated from Equation (2), as suggested in GB 50017-2017 [35].
N φ A f 1.0
where φ denotes the buckling coefficient, which can be determined based on the slenderness λ of steel angles, and f represents the yield strength of steel angles.
The axial compression stability of steel angles with double-shear splice connections cannot be accurately evaluated using Equation (2), as it does not explicitly consider the effect of discontinuity of steel angles. Parametric studies using the numerical model reveal that the main parameters governing the stability of discontinuous steel angles include the number of bolts per leg, splice steel ratio, discontinuity location, and slenderness ratio. Based on the results of the parametric study, failure occurs at the splice steel of discontinuous location for splice steel ratio below 1.0, but it is shifted to the mid-height of the main steel angles when the splice steel ratio exceeds 1.0. Therefore, the splice steel ratio is set to exceed 1.0 to ensure that failure initiates at the main steel angles. Due to the significant influence of the mid-height discontinuity on failure mode, the discontinuity is positioned below the mid-height to avoid failure. The stability coefficient φ for discontinuous steel angles can be expressed in Equation (3).
φ = φ ( b , a , r , λ )
where b , a , r , λ denote the number of bolts per leg, the splice steel ratio, the ratio of discontinuity location measured from the bottom end of the main steel angles and the slenderness ratio, respectively.
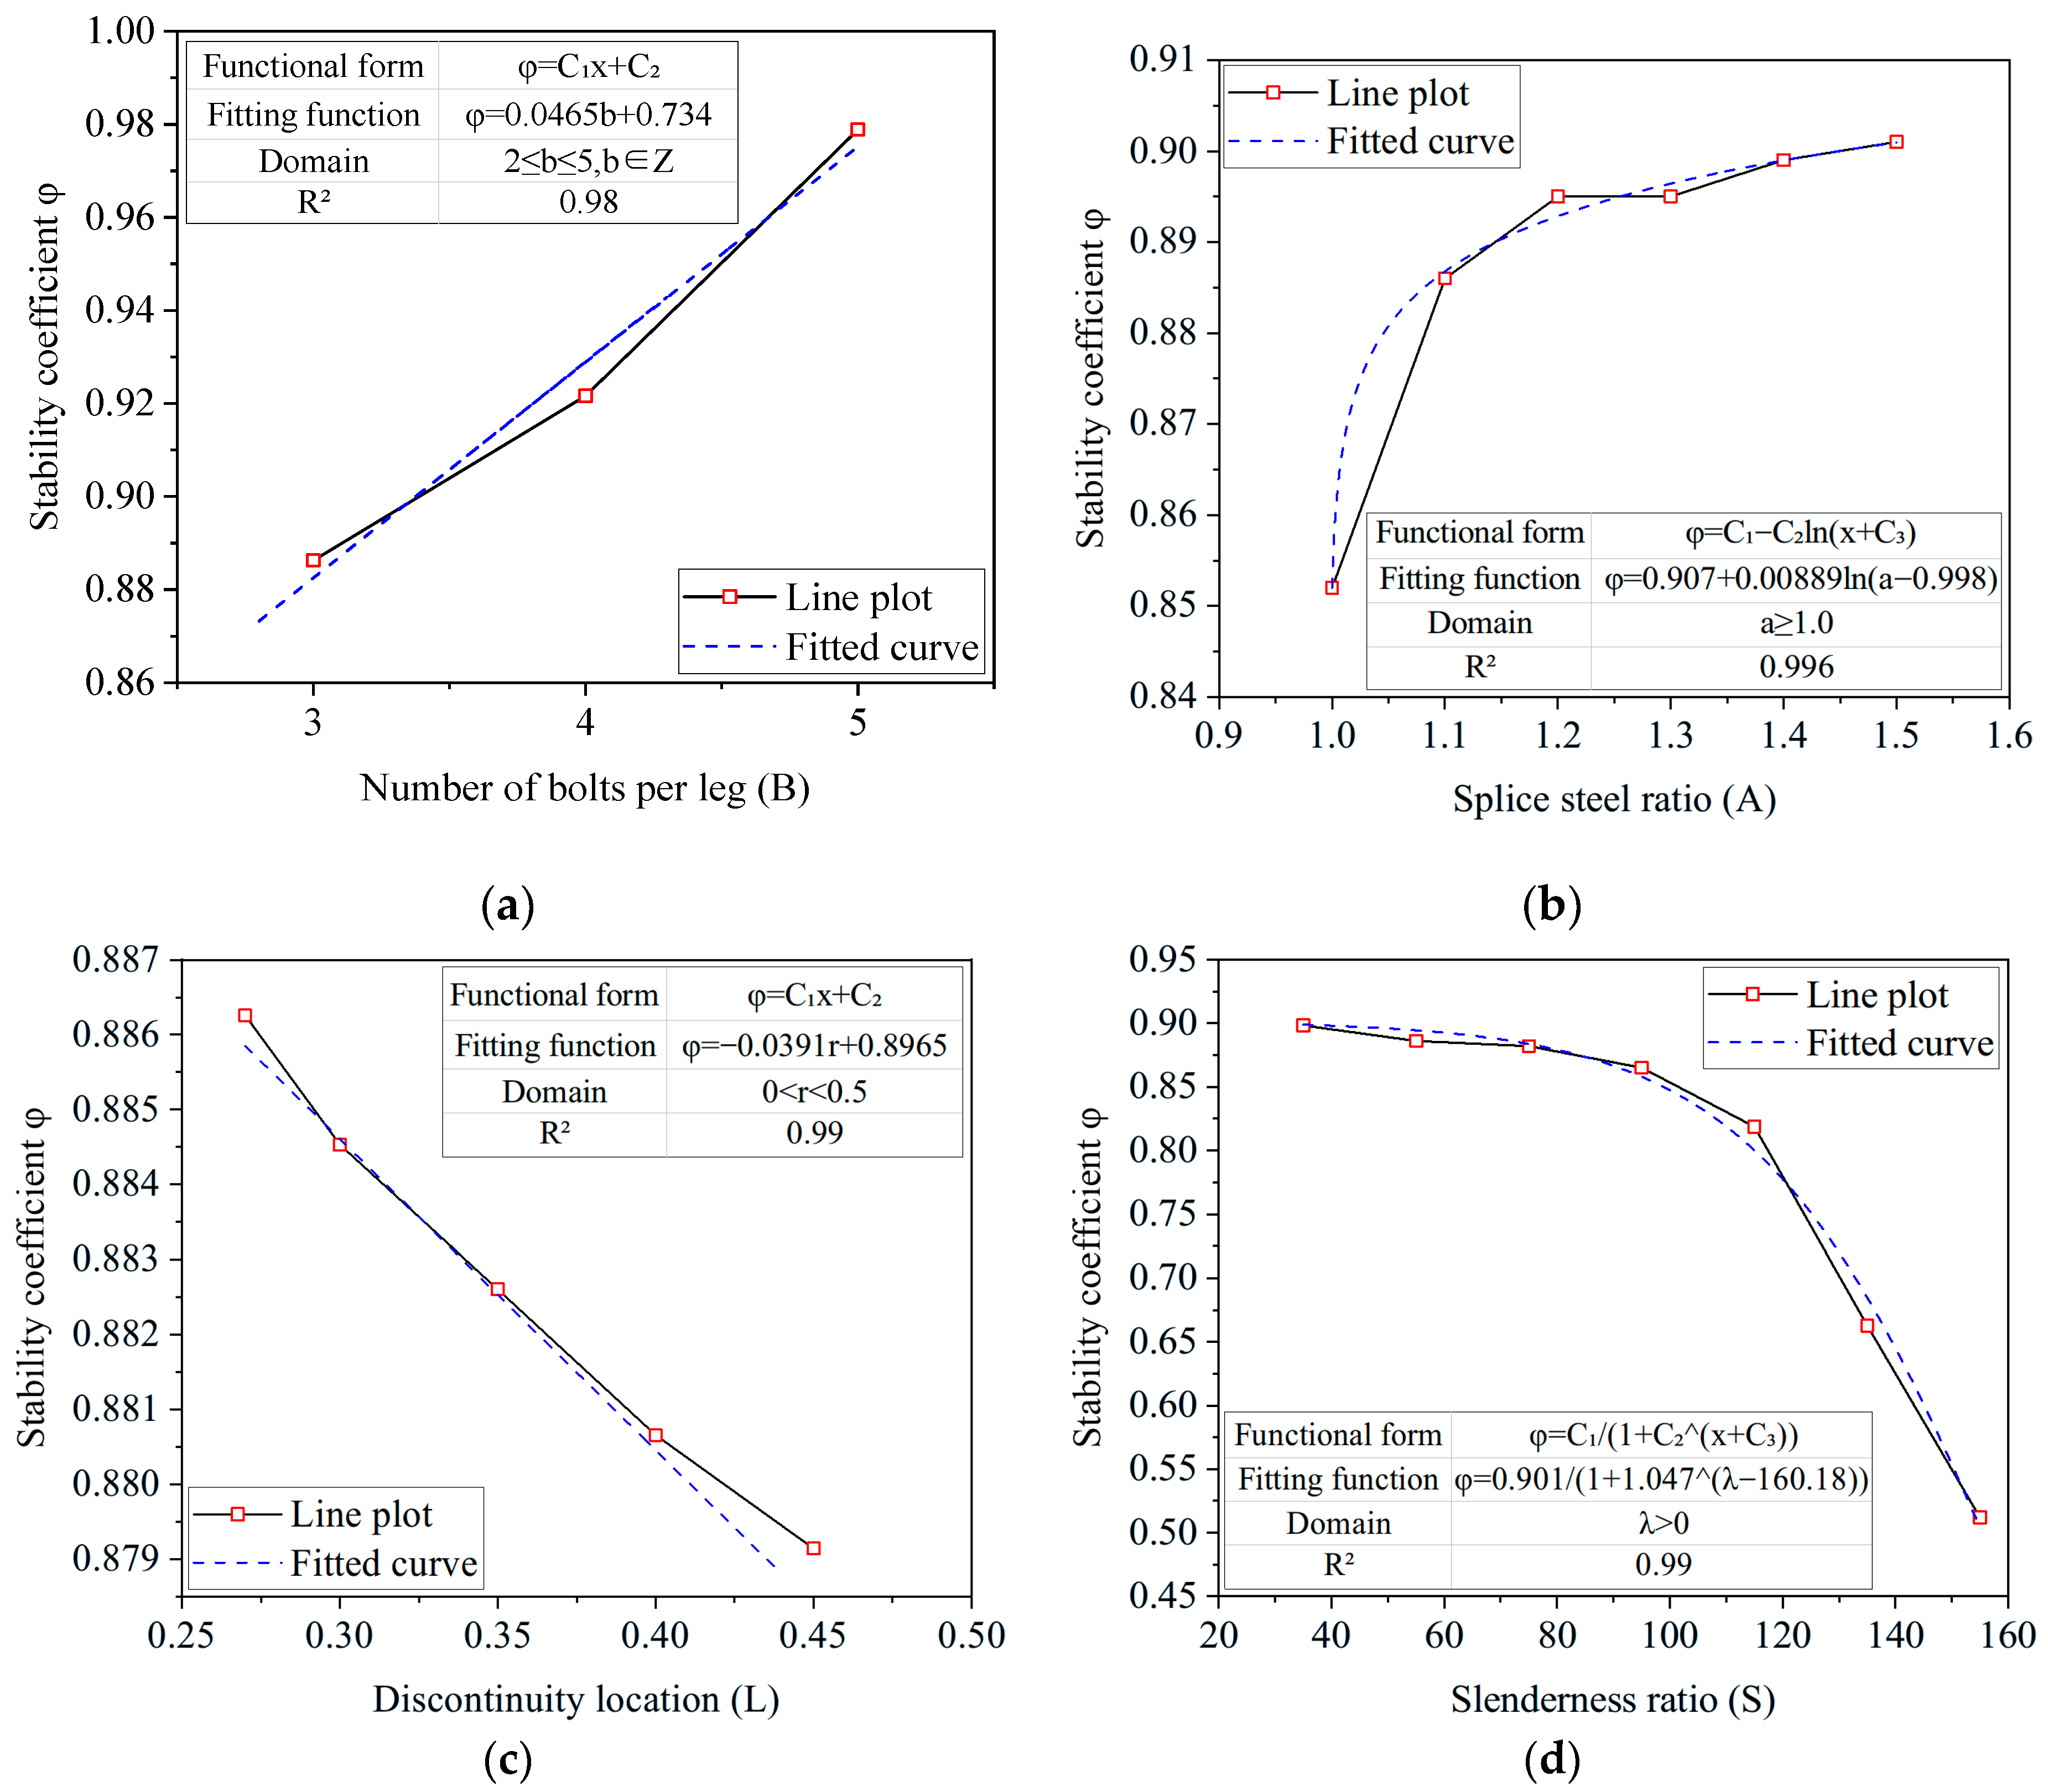
Table 4 shows the numerical results of discontinuous steel angles with different parameters. The stability coefficient φ is then correlated with each parameter individually using the least squares method. The resulting regression curves and fitting functions are presented in Figure 12, respectively.
φ B = 0.0465 b + 0.734 , 2 b 5 , b Z
φ A = 0.907 + 0.00889 ln ( a 0.998 ) , a 1.0
φ L = 0.0391 r + 0.8965 , 0 < r < 0.5
φ λ = 0.901 1 + 1.047 ( λ 160.18 ) , λ > 0
The fitting curves and corresponding domains for the number of bolts per leg, splice steel ratio, discontinuity location, and slenderness ratio are presented in Equations (4) – (7). In the equation, φ B , φ A , φ L , φ λ are the stability coefficients corresponding to the aforementioned parameters, respectively.
The basic formula of high-dimensional model representation (HDMR) [36,37] and factorized high dimensional model representation (FHDMR) [38,39] are given in Equation (8) and Equation (9), respectively. Based on HDMR, cut-HDMR model [40,41] and FHDMR, a univariate multiplicative dimensional reduction approximation model is derived, as expressed in Equation (10). In the equation, g i ( Θ i ) denotes the individual effect of Θ i , g i 1 , i 2 , , i n ( Θ i 1 , Θ i 2 , , Θ i n ) represents the joint influence of Θ i 1 through Θ i n . The empirical relationship of the stability coefficient φ in axially compressed main steel angles with discontinuities is formulated in Equation (11), where φ ( θ c ) represents the stability coefficient of the reference point, and thus φ ( θ c ) = 0.886 . The detailed equation for evaluating its stability capacity is shown in Equation (12), derived by substituting Equation (11) into Equation (2).
Z ( Θ ) = g 0 + i = 1 n g i ( Θ i ) + 1 i 1 < i 2 n g i 1 i 2 ( Θ i 1 , Θ i 2 ) + + 1 i 1 < i 2 < i n g i 1 i 2 n ( Θ i 1 , Θ i 2 , , Θ i n ) + + g 1 , 2 , , n ( Θ 1 , Θ 2 , , Θ n )
g ( Θ ) = r 0 [ i = 1 N ( 1 + r i ( Θ i ) ) ] [ 1 i 1 < i 2 N N ( 1 + r i 1 i 2 ( Θ i 1 , Θ i 2 ) ) ] × × [ 1 i 1 < i 2 < < i m N N ( 1 + r i 1 i 2 i m ( Θ i 1 , Θ i 2 , , Θ i m ) ) ] × × [ 1 + r 1 , 2 , , N ( Θ 1 , Θ 2 , , Θ N ) ]
g 1 H D M R ( Θ ) = [ g ( θ c ) ] 1 N Π i = 1 N h ( Θ i , Θ i , c )
φ = [ φ ( θ c ) ] 1 N Π i = 1 N φ ( Θ i , Θ i , c ) = 1.438 φ B φ A φ L φ λ
N = φ A f = 1.438 φ B φ A φ L φ λ A f

5.2. Proposed Design Equations

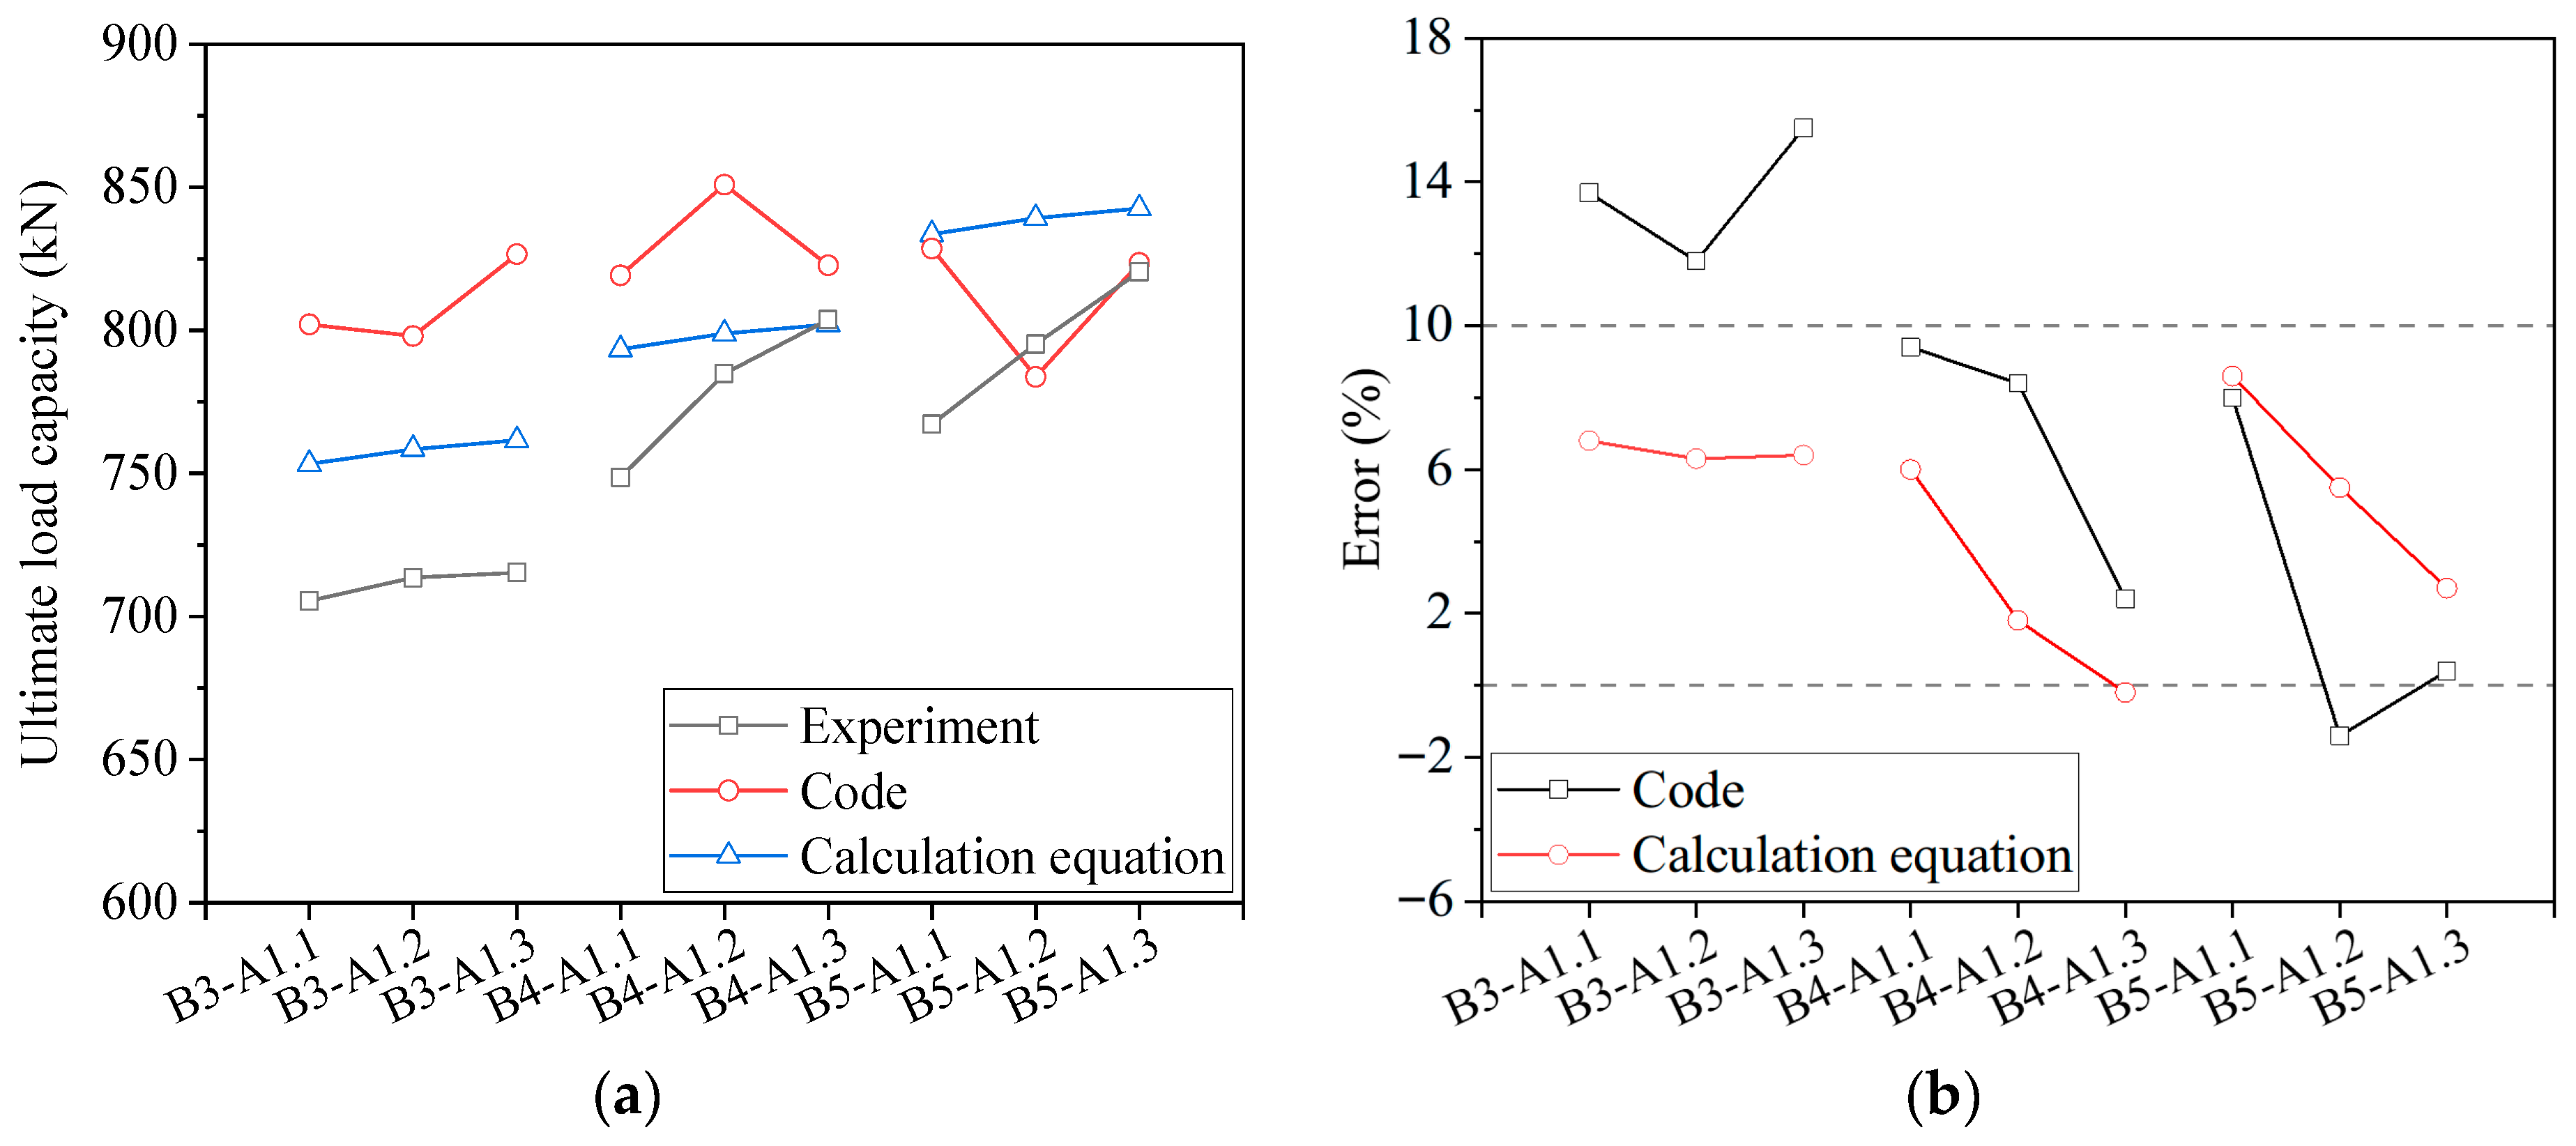
Table 5 shows the comparison of experimental results, design resistances calculated per GB 50017-2017 [35], and values obtained using the aforementioned equations. In the table, N represents experimental failure load obtained from Li et al. [33], N 1 denotes the ultimate load calculated from GB50017-2017, and N 2 is calculated from Equation (12). The design parameters of specimens are consistent with those listed in Table 1 and Table 2.
It can be observed from Table 5 that the ultimate load capacities calculated per GB50017-2017 significantly exceed the experimental results, with discrepancies ranging from 0.4% for specimen B5-A1.3 to 15.5% for specimen B3-A1.3. This substantial variability demonstrates the inadequacy of the current design code in predicting the axial compression behaviour of steel angles with double-shear splice connections. However, the load capacities calculated from the proposed equation are marginally higher than the experimental values, with error percentages ranging from −0.2% to 8.6%, as shown in Figure 13. It should be noted that the model exhibits consistent trends with experiments results. Thus, compared to the design method, the proposed equation can predict the load capacity of discontinuous steel angles under axial compression with satisfactory results.
The foregoing analyses reveal that the stability coefficient φ A exhibits a monotonically increasing relationship with the splice steel ratio. The increment becomes a negligible value of 1.7% when the splice steel ratio varies from 1.1 to 1.5. Therefore, the proposed equation can be simplified by fixing the splice steel ratio at 1.1. Furthermore, the stability coefficient for discontinuity location φ L decreases monotonically with increasing distance of the discontinuity from the bottom end of the main steel angle. A marginal reduction of 2.2% is observed as the discontinuity location moves from the bottom end to the mid-height. Thus, the φ L value for the discontinuity location at the mid-height can be employed. The simplified equation for axially compressed steel angles is expressed as a function of the yield strength f , gross cross-sectional area A g , number of bolts per leg B and slenderness ratio λ , as expressed in Equation (13).
N = f A g ( 0.0465 b + 0.734 ) 1 + 1.047 ( λ 160.18 ) , ( 2 b 5 )

6. Conclusions

In this paper, the axial compression stability of equal-leg steel angles with double-shear splice connections is investigated through numerical modelling. The influences of splice steel ratio, discontinuity location, slenderness ratio, and width-to-thickness ratio of steel angles on ultimate load capacity are quantified. Design equations are developed and compared with experimental results and values calculated per Chinese design code. The main conclusions from these numerical simulations are as follows:
(1)
The ultimate load capacity of steel angles with double-shear splice connections increases substantially, approximately 12.5% on average, as the splice steel ratio increases from 0.9 to 1.1, but beyond that range, the effect of splice steel ratio on load capacity becomes insignificant, with an average gain of only 2.0%. Furthermore, the splice steel ratio also affects the contribution of the bolt number per leg to the ultimate load capacity, with a slight difference of 0.4% when the bolt number is increased from 3 to 5 bolts at a splice steel ratio of 0.9, but the enhancement is increased to 5.2% when the ratio exceeds 1.0.
(2)
The load capacity of discontinuous steel angles decreases as the discontinuity location moves towards the mid-span. For discontinuity positions between 0.27 L and 0.50 L, specimens with splice steel ratios of 1.1 and 1.3 exhibit reductions in load capacity below 2%, demonstrating the limited influence of discontinuity location on load capacity.
(3)
The ultimate load capacity significantly decreases as the slenderness ratio increases from 35 to 155. Below a critical threshold of 115, the influence of slenderness ratio on load capacity is relatively minor, with an average reduction of 7.8%. However, once the slenderness ratio exceeds 115, a substantial average reduction of 37.3% in load capacity is observed as the ratio increases to 155.
(4)
Enlarging section specifications from L125 × 8 to L125 × 14, which decreases the width-to-thickness ratio from 15.6 to 8.9 of steel angles, leads to slightly increases in stability coefficient by around 1.2%. A higher splice plate ratio increases the stability coefficient among specimens with different width-to-thickness ratios.
(5)
A design equation is derived based on numerical results, in which the effects of the number of bolts per leg, splice plate ratio, discontinuity location, and member slenderness ratio are considered. Comparisons of calculated ultimate loads with experimental data and values computed from GB 50017-2017 demonstrate that the proposed equation can evaluate the ultimate load capacity of spliced steel angles under axial compression with good accuracy.

7. Limitations and Future Work

(1)
Even though the effects of key parameters, including spliced steel ratio, discontinuity location, slenderness ratio and width-to-thickness ratio, are analyzed in this study, the range and variety of parameters studied are still limited. Future studies can further extend this to configurations with more than 5 bolts per leg and other steel grades, such as Q234 and Q420, to develop more comprehensive design guidelines.
(2)
This study establishes the static ultimate capacity and failure mechanisms of the double-shear splice connections under axial compression. However, the fatigue resistance and dynamic response of these connections under realistic wind loads have not been analyzed. Future studies will address fatigue strength and dynamic response to evaluate the long-term reliability of these splice connections.
(3)
The proposed equations in this study are modified from the Chinese design code and are primarily applicable to the design of non-corrosive steel angle joints. However, their applicability to complicated conditions such as corrosion is limited. Further research will focus on the effects of residual stresses and section losses due to corrosion on these double-shear splice connections.
(4)
The bolt-hole interface is coupled to simplify the mechanical behavior of the connections in this study. However, the effects of interface characteristics such as bolt slip are neglected. Further investigations are needed to analyze these bolt connection characteristics under axial compression.

Author Contributions

Conceptualization, W.-C.Y., L.-Y.P., C.X. and H.-Y.M.; methodology, W.-C.Y.; software, S.-B.K., H.-Y.M., D.-G.H. and S.-Y.H.; validation, W.-C.Y., S.-B.K. and L.-Y.P.; formal analysis, S.-B.K. and C.X.; writing—original draft, W.-C.Y., L.-Y.P. and J.-M.Z.; writing—review and editing, S.-B.K., D.-G.H. and S.-Y.H. All authors have read and agreed to the published version of the manuscript.

Funding

This research received no external funding.

Institutional Review Board Statement

Not applicable.

Informed Consent Statement

Not applicable.

Data Availability Statement

The original contributions presented in this study are included in the article. Further inquiries can be directed to the corresponding author.

Conflicts of Interest

Authors Wei-Can Yuan, Lu-Yao Pei, and Cheng Xu are employed by Energy Development Research Institute, China Southern Power Grid. Authors Hai-Yun Ma, Da-Gang Han, Song-Yang He are employed by Southwest Electric Power Design Institute Co., Ltd., China Power Engineering and Consulting Group. The remaining authors declare that the research was conducted in the absence of any commercial or financial relationships that could be construed as a potential conflict of interest. The authors declare that they have no known competing financial interests or personal relationships that could have appeared to influence the work reported in this paper.

References

  1. Fu, X.; Du, W.L.; Li, H.N.; Li, G.; Dong, Z.Q.; Yang, L.D. Stress State and Failure Path of a Tension Tower in a Transmission Line under Multiple Loading Conditions. Thin Walled Struct. 2020, 157, 107012. [Google Scholar] [CrossRef]
  2. Deng, H.Z.; Huang, B. Study on Ultimate Bearing Capacity of Main Member in Transmission Tubular Tower Leg. Thin Walled Struct. 2018, 127, 51–61. [Google Scholar] [CrossRef]
  3. Qian, Y.; Huang, C.Y.; Han, B.L.; Cheng, F.; Qiu, S.Q.; Deng, H.Y.; Duan, X.; Zheng, H.B.; Liu, Z.W.; Wu, J. Quantitative Analysis of Bolt Loosening Angle Based on Deep Learning. Buildings 2024, 14, 163. [Google Scholar] [CrossRef]
  4. Rao, N.P.; Kalyanaraman, V. Non-linear behaviour of lattice panel of angle towers. J. Constr. Steel Res. 2001, 57, 1337–1357. [Google Scholar] [CrossRef]
  5. Li, X.Y.; Liu, C.B.; Xue, Y.; Xue, S.D.; Liao, S.; Zhou, Y. Predicting Bearing Capacity of Angle Steel Bolted Connections Using Machine Learning Based on Experimental and Numerical Database. Structures 2024, 67, 107014. [Google Scholar] [CrossRef]
  6. Rao, N.P.; Knight, G.M.S.; Mohan, S.J.; Lakshmanan, N. Studies on failure of transmission line towers in testing. Eng. Struct. 2012, 35, 55–70. [Google Scholar] [CrossRef]
  7. Jiang, W.Q. Accurate Modeling of Structural Joint and Its Application in Lattice Transmission Tower Analysis. Ph.D. Thesis, North China Electric Power University, Beijing, China, 2011. [Google Scholar]
  8. Jiang, W.Q.; Chen, X.Y.; Liu, J.L.; Niu, Z.B.; Feng, L.Y.; An, L.Q. Study on bearing capacity of transmission tower main leg with bolted joints. Chin. J. Constr. Mach. 2021, 19, 471–476. [Google Scholar]
  9. Xue, S.D.; Wang, L.S.; Li, X.Y.; Zhou, Y. Finite element analysis of axial pressure stability bearing capacity of angle steel such as transmission tower. Build. Struct. 2023, 53, 1431–1435. [Google Scholar]
  10. Zhang, Y.; Liu, H.J.; Yang, H.L.; Huang, X.; Zhu, L.; Guo, Y. Stability Bearing Capacity of Equal-Leg Angle Steel Columns with End Connection Joints. J. Constr. Steel Res. 2024, 216, 108606. [Google Scholar] [CrossRef]
  11. Shi, G.; Liu, Z.; Ban, H.Y.; Zhang, Y.; Shi, Y.J.; Wang, Y.Q. Tests and Finite Element Analysis on the Local Buckling of 420 MPa Steel Equal Angle Columns under Axial Compression. Steel Compos. Struct. 2012, 12, 31–51. [Google Scholar] [CrossRef]
  12. Shi, G.; Liu, Z.; Zhang, Y.; Shi, Y.J.; Wang, Y.Q. Study on the Local Buckling Behavior of Steel Equal Angle Members under Axial Compression with the Steel Strength Variation. In Sustainable Development of Urban Environment and Building Material; Pts 1–4; Li, H., Liu, Y.F., Guo, M., Zhang, R., Du, J., Eds.; Trans Tech Publications Ltd.: Durnten-Zurich, Switzerland, 2012; Volume 374–377, pp. 2430–2436. [Google Scholar]
  13. Shi, G.; Zhou, W.J.; Bai, Y.; Liu, Z. Local Buckling of Steel Equal Angle Members with Normal and High Strengths. Int. J. Steel Struct. 2014, 14, 447–455. [Google Scholar] [CrossRef]
  14. Li, Z.L.; Meng, L.X.; Li, M.H. Analysis on local buckling of axially compressed Q460 single angle columns. J. Chongqing Univ. 2010, 33, 94–98. [Google Scholar]
  15. Li, F.; Deng, H.Z.; Hu, X.Y. Experimental and Numerical Investigation into Ultimate Capacity of Longitudinal Plate-to-Circular Hollow Section K- and DK-Joints in Transmission Towers. Thin Walled Struct. 2019, 143, 106240. [Google Scholar] [CrossRef]
  16. Yang, F.L.; Zhu, B.R.; Li, Z. Numerical Analysis and Full-Scale Experiment on K-Joint Deformations in the Crank Arms of Lattice Transmission Towers. Struct. Des. Tall Spec. Build. 2018, 27, e1448. [Google Scholar] [CrossRef]
  17. Zhou, W.Z.; Liu, Y.S.; Tao, X.; Fan, C.K.; Huang, F.H.; Zhang, C.D. Failure Behavior of Steel Dual-Angle with Cruciform Welding Filler Plates under Compression. J. Constr. Steel Res. 2024, 213, 108404. [Google Scholar] [CrossRef]
  18. Zhou, W.Z.; Fan, C.K.; Huang, F.H.; Zhang, D.C.; An, Y. Compressive Bearing Capacity of Steel Dual-Angle with Cruciform Welding Filler Plates Based on Failure Modes. Structures 2024, 65, 106741. [Google Scholar] [CrossRef]
  19. Kozak, O.; Velychkovych, A.; Andrusyak, A. Practical Design of Lattice Cell Towers on Compact Foundations in Mountainous Terrain. Eng 2025, 6, 269. [Google Scholar] [CrossRef]
  20. Eom, T.S.; Yang, J.M.; Kim, D.K.; Lim, J.J.; Lee, S.H. Experimental Investigation of Bolted End-Plate Angle Splice in Encased Composite Columns. Eng. Struct. 2019, 190, 31–40. [Google Scholar] [CrossRef]
  21. Eom, T.S.; Cho, S.R.; Lim, J.J. Behavior of End Plate Connection for Steel Angles. Eng. Struct. 2022, 252, 113714. [Google Scholar] [CrossRef]
  22. Lu, C.H.; Ma, X.; Julie, E. Mills Structural Performance of Bolted Connectors in Retrofitted Transmission Tower Leg Members. In Proceedings of the Electrical Transmission and Substation Structures 2015, Branson, MO, USA, 27 September–1 October 2015; American Society of Civil Engineers: Branson, MO, USA, 2015; pp. 489–499. [Google Scholar]
  23. Lyu, Y.F.; Li, G.Q.; Wang, Y.B.; Li, H.; Wang, Z.Y. Bearing Behavior of Multi-Bolt High Strength Steel Connections. Eng. Struct. 2020, 212, 110510. [Google Scholar] [CrossRef]
  24. Wang, Y.B.; Lyu, Y.F.; Li, G.Q.; Richard, J.Y. Liew Behavior of Single Bolt Bearing on High Strength Steel Plate. J. Constr. Steel Res. 2017, 137, 19–30. [Google Scholar] [CrossRef]
  25. Lyu, Y.F.; Wang, Y.B.; Li, G.Q.; Jiang, J. Numerical Analysis on the Ultimate Bearing Resistance of Single-Bolt Connection with High Strength Steels. J. Constr. Steel Res. 2019, 153, 118–129. [Google Scholar] [CrossRef]
  26. Može, P.; Beg, D. High Strength Steel Tension Splices with One or Two Bolts. J. Constr. Steel Res. 2010, 66, 1000–1010. [Google Scholar] [CrossRef]
  27. Može, P.; Beg, D. A Complete Study of Bearing Stress in Single Bolt Connections. J. Constr. Steel Res. 2014, 95, 126–140. [Google Scholar] [CrossRef]
  28. Može, P. Bearing Strength at Bolt Holes in Connections with Large End Distance and Bolt Pitch. J. Constr. Steel Res. 2018, 147, 132–144. [Google Scholar] [CrossRef]
  29. Kim, D.K.; Lee, H.C. Generalized Load Deformation Relationship for Bearing-Type Single-Bolted Connections. J. Struct. Eng. 2020, 146, 151–742. [Google Scholar] [CrossRef]
  30. Teh, L.H.; Uz, E.M. Ultimate Shear-out Capacities of Structural-Steel Bolted Connections. J. Struct. Eng. 2015, 141, 0001105. [Google Scholar] [CrossRef]
  31. Sarothi, S.Z.; Ahmed, K.S.; Khan, N.I.; Ahmed, A.; Nehdi, L.M. Machine Learning-Based Failure Mode Identification of Double Shear Bolted Connections in Structural Steel. Eng. Fail. Anal. 2022, 139, 106471. [Google Scholar] [CrossRef]
  32. Sarothi, S.Z.; Ahmed, K.S.; Khan, N.I.; Ahmed, A.; Nehdi, L.M. Predicting Bearing Capacity of Double Shear Bolted Connections Using Machine Learning. Eng. Struct. 2022, 251, 113497. [Google Scholar] [CrossRef]
  33. Li, J.; He, S.Y.; Li, Z.L.; Wang, R.; Pu, S.T.; Huang, X.; Yan, X.Q. Experimental Study on Axial Compression Behavior of Angle Steel Main Members with Double-Shear Splicing Joints. Prog. Steel Build. Struct. 2025, 27, 48–56. [Google Scholar]
  34. Ansys, Inc. ANSYS Mechanical APDL Introductory Tutorials. Ansys Help. Available online: https://ansyshelp.ansys.com (accessed on 10 May 2025).
  35. GB 50017-2017; Standard for Design of Steel Structures. China Architecture & Building Press: Beijing, China, 2017.
  36. Rabitz, H.; Aliş, F.Ö. General Foundations of High-Dimensional Model Representations. J. Math. Chem. 1999, 25, 197–233. [Google Scholar] [CrossRef]
  37. Sobol, I.M. Global Sensitivity Indices for Nonlinear Mathematical Models and Their Monte Carlo Estimates. Math. Comput. Simul. 2001, 55, 271–280. [Google Scholar] [CrossRef]
  38. Tunga, M.A.; Demiralp, M. A Factorized High Dimensional Model Representation on the Nodes of a Finite Hyperprismatic Regular Grid. Appl. Math. Comput. 2005, 164, 865–883. [Google Scholar] [CrossRef]
  39. Tunga, M.A.; Demiralp, M. A Factorized High Dimensional Model Representation on the Partitioned Random Discrete Data. Appl. Numer. Anal. Comput. Math. 2004, 1, 231–241. [Google Scholar] [CrossRef]
  40. Aliş, Ö.F.; Rabitz, H. Efficient Implementation of High Dimensional Model Representations. J. Math. Chem. 2001, 29, 127–142. [Google Scholar] [CrossRef]
  41. Mukherjee, D.; Rao, B.N.; Prasad, A.M. Cut-HDMR-Based Fully Equivalent Operational Model for Analysis of Unreinforced Masonry Structures. Sadhana 2012, 37, 609–628. [Google Scholar] [CrossRef][Green Version]
Figure 1. Geometric configuration of discontinuous steel angle (unit in mm).
Applsci 15 13141 g001
Figure 2. Numerical models for different types of steel angles. (a) Intact steel angle; (b) Discontinuous steel angle.
Applsci 15 13141 g002
Figure 3. Schematic of mesh refinement at different locations. (a) Mesh at the discontinuity of main angles; (b) Mesh at the connection of main and diagonal angles.
Applsci 15 13141 g003
Figure 4. Comparison of experimental and numerical failure modes under axial compression. (a) Intact steel angle; (b) Discontinuous steel angle.
Applsci 15 13141 g004
Figure 5. Ultimate load capacities of steel angles with different splice steel ratios.
Applsci 15 13141 g005
Figure 6. Failure modes of steel angles with different splice steel ratios. (a) B3-A0.9; (b) B3-A1.5.
Applsci 15 13141 g006
Figure 7. Ultimate load capacities of steel angles with different discontinuity locations.
Applsci 15 13141 g007
Figure 8. Failure modes of steel angles with different discontinuity locations. (a) B4-A1.1-L0.30; (b) B4-A1.1-L0.40; (c) B4-A1.1-L0.50.
Applsci 15 13141 g008
Figure 9. Ultimate load capacities of steel angles with different slenderness ratios.
Applsci 15 13141 g009
Figure 10. Failure modes of steel angles with different slenderness ratios. (a) B3-A1.1-S35; (b) B3-A1.1-S55; (c) B3-A1.1-S95; (d) B3-A1.1-S155.
Applsci 15 13141 g010aApplsci 15 13141 g010b
Figure 11. Stability coefficients of steel angles with different width-to-thickness ratios.
Applsci 15 13141 g011
Figure 12. Stability coefficient of discontinuous steel angles with different parameters. (a) Number of bolts per leg; (b) Splice steel ratio; (c) Discontinuity location; (d) Slenderness ratio.
Applsci 15 13141 g012
Figure 13. Comparison of load capacities determined from different methods. (a) Ultimate load capacity; (b) Error.
Applsci 15 13141 g013
Table 1. Design parameters of steel angles for axial compression.
Specimen DesignationMain
Angles
Inner Steel AngleOuter Splice PlatesSlenderness RatioTotal Length of Angle (mm)Splice Steel RatioNumber of Bolts per Leg
B0L125 × 10----551364----
B3-A1.1L125 × 10L100 × 7−6 × 1055513641.13
B3-A1.2L125 × 10L110 × 8−6 × 1055513641.23
B3-A1.3L125 × 10L110 × 7−8 × 1055513641.33
B4-A1.1L125 × 10L100 × 7−6 × 1055513641.14
B4-A1.2L125 × 10L110 × 8−6 × 1055513641.24
B4-A1.3L125 × 10L110 × 7−8 × 1055513641.34
B5-A1.1L125 × 10L100 × 7−6 × 1055513641.15
B5-A1.2L125 × 10L110 × 8−6 × 1055513641.25
B5-A1.3L125 × 10L110 × 7−8 × 1055513641.35
Table 2. Mechanical properties of steel angles.
Steel CouponYield Strength (MPa)Ultimate Strength (MPa)Elongation (%)Elastic Modulus (MPa)
Main angleB0403.3564.113.6191,658.4
B3-A1.1387.5572.213.1195,905.4
B3-A1.2385.5584.214.9194,488.3
B3-A1.3399.4574.115.7200,873.7
B4-A1.1395.8545.214.4197,855.7
B4-A1.2411.1565.113.5208,731.5
B4-A1.3397.4559.714.5196,445.6
B5-A1.1400.3559.415.0206,869.9
B5-A1.2378.7538.214.9203,003.4
B5-A1.3397.9552.214.3201,409.9
Diagonal bracingL63 × 5403.3564.113.6202,798.5
Splice steelL100 × 7391.4563.414.7194,735.9
L100 × 8403.3571.014.8203,654.2
L110 × 8397.3567.214.7199,195.1
Table 3. Comparison of load capacities from experimental tests and numerical models.
Specimen DesignationNumber of Bolts per LegSplice Steel RatioFailure ModeExperimental Failure Load N (kN)Numerical Load Capacity N 1 (kN) N 1 N N
B0--Flexural buckling of steel angles796.1858.57.8%
B3-A1.131.1Flexural-torsional buckling of steel angles705.6755.17.0%
B3-A1.231.2Flexural-torsional buckling of steel angles713.6762.76.9%
B3-A1.331.3Flexural-torsional buckling of steel angles715.4763.06.7%
B4-A1.141.1Flexural-torsional buckling of steel angles748.6785.24.9%
B4-A1.241.2Buckling of diagonal bracing at the connection784.9793.41.1%
B4-A1.341.3Buckling of diagonal bracing at the connection803.7800.8−0.4%
B5-A1.151.1Flexural-torsional buckling of steel angles767.2839.09.4%
B5-A1.251.2Buckling of diagonal bracing at the connection795.2839.35.5%
B5-A1.351.3Buckling of diagonal bracing at the connection820.5845.43.0%
Average error5.2%
Table 4. Numerical stability coefficient of discontinuous steel angles under compression.
Design ParameterValuesStability Coefficient φ
Number of bolts per leg30.886
40.922
50.979
Splice steel ratio1.00.852
1.10.886
1.20.895
1.30.895
1.40.899
1.50.901
Discontinuity location0.270.886
0.300.885
0.350.883
0.400.881
0.450.879
Slenderness ratio350.898
550.886
750.882
950.865
1150.819
1350.663
1550.512
Table 5. Comparison of load capacities from experimental tests, design code and proposed equations.
Specimen DesignationNumber of Bolts per LegSplice Steel RatioExperimental Failure Load N (kN)Design Resistance
N 1 (kN)
N 1 N N Calculated Load Capacity
N 2 (kN)
N 2 N N
B3-A1.131.1705.6 802.013.7%753.36.8%
B3-A1.231.2713.6 798.011.8%758.56.3%
B3-A1.331.3715.4 826.615.5%761.56.4%
B4-A1.141.1748.6 819.29.4%793.46.0%
B4-A1.241.2784.9 850.98.4%798.91.8%
B4-A1.341.3803.7 822.62.4%802.1−0.2%
B5-A1.151.1767.2 828.58.0%833.58.6%
B5-A1.251.2795.2 783.7−1.4%839.25.5%
B5-A1.351.3820.5 823.50.4%842.62.7%
Average error7.6% 4.9%
Disclaimer/Publisher’s Note: The statements, opinions and data contained in all publications are solely those of the individual author(s) and contributor(s) and not of MDPI and/or the editor(s). MDPI and/or the editor(s) disclaim responsibility for any injury to people or property resulting from any ideas, methods, instructions or products referred to in the content.