Abstract
As the primary collision patterns on China’s freeways, in-depth exploration of the influencing factors of rear-end and sideswipe crashes has long been crucial for implementing targeted countermeasures. However, the structural and traffic flow continuity of freeways endows crash data with complex spatial and site correlations, which—if neglected in safety modeling—can lead to biased estimates of safety effects. To address this issue, this study develops a bivariate conditional autoregressive (CAR) model based on the Poisson lognormal (PLN) distribution: the copula joint distribution captures the site correlation between the two crash types, while the CAR model addresses spatial correlations across adjacent segments. Compared with univariate models and bivariate models with jointly distributed residuals, the proposed model achieves optimal performance and reveals the distinct determinants of the two crash types. For instance, factors such as spiral curve length and mean speed affect both crash types but to varying degrees, while continuous horizontal curve length only influences rear-end crashes. The proposed model and the identified influencing factors provide significant support for engineers to improve road safety.
1. Introduction
The World Health Organization (WHO) has reported that approximately 1.19 million fatalities occur each year due to road traffic crashes worldwide and that road traffic injuries account for about 3% of the GDP of most countries [1,2]. Freeways play a vital role in long-distance and regional mobility, yet the combination of high speeds and large traffic volumes makes crashes particularly severe. In China, freeways constitute only 3% of the national highway network but account for 7% of traffic crashes and 11% of traffic fatalities [3,4]. Road traffic safety has become a crucial component of China’s national development strategy. The Three-Year Action Plan (2024–2026) for Fundamental Improvements in Public Security System Safety [5] of China emphasizes the need to identify freeway safety hazards and to strengthen risk governance. These developments underscore the need for rigorous analyses of crash frequency and severity to inform targeted freeway safety countermeasures [6].
Rear-end and sideswipe crashes are the primary crash types on freeways, accounting for nearly 90% of all multi-vehicle crashes [3,7]. Due to the differences in crash patterns, the two crash types exhibit significant disparities in their spatiotemporal distributions and contributing factors. For example, rear-end crashes are primarily related to speed differentials and car-following behavior, whereas sideswipe crashes are more closely linked to lane-changing maneuvers and relative travel directions [8,9,10,11]. Therefore, it is necessary to distinguish rear-end and sideswipe crashes when conducting freeway safety analyses.
When exploring crash mechanisms, previous studies have shown that spatial correlation and site correlation significantly affect the accuracy of factor identification. Spatial correlation refers to the phenomenon where the frequency of the same crash type on adjacent road segments tends to be similar or follows a certain trend, whereas site correlation indicates that different crash types occurring at the same site or segment tend to maintain comparable levels over time [12]. Accurately capturing these correlations is essential for reliable safety modeling and inference.
To address the spatial correlation in crash data between adjacent segments, the mainstream approach involves incorporating conditional autoregressive (CAR) terms into regression models such as the Poisson lognormal distribution [13]. And for the site correlation between different crash types, viable approaches include multivariate models based on joint distribution residuals or copula-based joint distribution functions [14,15]. However, in the freeway context, studies that jointly model rear-end and sideswipe crashes while simultaneously accounting for both segment-level spatial correlation and inter-type site correlation remain scarce.
Therefore, this study focuses on rear-end and sideswipe crashes on freeways, with the primary objective of developing safety analysis models that account for both spatial and site correlations, so as to accurately identify the significant influencing factors associated with these two crash types.
The remainder of this paper is organized as follows. Section 2 reviews related work on crash factors and safety modeling. Section 3 introduces the research area, data sources, and variables. Section 4 presents the modeling framework and Bayesian estimation. Section 5 reports and discusses the empirical results. Section 6 draws concludes and outlines future research directions.
2. Literature Review
2.1. Studies on Factors Influencing Traffic Crashes
Previous safety analysis models mainly focused on total crash frequencies. As research progressed, differences in crash mechanisms among crash types were gradually revealed [16]. To precisely determine influencing factors, current studies typically refine crash types in safety analysis models according to crash patterns or severity levels [17]. For example, Mothafer et al. [18] divided total crashes into rear-end, sideswipe, crash with fixed-objects, and other types and found that geometric design variables such as the number of lanes and horizontal and vertical curve parameters had different levels of influence on each crash type. Hosseinpour et al. [19] further divided multi-vehicle crashes into right-angle, head-on, sideswipe, and rear-end crashes, revealing that geometric design parameters, land-use intensity, and terrain conditions had significant and distinct effects on all four types. Zhang et al. [20] categorized multi-vehicle crashes into rear-end, crash with fixed-object, and rollover crashes and found that monthly variations produced different effects across crash types. These findings suggest that refining crash classification according to field data characteristics helps reveal the specific impacts of roadway design, traffic operation, and land-use factors on each crash type.
Some scholars have also examined rear-end and sideswipe crashes on freeways. Bisht et al. [21] explored the effects of geometric design parameters, vehicle speed, and traffic volume on fatal rear-end crashes and found that freeway segments near villages were relatively safer, whereas sections with ramps, culverts, or potential hazards were more prone to rear-end crashes. Guo et al. [22] analyzed the risk factors of rear-end and sideswipe crashes in freeway diverging areas and revealed their differences: traffic volume and number of lanes were significantly related to both crash types, whereas speed limits had a significant negative effect only on rear-end crashes. These studies show that distinguishing rear-end and sideswipe crashes when constructing freeway safety analysis models is beneficial for a deeper understanding of roadway safety factors.
2.2. Studies on Traffic Safety Analysis Models
Traditional independent safety analysis models such as Poisson and negative binomial regressions are often used as baseline count data models in crash-frequency analysis. To better accommodate features such as overdispersion and a preponderance of zeros in crash data, some researchers have developed extended independent count models to further improve fitting and predictive performance [23].
After refining crash types, traditional independent safety analysis models are no longer applicable because they fail to capture the intricate spatial and site correlations in traffic crash data [24]. To accurately reveal the spatial association characteristics of crash data, spatial correlation structures have been introduced into traffic safety analysis models [25]. Aguero-Valverde [26] constructed multivariate spatial models of excess crash frequency at the area level, showing that crash frequencies are spatially correlated across neighboring areal units. Similarly, Ma et al. [27] added a spatial component to a multivariate space–time model of crash frequencies by injury severity levels, further highlighting the importance of accounting for spatial dependence. Wang and Feng [12] introduced a conditional autoregressive (CAR) term into a negative binomial model to account for spatial correlation among same-direction freeway segments. Wei et al. [28] developed a full Bayesian spatial random-parameters logit model for rural single-vehicle crash severity and found significant spatial correlation in the estimated crash risks. Champahom et al. [29] incorporated spatial correlation into a zero-inflated negative binomial model and found that crash data within the same area exhibited spatial association characteristics. Hu et al. [30] extended the ordered logit model by incorporating a Gaussian conditional autoregressive (CAR) component to enable the model to account for spatial correlation of crash severity among neighboring roadway segments. These studies indicate that the CAR structure has become the mainstream approach in traffic safety modeling for handling spatial correlation characteristics in crash data.
In addition to spatial correlation, the dependence between different crash types, often referred to as site correlation, has become an issue to be considered in crash modeling. The classical solution to it is multivariate modeling based on jointly distributed residuals [31,32]. Wang and Feng [12] set residuals following a bivariate normal distribution for single-vehicle and multi-vehicle crashes and used the variance–covariance matrix of the residuals to assess the site correlation between them. Following this way, Tahir et al. [33] proposed a multivariate random-parameters Poisson lognormal–Lindley model to simultaneously estimate multiple crash types and addressed the dependence across crash types successfully. Recently, an alternative multivariate modeling approach based on copula joint distributions has been proposed to address site correlation. Ahmad et al. [34] used a normal copula function to link the marginal negative binomial distributions of single-vehicle and multi-vehicle events, and the resulting joint negative binomial regression model successfully captured the correlation between the two crash categories. Faden et al. [35] further developed a copula-based Poisson lognormal–Lindley model for analyzing crashes on freeways with separated express and general-purpose lanes, and they found that the model can effectively capture the dependence between different crash types.
In previous studies, PLN–CAR models and various bivariate models have been employed to tackle spatial correlation and dependence between crash types. However, in the freeway context, studies that simultaneously address segment-level spatial correlation and cross-type site correlation for rear-end and sideswipe crashes remain limited. In particular, systematic investigations that combine the PLN–CAR framework with copula-based dependence structures are still lacking, nor have comparative analyses of their performance against multivariate joint-residual specifications been conducted.
Therefore, this study makes three main contributions:
- (1)
- We propose and apply a copula-based bivariate Poisson lognormal-CAR (PLN-CAR) model that simultaneously accounts for spatial correlation and site correlation. This type of dependence structure has rarely been examined systematically in previous traffic safety studies.
- (2)
- We construct bivariate PLN–CAR models with two alternative dependence structures: one based on multivariate normally distributed residuals and the other based on copula functions. We then systematically compare their performance in capturing site correlation across crash types and in terms of overall model fit.
- (3)
- We apply the aforementioned models to freeway rear-end and sideswipe crash data to quantify their spatial and site correlations, as well as to identify the type-specific safety contributing factors of each crash type. The findings deepen the understanding of the differential mechanisms of rear-end and sideswipe crashes and provide theoretical support for targeted freeway safety countermeasures.
3. Data Preparation
This study uses data from a freeway section in Shanghai, China. The freeway section was 45 km long with a maximum speed limit of 100 km/h. Considering the differences in roadside facilities, traffic flow conditions, and crash distribution characteristics between the two directions of the freeway, the analysis units were divided separately for each direction. Data on traffic crashes, highway geometric characteristics, and operational parameters were collected for the years 2023 and 2024. Figure 1 shows a map of the freeway section examined in this study, including the alignment of the freeway and the start and end kilometer posts.
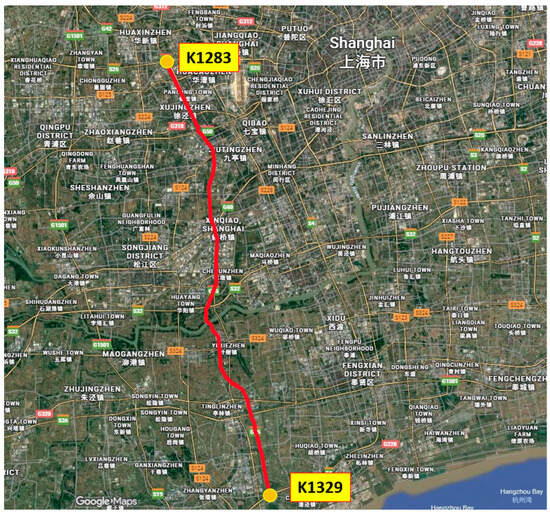
Figure 1.
Map of the study freeway section.
3.1. Division of Roadway Units
The segmentation of the freeway sections in this study followed the homogeneity principle. Specifically, the freeway was divided into segments in which geometric design parameters remained constant, and a new segment was defined whenever the geometric parameters changed. The parameters considered included horizontal alignment (straight and curved sections), vertical alignment (upgrade, downgrade, crest curve, and sag curve), number of lanes (two, three, or four lanes), and width of the median strip (2 m, 3 m, or greater than 3 m).
During the segmentation process, both directions of the 45 km freeway were initially divided into 492 basic segment units with an average length of approximately 180 m, a minimum length of 7.6 m, and a maximum length of 347 m. According to the Highway Safety Manual [36], segment lengths shorter than 160.9 m may lead to problems with statistically low exposure. Therefore, excessively short basic segments were merged with adjacent segments while maintaining consistency in cross-sectional characteristics as a priority. As a result, both directions of the 45 km freeway were finally divided into 360 analysis units, including 174 segments in the north-to-south direction and 186 segments in the south-to-north direction. The average segment length was 224.32 m.
3.2. Extraction of Geometric Design Parameters
After the segmentation of the analysis units, the horizontal, vertical, and cross-sectional geometric parameters of each segment were extracted from the freeway design drawings and Google Street View images. The specific parameters included (1) horizontal alignment in terms of curve type and curvature, spiral curve length, continuous curve length, and proportion of curved sections, (2) vertical alignment in terms of vertical type, maximum gradient, vertical curve curvature, grade variation, and proportion of vertical curves, and (3) cross-sectional characteristics that included mainline type, number of lanes, and median strip width. The descriptive statistics for these roadway geometric design parameters are presented in Table 1.

Table 1.
Summary Statistics of Geometric Design Features.
3.3. Traffic Operation Parameters
The traffic operation data were sourced from the freeway management company. The expressway network is instrumented with video surveillance and toll station detection systems that capture vehicle volumes and speeds. These raw data were then processed to compute key performance indicators for each segment, including average daily traffic volume, mean speed and speed deviation. The traffic operation parameters are listed in Table 2.
Table 2.
Statistical Summary of Traffic Operational Characteristics.
3.4. Traffic Operation Features
Traffic crash data were obtained from the Traffic Management Integrated Application Platform of the public security system. Based on the “crash occurrence time” field, all vehicle-to-vehicle crashes that occurred within the study period on the selected freeway section in Shanghai were extracted. According to the “crash type” field, the crashes were classified as rear-end and sideswipe crashes. Subsequently, using the “crash location” field, information on the roadway name, direction, kilometer marker, orientation, and distance were retrieved to locate each crash precisely on the corresponding homogeneous segment. As a result, 742 rear-end crashes and 342 sideswipe crashes were identified across the 360 homogeneous segments. The descriptive statistics of the crash data are presented in Table 3.
Table 3.
Summary Statistics of Crash Frequencies on Homogeneous Freeway Segments.
3.5. Analysis of Crash Characteristics
Before developing the safety analysis models, the crash data of the road segments were analyzed to examine their characteristics. Figure 2 shows the frequency distributions of the two crash types. The crash frequencies across the 360 analysis units were non-negative and discrete.
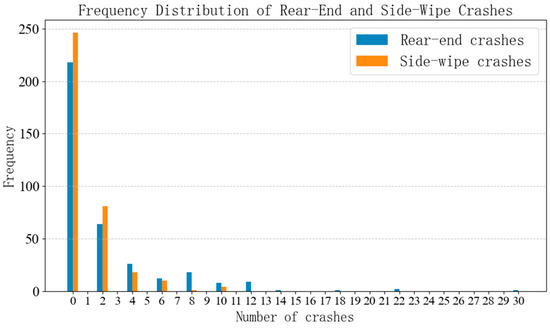
Figure 2.
Crash Frequency Distribution.
Figure 3 shows the spatial distribution of rear-end and sideswipe crashes across the 360 freeway segments. The horizontal axis denotes the specific IDs of the analysis units. On the north-to-south direction of the freeway (K1283 → K1329), the segment IDs increased sequentially from 1 to 174. On the south-to-north direction (K1329 → K1283), the segment IDs increased from 175 to 360. As shown in Figure 2, the crash frequencies of the same type were similar or varied gradually across adjacent segments, indicating a certain degree of spatial correlation (as marked by the green arrows). In addition, rear-end and sideswipe crashes that occurred at the same site or segment tended to have comparable frequencies, which indicates site correlation between the two crash types (as highlighted by the red circles). Based on these observations, preliminary tests of spatial and site correlations were conducted using statistical analyses.
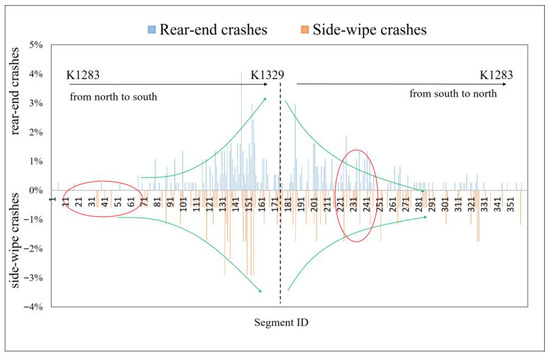
Figure 3.
The Spatial Distribution of Crashes on Microscopic Segments. The red circles highlight segments where rear-end and sideswipe crashes occurred with similar frequencies, indicating site correlation.
3.5.1. Spatial Correlation
Previous studies have indicated that the spatial correlation of traffic crash data between adjacent segments mainly results from similar roadway design parameters and traffic operating environments, a feature that is particularly evident on freeways [37]. We employed Moran’s I index to examine the spatial correlation of freeway crash data [38]. Moran’s I is a statistical measure used to quantify spatial autocorrelation, and its value ranges from −1 to 1, with the specific interpretations described as follows.
Spatial correlation analyses were performed separately for the rear-end and sideswipe crashes in each direction because the examined freeway was divided into two traffic directions by a central median. The corresponding results are presented in Table 4.
Table 4.
The Results of Moran’s I Index for Crashes along Two Directions of the Freeway.
The Moran’s I values for both rear-end and sideswipe crashes in both directions were significantly positive at the 99% confidence level, revealing a pronounced spatial correlation in the analyzed freeway crash data. Hence, this spatial feature was incorporated into subsequent model development.
3.5.2. Site Correlation
Certain potential factors in the same segment or site may simultaneously influence the occurrence of different crash types, leading to site correlations between various crash patterns [12]. To test for site correlation, 360 freeway segments were ranked in descending order based on the number of rear-end and sideswipe crashes. Spearman’s rank correlation coefficient (Spearman’s rho) was used to examine the correlation between two ranking results. The test results are listed in Table 5.
Table 5.
Results of Spearman’s Correlation Test between Rear-end and Sideswipe Crashes.
As shown in Table 5, the correlation coefficient for segment rankings was 0.527, which was statistically significant at the 99% confidence level. This result reveals a strong positive site correlation between rear-end and sideswipe crashes on the examined freeway. Consequently, this correlation was explicitly incorporated into the subsequent development of the safety model.
4. Safety Analysis Models and Evaluation Indicators
4.1. Model Structure
To address the over-dispersion of crash data, we adopted the Poisson lognormal regression model (PLN) as the base model and incorporated a CAR term to capture spatial correlation among different segments. Given the observed site-level correlation between rear-end and sideswipe crashes occurring within the same segment, i.e., site correlation, we further developed bivariate safety analysis models using two approaches, including one based on multivariate jointly distributed residuals and another based on copula functions. Specifically, the following models were established sequentially: the PLN model, the univariate PLN CAR Model (Uni-PLN-CAR), a bivariate PLN-CAR model based on the variance-covariance of jointly distributed residuals (Bi-PLN-CAR-cov), and a bivariate PLN-CAR model based on copula functions (Bi-PLN-CAR-copula). The overall modeling and evaluation framework is illustrated in Figure 4.
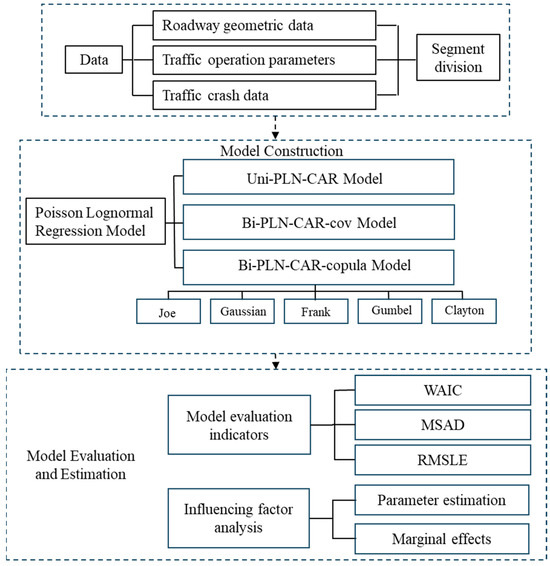
Figure 4.
Model Construction and Evaluation Framework.
4.1.1. Poisson Lognormal Regression Model
To address the over-dispersion of crash data, both the negative binomial model and the Poisson lognormal regression model have been proposed. Given that more than 60% of the observations in our data comprised zero values, we preliminarily estimated and compared four alternative specifications, including a Poisson lognormal regression model, a zero-inflated Poisson lognormal model, a negative binomial model, and a zero-inflated negative binomial regression model. The results of the comparison results indicate that, the zero-inflated and negative binomial models did not provide a clear improvement in fit over the Poisson lognormal model for the data used in this study. In addition, the PLN model provided greater structural flexibility, which allowing for extensions to accommodate complex data characteristics. Therefore, we adopted the PLN model as the baseline model.
For each segment , the crash count is modeled as a Poisson variable with mean , from which the PLN model is derived as follows.
where Poisson denotes a Poisson distribution, indicates the predicted number of crashes on segment derived from the Poisson model, which, as shown in Equation (2), is specified as a function of explanatory variables . The variable represents the factors that influence crashes, while is the corresponding regression coefficient vector and is the intercept. The term represents the random error of the model, which follows a normal distribution with a mean of 0 and variance of . The variance parameter is assumed to follow a gamma distribution with a noninformative prior.
4.1.2. Univariate PLN CAR Model
To account for the spatial correlation in the crash data, a spatial effect term was added to the PLN model. This term captured the spatially correlated characteristics embedded in the modeling data. The corresponding Uni-PLN-CAR model is expressed as follows.
where the definitions of the variables , , , , and are the same as those in the PLN model. The newly introduced term represents the spatial random effect, which follows a CAR prior distribution and captures spatial dependence among analysis units through the adjacency matrix . The elements in W reflect the spatial relationships between segments and .
The spatial adjacency matrix is formulated according to the distance relationships among freeway segments. For segments and on the same side of the freeway, the weight is specified as the inverse of the center-to-center distance. If the two segments are located on opposite sides, is set to zero to represent the absence of spatial correlation. The conditional prior distribution of is then expressed as follows.
where represents the precision parameter of the Gaussian spatial autoregressive distribution, which is the reciprocal of variance [39]. The term denotes the collection of all values except , is the sum of all values for the segments adjacent to segment .
According to the recommendation of Besag et al. [40], the parameter in Equation (6) is set to 1, and the conditional distribution of is expressed as follows:
4.1.3. Bivariate PLN-CAR Model Based on the Variance Covariance of Jointly Distributed Residuals
When performing bivariate association modeling, two random effect terms following a joint normal distribution were added to the regression expressions for the dependent variables. The variance-covariance matrix of these random effects was employed to describe the correlation between the dependent variables. Accordingly, the formulation of the bivariate PLN-CAR Model based on the variance-covariance of jointly distributed residuals is defined as follows.
where and denote the number of rear-end and sideswipe crashes on segment , respectively, and each follows a Poisson lognormal distribution. and are the expected counts of rear-end and sideswipe crashes on segment . and are vectors of the explanatory variables for the two crash types. and are the intercepts, and and are coefficient vectors. represents the spatial effect term. and are random effects that follow a joint normal distribution, as expressed in Equation (13). Based on the variance-covariance matrix of the jointly distributed residuals, the correlation between the two crash types is computed as
4.1.4. Bivariate PLN-CAR Model Based on Copula Functions
According to Sklar [41], the copula framework provides a means to couple multiple univariate marginal distributions into a unified multivariate joint distribution. Suppose that two random variables and follow marginal distribution functions and , respectively. Their joint distribution can then be written as , where , , and each take values in [0, 1]. For any realization of the random vector , there exists a unique correspondence between a point in the space and a point in the interval. The copula function reflects this one-to-one relationship, as expressed in Equation (15). It is monotonically increasing within its domain and uses a parameter to capture the dependency between variables, which can represent not only linear but also nonlinear correlations.
If the marginal distribution functions of rear-end crashes and sideswipe crashes are denoted as and , and their inverse functions within the interval are and , respectively, then Equation (14) can be rewritten as follows.
When the relationship between variables is nonlinear, the correlation coefficient cannot accurately reflect the dependency between them. Nelsen [42] pointed out that under strictly monotonic transformations of the variables, the dependence measure derived from the copula function would remain unchanged, which makes it more general than linear correlation coefficients. Therefore, we adopted the Kendall rank correlation coefficient (), a concordance-based dependence measure, to evaluate the correlations between variables [43]. The correspondence between Kendall’s τ and the parameter is presented in Table 6.
Table 6.
Characteristics of Different Bivariate Copulas Families.
In this study, the association between sideswipe and rear-end crashes was modeled using several commonly applied copula functions. Specifically, five bivariate PLN-CAR Models based on copula Functions were developed, including Bi-PLN-CAR-Gaussian, Bi-PLN-CAR-Frank, Bi-PLN-CAR-Clayton, Bi-PLN-CAR-Joe, and Bi-PLN-CAR-Gumbel models. The mathematical formulations of these copula functions, along with the ranges of the parameters and , are summarized in Table 6 [44]. Further details on the model specification and joint likelihood derivation are provided in Appendix A.
4.2. Marginal Effects of Influencing Factors
Using the estimated parameters of the developed models, the marginal effects at mean (MEM) were calculated to analyze the influence of each explanatory factor on the two crash types [45]. The marginal effect quantifies the variation in the expected crash frequency resulting from a one-unit increase in an explanatory variable. The corresponding computation formula is given below:
where represents the observed number of crashes on segment , the explanatory variable denotes the influencing factors that affect crashes, is the corresponding regression coefficient, and indicates the sample mean of segment .
4.3. Model Estimation and Evaluation
Considering the complexity of the model structure, we adopted a full Bayesian estimation method to estimate the parameters of the safety analysis models, using the MultiBUGS modeling software (version 2.0). During the estimation, two Markov chains were set for each model and 20,000 iterations were performed. We discarded the first 5000 iterations as a burn-in and used the remaining 15,000 iterations to compute the posterior means of the parameters. The convergence between the two chains was assessed using the Gelman–Rubin diagnostic statistic , and all parameters achieved , which indicates satisfactory convergence of the Markov chain Monte Carlo (MCMC) simulations [46,47]. In addition, trace plots were examined for key parameters, and the results further confirmed the stable convergence of the MCMC chains.
The performance of the model was assessed using three indicators, including the Watanabe–Akaike information criterion (WAIC), root mean squared logarithmic error (RMSLE), and mean standardized absolute deviance (MSAD). The WAIC, as a Bayesian generalization of the traditional Akaike information criterion (AIC), provides a comprehensive evaluation of model fit while accounting for complexity. A lower WAIC value indicates a better model. The computation of the WAIC is given as follows [48]:
where represents the log pointwise predictive density, and denotes the effective number of estimated parameters in the model.
The MSAD and RMSLE indices were used to assess the overall predictive accuracy of the models. Smaller values of these metrics indicate better predictive performance. The calculation formulas were expressed as follows [49]:
where denotes the observed crash frequency on segment , refers to the model-estimated number of crashes, indicates the standard deviation of the observed crash counts among all segments, and represents the total number of segments in the dataset, i.e., the sample size.
5. Model Construction and Analysis
5.1. Variable Selection
High correlations or multicollinearity among variables can result in unstable coefficient estimates and decrease the reliability of the model inference. Therefore, before model construction, a correlation analysis was conducted for the collected roadway geometric design and traffic operation variables. The results of the analysis are shown in Figure 5.
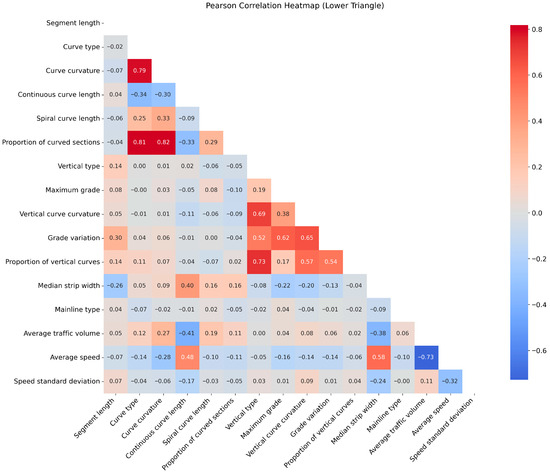
Figure 5.
The Results of Correlation Test for Independent Variables.
The correlation analysis results indicated that the type of horizontal curve was highly correlated with the curvature of the curve and the proportion of curved sections. The four variables related to vertical alignment, including vertical type, vertical curve curvature, grade variation, and proportion of vertical curves, were also strongly correlated. Moreover, the average speed was strongly associated with the median width, lane count, and traffic volume. Therefore, in the development of the safety analysis models, these highly correlated variables were not included simultaneously to avoid multicollinearity. We alternatively included them in the preliminary model specifications, compared the performance of the models, and retained the variable that provided a better fit (based on WAIC, MSAD, and RMSLE) while excluding the other highly correlated variables from the final models.
5.2. Model Performance Comparison
In this study, a total of eight models were developed for rear-end and sideswipe crashes, including the univariate Poisson log-normal regression model (Uni-PLN), the univariate PLN-CAR model (Uni-PLN-CAR), the bivariate PLN-CAR model based on the variance–covariance of jointly distributed residuals (Bi-PLN-CAR-cov), and five bivariate PLN-CAR models based on copula functions (Bi-PLN-CAR-copula). The predictive performances of the eight models were assessed and compared based on the WAIC and MSAD metrics, and the results are summarized in Table 7.
Table 7.
The Model Evaluation Result.
Comparisons of WAIC and MSAD between the Uni-PLN and Uni-PLN-CAR models indicated that Uni-PLN-CAR outperformed Uni-PLN. This improvement primarily stemmed from the intricate spatial correlation observed among segments along the same freeway direction. The spatial CAR term introduced in the Uni-PLN-CAR model effectively captured this dependence and improved the model’s goodness of fit.
Among the five bivariate PLN-CAR models based on copula Functions, the Bi-PLN-CAR-Frank achieved the best overall performance and predictive accuracy. In this model, the WAIC values for the rear-end and sideswipe components were 678.9 and 484.7, respectively, the MSAD values were 0.219 and 0.305, and the RMSLE values were 0.283 and 0.249. All of these were the smallest among the five copula-based models. These results indicate that the Frank copula was more suitable for modeling dependence between different crash types, which is consistent with the findings of Tamakloe et al. [44].
Comparing the univariate and bivariate models, the Uni-PLN-CAR model had higher WAIC, MSAD, and RMSLE values than the Bi-PLN-CAR-Frank model, indicating inferior overall performance. This result implies that introducing an association structure to account for site correlation between rear-end and sideswipe crashes improved predictive accuracy. Prior studies have also reported that bivariate models outperform univariate models in multi–crash-type settings [30,43].
Comparing the two association modeling approaches, the MSAD values for Bi-PLN-CAR-cov and Bi-PLN-CAR-Frank were 0.211, 0.417, 0.219, and 0.305, respectively (rear-end, sideswipe). That is, the two models showed similar accuracy for rear-end crashes, whereas the Bi-PLN-CAR-Frank model was more accurate for sideswipe crashes. However, the WAIC values for Bi-PLN-CAR-cov were 838.1 and 775.5, and the RMSLE values were 0.415 and 0.453, respectively, which were clearly higher than those of Bi-PLN-CAR-Frank (WAIC: 678.9, 484.7; RMSLE: 0.283, 0.249). This indicates that considering the overall fit and model complexity, Bi-PLN-CAR-Frank outperformed Bi-PLN-CAR-cov. Nevertheless, the copula-based association models were not uniformly superior to the residual-based model, as shown in Table 7. In particular, Bi-PLN-CAR-cov performed better than the Gaussian and Gumbel copula variants in terms of WAIC and MSAD.
5.3. Parameter Estimation and Analysis
The estimation outcomes for the Uni-PLN-CAR, Bi-PLN-CAR-cov, and Bi-PLN-CAR-Frank models are summarized in Table 8, which reveals the major factors affecting rear-end and sideswipe crashes, and compares the parameter estimates across different model structures.
Table 8.
Parameter Estimation Results.
During the construction of the models, the basic principle was to remove statistically insignificant variables. However, for reasons of variable completeness and a fair comparison across model structures, the retention or exclusion of non-significant variables followed a two-step procedure.
Step 1: For some categorical variables, certain factor levels were significant, whereas others were not. We retained all levels in the models to preserve the integrity of the categorical variables.
Step 2: Variables whose significance differed between the two crash types were retained in the bivariate models to highlight the differences in the influencing factors between rear-end and sideswipe crashes.
According to Step 1, the nonsignificant level “mainline with ramps (entrance/exit)” within the variable mainline type was retained in the models.
According to Step 2, the following nonsignificant variables were retained: spiral curve length, average speed, and traffic volume in the Bi-PLN-CAR-cov model, and the proportion of horizontal curves, continuous curve length, and spiral curve length in the Bi-PLN-CAR-Frank model.
The three models produced slightly different sets of significant factors for the two types of crashes. According to the univariate model, the proportion of horizontal curves was not significant for either crash type. However, after accounting for site correlation, it became significant in both the Bi-PLN-CAR-cov and Bi-PLN-CAR-Frank models. A comparison between the two bivariate models revealed that continuous curve length exerted a significant influence on both rear-end and sideswipe crashes in the Bi-PLN-CAR-cov model, whereas its effect was limited to rear-end crashes in the Bi-PLN-CAR-Frank model.
The differences in the significant influencing factors among the three models were mainly attributed to two factors. First, a discrepancy between the univariate and bivariate models arose because the latter captured the significant site correlation between the two crash types through an association structure, which is a complex data feature that the univariate model could not address. As shown in Table 8, the site correlation coefficients are 0.873 for the Bi-PLN-CAR-cov model and 0.993 for the Bi-PLN-CAR-Frank model, indicating a very high level of site correlation between rear-end and sideswipe crashes. This finding suggests that certain unobserved factors may simultaneously affect both crash types within the same segment. The univariate model, which failed to capture such latent effects and consequently produced biased estimates of variable impacts.
The differences between the two bivariate models mainly resulted from their distinct mechanisms for capturing site correlation. As shown in Equations (10)–(14), the Bi-PLN-CAR-cov model incorporated the correlation coefficient into the variance–covariance matrix of the residual terms, thereby capturing the site correlation contained in the residuals between rear-end and sideswipe crashes. In contrast, according to Table 6, the Bi-PLN-CAR-Frank model embedded the correlation coefficient within the copula function of the marginal distributions, which primarily captured the site correlation reflected in the predicted crash frequencies. Because these two models handle site correlations from different perspectives, the sets of significant variables identified also differed.
5.4. Marginal Effects Analysis
Given that the Bi-PLN-CAR-Frank model achieved the best overall performance, we analyzed the factors influencing the two crash types based on this model. Using Equations (17) and (18), we computed the marginal effects at mean for all explanatory variables in the Bi-PLN-CAR-Frank model. The results are reported in Table 9.
Table 9.
Marginal Effects for Bi-PLN-CAR-Frank Model.
Focusing first on the variables that significantly affected both rear-end and sideswipe crashes, these included median strip width, traffic volume, segment length, and average speed. As shown in Table 9, median strips wider than 3 m led to reductions of 0.0311 and 0.1949 in the expected frequencies of rear-end and sideswipe crashes, respectively, compared with a 2 m median. This effect likely arises because a broader median helps mitigate headlight glare and visual distraction for drivers, aligning with findings reported in previous studies [50].
The segment length, which was used as an exposure variable and log-transformed in the model, also showed a positive association with both crash types. As shown in Table 9, a one-unit increase in the logarithmic value of the segment length led to an average increase of 0.0156 rear-end crashes and 0.0436 sideswipe crashes. This suggests that longer segments are more prone to rear-end and sideswipe crashes, which is consistent with the conclusions reported by Yu and Abdel-Aty [50].
The average speed exhibited a statistically significant negative association with both crash types. As presented in Table 9, a 1 km/h increase in the average speed corresponds to reductions of 0.0007 and 0.0042 in the expected frequencies of rear-end and sideswipe crashes, respectively. This may be because all segments analyzed in this study operated below the posted speed limit, meaning that a higher average speed indicates smoother traffic operations and a better level of service, which consequently reduces the probability of crash occurrence.
The logarithmic value of traffic volume was also significantly negative at the 95% credible interval, with average reductions of 0.0073 and 0.0255 for rear-end and sideswipe crashes, respectively. This result suggests that after controlling for exposure factors such as segment length, higher traffic volume corresponds to more stable traffic flow, smaller speed differences between vehicles, and fewer abrupt lane-change behaviors, thereby decreasing the likelihood of both crash types. This pattern is consistent with previous findings that under certain traffic regimes, higher traffic volumes may be associated with a more uniform traffic flow, which reduces the risks of specific types of crashes [51,52].
In addition to the shared determinants, the proportion of horizontal curves was significant only for rear-end crashes and displayed a positive relationship in which a one-unit increment in the curve proportion led to a 0.0292 increase in the expected crash count. Conversely, the continuous curve length exhibited a negative association at the 90% credible interval, with every additional kilometer corresponding to an average decrease of 0.0124 rear-end crashes. This may be because drivers tend to stay more alert and cautious when driving through curved sections, which helps reduce the risk of rear-end crashes.
The spiral curve length was also significant only for rear-end crashes and had a positive effect; for each additional kilometer of the spiral curve length, rear-end crashes increased by 0.0194 on average. This result is likely due to longer spiral curves typically being linked with smaller-radius horizontal curves, which increase geometric complexity and driving difficulty.
The mainline type was significant only for sideswipe crashes at the 90% confidence interval. Compared to regular mainline segments, the number of sideswipe crashes increased by 0.0564 on segments connected to entrance ramps, whereas no significant difference was found for segments connected to exit ramps. This is because entrance areas experience more lateral vehicle interactions, which increases the likelihood of conflicts between through traffic and merging vehicles. Previous studies have also shown that the mainline segments adjacent to interchanges are prone to both rear-end and sideswipe crashes [53].
In addition, mainline segments connected to exit ramps did not significantly affect either crash type, and neither the spiral curve length nor the continuous curve length were significant for sideswipe crashes.
Overall, the underlying mechanisms governing rear-end and sideswipe crashes showed marked distinctions. Although variables such as median width over 3 m, segment length, average speed, and traffic volume significantly affected both crash types, their effect magnitudes varied. For example, a one-unit increase in segment length corresponds to increases of 0.0156 and 0.0436 in the expected frequencies of rear-end and sideswipe crashes, respectively. In contrast, certain factors influenced only one crash type: the proportions of horizontal curves, continuous curve length, and spiral curve length were significant exclusively for rear-end crashes, whereas the mainline type associated with entrance ramps affected sideswipe crashes alone. These results highlight the importance of distinguishing crash types when constructing freeway safety analysis models.
A clear understanding of the mechanisms underlying rear-end and sideswipe crashes offers valuable insights for enhancing freeway safety management. Based on the significant influencing factors identified in this study, several countermeasures were proposed to enhance roadway safety. First, when conditions permit, the width of the median strip should be increased from 2 m to greater than 3 m, and it should be equipped with anti-glare facilities and continuous visual guidance to further reduce the likelihood of both types of crashes. Second, the minimum speed limit should be appropriately increased according to traffic conditions, and speed harmonization should be promoted. Measures such as coordinated speed limits, variable speed limits, and lane guidance can help minimize differences in relative speed and unstable following behavior. Third, for long segments, more attention should be paid to information guidance and functional zoning, including optimizing ramp spacing and sectional speed limits to mitigate conflict opportunities caused by high exposure. Fourth, the design and management of curved segments should be optimized by reasonably controlling the proportion of horizontal curves and continuous curve length. For segments requiring long spiral curves connected to small-radius horizontal curves, advance warning and speed control devices should be installed to reduce the longitudinal control difficulty and thereby decrease the risk of rear-end crashes. Fifth, for mainline segments connected to entrance ramps, acceleration lanes and road markings should be improved, and merging flow guidance and predictability should be strengthened to reduce the risk of sideswipe crashes caused by lateral interactions. Finally, traffic flow management and diversion strategies should be implemented according to the temporal characteristics. During peak hours, implementing staggered departures, traffic rerouting, and adaptive speed control can help sustain stable traffic flow and speed uniformity to mitigate the risk of rear-end and sideswipe crashes.
6. Conclusions
In this study, we have analyzed factors that influence rear-end and sideswipe crashes between road vehicles on Chinese freeways by developing correlated models of the frequency of crashes based on freeway traffic safety data.
- (1)
- The Bi-PLN-CAR-Frank model exhibited superior performance. The proposed bivariate correlated models based on jointly distributed residuals and copula functions, as well as incorporating the conditional autoregressive (CAR) term, were capable of addressing site correlation and spatial correlation in crash data. According to the evaluation indicators for the model, association modeling of rear-end and sideswipe crashes effectively improved the overall performance of the model. In terms of model structure, the association model based on the Frank copula function (Bi-PLN-CAR-Frank) performed better than the model based on jointly distributed residuals (Bi-PLN-CAR-cov), which indicates that the Frank copula-based association model can be considered as an exploratory option for freeway rear-end and sideswipe crash safety analyses under similar conditions, although its applicability still needs to be validated further using broader datasets.
- (2)
- Key factors differ significantly between rear-end and sideswipe crashes. Model estimation outcomes revealed that the key determinants of rear-end and sideswipe crashes on freeways differed from each other. On one hand, some specific factors showed different levels of significance for the two crash types; on the other hand, some factors were significant only for one type of crash. Overall, the precise identification of these influencing factors provides a useful reference for improving freeway traffic safety on the studied freeway and, with due caution, at similar facilities.
Although this study enhanced freeway safety analysis through an improved modeling framework, the dataset was limited to a single freeway section in Shanghai, resulting in relatively homogeneous data and samples. Therefore, the empirical findings and conclusions should be interpreted primarily within the context of the studied freeway, rather than being directly generalized to other freeway systems. Future research should expand the data collection scope and conduct comparative analyses across freeways in different cities to validate and, where appropriate, extend the applicability of the proposed models and to gain a deeper and more generalizable understanding of the causal mechanisms of rear-end and sideswipe crashes.
Author Contributions
Conceptualization, M.F., J.Z. and J.W.; methodology, M.F., L.Z. and J.W.; software, M.F. and J.W.; validation, J.W. and Y.L.; formal analysis, M.F. and J.W.; investigation, J.Z. and Y.L.; resources, M.F., L.Z. and J.Z.; data curation, L.Z. and J.W.; writing—original draft preparation, M.F. and J.W.; writing—review and editing, M.F. and Y.L.; visualization, J.W. and L.Z.; supervision, J.Z., L.Z. and Y.L.; project administration, M.F. and Y.L.; funding acquisition, M.F. All authors have read and agreed to the published version of the manuscript.
Funding
This research was funded by the National Natural Science Foundation of China [grant number 52402429, 52372304], Shanghai Science & Technology Innovation Action Plan Project [grant number 24ZR1452800], Outstanding Engineer Joint Training Practice Base Project of University of Shanghai for Science and Technology, and Key Laboratory of Road and Traffic Engineering of the Ministry of Education, Tongji University [grant number K202405].
Institutional Review Board Statement
Ethical review and approval were not required for this study.
Informed Consent Statement
Participant consent was not necessary, as no personal or identifiable data were involved.
Data Availability Statement
The crash dataset used in this research is not publicly available due to confidentiality restrictions imposed by the data provider.
Conflicts of Interest
Author Yu Lin was employed by the company Shanghai Jinqiao Intelligent Connected Vehicle Development Co., Ltd. The remaining authors declare that the research was conducted in the absence of any commercial or financial relationships that could be construed as a potential conflict of interest.
Abbreviations
The following abbreviations are used in this manuscript:
| PLN | Poisson lognormal regression |
| CAR | Conditional autoregressive |
| Uni-PLN | Univariate Poisson Lognormal Regression Model |
| Uni-PLN-CAR | Univariate PLN CAR Model |
| Bi-PLN-CAR-cov | Bivariate PLN-CAR Model based on the Variance Covariance of Jointly Distributed Residuals |
| WAIC | Watanabe–Akaike Information Criterion |
| RMSLE | Root Mean Squared Logarithmic Error |
| MSAD | Mean Standardized Absolute Deviance |
| Bi-PLN-CAR-copula | Bivariate PLN-CAR Model based on Copula Functions |
Appendix A. Joint Likelihood and MultiBUGS Implementation
This appendix presents the joint likelihood formulation of the Frank copula-based Bi-PLN-CAR-Frank model and its implementation in MultiBUGS for reproducibility.
Appendix A.1. Model Specification
For each freeway segment , let and denote the observed crash counts for rear-end and sideswipe crashes, respectively. Conditional on the latent means and , the counts follow Poisson distributions:
The logarithms of the means are modeled by Poisson lognormal–CAR specifications:
where is the covariate vector for segment , and are regression coefficient vectors, is the spatial random effect that follows a conditional autoregressive prior, and are additional random effects capturing unexplained heterogeneity.
The marginal Poisson probability mass functions and the corresponding log-likelihood contributions are
The associated marginal distribution functions (Poisson CDFs), which are used to construct the copula, are given by
Appendix A.2. Log-Likelihood of the Frank Copula
To capture the dependence between the two crash types, we employ the Frank copula with association parameter . Following the standard expression in Copula Models for Dependence: Comparing Classical and Bayesian Approaches, the log-likelihood contribution of the Frank copula for given is
Appendix A.3. Joint Likelihood for a Single Segment and for the Full Sample
For each segment , the joint density of conditional on the parameter vector and the copula parameter is
where is the Frank copula density, whose logarithm is given by above.
The corresponding joint log-likelihood contribution for segment is
Therefore, the joint likelihood for all freeway segments and its log-transformed version are
Appendix A.4. MultiBUGS Code Snippet
For reproducibility, the core MultiBUGS code below shows how the above joint log-likelihood is implemented for the Bi-PLN-CAR-Frank model using the zero-trick. Only the part related to the joint likelihood is reported here, as shown in Listing A1.
| Listing A1. MultiBUGS code snippet for the Bi-PLN-CAR-Frank model. |
| # Zero-trick implementation of the joint likelihood for the |
| # Frank-copula Bi-PLN-CAR-Frank model |
| C <- 100000 # large constant for the zero-trick |
| for (i in 1:regions) { |
| # ---- Marginal log-likelihoods for the two Poisson outcomes ---- |
| l_marg1[i] <- -mu1[i] + sidewipe[i] * log(mu1[i]) - loggam(sidewipe[i] + 1) |
| l_marg2[i] <- -mu2[i] + rear[i] * log(mu2[i]) - loggam(rear[i] + 1) |
| # ---- CDFs of the Poisson marginals (u_i and v_i) ---- |
| u[i] <- cdf.pois(sidewipe[i], mu1[i]) + 0.0001 |
| v[i] <- cdf.pois(rear[i], mu2[i]) + 0.0001 |
| # ---- Frank copula density c_alpha(u_i, v_i) in log form ---- |
| e_a <- 1 / exp(alphac) # exp(-alpha) |
| t[i] <- 1 - e_a - (1 - 1/exp(alphac*u[i])) * (1 - 1/exp(alphac*v[i])) |
| t1[i] <- max(t[i], 0.0001) |
| l_copula[i] <- log(max(alphac, 0.0001)) + log(1 - e_a) - alphac * (u[i] + v[i]) - |
| 2 * log(t1[i]) |
| # ---- Joint log-likelihood for segment i ---- |
| loglik[i] <- l_marg1[i] + l_marg2[i] + l_copula[i] |
| # ---- Zero-trick: introduce a Poisson(φ_i) with mean φ_i = C - loglik_i ---- |
| zeros[i] <- 0 |
| phi[i] <- -loglik[i] + C |
| zeros[i] ~ dpois(phi[i]) |
| } |
References
- World Health Organization. Global Status Report on Road Safety 2023; World Health Organization: Geneva, Switzerland, 2023. [Google Scholar]
- World Health Organization. Road Traffic Injuries. Available online: https://www.who.int/news-room/fact-sheets/detail/road-traffic-injuries (accessed on 3 November 2025).
- The Traffic Management Bureau of the Ministry of Public Security of the People’s Republic of China. Annual Report on Road Traffic Accident Statistics (2019); Traffic Management Science Research Institute of the Ministry of Public Security: Wuxi, China, 2020. [Google Scholar]
- Ministry of Transport of the People’s Republic of China. Statistical Bulletin on the Development of the Transportation Industry in 2019. Available online: https://xxgk.mot.gov.cn/2020/jigou/zhghs/202006/t20200630_3321335.html (accessed on 3 November 2025).
- Office of the State Council Leading Group on Safety Production. Public Security System’s Three-Year Action Plan for Fundamental Safety Production (2024–2026). Available online: https://www.gov.cn/lianbo/bumen/202402/content_6930470.htm (accessed on 3 November 2025).
- Skaug, L.; Nojoumian, M.; Dang, N.; Yap, A. Road Crash Analysis and Modeling: A Systematic Review of Methods, Data, and Emerging Technologies. Appl. Sci. 2025, 15, 7115. [Google Scholar] [CrossRef]
- Beijing News. A Series of 29 Traffic Pile-Ups Occurred on the Shanxi Guoyang Section of the Erguang Expressway, Resulting in 1 Death and 6 Injuries. Available online: https://baijiahao.baidu.com/s?id=1784952458455163219&wfr=spider&for=pc (accessed on 3 November 2025).
- Christoforou, Z.; Cohen, S.; Karlaftis, M.G. Identifying Crash Type Propensity Using Real-Time Traffic Data on Freeways. J. Saf. Res. 2011, 42, 43–50. [Google Scholar] [CrossRef]
- Mao, X.; Yuan, C.; Gan, J.; Zhang, S. Risk Factors Affecting Traffic Accidents at Urban Weaving Sections: Evidence from China. Int. J. Environ. Res. Public Health 2019, 16, 1542. [Google Scholar] [CrossRef] [PubMed]
- Chen, F.; Song, M.; Ma, X. Investigation on the Injury Severity of Drivers in Rear-End Collisions between Cars Using a Random Parameters Bivariate Ordered Probit Model. Int. J. Environ. Res. Public Health 2019, 16, 2632. [Google Scholar] [CrossRef] [PubMed]
- Yang, B. Study on the Relationship Between Traffic Flow State and Crash Pattern on Freeway. Ph.D. Dissertation, Southeast University, Nanjing, China, 2020. [Google Scholar]
- Wang, X.; Feng, M. Freeway Single and Multi-Vehicle Crash Safety Analysis: Influencing Factors and Hotspots. Accid. Anal. Prev. 2019, 132, 105268. [Google Scholar] [CrossRef]
- Zeng, Q.; Gu, W.; Zhang, X.; Wen, H.; Lee, J.; Hao, W. Analyzing Freeway Crash Severity Using a Bayesian Spatial Generalized Ordered Logit Model with Conditional Autoregressive Priors. Accid. Anal. Prev. 2019, 127, 87–95. [Google Scholar] [CrossRef] [PubMed]
- Huang, H.; Ding, X.; Yuan, C.; Liu, X.; Tang, J. Jointly Analyzing Freeway Primary and Secondary Crash Severity Using a Copula-Based Approach. Accid. Anal. Prev. 2023, 180, 106911. [Google Scholar] [CrossRef]
- Qi, W.; Qin, S.; Zhu, S.; Fu, C. A Random Parameter Bivariate Approach for Modelling Freeway Crash Frequency by Severity Level. Transp. A Transp. Sci. 2025, 2466471. [Google Scholar] [CrossRef]
- Alsaleh, R.; Walia, K.; Moshiri, G.; Alsaleh, Y.T. Traffic Collision Severity Modeling Using Multi-Level Multinomial Logistic Regression Model. Appl. Sci. 2025, 15, 838. [Google Scholar] [CrossRef]
- Wang, J.; Ma, S.; Jiao, P.; Ji, L.; Sun, X.; Lu, H. Analyzing the Risk Factors of Traffic Accident Severity Using a Combination of Random Forest and Association Rules. Appl. Sci. 2023, 13, 8559. [Google Scholar] [CrossRef]
- Mothafer, G.I.M.A.; Yamamoto, T.; Shankar, V.N. A Multivariate Heterogeneous-Dispersion Count Model for Asymmetric Interdependent Freeway Crash Types. Transp. Res. Part B Methodol. 2018, 108, 84–105. [Google Scholar] [CrossRef]
- Hosseinpour, M.; Sahebi, S.; Zamzuri, Z.H.; Yahaya, A.S.; Ismail, N. Predicting Crash Frequency for Multi-Vehicle Collision Types Using Multivariate Poisson–Lognormal Spatial Model: A Comparative Analysis. Accid. Anal. Prev. 2018, 118, 277–288. [Google Scholar] [CrossRef]
- Zhang, C.; He, J.; Bai, C.; Yan, X.; Wang, C.; Guo, Y. Exploring Relationships between Months and Different Crash Types on Mountainous Freeways Using a Combined Modeling Approach. J. Adv. Transp. 2022, 2022, 6716275. [Google Scholar] [CrossRef]
- Bisht, L.S.; Tiwari, G. Assessment of Fatal Rear-End Crash Risk Factors of an Expressway in India: A Random Parameter NB Modeling Approach. J. Transp. Eng. Part A Syst. 2023, 149, 04022111. [Google Scholar] [CrossRef]
- Guo, H.; Xie, K.; Keyvan-Ekbatani, M. Modeling Driver’s Evasive Behavior During Safety–Critical Lane Changes: Two-Dimensional Time-to-Collision and Deep Reinforcement Learning. Accid. Anal. Prev. 2023, 186, 107063. [Google Scholar] [CrossRef] [PubMed]
- Rusli, R.; Haque, M.M.; Afghari, A.P.; King, M. Applying a Random Parameters Negative Binomial Lindley Model to Examine Multi-Vehicle Crashes along Rural Mountainous Highways in Malaysia. Accid. Anal. Prev. 2018, 119, 80–90. [Google Scholar] [CrossRef] [PubMed]
- Wang, X.; Li, S.; Li, X.; Wang, Y.; Zeng, Q. Effects of Geometric Attributes of Horizontal and Sag Vertical Curve Combinations on Freeway Crash Frequency. Accid. Anal. Prev. 2023, 186, 107056. [Google Scholar] [CrossRef] [PubMed]
- Xu, C.; Gao, J.; Zuo, F.; Ozbay, K. Estimating Urban Traffic Safety and Analyzing Spatial Patterns through the Integration of City-Wide Near-Miss Data: A New York City Case Study. Appl. Sci. 2024, 14, 6378. [Google Scholar] [CrossRef]
- Aguero-Valverde, J. Multivariate Spatial Models of Excess Crash Frequency at Area Level: Case of Costa Rica. Accid. Anal. Prev. 2013, 59, 365–373. [Google Scholar] [CrossRef]
- Ma, X.; Chen, S.; Chen, F. Multivariate Space–Time Modeling of Crash Frequencies by Injury Severity Levels. Anal. Methods Accid. Res. 2017, 15, 29–40. [Google Scholar] [CrossRef]
- Wei, F.; Cai, Z.; Wang, Z.; Guo, Y.; Li, X.; Wu, X. Investigating Rural Single-Vehicle Crash Severity by Vehicle Types Using Full Bayesian Spatial Random Parameters Logit Model. Appl. Sci. 2021, 11, 7819. [Google Scholar] [CrossRef]
- Champahom, T.; Jomnonkwao, S.; Karoonsoontawong, A.; Ratanavaraha, V. Spatial Zero-Inflated Negative Binomial Regression Models: Application for Estimating Frequencies of Rear-End Crashes on Thai Highways. J. Transp. Saf. Secur. 2022, 14, 523–540. [Google Scholar] [CrossRef]
- Hu, Y.; Wei, H.; Zeng, Q. Analysis of Freeway Crash Severity Based on Spatial Generalized Ordered Probit Model. J. South China Univ. Technol. 2023, 51, 114–122. [Google Scholar]
- Rahman, M.A.; Moomen, M.; Khan, W.A.; Codjoe, J. An Analysis of the Impact of Injury Severity on Incident Clearance Time on Urban Interstates Using a Bivariate Random-Parameter Probit Model. Stats 2024, 7, 863–874. [Google Scholar] [CrossRef]
- Alanazi, F.; Alruwaili, A.; Shtayat, A. MRI-Copula: A Hybrid Copula–Machine Learning Framework for Multivariate Risk Indexing in Urban Traffic Safety. Sustainability 2025, 17, 9210. [Google Scholar] [CrossRef]
- Tahir, H.B.; Yasmin, S.; Haque, M.M. A Poisson Lognormal-Lindley Model for Simultaneous Estimation of Multiple Crash-Types: Application of Multivariate and Pooled Univariate Models. Anal. Methods Accid. Res. 2024, 41, 100315. [Google Scholar] [CrossRef]
- Ahmad, N.; Gayah, V.V.; Donnell, E.T. Copula-Based Bivariate Count Data Regression Models for Simultaneous Estimation of Crash Counts Based on Severity and Number of Vehicles. Accid. Anal. Prev. 2023, 181, 106928. [Google Scholar] [CrossRef]
- Faden, A.; Abdel-Aty, M.; Wang, C.; Yang, S. Short-Term Safety Analysis and Interdependencies of Mixed-Operation Freeways with Fully Separated Express Lanes: A Copula-Based Poisson Lognormal Lindley Approach. Accid. Anal. Prev. 2025, 217, 108050. [Google Scholar] [CrossRef]
- American Association of State Highway and Transportation Officials. Highway Safety Manual, 1st ed.; AASHTO: Washington, DC, USA, 2010. [Google Scholar]
- Wang, J.; He, S.; Zhai, X.; Wang, Z.; Fu, X. Estimating Mountainous Freeway Crash Rate: Application of a Spatial Model with Three-Dimensional (3D) Alignment Parameters. Accid. Anal. Prev. 2022, 170, 106634. [Google Scholar] [CrossRef] [PubMed]
- Gedamu, W.T.; Plank-Wiedenbeck, U.; Wodajo, B.T. A Spatial Autocorrelation Analysis of Road Traffic Crash by Severity Using Moran’s I Spatial Statistics: A Comparative Study of Addis Ababa and Berlin Cities. Accid. Anal. Prev. 2024, 200, 107535. [Google Scholar] [CrossRef]
- BUGS User Manual—MultiBUGS v2.0. Available online: https://www.multibugs.org/documentation/latest/spatial/SpatialDistributions.html (accessed on 3 November 2025).
- Besag, J.; York, J.; Mollié, A. Bayesian Image Restoration, with Two Applications in Spatial Statistics. Ann. Inst. Stat. Math. 1991, 43, 59. [Google Scholar] [CrossRef]
- Sklar, A. Fonctions de Répartition à N Dimensions et Leurs Marges. Publ. Inst. Stat. Univ. Paris 1959, 8, 229–231. [Google Scholar]
- Nelsen, R.B. An Introduction to Copulas; Springer: New York, NY, USA, 2006. [Google Scholar]
- Bedford, T.; Cooke, R.M. Probability Density Decomposition for Conditionally Dependent Random Variables Modeled by Vines. Ann. Math. Artif. Intell. 2001, 32, 245–268. [Google Scholar] [CrossRef]
- Tamakloe, R.; Hong, J.; Park, D. A Copula-Based Approach for Jointly Modeling Crash Severity and Number of Vehicles Involved in Express Bus Crashes on Expressways Considering Temporal Stability of Data. Accid. Anal. Prev. 2020, 146, 105736. [Google Scholar] [CrossRef] [PubMed]
- Feng, M.; Wang, X.; Li, Y. Analyzing Single-Vehicle and Multi-Vehicle Freeway Crashes with Unobserved Heterogeneity. J. Transp. Saf. Secur. 2023, 15, 59–81. [Google Scholar] [CrossRef]
- Brooks, S.P.; Gelman, A. General Methods for Monitoring Convergence of Iterative Simulations. J. Comput. Graph. Stat. 1998, 7, 434–455. [Google Scholar] [CrossRef]
- Barua, S.; El-Basyouny, K.; Islam, M.T. Multivariate Random Parameters Collision Count Data Models with Spatial Heterogeneity. Anal. Methods Accid. Res. 2016, 9, 1–15. [Google Scholar] [CrossRef]
- Li, P.; Abdel-Aty, M.; Yuan, J. Using Bus Critical Driving Events as Surrogate Safety Measures for Pedestrian and Bicycle Crashes Based on GPS Trajectory Data. Accid. Anal. Prev. 2021, 150, 105924. [Google Scholar] [CrossRef]
- Zhang, Z.; Yang, W.; Wushour, S. Traffic Accident Prediction Based on LSTM–GBRT Model. J. Control Sci. Eng. 2020, 2020, 4206919. [Google Scholar] [CrossRef]
- Yu, R.; Abdel-Aty, M. Multi-Level Bayesian Analyses for Single- and Multi-Vehicle Freeway Crashes. Accid. Anal. Prev. 2013, 58, 97–105. [Google Scholar] [CrossRef]
- Qin, X.; Ivan, J.N.; Ravishanker, N.; Liu, J.; Tepas, D. Bayesian Estimation of Hourly Exposure Functions by Crash Type and Time of Day. Accid. Anal. Prev. 2006, 38, 1071–1080. [Google Scholar] [CrossRef] [PubMed]
- Phan, D.C.; Truong, L.T. Traffic Congestion and Safety: Mixed Effects on Total and Fatal Crashes. Sustainability 2024, 16, 8911. [Google Scholar] [CrossRef]
- Zhao, J.; Liu, Q. Quantitative Causality Assessment between Traffic States and Crash Risk in Freeway Segments with Closely Spaced Entrance and Exit Ramps. Phys. A Stat. Mech. Appl. 2024, 637, 129587. [Google Scholar] [CrossRef]
Disclaimer/Publisher’s Note: The statements, opinions and data contained in all publications are solely those of the individual author(s) and contributor(s) and not of MDPI and/or the editor(s). MDPI and/or the editor(s) disclaim responsibility for any injury to people or property resulting from any ideas, methods, instructions or products referred to in the content. |
© 2025 by the authors. Licensee MDPI, Basel, Switzerland. This article is an open access article distributed under the terms and conditions of the Creative Commons Attribution (CC BY) license (https://creativecommons.org/licenses/by/4.0/).