Abstract
Driver distraction remains one of the leading causes of traffic accidents. Although deep learning approaches such as Convolutional Neural Networks (CNNs), Recurrent Neural Networks (RNNs), and Transformers have been extensively applied for distracted driving detection, their performance is often hindered by limited real-time efficiency and high false detection rates. To address these challenges, this paper proposes an efficient dual-stream neural architecture, termed DualStream-AttnXGS, which jointly leverages visual and pose information to improve distraction recognition accuracy. In the RGB stream, an enhanced EfficientNetB0 backbone is employed, where Ghost Convolution and Coordinate Attention modules are integrated to strengthen feature representation while maintaining lightweight computation. A compound loss function combining Center Loss and Focal Loss is further introduced to promote inter-class separability and stabilize training. In parallel, the keypoint stream extracts human skeletal features using YOLOv8-Pose, which are subsequently classified through a compact ensemble model based on XGBoost v2.1.4 and Gradient Boosting. Finally, a Softmax-based probabilistic fusion strategy integrates the outputs of both streams for the final prediction. The proposed model achieved 99.59% accuracy on the SFD3 dataset while attaining 99.12% accuracy on the AUCD2 dataset, demonstrating that the proposed dual-stream architecture provides a more effective solution than single-stream models by leveraging complementary visual and pose information.
1. Introduction
Driver inattention is recognized as one of the major causes of traffic accidents [1]. According to the Global Status Report on Road Safety 2023 published by the World Health Organization (WHO), approximately 1.19 million people die in road traffic accidents each year worldwide [2]. Although the global traffic fatality rate has declined by about 5% since 2010, it still falls short of the United Nations’ goal of halving deaths by 2030 [3]. The Traffic Safety Facts Research Note released by the U.S. National Highway Traffic Safety Administration (NHTSA) in 2022 reported that distracted driving was involved in 8% of fatal crashes (resulting in 3308 deaths), 12% of injury crashes (289,310 injuries), and 11% of all police-reported motor vehicle crashes (853,053 incidents) [4]. Furthermore, estimates based on naturalistic observation samples indicate that distraction-related crashes account for nearly 29% of total traffic accidents, leading to approximately 10,546 deaths and 1.3 million injuries [5]. In the Asian region, official statistics from the Ministry of Road Transport and Highways (MoRTH) of India reported 153,972 traffic deaths in 2021 [6]. Another media report indicated that in 2023, the number of road traffic fatalities in India rose to approximately 173,000, with 463,000 people injured [7]. These data highlight that achieving efficient and real-time detection of driver distraction in real-world road environments is of critical significance for reducing accident rates and minimizing traffic casualties [8].
Common manifestations of driver distraction include telephoning, drinking, looking backward, and operating in-vehicle devices. Traditional methods for detecting driver distraction mainly rely on single-modality information and single-stream networks, such as convolutional neural networks (CNNs) based on RGB images [9], recurrent neural networks (RNNs) utilizing temporal sequences [10], and the recently emerging Transformer-based models [11]. Although these methods can achieve high accuracy in controlled environments, they exhibit major shortcomings in complex and realistic traffic scenarios, including: (1) substantial degradation of recognition accuracy under varying illumination, occlusion, or rapid posture change [12]; (2) complex feature extraction and inference processes with large model parameters, making it difficult to meet the real-time requirements of in-vehicle systems and mobile devices [13]; and (3) insufficient robustness of single-modality systems in specific conditions, which makes them vulnerable to noise and abnormal actions, resulting in increased false detection rates [14].
To address these limitations, recent research has shifted toward multimodal fusion methods for driver distraction detection, combining visual information with other sensory or feature modalities to enhance model robustness and generalization capability [15]. Recent studies have demonstrated that integrating RGB images with pose keypoint features can effectively capture both driver appearance and motion characteristics. For instance, the PoseViNet model fuses multi-view pose estimation with a visual Transformer and achieves accuracies of 97.55% and 90.92% on the SFD3 and SynDD1 datasets, respectively [16]. Similarly, DSDFormer integrates a dual-state attention mechanism and Temporal Reliability Confidence Learning (TRCL), improving both detection precision and real-time performance, and achieving successful deployment on embedded platforms such as the Jetson AGX Orin [17]. These findings demonstrate that multimodal fusion constitutes a promising approach to enhance distraction detection performance. However, there remains considerable room for improvement in terms of model lightweighting, optimization of fusion strategies, and enhancement of detection precision [18].
In response to the above challenges, this study proposes a dual-stream neural network that integrates RGB images and human keypoint features for accurate driver distraction detection. The RGB branch uses an improved EfficientNetB0 with Ghost convolution and Coordinate Attention to enhance visual feature extraction. Additionally, a combined loss function, consisting of Center Loss and Focal Loss, is introduced specifically for the RGB stream to enhance inter-class separability and model robustness. The keypoint branch uses YOLOv8-Pose to extract keypoint features. The fusion strategy is based on the Softmax classification probabilities output by the two-branch models, introducing a dynamic weight parameter α to adaptively adjust the fusion weight, ensuring optimal contribution from each branch based on varying input conditions.
Our model has advantages in addressing real-time processing, feature extraction complexity, and robustness. The fusion model reduces size to 25 MB while ensuring efficient real-time processing at 30 FPS. Additionally, the dual-stream architecture enhances robustness by combining RGB and keypoint data, reducing the impact of noise and abnormal behaviors, and minimizing false detection rates.
Experimental results demonstrate that the proposed dual-stream network achieves 99.59% accuracy on the SFD3 dataset and 99.12% on the AUCD2 dataset, confirming its high precision across different environments. The model’s compact design and reliance on cost-effective camera sensors make it highly suitable for practical applications in real-world distraction detection scenarios.
2. Related Work
Driver distraction detection remains a critical research focus in intelligent transportation systems. Early efforts concentrated on extracting limited features from vehicle dynamics or overt driver behaviors to quantify attentional states. In recent years, advancements in deep learning and multimodal perception technologies have shifted research toward end-to-end detection and recognition systems integrating visual, physiological, audio, and vehicle signals. The following sections review progress in four areas: traditional methods, vision-based deep learning, multimodal fusion, and lightweight real-time detection.
Early research relied on manual features and statistical algorithms to model driver behavior. Wöllmer et al. [19] introduced recurrent neural networks (RNNs) for driver distraction detection, proposing an online system based on long short-term memory (LSTM) networks. Using signals such as steering wheel angle, speed, and head movement, their model achieved 96.6% accuracy in a binary classification task, outperforming traditional RNN and SVM models. This work demonstrated that capturing temporal dependencies in driving behavior enhances detection stability and real-time performance, providing a foundation for future temporal modeling approaches.
With the rapid advancement of computer vision, research focus has gradually shifted toward directly learning discriminative features of driving behaviors from images using CNN architectures. Huang et al. [20] proposed the Hybrid Convolutional Framework (HCF), which integrates multi-scale features from three pretrained models—ResNet-50, Inception-V3 and Xception—to recognize distracted driving behaviors. HCF achieved a validation accuracy of 96.74% on the State Farm dataset, significantly outperforming single-model approaches. Class activation mapping analysis revealed the method’s ability to focus on key regions such as hand movements and phone usage, thereby reducing misclassifications while meeting the real-time inference requirement of 41 ms.
Building upon this, Xiao et al. [21] proposed Attention-based Deep Neural Networks (ADNet), embedding channel attention and spatial attention modules within residual networks to effectively model inter-channel and inter-spatial dependencies. ADNet achieved a maximum classification accuracy of 98.42% on the AUC and HNU datasets, validating the advantages of attention mechanisms in dynamic behavior recognition. Such research marks the transition of driver behavior recognition from traditional classifiers to deep networks with adaptive feature learning, laying the foundation for subsequent multimodal fusion.
In recent years, researchers have explored multimodal architectures integrating visual, physiological, and vehicle dynamics data to enhance model adaptability to complex traffic scenarios. Mou et al. [22] proposed a dual-channel network combining CNN and Transformer for distracted driving detection. The CNN channel focuses on local temporal feature extraction, while the Transformer channel enhances global context modeling. This model achieved 99.8% accuracy and 99.998% AUC on a multimodal dataset incorporating vehicle dynamics, eye movements, and physiological signals, significantly outperforming models like VGG-16 and ResNet-18. Further ablation experiments validated the effectiveness of the dual-channel architecture and attention modules.
In another direction of multimodal fusion, Rashid et al. [23] proposed the Self-DSNet framework, introducing Self-ONNs into deep learning networks to enhance complex pattern learning capabilities. By integrating visual, steering, and physiological signals, the model achieves 95.13% accuracy on a four-class task (normal, cognitive, emotional, and sensorimotor distraction) and 97.32% on a binary classification task. Meanwhile, Noh et al. [24] proposed the Bio-Vision Transformer (BiViT), which achieves an F1 score of 0.91 on the AI-Hub dataset by enabling cross-modal attention to align and fuse features under joint input conditions combining ECG and other physiological signals with visual images.
These studies demonstrate that the Transformer architecture, leveraging global dependency modeling and attention-weighted mechanisms, can capture complex spatio-temporal correlations across multi-source signals. The research by Mou et al. [22] and Noh et al. [24] collectively demonstrates the complementary strengths of CNNs and Transformers: the former excels at local representations, while the latter enables global perception, thereby achieving more robust driving state detection.
Research on driver cognitive distraction has gained attention, with studies exploring eye-tracking, physiological, and vehicle data. Misra et al. [25] used random forests, decision trees, and SVMs to build cognitive distraction models, finding that pupil area and movement were key indicators, with random forests achieving 90% accuracy. Soumya and Mythili [26] proposed the MPS-DCDD-SDRGNN framework, leveraging EEG data and spectral domain re-gridded graph neural networks (SDRGNN) to capture cognitive state changes. This model, using local window attention (ViT) and hyperparameter optimization, improved F1 score by 25.5% over traditional CNNs, enhancing driver cognitive load recognition. These studies highlight the potential of non-visual information for cognitive distraction detection, paving the way for non-invasive, multidimensional driver monitoring systems.
In intelligent driving engineering applications, network lightweighting and real-time performance are equally critical. Gu et al. [27] proposed the ATD2Net architecture for synergistic optimization of small targets and lightweight networks, incorporating a Channel Reconstruction Perception Module (CRPM), Dynamic Spatial Self-Locking Module (DSSM), and Structural Feedback Optimization Module (SFOM). On the LDDB and State Farm datasets, ATD2Net achieved mAP scores of 98.2% and 96.4%, respectively, with only 3.21M parameters. Deployed on Jetson TX2, it achieves an inference latency of 34.6 ms, demonstrating an excellent accuracy-efficiency tradeoff. This research provides an efficient and feasible solution for real-time in-vehicle embedded distraction detection, further advancing the practical application of lightweight object recognition in driving safety.
In practical deployments, real-time performance and computational efficiency are critical for low-cost ADAS, especially on edge devices. Muñoz et al. [28] proposed a real-time traffic alert system combining multi-deep learning (Multi-DL) and fuzzy logic, addressing camera coverage and classification ambiguity. The system achieved 90% accuracy in traffic image classification, outperforming single models by 6%. Guerrero-Contreras et al. [29] introduced a low-cost ADAS that estimates vehicle distances using monocular cameras and lane width as a reference, validated on the BDD100K and TuSimple datasets. The optimized model achieved 61.98% vehicle detection accuracy with a processing time of 33.85 ms and successfully deployed on edge devices (Raspberry Pi 4 and Radxa Zero 3W) with real-time speeds of 265–680 ms per frame, offering a feasible solution for low-cost vehicle safety.
Overall, driver distraction detection technology has evolved from shallow classifiers relying on manual features to end-to-end networks integrating multimodal signals and deep structures [19,20,21,22,23,24,25,26,27]. Early LSTM and CNN models emphasized temporal or spatial feature learning, while mid-stage research introduced attention mechanisms and Transformers to model global dependencies. Recent work focuses on multimodal fusion and network lightweighting to meet real-time deployment demands [28,29]. Future trends will integrate cognitive, physiological, and visual information sources to achieve high-accuracy, low-latency, and interpretable driver distraction detection systems through cross-modal attention and structural optimization.
3. Materials and Methods
3.1. Data Preprocessing
This study utilizes the publicly available State Farm Distracted Driver Detection (SFD3) dataset and the AUC Distracted Driver (AUCD2) dataset to develop and train a multimodal dual-stream neural network model. The combined use of these two datasets enables comprehensive evaluation of the model’s generalization capability across different driving scenarios and diverse driver populations.
The State Farm Distracted Driver Detection (SFD3) dataset, released by the State Farm Insurance (SFI) Company through a public Kaggle competition, is a widely used benchmark for distracted driving recognition. It contains approximately 102,150 images captured under real driving conditions, of which 22,424 samples are manually annotated into ten distracted driving behavior categories [30]. The category distribution is summarized in Table 1, and representative examples are shown in Figure 1.

Table 1.
Brief details of the SFD3 dataset.
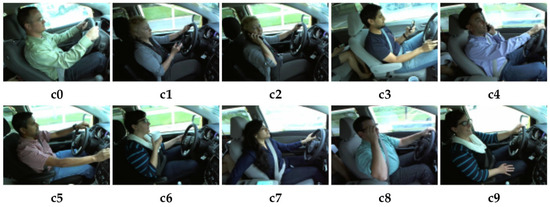
Figure 1.
Visual representation of SFD3 dataset, where details of c0 to c9 are shown in Table 1.
The AUC Distracted Driver (AUCD2) dataset, introduced by Abouelnaga et al. [9], is another challenging dataset designed to capture substantial inter-driver variability. It includes 11,678 images collected from thirty-one drivers of different nationalities, covering ten driver behavior categories as listed in Table 2. Example images from the dataset are illustrated in Figure 2.
Table 2.
Brief details of AUCD2 dataset.
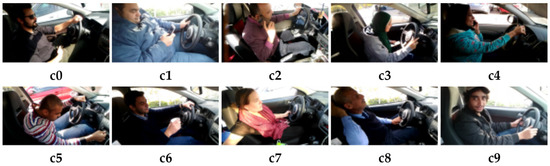
Figure 2.
Visual representation of AUCD2 dataset; details of c0 to c9 are shown in Table 2.
For both datasets, we adopt a consistent data-splitting strategy, dividing the samples into training 70%, validation 15% and testing 15%. This unified partitioning approach ensures comparable experimental settings and enables a more reliable assessment of the model’s generalization capability across different data sources.
3.1.1. Dataset Loading and Partitioning
In the data preprocessing stage, a systematic category annotation and labeling procedure was implemented to ensure the consistency and usability of the behavioral image dataset. The raw data were organized and annotated according to the folder structure, where each folder name indicates a specific driving behavior. On this basis, a one-to-one mapping between behavioral categories and their corresponding numerical identifiers was established, thereby converting the categorical labels into machine-readable form and facilitating subsequent model training.
3.1.2. Image Resizing and Normalization
To unify model input formats and enhance training stability, we resized and pixel-normalized the original images. All images were uniformly scaled to a resolution of 224 × 224 to meet the input requirements of the backbone network architecture. Subsequently, each channel of the images underwent normalization, mapping pixel values from the range [0, 1] to a standard normal distribution. Let the pixel values of an image be . The normalization formula for each channel is:
where and represent the mean and standard deviation of channel c, respectively. This study adopts the standard parameters from the ImageNet dataset as the normalization basis. This normalization operation not only enhances the comparability of input features across channels but also effectively mitigates numerical instability during gradient propagation, thereby accelerating the model’s training convergence. The specific values are as follows:
Furthermore, uniform size adjustment ensures dimensional alignment between input images and neural network structures, promoting consistency in feature extraction and reusability in network deployment. The comprehensive preprocessing workflow establishes a reliable data foundation for subsequent feature learning and multimodal fusion.
3.1.3. Data Augmentation
To improve model generalization and reduce overfitting, several common data augmentation strategies were applied during training. Spatial augmentations included random horizontal and vertical flipping, which increased viewpoint diversity. Appearance augmentations consisted of random brightness and contrast adjustments, where the intensity of each operation was sampled within predefined ranges. All augmentation steps were performed online during training in the following sequence: RGB conversion, random flipping, contrast adjustment, brightness adjustment, and BGR conversion. These operations increased the variability of geometric poses and illumination conditions, thereby enhancing the model’s robustness in complex driving environments [31].
3.2. Overview of the Dual-Stream Neural Network Architecture
Given the diverse, fine-grained, and highly dynamic nature of driver distraction behaviors, we propose a dual-stream neural network architecture that integrates multimodal information to enhance the model’s ability to recognize complex driving behaviors [32]. This architecture comprises two independent yet collaborative branches: the RGB image stream extracts visual appearance features, while the human body keypoint stream captures posture information.
Specifically, the RGB image stream processes raw driving footage to capture static visual features such as facial expressions, hand gestures, and environmental context. The keypoint stream, based on human keypoint detection results, extracts structural behavioral cues, including driver posture and limb movements. After independent feature extraction, the outputs from both streams undergo multimodal decision-making through confidence-weighted fusion. This strategy effectively enhances the model’s ability to distinguish distracting behaviors and improves robustness while balancing image content and action semantics. This dual-stream architecture not only leverages complementary information across modalities but also offers strong scalability and real-time performance, laying a structural foundation for subsequent feature fusion, attention modeling, and multi-task collaboration. Figure 3 shows the architecture of the proposed dual-stream neural network.
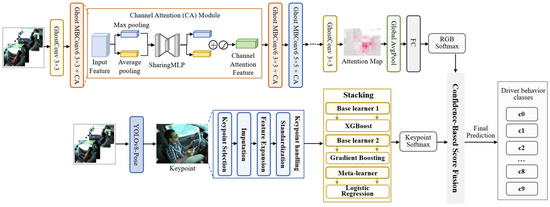
Figure 3.
Dual-Stream Neural Network Architecture Diagram.
3.3. RGB Image Stream
In the multimodal dual-stream neural network, the RGB image branch primarily extracts semantic and textural features from visible-light images and serves as the main visual pathway for perceiving driving behavior. An enhanced EfficientNetB0 is adopted as the backbone for feature extraction, whose architecture is illustrated in Figure 4. The integration of the CA mechanism and Ghost convolution further strengthens spatial–channel representation while reducing model size. The RGB stream is trained using SGD with a learning rate of 0.001, a weight decay of 1 × 10⁻⁴, a batch size of 32, and a total of 50 epochs to ensure stable optimization. To improve category discrimination and enhance training stability, a combined loss function composed of Center Loss and Focal Loss is introduced, enhancing performance without increasing computational overhead.
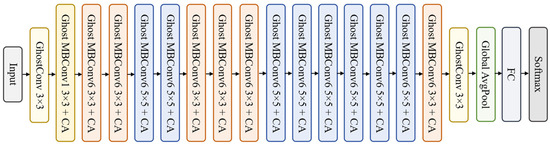
Figure 4.
EfficientNetB0 architecture.
EfficientNetB0 is an efficient convolutional neural network architecture proposed by Google [33]. It achieves structural optimization across depth, width, and resolution through compound scaling. Its architecture builds upon the inverted residual structure (MBConv) introduced in MobileNetV2, utilizing lightweight separable convolutions and the Swish activation function, mathematically defined as:
This significantly reduces computational complexity while maintaining accuracy. Compared to traditional networks, EfficientNetB0 achieves an excellent balance of accuracy and efficiency on ImageNet, making it an ideal choice for edge deployment and real-time detection scenarios.
To enhance the network’s ability to focus on behavior-related regions, a CA module is added after the EfficientNetB0 backbone, enabling joint encoding of spatial and channel information with improved localization capability [34]. Standard convolutions are replaced with Ghost convolutions to reduce redundancy and computational cost, supporting lightweight deployment. The classifier is further optimized with a combined loss function: Focal Loss mitigates imbalance-induced bias, while Center Loss promotes intra-class compactness and improves feature discriminability [35]. These enhancements collectively strengthen accuracy, robustness, and generalization, providing a solid visual foundation for multimodal fusion.
3.3.1. Coordinate Attention Mechanism
To further enhance the model’s representation of spatial structure and channel features, this paper introduces the Coordinate Attention (CA) mechanism into the backbone network of the RGB image stream [36]. This aims to capture both spatial positional information and inter-channel dependencies without significantly increasing computational burden.
Unlike traditional SE modules that compress spatial information solely through global average pooling, the CA mechanism employs a coordinate-directional attention encoding strategy. It decomposes two-dimensional spatial information into one-dimensional encodings along the horizontal (x-axis) and vertical (y-axis) dimensions, thereby preserving positional information and enhancing attention expressiveness.
Global average pooling is performed along the height (H) and width (W) dimensions, yielding two feature maps:
where is the input feature map.
Cascade and , then feed them into a shared 1D convolution operation (with ReLU activation) for feature compression:
where δ denotes the ReLU function.
Apply two independent 1D convolutions to the fused intermediate features to generate horizontal and vertical attention weights:
where σ denotes the Sigmoid activation function. α and β correspond to H × 1 and 1 × W attention weights, respectively.
The final output is the element-wise product of the input feature map and the attention weights:
Through this mechanism, the model accurately captures crucial spatial cues of “where the driver looks” and “what actions are performed,” significantly enhancing the accuracy of distracted driving detection. Compared to traditional attention mechanisms, the CA module preserves inter-channel dependencies while further integrating positional information. This enables the network to discern subtle yet critical behavioral differences in images (e.g., phone use, instrument panel adjustments) with greater discriminative power. Furthermore, the lightweight structure and reduced computational demands of the CA module substantially enhance the model’s perception of local behavioral patterns without significantly increasing parameter overhead. This mechanism elevates the model’s ability to model fine-grained features in complex driving scenarios, laying the foundation for robust, real-time distraction detection.
3.3.2. Ghost Convolution
To further enhance computational efficiency and inference speed while preserving the ability to perceive fine-grained behavioral differences in driver images, this paper introduces the Ghost Convolution module into the RGB image branch [37]. First proposed by Han et al., Ghost Convolution aims to achieve efficient feature representation with fewer parameters and computations. It is a lightweight convolution operator particularly suited for visual tasks in resource-constrained environments.
The core idea of Ghost Convolution is to decompose the traditional convolution operation into two parts:
- Primary Convolution generates essential features;
- Cheap Operations, such as per-channel depthwise separable convolution, generate redundant representations from existing features, significantly reducing parameter count and computational overhead.
In this study, we replace some standard convolution layers in EfficientNetB0 with Ghost Convolution to reduce model complexity and enhance practical inference speed. Specifically, for 1 × 1 convolution layers, Ghost modules directly substitute the original layers. For depthwise convolutions and projection layers, their structures are retained while Ghost modules are applied at necessary positions to balance lightweight implementation with expressive capability.
3.3.3. Combined Focal–Center Loss
In driver distraction detection tasks, significant class imbalance exists between image categories. For instance, “safe driving” samples vastly outnumber abnormal categories like “phone calls” or “drinking water,” potentially degrading the model’s recognition capability for minority classes. Simultaneously, minor feature differences exist between similar categories—e.g., “adjusting 2N the dashboard” and “making a phone call” both involve right-hand movements—increasing misclassification risks. To enhance model discrimination and training stability, this paper introduces the Combined Focal–Center Loss function. This loss optimizes class boundaries and improves sensitivity toward hard-to-distinguish samples.
This composite loss consists of two components. Focal Loss addresses class imbalance by assigning higher weights to hard-to-classify samples, thereby suppressing excessive focus on easy-to-classify samples. Its loss function is defined as follows:
where is the predicted probability of the correct class, γ is the focus factor, and is the class balance factor. This paper sets γ = 2.0 and to effectively enhance learning capability for hard samples, with γ = 2.0 focusing on difficult samples and addressing class imbalance by giving more weight to minority classes.
Center Loss optimizes intra-class compactness and inter-class separation [38]. This loss enhances discriminative power in the feature space by pulling the feature vectors of samples within each class toward their respective class centers. It is defined as:
where is the feature vector of the i-th sample, is its class center, N is the batch size, and λ controls the loss weight. To ensure stability in feature normalization, L2 regularization is employed with λ = 0.1.
The combined total loss is [39]:
This combination strategy not only enhances the model’s focus on hard-to-classify samples but also further compresses the spatial distribution of intra-class features. This improves the discriminative boundaries between different driving behaviors, making it particularly suitable for high-similarity behavior recognition and multi-class fine-grained classification tasks. The loss terms are weighted equally as they contribute to complementary aspects of learning, balancing class separability and model robustness.
3.4. Human Keypoint Stream
To enhance the model’s understanding of the driver’s dynamic behavioral characteristics, this paper constructs a second branch based on human keypoints, termed the Pose-Based Stream [40]. This branch characterizes the driver’s posture from a spatial perspective, supplementing the semantic information gaps in the RGB image stream. This module comprises two stages:
- Keypoint detection using YOLOv8-Pose.
- Action classification via a stacked ensemble model.
After extracting 17 keypoint coordinates from raw images, these undergo normalization and feature engineering before being fed into a lightweight ensemble classifier to identify specific driving behavior categories.
3.4.1. YOLOv8-Pose Keypoint Detection
This paper employs the lightweight YOLOv8-Pose model for pose estimation and human keypoint extraction from driver images. Deployed in ONNX format, this model supports efficient inference in GPU environments. YOLOv8-Pose outputs 17 keypoint features per human body, including x-coordinate, y-coordinate, and confidence value for each point. Considering the relative importance of certain keypoints in driving behavior recognition, this study selected the top 11 keypoints and extracted their 2D coordinates (totaling 22-dimensional features) for subsequent classification tasks. If the number of detected keypoints is insufficient, zeros are padded to maintain a fixed feature vector length. Additionally, to enhance visibility and model debugging efficiency, keypoint locations and skeleton connection lines are overlaid on the original image, providing an intuitive visualization of pose distribution. Figure 5 shows the processed image.
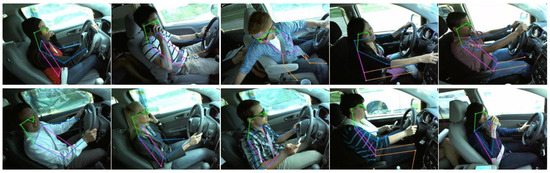
Figure 5.
Visualization of the detected human keypoints and skeletal connections.
3.4.2. Stacked Model
To further enhance the classification performance of keypoint streams for driving behaviors, this paper employs a stacked ensemble framework using XGBoost and Gradient Boosting as base learners to achieve improved robustness and generalization [41]. The 22-dimensional keypoint coordinates first undergo missing-value imputation, normalization, and expansion with second-order interaction features to enrich their geometric representation. These processed features are then fed into both base learners—configured with a learning rate of 0.1, 300 estimators, a maximum depth of 5, and a subsample ratio of 0.8—to obtain stable multi-class probability outputs [42]. To integrate these complementary predictions, a polynomial logistic regression meta-learner is trained on validation-set probabilities, enabling it to learn nonlinear fusion weights. This multi-stage ensemble structure effectively leverages both individual model strengths and cross-model complementarities, resulting in more accurate and reliable behavior recognition.
3.5. Multimodal Information Fusion Strategy
To fully leverage the complementarity between image semantic information and behavioral structural features, this paper proposes a confidence-weighted multimodal fusion strategy [17]. This approach integrates RGB image streams with human keypoint streams at the decision layer to enhance the accuracy and robustness of driver distraction behavior recognition. Specifically, the fusion strategy is based on the softmax classification probabilities output by two-branch models, introducing a dynamic weight parameter α to adaptively adjust the fusion weight:
Here, and denote the category probability vectors output by the RGB image branch (based on an enhanced EfficientNet backbone) and the keypoint branch (based on a stacked ensemble model), respectively. The fusion weight α is determined by the prediction confidence of both branches, calculated as:
where and , i.e., the highest-confidence category probability within each branch serves as its reliability metric. Through this mechanism, the model dynamically evaluates the prediction reliability of each branch on the current sample, enabling more reasonable information fusion ratios and mitigating classification bias caused by uncertainty in a single branch’s output.
Furthermore, to validate the effectiveness of the fusion strategy, comparative experiments were conducted between single-stream outputs and the fused results. The results demonstrate that the fusion strategy significantly outperforms any single-branch model in terms of accuracy, F1 score, and precision–recall performance. This indicates that the proposed multimodal fusion method effectively integrates information from different perspective sources, enhancing the model’s generalization capability in complex driving scenarios.
4. Results
4.1. Experiments and Evaluation Metrics
Our experiments were conducted using the PyTorch 2.4.1 framework with NVIDIA CUDA support. All tests were performed on a Windows 11 operating system equipped with an Intel Raptor Lake architecture multi-core CPU, 32 GB of memory, and an NVIDIA AD107 [GeForce RTX 4060 GPU] with 8 GB VRAM.
This study employed multiple frozen convolutional neural network (CNN) models incorporating CA mechanisms and evaluated them across several performance metrics, including test accuracy, test loss, F1 score, precision, and recall. Results demonstrate that all models achieved outstanding performance across these metrics.
Confusion matrices are commonly used to evaluate classification performance, summarizing model predictions in terms of true positives (TP), true negatives (TN), false positives (FP), and false negatives (FN). Based on these quantities, several evaluation metrics can be derived. Accuracy reflects the proportion of correctly classified samples. Precision and recall measure the model’s ability to identify positive cases accurately. The F1-score, defined as the harmonic mean of precision and recall, provides a balanced measure particularly useful under class imbalance. These metrics collectively offer a comprehensive assessment of model performance. The corresponding formulas are as follows:
4.2. Performance of the RGB Stream
In the evaluation conducted on the SFD3 dataset, the RGB single-stream model demonstrated an Accuracy of 98.52%, with slight reductions in performance occurring primarily under challenging illumination and background conditions. The accuracy trajectory shown in Figure 6a indicates a steady rise during the early epochs, ultimately reaching a stable level within roughly twenty-five epochs. As depicted in Figure 6b, the loss decreases rapidly at the beginning of training and gradually approaches 0.05, reflecting a smooth and well-behaved optimization process without overfitting. The confusion matrix in Figure 7 further illustrates that most distraction categories are reliably identified, with only limited confusion among categories exhibiting similar visual characteristics.
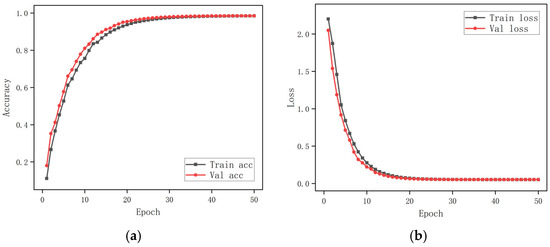
Figure 6.
(a) Training accuracy and validation accuracy, (b) training loss and validation loss using the SFD3 dataset.
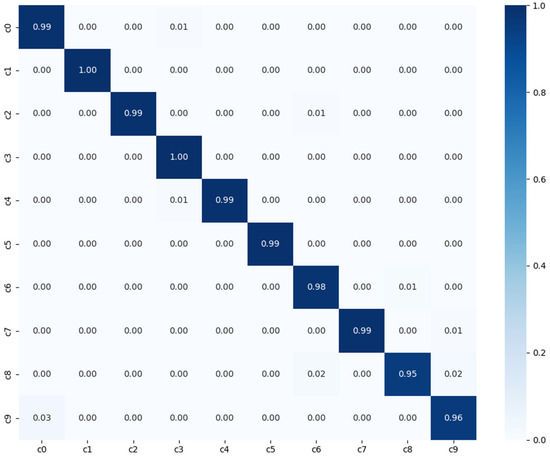
Figure 7.
Confusion matrix of baseline model with normalized prediction between zero and one, using SFD3 dataset.
Furthermore, the proposed model is compared in terms of evaluation metrics with Stacking Ensemble [43], ConvoNet [44], HRRN [45], and Drive-Net [46], and a comprehensive comparison of these baseline methods is presented in Table 3 to highlight the relative advantages of our approach.
Table 3.
Classification reports of different pretrained models using the SFD3 dataset.
In the benchmarking process on the AUCD2 dataset, the RGB single-stream model was evaluated independently and achieved an Accuracy of 98.63%, indicating strong appearance-based discrimination under this data distribution. As shown in Figure 8a, the training and validation accuracy increase rapidly during the early epochs and converge within approximately twenty to twenty-five epochs, stabilizing at a level consistent with the final test accuracy. Figure 8b presents the corresponding loss dynamics, which decrease sharply at the beginning and reach a stable value after roughly twenty-five epochs. The confusion matrix in Figure 9 further confirms that most distraction categories are correctly recognized, with only minimal confusion among visually similar classes.
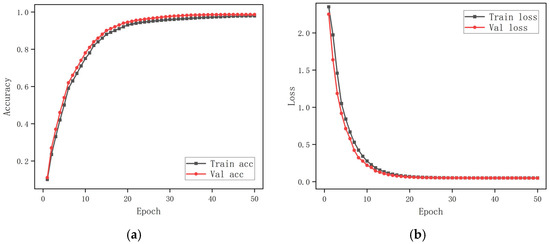
Figure 8.
(a) Training accuracy and validation accuracy; (b) training loss and validation loss using the AUCD2 dataset.

Figure 9.
Confusion matrix of baseline model with normalized prediction between zero and one, using AUCD2 dataset.
Several baseline networks were trained for 50 epochs, among which the proposed model achieved the highest testing accuracy and the lowest testing loss. As shown in Table 4, the proposed framework surpasses existing approaches such as HRRN [45], C-SLSTM [47], D-HCNN [48], and ConvNet [44], reaching an accuracy of 98.63%.
Table 4.
Classification reports of different pretrained models using the AUCD2 dataset.
4.3. Performance of the Human Keypoint Stream
For the SFD3 dataset, the keypoint stream was first evaluated using XGBoost, yielding an Accuracy of 81.21%, indicating that pose-derived spatial cues provide moderate discriminative power. Misclassifications mainly occur in pose-similar categories such as “making a phone call” and “adjusting instruments.” Incorporating Gradient Boosting to form the XGS ensemble further improved Accuracy to 83.58%, demonstrating that ensemble learning enhances the extraction of fine-grained pose variations and overall recognition stability.
On the AUCD2 dataset, the baseline XGBoost classifier achieved an Accuracy of 78.42%, indicating that the more diverse pose variations in this dataset pose greater challenges for single-model classification. Behaviors involving subtle or low-amplitude keypoint changes were particularly difficult to separate. With the use of the XGS ensemble, performance improved to 82.31% Accuracy, reflecting an enhanced ability to capture discriminative pose dynamics and increased robustness against intra-class variability.
4.4. Performance of the Fusion Stream
After fusion, the DualStream-AttnXGS model demonstrates strong and consistent performance across both datasets. On SFD3, it achieves 99.59% accuracy with only minor confusion between pose-similar behaviors such as “adjusting instruments” and “making a phone call,” as shown in Figure 10a, while the testing loss converges to 0.05, reflecting stable optimization and good generalization. Improved recall for minority behaviors also indicates reduced bias relative to single-stream models. On the AUCD2 dataset, the model maintains high recognition capability, reaching 99.12% accuracy with reliable category separation and few errors among closely related poses, as illustrated in Figure 10b. These results confirm that multimodal fusion enhances discriminative power and robustness under diverse pose distributions, outperforming single-stream baselines.
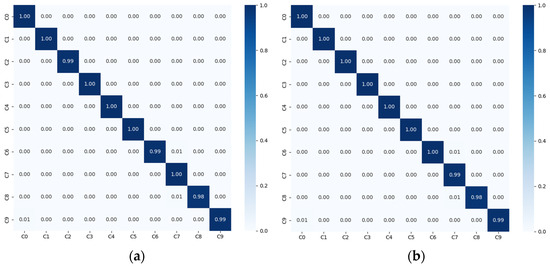
Figure 10.
(a) Confusion matrix of the proposed DualStream-AttnXGS model on the SFD3 dataset. (b) Confusion matrix of the proposed DualStream-AttnXGS model on the AUCD2 dataset.
4.5. Backbone Comparative Evaluation for the RGB Stream
Experimental results on the SFD3 dataset, as summarized in Table 5, consistently demonstrate that the AGC module produces substantial performance gains across all backbone networks. On SFD3, VGG16 improves from 82% to 94% accuracy, with testing loss decreasing from 0.60 to 0.24. MobileNetV2 shows a similar trend, increasing from 91% to 97%. Although ResNet50 and EfficientNetB0 already exhibit strong baseline performance with accuracies of 95% and 97%, the introduction of AGC still provides additional improvements and significantly reduces testing loss. A comparable pattern is observed on the AUCD2 dataset, as shown in Table 6. VGG16 increases from 79% to 90%, and ResNet50 rises from 93% to 98%. MobileNetV2 improves from 93% to 96%, while EfficientNetB0 enhanced with AGC achieves the highest accuracy of 99% alongside the lowest testing loss of 0.04. Considering accuracy, F1-score, and loss stability across datasets, EfficientNetB0 combined with AGC delivers the most reliable and generalizable performance and is therefore adopted as the backbone network for the RGB stream in the dual-stream architecture.
Table 5.
Classification reports of different pretrained models using SFD3 dataset.
Table 6.
Classification reports of different pretrained models using AUCD2 dataset.
4.6. Ablation Study
Ablation studies were conducted on both the SFD3 and AUCD2 datasets to quantify the contribution of each architectural component in the DualStream-AttnXGS framework, and the detailed results are summarized in Table 7. Starting from the standalone RGB stream baseline, the model achieved 97.17% and 97.06% accuracy on SFD3 and AUCD2. Introducing the pose stream alone produced substantially lower results, confirming that keypoint features are insufficient when used without visual context. Adding the Ghost module to the RGB stream led to measurable gains, increasing accuracy to 97.89% and 97.94% while maintaining a lightweight model structure. Incorporating the CA mechanism further enhanced representation quality, yielding 98.12% and 98.31% accuracy. After integrating the composite loss function, performance continued to improve, reaching 98.52% and 98.63%. When the pose stream was fused with the enhanced RGB stream, accuracy increased sharply to 99.31% and 98.87%, demonstrating the complementary nature of visual and skeletal cues. Subsequent combinations with Ghost and CA produced incremental gains, indicating that attention-guided lightweight convolution strengthens multimodal alignment. The full model, which integrates RGB features, pose information, Ghost convolution, CA, and the composite loss, achieved the highest performance at 99.59% and 99.12%, confirming that the complete configuration provides the most robust and generalizable representation across both datasets.
Table 7.
Performance Comparison of the Model with Different Components.
4.7. Inference Efficiency Comparison
To further evaluate the computational efficiency and deployment suitability of different backbone architectures, this study compares inference speed and model size across several CNN and pose-based models. As shown in Table 8, the baseline VGG16 and ResNet50 models are relatively large (513 MB and 90 MB) and operate at 39 and 59 FPS. After integrating the Ghost module, both networks show clear efficiency gains: VGG16+AGC reduces to 483 MB and reaches 97 FPS, while ResNet50+AGC decreases to 85 MB and achieves 105 FPS. Lightweight architectures exhibit similar trends, with MobileNetV2+AGC increasing to 128 FPS at 7 MB and EfficientNetB0+AGC reaching 183 FPS at 12 MB. These results demonstrate that the Ghost module effectively reduces computational redundancy and enhances feature reuse, yielding smaller models with significantly higher inference throughput. Although the dual-stream fusion model operates at 30 FPS with a combined size of 25 MB, it still supports real-time deployment while providing the highest recognition accuracy, offering a favorable balance between efficiency and performance.
Table 8.
Model efficiency comparison in terms of FPS and size.
4.8. Model Interpretability Analysis
For interpretability analysis of the RGB branch, SHAP was used to visualize pixel-level contribution patterns, as shown in Figure 11. In these heatmaps, red regions indicate positive contributions, blue denotes negative contributions, and white regions carry minimal influence. Before improvement, the model exhibits dispersed and noisy activation patterns, with noticeable responses not only on the driver’s hands and steering wheel but also across irrelevant background areas. After optimization, the attention becomes markedly more focused and structured, with strong and continuous activations on behavior-related regions and minimal responses elsewhere. This demonstrates improved suppression of irrelevant features and more discriminative evidence for decision-making. Overall, the SHAP comparison highlights the enhanced feature selection capability and clearer reasoning behavior achieved by the optimized architecture.
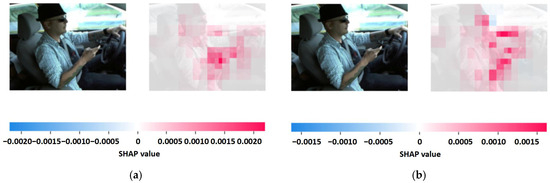
Figure 11.
SHAP-based visual explanation of driver state classification. (a) Original frame and SHAP visualization for a non-distracted driver, where high-value regions (red) correspond to hands and steering wheel, indicating stable focus. (b) Original frame and SHAP visualization for a distracted driver, where activated regions concentrate on the head and left arm, reflecting posture deviation and distraction behavior.
To interpret how human keypoint features contribute to distraction recognition, several complementary analyses were conducted, each reflecting a different aspect of feature relevance. Figure 12 provides a consolidated view of these analyses.
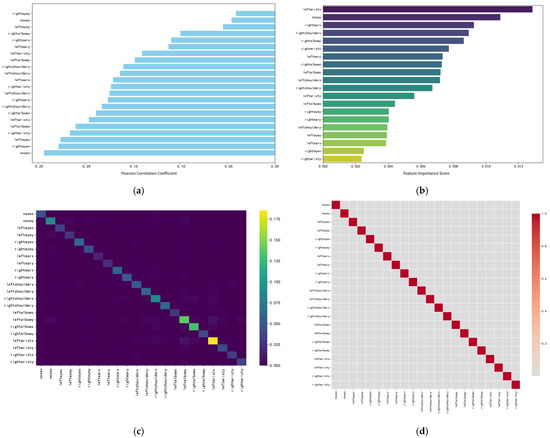
Figure 12.
Feature correlation and importance analysis for driver distraction detection. (a) Pearson correlations between keypoint features and labels. (b) Feature importance distribution of the ensemble model. (c) Interaction strengths among keypoint features. (d) Weighted correlation matrix showing low linear dependency among features.
The Pearson correlation analysis shown in Figure 12a quantifies the linear relationship between each keypoint feature and the driver behavior labels. This type of analysis helps identify which individual joint coordinates are most sensitive to behavioral changes, thereby revealing the anatomical regions that carry the strongest discriminative signals. All features show positive correlations with the target variable, although the strengths differ. Vertical facial coordinates such as nose y, left eye y and right eye y exhibit the highest correlation values, indicating that head elevation and subtle vertical movements provide meaningful cues for distinguishing between driving behaviors.
Figure 12b presents the feature importance distribution derived from the stacking ensemble based on XGBoost and Gradient Boosting. This analysis aims to clarify which keypoint features contribute most substantially to the classifier’s predictions and thus shape the model’s decision boundaries. The horizontal coordinate of the left wrist (leftwrist_x) stands out as the most influential feature, followed by nose y, rightwrist_x and rightshoulder_x. These results demonstrate that horizontal hand displacement, together with vertical facial movements, plays a central role in identifying distracted behaviors such as reaching, operating devices or holding objects.
The interaction strength map displayed in Figure 12c describes how pairs of keypoint features jointly influence model predictions. This analysis highlights whether the classifier relies on isolated joint positions or on relational geometric patterns spanning multiple joints. Strong interactions are observed between leftwrist_x and arm-related features such as leftwrist_y and leftelbow_x. This indicates that the classifier captures coordinated movements rather than treating keypoints independently. Relative changes between adjacent joints—such as those between the wrist and elbow—help differentiate whether the driver is gripping the wheel, extending the arm or reaching toward an object.
The weighted correlation matrix in Figure 12d evaluates the linear dependencies among features after accounting for their relative importance. Most off-diagonal values remain low, suggesting that the keypoint features provide largely independent spatial information with minimal redundancy. Such independence, combined with the strong functional interactions identified earlier, enables the ensemble model to exploit complementary geometric cues and contributes to its robustness and high classification accuracy.
5. Conclusions
Driver distraction is a major cause of traffic accidents. This study proposes the DualStream-AttnXGS framework, which integrates an enhanced EfficientNetB0 RGB stream with Ghost Convolution, CA, and a composite loss, together with a YOLOv8-Pose-based keypoint stream modeled by an XGBoost–Gradient Boosting ensemble. Multimodal fusion is performed through Softmax probability weighting. On the SFD3 dataset, the model achieves 99.59% accuracy with near-perfect precision, recall, and F1-score, while on the AUCD2 dataset, it attains 99.12% accuracy, demonstrating strong generalization across different data distributions. With moderate model size and low computational complexity, the framework is well suited for in-vehicle and embedded deployment. Future work will explore pruning and quantization to further reduce model footprint and improve real-time performance.
Author Contributions
Conceptualization, Z.H. and C.C.; Methodology, C.C.; Software, Z.H.; Validation, C.C.; Resources, X.Z. and C.C.; Data Curation, Z.H.; Writing—Original Draft Preparation, Z.H.; Writing—Review and Editing, X.Z. and C.C.; Visualization, Z.H.; Supervision, C.C. and X.Z. All authors have read and agreed to the published version of the manuscript.
Funding
This work was funded by the National Natural Science Foundation of China (Grant No.: 62027810).
Institutional Review Board Statement
Not applicable.
Informed Consent Statement
Not applicable.
Data Availability Statement
The datasets used in this study are publicly available. The State Farm Distracted Driver Detection dataset can be accessed at https://www.kaggle.com/c/state-farm-distracted-driver-detection (accessed on 7 December 2025), and the American University in Cairo Distracted Driver’s Dataset can be accessed at https://service.tib.eu/ldmservice/dataset/american-university-in-cairo--auc--distracted-driver-s-dataset (accessed on 7 December 2025).
Acknowledgments
We would like to thank the Human Factors Engineering Laboratory at the College of Engineering Science and Technology, Shanghai Ocean University, for providing the research facilities that made this study possible.
Conflicts of Interest
The authors declare no conflicts of interest.
References
- Young, K.; Regan, M.; Hammer, M. Driver Distraction: A Review of the Literature; MONASH University Accident Research Centre: Melbourne, Australia, 2003; Available online: https://www.monash.edu/__data/assets/pdf_file/0007/217177/Driver-distraction-a-review-of-the-literature.pdf (accessed on 27 October 2025).
- World Health Organization. Global Status Report on Road Safety 2023; WHO: Geneva, Switzerland, 2023. Available online: https://www.who.int/teams/social-determinants-of-health/safety-and-mobility/global-status-report-on-road-safety-2023 (accessed on 27 October 2025).
- World Health Organization. Global Plan for the Decade of Action for Road Safety 2021–2030; WHO: Geneva, Switzerland, 2021. Available online: https://www.who.int/publications/m/item/global-plan-for-the-decade-of-action-for-road-safety-2021-2030 (accessed on 27 October 2025).
- Transport Research International Documentation. Distracted Driving 2020; NHTSA: Washington, DC, USA, 2020. Available online: https://crashstats.nhtsa.dot.gov/Api/Public/ViewPublication/813309 (accessed on 27 October 2025).
- Dingus, T.A.; Guo, F.; Lee, S.; Antin, J.F.; Perez, M.; Buchanan-King, M.; Hankey, J. Driver crash risk factors and prevalence evaluation using naturalistic driving data. Proc. Natl. Acad. Sci. USA 2016, 113, 2636–2641. [Google Scholar] [CrossRef]
- Open Government Data (OGD) Platform India. Road Accidents in India 2021; Government of India: New Delhi, India, 2021. Available online: https://www.data.gov.in/catalog/road-accidents-india-2021 (accessed on 27 October 2025).
- Ministry of Road Transport & Highways, Government of India. Road Accident in India 2023; Government of India: New Delhi, India, 2023. Available online: https://morth.gov.in/sites/default/files/Road-Accident-in-India-2023-Publications.pdf (accessed on 27 October 2025).
- World Health Organization. Save Lives: A Road Safety Technical Package; WHO: Geneva, Switzerland, 2017. Available online: https://www.who.int/publications/i/item/save-lives-a-road-safety-technical-package (accessed on 27 October 2025).
- Abouelnaga, Y.; Eraqi, H.M.; Moustafa, M.N. Real-time distracted driver posture classification. arXiv 2018, arXiv:1706.09498. [Google Scholar] [CrossRef]
- Wang, X.; Xu, R.; Zhang, S.; Zhuang, Y.; Wang, Y. Driver distraction detection based on vehicle dynamics using naturalistic driving data. Transp. Res. Part C Emerg. Technol. 2022, 136, 103561. [Google Scholar] [CrossRef]
- Wang, H.; Xi, J.; Li, B.; Deng, Y.; Chen, J.; Cheng, Z. Transformer-Based Driver Distraction Detection Method and Apparatus. U.S. Patent 12,056,940, 6 August 2024. [Google Scholar]
- Craye, C.; Karray, F. Driver distraction detection and recognition using RGB-D sensor. arXiv 2015, arXiv:1502.00250. [Google Scholar] [CrossRef]
- Baheti, B.; Gajre, S.; Talbar, S. Detection of distracted driver using convolutional neural network. In Proceedings of the 2018 IEEE/CVF Conference on Computer Vision and Pattern Recognition Workshops (CVPRW), Salt Lake City, UT, USA, 18–22 June 2018; pp. 1145–11456. [Google Scholar] [CrossRef]
- Li, G.; Chung, W.-Y. Detection of driver drowsiness using wavelet analysis of heart rate variability and a support vector machine classifier. Sensors 2013, 13, 16494–16511. [Google Scholar] [CrossRef]
- Das, K.; Sharak, S.; Riani, K.; Abouelenien, M.; Burzo, M.; Papakostas, M. Multimodal detection of drivers drowsiness and distraction. In Proceedings of the 2021 International Conference on Multimodal Interaction, Montréal, QC, Canada, 18–22 October 2021; pp. 416–424. [Google Scholar] [CrossRef]
- Sengar, N.; Kumari, I.; Lee, J.; Har, D. PoseViNet: Distracted driver action recognition framework using multi-view pose estimation and vision transformer. arXiv 2023, arXiv:2312.14577. [Google Scholar] [CrossRef]
- Chen, J.; Zhang, Z.; Yu, J.; Huang, H.; Zhang, R.; Xu, X.; Sheng, B.; Yan, H. DSDFormer: An innovative transformer-Mamba framework for robust high-precision driver distraction identification. arXiv 2024, arXiv:2409.05587. [Google Scholar] [CrossRef]
- Kashevnik, A.; Shchedrin, R.; Kaiser, C.; Stocker, A. Driver distraction detection methods: A literature review and framework. IEEE Access 2021, 9, 60063–60076. [Google Scholar] [CrossRef]
- Wollmer, M.; Blaschke, C.; Schindl, T.; Schuller, B.; Farber, B.; Mayer, S.; Trefflich, B. Online driver distraction detection using long short-term memory. IEEE Trans. Intell. Transp. Syst. 2011, 12, 574–582. [Google Scholar] [CrossRef]
- Huang, C.; Wang, X.; Cao, J.; Wang, S.; Zhang, Y. HCF: A hybrid CNN framework for behavior detection of distracted drivers. IEEE Access 2020, 8, 109335–109349. [Google Scholar] [CrossRef]
- Xiao, W.; Liu, H.; Ma, Z.; Chen, W. Attention-based deep neural network for driver behavior recognition. Future Gener. Comput. Syst. 2022, 132, 152–161. [Google Scholar] [CrossRef]
- Mou, L.; Chang, J.; Zhou, C.; Zhao, Y.; Ma, N.; Yin, B.; Jain, R.; Gao, W. Multimodal driver distraction detection using dual-channel network of CNN and transformer. Expert Syst. Appl. 2023, 234, 121066. [Google Scholar] [CrossRef]
- Or Rashid, M.; Mosarrof Hossen, M.; Nashbat, M.; Hasan-Zia, M.; Ansaruddin Kunju, A.K.; Khandakar, A.; Ashraf, A.; Ehsanul Majid, M.; Bin Abul Kashem, S.; Chowdhury, M.E.H. Self-DSNet: A novel self-ONNs based deep learning framework for multimodal driving distraction detection. IEEE Access 2025, 13, 42322–42335. [Google Scholar] [CrossRef]
- Noh, B.; Park, M.; Han, Y.; Kim, J. A multi-modal approach for detecting drivers’ distraction using bio-signal and vision sensor fusion in driver monitoring systems. Eng. Appl. Artif. Intell. 2025, 161, 112265. [Google Scholar] [CrossRef]
- Misra, A.; Samuel, S.; Cao, S.; Shariatmadari, K. Detection of driver cognitive distraction using machine learning methods. IEEE Access 2023, 11, 18000–18012. [Google Scholar] [CrossRef]
- Soumya, P.S.; Mythili, S. Multi-modality physiological signal analysis for driver cognitive distraction detection using spectral domain reconstruction graph neural network. Biomed. Signal Process. Control 2026, 112, 108679. [Google Scholar] [CrossRef]
- Gu, S.; Wen, B.; Chen, S.; Li, Y.; Qi, G.; Shuai, L.; Zhu, Z. Driver distraction detection based on adaptive tiny targets and lightweight networks. Signal Process. Image Commun. 2025, 138, 117342. [Google Scholar] [CrossRef]
- Guerrero-Contreras, G.; Balderas-Diaz, S.; Diaz-Gomez, A.; Medina-Bulo, I.; Dominguez-Jiménez, J.J. Cost-effective ADAS for inter-vehicle distance estimation using computer vision and deep learning. In Proceedings of the 21st International Conference on Intelligent Environments (IE), Darmstadt, Germany, 23–26 June 2025; pp. 1–8. [Google Scholar] [CrossRef]
- Muñoz, A.; Martínez-España, R.; Guerrero-Contreras, G.; Balderas-Díaz, S.; Arcas-Túnez, F.; Bueno-Crespo, A. A multi-DL fuzzy approach to image recognition for a real-time traffic alert system. J. Ambient. Intell. Smart Environ. 2025, 17, 101–116. [Google Scholar] [CrossRef]
- Krizhevsky, A.; Sutskever, I.; Hinton, G.E. ImageNet classification with deep convolutional neural networks. Commun. ACM 2017, 60, 84–90. [Google Scholar] [CrossRef]
- Shorten, C.; Khoshgoftaar, T.M. A survey on image data augmentation for deep learning. J. Big Data 2019, 6, 60. [Google Scholar] [CrossRef]
- Simonyan, K.; Zisserman, A. Two-stream convolutional networks for action recognition in videos. In Proceedings of the 28th International Conference on Neural Information Processing Systems (NIPS 2014), Montreal, QC, Canada, 8–13 December 2014; Volume 1, pp. 568–576. [Google Scholar]
- Tan, M.; Le, Q.V. EfficientNet: Rethinking model scaling for convolutional neural networks. arXiv 2020, arXiv:1905.11946. [Google Scholar] [CrossRef]
- Hou, Q.; Zhou, D.; Feng, J. Coordinate attention for efficient mobile network design. In Proceedings of the 2021 IEEE/CVF Conference on Computer Vision and Pattern Recognition (CVPR), Nashville, TN, USA, 20–25 June 2021; pp. 13708–13717. [Google Scholar] [CrossRef]
- Lin, T.-Y.; Goyal, P.; Girshick, R.; He, K.; Dollar, P. Focal loss for dense object detection. IEEE Trans. Pattern Anal. Mach. Intell. 2020, 42, 318–327. [Google Scholar] [CrossRef]
- Khan, T.; Choi, G.; Lee, S. EFFNet-CA: An efficient driver distraction detection based on multiscale features extractions and channel attention mechanism. Sensors 2023, 23, 3835. [Google Scholar] [CrossRef] [PubMed]
- Han, K.; Wang, Y.; Tian, Q.; Guo, J.; Xu, C.; Xu, C. GhostNet: More features from cheap operations. In Proceedings of the 2020 IEEE/CVF Conference on Computer Vision and Pattern Recognition (CVPR), Seattle, WA, USA, 13–19 June 2020; pp. 1577–1586. [Google Scholar] [CrossRef]
- Wen, Y.; Zhang, K.; Li, Z.; Qiao, Y. A discriminative feature learning approach for deep face recognition. In Computer Vision—ECCV 2016; Leibe, B., Matas, J., Sebe, N., Welling, M., Eds.; Lecture Notes in Computer Science; Springer: Cham, Switzerland, 2016; Volume 9911, pp. 499–515. [Google Scholar] [CrossRef]
- Cipolla, R.; Gal, Y.; Kendall, A. Multi-task learning using uncertainty to weigh losses for scene geometry and semantics. In Proceedings of the 2018 IEEE/CVF Conference on Computer Vision and Pattern Recognition, Salt Lake City, UT, USA, 18–23 June 2018; pp. 7482–7491. [Google Scholar] [CrossRef]
- Lu, M.; Hu, Y.; Lu, X. Pose-guided model for driving behavior recognition using keypoint action learning. Signal Process. Image Commun. 2022, 100, 116513. [Google Scholar] [CrossRef]
- Zian, S.; Kareem, S.A.; Varathan, K.D. An empirical evaluation of stacked ensembles with different meta-learners in imbalanced classification. IEEE Access 2021, 9, 87434–87452. [Google Scholar] [CrossRef]
- Chen, T.; Guestrin, C. XGBoost: A scalable tree boosting system. In Proceedings of the 22nd ACM SIGKDD International Conference on Knowledge Discovery and Data Mining, San Francisco, CA, USA, 13–17 August 2016; pp. 785–794. [Google Scholar]
- Dhakate, K.R.; Dash, R. Distracted driver detection using stacking ensemble. In Proceedings of the 2020 IEEE InternationalStudents’ Conference on Electrical, Electronics and Computer Science (SCEECS), Bhopal, India, 22–23 February 2020. [Google Scholar]
- Leekha, M.; Goswami, M.; Shah, R.R.; Yin, Y.; Zimmermann, R. Are you paying attention? Detecting distracted driving in real-time. In Proceedings of the 2019 IEEE Fifth International Conference on Multimedia Big Data (BigMM), Singapore, 11–13 September 2019. [Google Scholar]
- Alotaibi, M.; Alotaibi, B. Distracted driver classification using deep learning. Signal Image Video Process 2020, 14, 617–624. [Google Scholar] [CrossRef]
- Majdi, M.S.; Ram, S.; Gill, J.T.; Rodríguez, J.J. Drive-net: Convolutional network for driver distraction detection. In Proceedings of the 2018 IEEE Southwest Symposium on Image Analysis and Interpretation (SSIAI), Las Vegas, NV, USA, 8–10 April 2018. [Google Scholar]
- Mase, J.M.; Chapman, P.; Figueredo, G.P.; Torres, M.T. A hybrid deep learning approach for driver distraction detection. In Proceedings of the 2020 International Conference on Information and Communication Technology Convergence (ICTC), Jeju, Republic of Korea, 21–23 October 2020. [Google Scholar]
- Qin, B.; Qian, J.; Xin, Y.; Liu, B.; Dong, Y. Distracted driver detection based on a CNN with decreasing filter size. IEEE Trans. Intell. Transp. Syst. 2021, 23, 6922–6933. [Google Scholar] [CrossRef]
Disclaimer/Publisher’s Note: The statements, opinions and data contained in all publications are solely those of the individual author(s) and contributor(s) and not of MDPI and/or the editor(s). MDPI and/or the editor(s) disclaim responsibility for any injury to people or property resulting from any ideas, methods, instructions or products referred to in the content. |
© 2025 by the authors. Licensee MDPI, Basel, Switzerland. This article is an open access article distributed under the terms and conditions of the Creative Commons Attribution (CC BY) license (https://creativecommons.org/licenses/by/4.0/).