Abstract
In complex urban low-altitude (ULA) airspace, unmanned aerial vehicles (UAVs) face several safety challenges, such as building obstacles, airspace restrictions, and environmental uncertainties. In this study, these issues are addressed by adopting a novel quantitative method for evaluating UAV flight safety margins and integrating this method into a ULA airspace grid model. This method comprehensively considers critical factors such as airspace obstacles, environmental conditions, and UAV performance to compute a quantitative safety margin. Once safety buffer grids around restricted and potential conflict grids are introduced, dynamic constraints can be imposed on the trajectory planning process. The proposed model not only achieves a balance between path cost and safety redundancy but also significantly enhances UAV flight safety and the efficiency of airspace resource utilization in complex urban environments. The experimental results validate the effectiveness of this approach for planning multi-UAV trajectories, demonstrating its feasibility and potential for broader application. This research not only extends the safety implications of low-altitude airspace grid modeling but also provides a new technical pathway and theoretical foundation for future ULA airspace safety management, multi-UAV collaborative scheduling, and refined airspace governance.
1. Introduction
The rapid growth in the number of unmanned aerial vehicles (UAVs) has led to increasingly complex urban low-altitude (ULA) airspace environments [1]. This phenomenon is particularly evident in high-frequency application scenarios, including logistics delivery, reconnaissance and surveillance, and aerial photography; however, these multi-UAV flight trajectories tend to intersect and overlap within confined spaces, such as dense building complexes and residential communities, which considerably increases the risk of conflicts and collisions [2,3,4]. This research gap not only directly threatens the operational safety of UAVs but also poses potential hazards to people on the ground and critical infrastructure [5,6,7]. Achieving a balance between safety and efficiency in the trajectory planning process necessitates a systematic assessment and quantification of UAV flight safety in complex airspace [8,9].
In terms of airspace modeling, grid-based approaches are widely used to describe low-altitude airspace environments [10,11]. In this model, multisource spatial information, including terrain, buildings, and no-fly zones, can be effectively integrated for airspaces partitioned into cubic grid cells, and multiresolution grids can be constructed by accommodating the requirements of multi-UAV planning [12]. These tasks integrate flight safety into spatial resource allocation and dynamic path planning. Recent studies have attempted to incorporate safety factors into airspace grids. For example, multiresolution grid models can adaptively adjust their scale on the basis of mission risk, thereby optimizing the precision of safety constraints in high-risk areas [12,13,14]. Benefiting from the discretized cell representation of the airspace (e.g., division into obstacle and flight cells), this modeling categorization significantly enhances the efficiency of conflict detection and obstacle avoidance in parallel multi-UAV operations [15,16,17]. Furthermore, grid models that integrate restricted zones and flight corridors enable integrated management from trajectory planning to conflict early warning in complex environments, comprehensively improving the safety and robustness of UAV systems [18,19,20].
However, although existing methods have introduced safety considerations into airspace grid modeling, significant challenges remain in achieving real-time perception of potential risks and dynamically adjusting UAV trajectory planning strategies in highly dynamic and complex ULA environments [21,22,23]. Particularly in scenarios characterized by high-density building clusters and complex airspace management [24], current modeling methods struggle to systematically characterize the coupling relationships among UAV performance, airspace environmental constraints, and dynamic trajectories, which limits further improvement in flight safety levels. During trajectory execution, UAVs must maintain a sufficient distance from obstacles to mitigate uncontrollable risks, such as sudden environmental changes and positioning errors, thereby preventing incidents from escalating into accidents [25]. The coupling relationships among environmental, path, and safety factors urgently need to be systematically characterized. A reliable approach is to incorporate low-altitude airspace environmental features and UAV performance parameters, which can assist in achieving highly resilient and reliable airspace modeling [26].
The concept of the UAV flight safety margin and its quantification in combination with the airspace grid model is adopted in this study to enhance the safety assurance capability of UAV operations in complex ULA airspace [27]. This research includes three aspects. First, a calculation model for the safety margin influence coefficient (SMIC) for UAV flight is constructed. In this model, ULA environmental features are integrated into UAV performance parameters. Second, static safety buffer grids around buildings and no-fly zones are established, and dynamic safety buffer grids around operating UAVs are subsequently solved to ensure flight safety [28]. Finally, a temporal dimension is introduced into multi-UAV conflict avoidance, an airspace grid cell state model is constructed with safety margin constraints, and UAV trajectory planning is adjusted to improve the overall traffic efficiency and operational safety.
This paper is structured as follows: Section 2 presents the proposed safety margin-based low-altitude airspace grid cell model and the calculation mechanism for the SMIC. Section 3 discusses the experimental scenario for airspace grids and the constructed multi-UAV simulated trajectory conflict planning. The results pertaining to the performance of the proposed method were compared and analyzed in terms of safety and traffic efficiency. Section 4 discusses the findings and concludes with future perspectives.
2. Methodology
In this study, UAV flight safety in high-density airspace is ensured by introducing the concept of a safety margin from the aviation domain into UAV trajectory planning [29]. The core of this approach lies in constructing an SMIC method that integrates environmental conditions and UAV performance. This factor can be directly used to enhance the inherent safety level of trajectory planning and provides essential decision support for fine-grained airspace management and trajectory conflict resolution in complex scenarios.
In particular, the proposed approach first encodes the low-altitude urban airspace grid via the BeiDou 3D grid location code. The SMIC is subsequently calculated based on the safety margin evaluation system. This factor is then used to compute the safety margin value for each grid cell, which is applied for the real-time selection of UAV flight trajectories. The detailed workflow is illustrated in Figure 1.
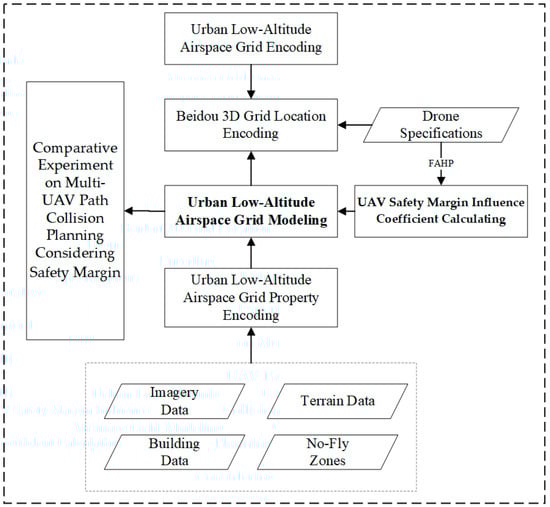
Figure 1.
Airspace grid modeling and trajectory planning workflow.
2.1. Encoding the ULA Airspace Grid Cell
Figure 2 shows the ULA airspace grid cells represented by an array structure. , where each grid cell corresponds to a specific spatial element in the ULA airspace. is the BeiDou 3D location code of the grid cell’s center point and is used to characterize the latitude, longitude, and altitude information of the airspace grid cell. is the type of code of the corresponding grid cell and is categorized into four types: “available,” “safety buffer,” “potential conflict,” and “restricted.” The restricted, safety buffer, and potential conflict cells represent different states of prohibited grids.
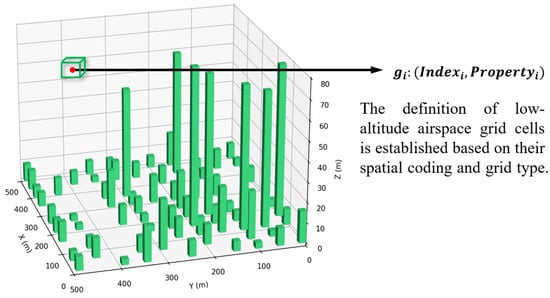
Figure 2.
Airspace grid cell data structure.
2.1.1. Index Encoding
Geodesic discrete global grid systems [30], which partition the Earth into a series of regular cells to support the organization and analysis of spatial data, are used to spatially encode airspace grid cells. The existing global subdivision grids include hexagonal grids [30], quadtree grids [31], the global area reference system [32], the military grid reference system [33], and Google Earth grids [34]. In recent years, geographical coordinate global subdivision based on one-dimension integer on two to the n-th power (GeoSOT) [35], which hierarchically divides the Earth’s surface on the basis of a latitude–longitude coordinate system combined with quadtree recursive subdivisions, has become a common method for global partitioning [36]. In China, the BeiDou grid location code [37,38], derived from the GeoSOT scheme, is often adopted. This scheme provides a discrete, multiscale, hierarchical, and unified method for location identification and expression, which is used to identify global spatial regional position information.
2.1.2. Property Encoding
Figure 3 displays the airspace grid cells categorized into four types: available grids, safety buffer grids, potential conflict grids, and restricted grids. In the initial state, all grid cells are available grids. Grids where UAV entry is prohibited due to airspace obstacles such as buildings and terrain or regulated airspace are designated restricted grids. If a planned UAV trajectory exists within a specific period, then the grids through which this trajectory passes are marked as potential conflict grids. Building upon the safety margin concept proposed in this study, safety buffer grids are established around restricted grids to enhance UAV flight safety.
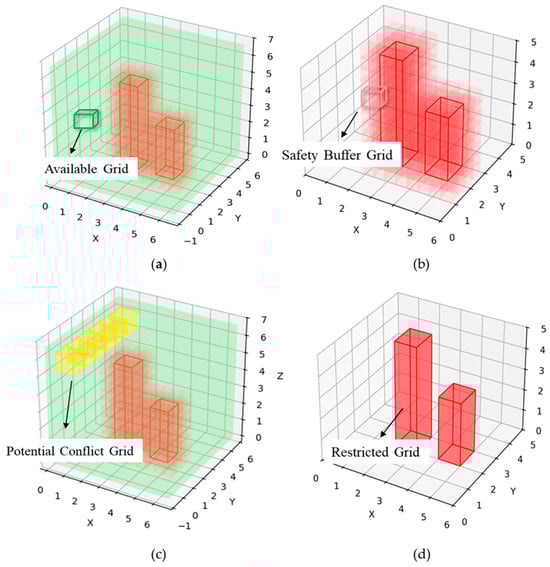
Figure 3.
Airspace grid cell properties: (a) available grid, (b) safety buffer grid, (c) potential conflict grid, and (d) restricted grid.
2.2. UAV Safety Margin Influence Coefficient Calculation
An evaluation model for the SMIC is introduced to effectively quantify the impact of the ULA airspace environment on UAV flight safety. The primary influencing factors, including airspace obstacles, environmental conditions, and UAV performance [39], are selected to systematically evaluate the SMIC, denoted as . Table 1 presents the specific evaluation indicators, which cover the primary aspects affecting the complexity of the ULA airspace. The SMIC facilitates a comprehensive and accurate assessment for the UAV flight.

Table 1.
Evaluation index system for the SMIC for UAV flight.
2.2.1. The Calculation of the Component Weights
In the evaluation model for the SMIC, determining the weights of the evaluation indicators is essentially the process of quantifying the relative importance of each influencing factor. Different weight assignments can lead to divergent evaluation results even when they are based on the same underlying data. Considering that the airspace environment involves many uncertain factors and that complex interactions exist among these factors, this study adopts the fuzzy analytic hierarchy process (FAHP) [40] as the primary method for determining indicator weights to capture such complexity and ensure the validity and reliability of the evaluation results. This approach integrates a fuzzy comprehensive evaluation with the analytic hierarchy process, enabling it to address relatively complex decision-making problems. The method efficiently and conveniently reduces the complexity inherent in decision-making, thereby enabling the determination of indicator weights for qualitative factors that are otherwise difficult to quantify.
In this structure, the SMIC for UAV flight serves as the objective layer. Based on the nature and categories of the influencing factors, this objective layer is further decomposed into a criterion layer and an indicator layer.
The factors within the same level of the indicator system are compared pairwise to construct a fuzzy judgment matrix for each layer. In this study, fuzzy judgment matrices are used to represent the evaluation factors used for the criterion and indicator layers. The judgment matrix is represented by the following:
Each element in the pairwise comparison matrix signifies the relative importance of evaluation factor compared to factor . The comparisons are performed using a zero-to-one scale, with values ranging from 0.1 to 0.9.
The weight vector is , which represents the weights assigned to the evaluation factors based on the fuzzy judgment matrix , which is computed through a two-step procedure: first, elements in each row are summed, and then these sums are adjusted and normalized. The specific calculation is as follows:
where is the weight of the -th indicator, and is the total number of indicators, subject to and . Let
and an matrix is obtained, which is the eigenmatrix of the judgment matrix .
To validate the rationality of the weight values, the consistency of the fuzzy judgment matrix must be confirmed. This is achieved by calculating the compatibility index between the fuzzy judgment matrix and its eigenmatrix , using the following equation:
If , the consistency check is considered passed. A smaller value of indicates that the decision-maker imposes a stricter consistency requirement on the fuzzy judgment matrix. In this study, is set to 0.1.
Proceeding with the calculation, suppose that the calculated relative weight for criterion (i.e., the low-altitude airspace environment) in the criterion layer is . This criterion is split into four evaluation factors in the indicator layer: , , , and , with relative weights of , , , and , respectively. The comprehensive weights of these evaluation factors are denoted as , , , and , respectively, and can be expressed as follows:
2.2.2. Normalization of Evaluation Indicators
The evaluation indicator system used for the SMIC for UAV flight comprises quantitative and qualitative indicators. As these indicators differ in units of measurement and scales, data normalization for quantitative indicators is necessary to eliminate dimensional influences and ensure comparability. Simultaneously, qualitative indicators require reasonable quantification to transform them into calculable numerical forms. On the basis of this processing, quantitative and qualitative indicators are subsequently integrated via weighted summation to ultimately compute the comprehensive evaluation value of the influence coefficient.
Normalization of quantitative indicators
In the evaluation indicator system for the SMIC for UAV flight, quantitative indicators include factors such as the average building height and the number of regulated airspace zones. These indicators exhibit significant differences in units and magnitudes; for example, the average building height is measured in meters, and the flight speed is measured in meters per second.
The fundamental principle of the range standard method is to subtract the minimum value from the raw data, then divide by the range (maximum minus minimum), thereby converting the raw data into a standardized score between 0 and 1. This method is selected in this paper to eliminate the effects of different units and magnitudes among quantitative data.
For positive indicators in which a large value is favorable for the UAV flight safety margin, the standardization formula is as follows:
where is the normalized value of the -th positive quantitative indicator for reflecting its relative position within all samples; is the observed value obtained from the actual data; and and represent the maximum and minimum values of the indicator in the dataset, respectively.
For negative indicators in which a large value is unfavorable for the UAV flight safety margin (i.e., average building height or number of regulated airspace zones), the standardization formula is as follows:
This adjustment inverts the effect direction of the indicator and ensures that all standardized values fall within the interval . Large values indicate a substantial adverse impact on flight safety margins.
The values of all the quantitative indicators are mapped into the standardized range following the normalization process to facilitate their integration into the overall evaluation framework.
The quantification of the qualitative indicator
In the evaluation index system of the SMIC for UAV flight, qualitative indicators, although difficult to directly quantify via precise numerical values, significantly affect the evaluation results. The qualitative indicators selected in this study include terrain undulation, meteorological conditions, electromagnetic interference, noise tolerance, obstacle avoidance capability, and positioning accuracy, all of which directly affect UAV flight safety. However, in contrast to quantitative indicators, qualitative indicators cannot be directly measured via specific numerical values. These qualitative indicators require quantification, i.e., transforming the originally vague qualitative descriptions into numerical forms suitable for mathematical computation, before they can be used in a comprehensive evaluation system.
The specific steps are as follows:
Step 1: Establish the qualitative indicator set. On the basis of the qualitative indicators of the SMIC index system (Table 2), six indicators are identified to form the set .
Table 2.
Results of the evaluation of qualitative indicators by the -th expert.
Step 2: Establish the evaluation grade set. The evaluation grades are divided into five levels as follows:
The corresponding numerical assignments are as follows: “poor” = 0.1, “fair” = 0.2, “medium” = 0.3, “good” = 0.4, and “excellent” = 0.5.
Step 3: Fuzzy evaluation of indicators. The questionnaires are distributed to experts, who evaluate the six qualitative indicators according to their professional judgment, assigning scores corresponding to the evaluation set. Based on the expert responses, the membership degree of the -th indicator to the -th evaluation grade can be obtained.
The overall membership degree can then be calculated by
which yields the following fuzzy evaluation matrix:
The score vector for the qualitative indicators is obtained as follows:
Finally, the score for the -th indicator is expressed as follows:
On the basis of the fuzzy mathematics calculation steps presented above, the quantitative data for the qualitative indicators are derived.
2.2.3. The Calculation of the Comprehensive Evaluation Value
In this study, the weighted sum method is adopted for performing a comprehensive evaluation of the SMIC for UAV flight, thereby obtaining the value of .
where is the SMIC for UAV flight, is the value of each evaluation indicator, and is the weight of each evaluation indicator.
2.2.4. The Calculation of the Safety Margin
Building upon the previously described calculation of the SMIC, a computational model is employed for computing the quantified safety margin value of airspace grids.
For a determined UAV trajectory, the airspace model is represented as a set of grid cells }, where represents a single grid cell along the trajectory; represents the size of the airspace grid cell; is the SMIC for the UAV flight proposed earlier; is the minimum distance required for the UAV to recognize an obstacle and brake, considering the reaction time; and is the diagonal length of the UAV.
2.3. Encoding the ULA Airspace Grid Cell Type
When an airspace grid cell is the available type, no safety margin is required between the UAV and this grid cell; that is, the surrounding available grids have no safety buffer grids. For restricted grids occupied by static airspace obstacles, the surrounding safety buffer grids can be directly determined. However, for potential conflict grids occupied by UAVs [41], the position of the potential conflict grid occupied by the UAV at the current moment must be dynamically computed, and the safety buffer grids to be established around that grid must be determined.
3. Experiments and Results
3.1. Study Area
A region in Hubei Province, China, was selected as the experimental area for this study (Figure 4). The inset outlines the approximate extent of the urban district, and the internal green area highlights the selected study area. The main map presents its detailed geographic environment.
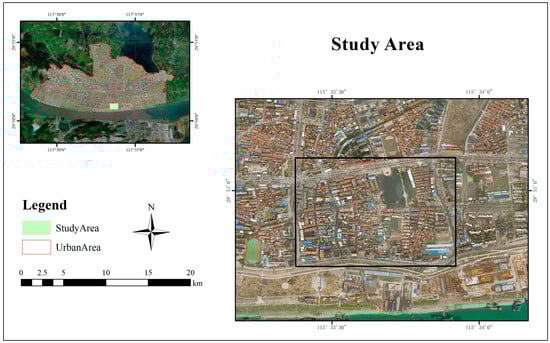
Figure 4.
Study area.
The selected study area contains densely built-up urban zones and open water bodies and is an ideal testbed for conducting UAV flight trajectory planning experiments in complex ULA airspace.
3.2. Data Description
The key data employed in the experiment are presented in Figure 5.
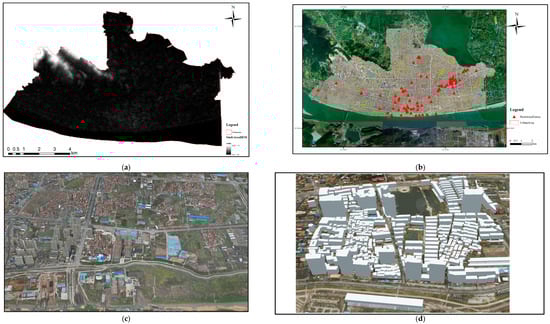
Figure 5.
Experimental data for the study area: (a) elevation, (b) no-fly zone, and (c,d) buildings.
- (1)
- Elevation Data of the Study Area
The terrain is a critical factor influencing UAV flight safety margins. This experiment primarily used GDEMV3 30-m resolution data of the digital elevation model (DEM) as the terrain for the simulation.
- (2)
- Airspace Restriction Data of the Study Area
As no explicit no-fly zones are designated in the study area, buildings containing points of interest, such as government offices, high-speed rail hubs, and construction sites, were designated as restricted airspace zones in this research.
- (3)
- Building Data of the Study Area
Building data, including 2D vector data and 3D building models, were collected for the study area. During UAV flight simulation, more detailed oblique photography-based models were used to construct airspace obstacles.
3.3. Experimental Procedure
3.3.1. Experimental Environment
The key experimental parameters were set on the basis of mainstream UAV specifications and the requirements of the study scenario (Table 3) to simulate the actual flight characteristics of multirotor UAVs in the ULA airspace.
Table 3.
Parameters of the simulation experiment.
The experiments assumed wind-free conditions, with the UAVs flying at a constant speed and neglecting acceleration and deceleration processes. Additionally, GNSS and wireless network signals were assumed to be available and stable across the experimental area. A spatiotemporal airspace grid model was constructed on the basis of the equipment parameters and flight conditions. Given the designated start and end points, the shortest UAV trajectory was planned using the ant colony optimization (ACO) algorithm. The safety buffer grids for this trajectory were computed, and the airspace grid model was dynamically updated.
3.3.2. Airspace Grid Encoding
The BeiDou 3D grid coding method was applied to construct and encode the grid model for the low-altitude airspace of the experimental area. Considering the grid hierarchy and UAV dimensions, the seventh-level grid (7.73 × 7.73 × 7.73 m3) was selected for encoding.
3.3.3. Property Encoding of Grid Cells
In the initial state, grids occupied by buildings and restricted zones were designated as restricted grids, and all other grids in the overall airspace were set as available grids. Figure 6 shows the resulting airspace grid model under the initial configuration.
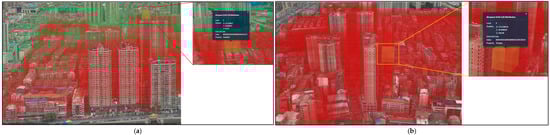
Figure 6.
Initial state of the ULA airspace grid: (a) available grid cells and (b) restricted grid cells.
Subsequently, based on the proposed evaluation model for the UAV flight safety margin influence coefficient in urban low-altitude environments, the extent of the safety buffer grids surrounding the restricted grids within the experimental low-altitude airspace was calculated.
The Calculation of the SMIC
First, the FAHP was employed to calculate the SMIC. The fuzzy mathematics method was used to transform the qualitative indicators in the evaluation system into quantifiable numerical data, ensuring their comparability in the comprehensive assessment. Then, key quantitative indicators for the experimental airspace were extracted from the building data, terrain data, and restricted zone point data. Finally, qualitative and quantitative indicators were integrated, and the SMIC for the UAV flight in the experimental area was calculated via the weighted sum model, thereby enabling the computation of the actual range of the safety buffer grids.
Step 1: The weight calculation of the evaluation indicators.
The criterion layer consists of three primary factors: airspace obstacles, the low-altitude environment, and UAV performance. Pairwise comparisons were conducted to construct the fuzzy judgment matrix (Table 4).
Table 4.
Fuzzy judgment matrix table at the guideline level.
The eigenmatrix was calculated via Equation (3):
The consistency index was obtained as , indicating logical consistency in the pairwise comparisons and validating the reliability of the weight distribution.
The results show that the relative importance of the primary factors is ranked as follows:
- Airspace obstacles: 0.4167;
- Low-altitude airspace environment: 0.3167;
- UAV performance: 0.2667.
The weights of the secondary and tertiary indicators were further derived via Equation (5). The final comprehensive weights are summarized in Table 5.
Table 5.
Comprehensive weighting used for the evaluation indicators of the SMIC for ULA drone flights.
Step 2: Quantification of evaluation indicators.
After the weights of the evaluation indicators were determined, the quantitative data collected from the experimental area were processed via Equations (6) and (7).
For qualitative indicators (e.g., meteorological conditions, electromagnetic interference, and noise tolerance), a fuzzy comprehensive evaluation was conducted by six domain experts familiar with the local environment and UAV operations. Each expert assigned a membership degree for the evaluation set, and the results were aggregated via fuzzy mathematics. The qualitative data were then derived via Equations (8)–(11). The fuzzy evaluation matrix , derived from the assessments of the six experts, is as follows:
Given that comparability across all indicators must be ensured, standardization was applied to unify units and scales. The integrated results of the quantitative and qualitative evaluation are presented in Table 6.
Table 6.
Normalized data for evaluation indicators.
Step 3: The calculation of the composite influence value.
On the basis of the weighted sum model (Equation (12)), the UAV flight safety margin influence factor for this area was subsequently calculated as .
Calculation of safety buffer grids around restricted grids
According to Equations (13) and (14), the safety buffer distance for UAV flight can be calculated as . Consequently, two grid cells were established as safety buffer grids around restricted grids and potential conflict grids to ensure UAV flight safety even in the event of unexpected incidents.
UAV Route Planning
When planning the first trajectory, only the restricted grids and their surrounding safety buffer grids were considered inaccessible units in the ACO process. The relevant pseudocode is shown in Algorithm 1.
| Algorithm 1: Algorithm pseudocode | |
| Ant Colony Optimization Process | |
| 1. | Initialize the urban low-altitude airspace model and algorithm parameters; |
| 2. | Compute the initial pheromone distribution between nodes; |
| 3. | for iteration = 1 to do: |
| 4. | Place n ants in the airspace model and initialize their path storage arrays; |
| 5. | for k = 1 to n do: |
| 6. | while ant k has not reached the destination do: |
| 7. | Update the airspace model at the current time step; |
| 8. | Explore the environment and calculate selection probabilities of candidate nodes; |
| 9. | Move the ant to the next node using a roulette wheel mechanism and store it in the path array; |
| 10. | Update pheromone evaporation rate and pheromone concentration along the path; |
| 11. | k = k + 1; |
| 12. | end for; |
| 13. | iteration = iteration + 1; |
| 14. | Update pheromone intensity; |
| 15. | end for; |
| 16. | Output the optimal path. |
3.4. Comparative Experiments
First, trajectory planning was conducted in the standard planning scenario (SPS), where no safety margins were considered. Two UAV missions with conflicting paths were planned within the same time interval, producing two trajectories. For comparison, trajectory planning was performed again under the same conditions in the safety margin planning scenario (SMPS). Safety margins were incorporated under the same conditions, and two additional trajectories were obtained.
To objectively evaluate the comprehensive performance differences among various trajectory options and systematically measure flight efficiency and safety levels, this paper proposes using the UAV trajectory length cost and trajectory threat cost as the core evaluation metrics. The trajectory length cost is defined as the actual path length traveled by the UAV along the planned trajectory, directly reflecting the economic and temporal cost of the flight. It is specifically defined as follows:
where is the SMIC for the UAV flight, and is the number of airspace grid cells traversed by the trajectory.
The threat value of a UAV trajectory is quantified by the time interval between its arrival and that of other UAVs at an intersecting airspace grid area. This metric reflects the degree of spatiotemporal conflict among multiple UAVs and is used to assess the associated safety risk. The formal definition is provided below.
where represents the threat value of the current UAV trajectory, is the number of airspace grid cells traversed by the trajectory, and denote the estimated time of arrival (ETA) at the same trajectory airspace grid cell for UAVs and , and is the minimum safe time separation threshold defined in the simulation parameters.
The start location, target location, and departure time are shown in Table 7. The comparative planning results under both environments are shown in Figure 7. Each planning experiment was independently repeated 100 times in both environments to ensure stability and reliability. The statistical results are summarized in Table 8.
Table 7.
Parameters and information for drone planning tasks.
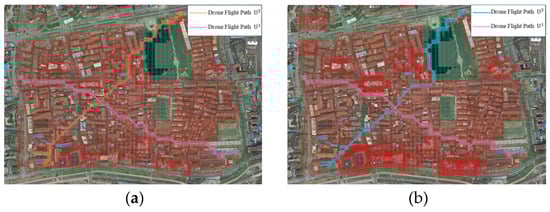
Figure 7.
Comparative results of drone flight path planning: flight path results for (a) SPS and (b) SMPS.
Table 8.
Experimental results under two planning scenarios.
3.5. Results
The experimental results indicate that UAV trajectories fly closely along building edges when safety margin constraints are neglected. Although the path cost is relatively low (1735.84), the threat cost is significantly high (115.7), which implies an increased risk of potential collisions. Conversely, the path cost increases (1849.78), but the threat cost is substantially reduced (65.6) when safety margin constraints are considered. Identifying safety margin constraints effectively decreases the risk of being extremely close to obstacles or other UAVs.
Comparative results indicate that the inclusion of safety margins can achieve a balance between path efficiency and flight safety. Furthermore, a moderate increase in the path cost significantly improves safety.
4. Discussion
For the first time, the aviation concept of the flight safety margin [29] is introduced in this study. The concept is adapted into a UAV flight safety margin and embedded within a ULA airspace grid model based on BeiDou 3D location encoding. Building on existing airspace evaluation methods [15], a fuzzy mathematical approach is employed to systematically process qualitative and quantitative indicators affecting the safety margin. In this scheme, in addition to calculating weights, a precise numerical value representing the overall safety level is synthesized. The experimental results demonstrate the effectiveness of integrating the quantified safety margin to dynamically update the grid states. Sacrificing a minor amount of path efficiency significantly reduces potential collision risks, allowing the balance of safety and efficiency to be achieved. The proposed framework not only enhances trajectory safety in single-UAV missions but also ensures stable avoidance and strong robustness in multi-UAV conflict scenarios. The findings validate the feasibility of the proposed model in complex urban environments.
The two-UAV intersection ( and ) scenario illustrated in Figure 8 is an example of the effectiveness of the proposed safety margin mechanism. In the SPS, the two UAVs, which flow at the same altitude along intersecting paths, collide in the next step, thereby exposing the inherent limitations and safety risks of optimal-path-only models. In the SMPS, the integration of safety margin buffer grids fundamentally alters the decision-making logic, in which the preplanned trajectory of UAV generates a dynamic safety buffer grid zone. When UAV approaches, its path-planning algorithm recognizes this zone and actively reroutes, and continuous safe separation between the two UAVs is ensured. This exemplar demonstrates the core capability of the proposed model in terms of shifting safety management from post-incident assessment to preemptive avoidance.
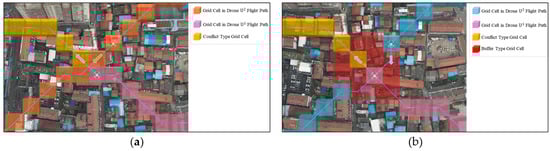
Figure 8.
UAV trajectory planning at the moment of encounter: (a) SPS at T = 31 and (b) SMPS at T = 33.
By incorporating a UAV safety margin into the planning process, initially planned trajectories generate potential conflict grids and establish corresponding safety buffer grids. The airspace occupied by these grids is then treated as an exclusion zone for any subsequently planned UAV entering the intersection area, forcing a detour. Once the occupancy period expires, the grids are reset to available grids, ensuring all UAVs can reach their destinations through this dynamic management.
This process proves that UAVs can construct safety buffer grids in conflict zones with minimal time and space penalties. These buffers enable slight trajectory modifications to maintain a safe distance from other UAVs, thereby substantially boosting the overall safety margin.
Compared with prior studies that have focused primarily on static obstacle avoidance [42,43], this work advances a quantifiable and computable redundancy model. This model comprehensively considers static airspace obstacles, environmental factors, and UAV performance constraints and applies them to a typical urban scenario characterized by high-density building clusters and complex airspace regulations [24]. Whereas traditional planning avoids conflicts by creating spatial separation or temporal gaps, our safety margin method provides a new approach for resolving multi-UAV trajectory conflicts [28]. This approach offers a practical technical pathway for refined low-altitude airspace management and future urban air mobility integration.
Nevertheless, certain limitations remain. The experiments in this study were conducted via simulated data and have not yet been validated in real UAV flight tests. The model also needs to integrate environmental factors (i.e., wind field disturbances and public acceptance) and algorithmic diversity. Future work will involve field flight testing, cross-national coding systems, and multi-algorithm comparisons to enhance the model’s applicability in larger-scale and more complex operational environments.
5. Conclusions
A specific area in Hubei Province, China, was selected as the study area. For model construction, building data were integrated into topographic information, densely populated areas were designated as no-fly zones, the UAV flight safety margin was quantified, and a low-altitude airspace grid model was constructed. Multi-UAV trajectory planning was conducted on the basis of this model. The simulation results indicate that the proposed model can effectively enhance UAV flight safety, providing methodological support for safety management and refined modeling of the ULA airspace. Notably, real UAV flight experiments have not yet been conducted. Future studies will incorporate field trials to further validate the practicality and reliability of the proposed approach.
Author Contributions
Conceptualization, H.C. and M.D.; methodology, H.C., S.C. and M.D.; software, H.C., S.C. and P.W.; validation, P.W., X.D. and C.H.; formal analysis, H.C. and X.D.; investigation, P.W.; resources, C.H.; data curation, X.D., Y.C. and K.J.; writing—original draft preparation, H.C.; writing—review and editing, M.D., X.D. and H.C. All authors have read and agreed to the published version of the manuscript.
Funding
This research was funded by the National Nature Science Foundation of China (Grant Nos. 42401555 and 42471517) and the Hubei Provincial Natural Science Foundation of China (Grant No. JCZRQN202400143).
Institutional Review Board Statement
Not applicable.
Informed Consent Statement
Not applicable.
Data Availability Statement
The data presented in this study are available on request from the corresponding author. The data are not publicly available due to their integration within the team’s internal database, which is structured for internal access and use. Direct public access to this database is not feasible due to operational, privacy, and security protocols.
Conflicts of Interest
The authors declare no conflicts of interest.
Abbreviations
| ULA | Urban Low Altitude |
| UAV | Unmanned Aerial Vehicle |
| SMIC | Safety Margin Influence Coefficient |
| GeoSOT | Geographic Coordinate Subdividing Grid with One-Dimension Integral Coding on 2n—Tree |
| FAHP | Fuzzy Analytic Hierarchy Process |
| DEM | Digital Elevation Model |
| GNSS | Global Navigation Satellite System |
| ACO | Ant Colony Optimization |
| SPS | Standard Planning Scenario |
| SMPS | Safety Margin Planning Scenario |
| ETA | Estimated Time of Arrival |
References
- Qiu, S.; Yao, D.; Wang, Z. Analysis of low-altitude airspace. J. Phys. Conf. Ser. 2019, 1302, 042032. [Google Scholar] [CrossRef]
- Wei, Z.; Meng, Z.; Lai, M.; Wu, H.; Han, J.; Feng, Z. Anti-collision technologies for unmanned aerial vehicles: Recent advances and future trends. IEEE Internet Things J. 2021, 9, 7619–7638. [Google Scholar] [CrossRef]
- Guan, X.; Shi, H.; Xu, D.; Zhang, B.; Wei, J.; Chen, J. The exploration and practice of low-altitude airspace flight service and traffic management in China. Green Energy Intell. Transp. 2024, 3, 100149. [Google Scholar] [CrossRef]
- Pang, B.; Tan, Q.; Ra, T.; Low, K.H. A risk-based UAS traffic network model for adaptive urban airspace management. In Proceedings of the AIAA Aviation 2020 Forum, Online, 15–19 June 2020; AIAA: Reston, VA, USA, 2020; p. 2900. [Google Scholar]
- Zhu, Y.; Zhang, X.; Li, Y.; Liu, Y.; Ma, J. Grid matrix-based ground risk map generation for unmanned aerial vehicles in urban environments. Drones 2024, 8, 678. [Google Scholar] [CrossRef]
- Guérin, J.; Delmas, K.; Guiochet, J. Certifying emergency landing for safe urban UAV. In Proceedings of the 51st Annual IEEE/IFIP International Conference on Dependable Systems and Networks Workshops (DSN-W), Taipei, Taiwan, 21–24 June 2021; IEEE: Piscataway, NJ, USA, 2021; pp. 55–62. [Google Scholar]
- Primatesta, S.; Guglieri, G.; Rizzo, A. A risk-aware path planning strategy for UAVs in urban environments. J. Intell. Robot. Syst. 2019, 95, 629–643. [Google Scholar] [CrossRef]
- Spyrou, K.J.; Koromila, I.A. A risk model of passenger ship fire safety and its application. Reliab. Eng. Syst. Saf. 2020, 200, 106937. [Google Scholar] [CrossRef]
- Feng, O.; Zhang, H.; Tang, W.; Wang, F.; Feng, D.; Zhong, G. Digital low-altitude airspace unmanned aerial vehicle path planning and operational capacity assessment in urban risk environments. Drones 2025, 9, 320. [Google Scholar] [CrossRef]
- Vincent-Boulay, N.; Marsden, C.; Cui, A. Data-driven geospatial modeling for complex airspace environments. In Proceedings of the AIAA SCITECH 2024 Forum, Orlando, FL, USA, 8–12 January 2024; AIAA: Reston, VA, USA, 2024; p. 0571. [Google Scholar]
- Chen, S.; Zhang, X.; Zhang, W. Cognition and modeling of urban low-altitude. In Proceedings of the 2024 International Conference on Artificial Intelligence and Autonomous Transportation: Volume V, Beijing, China, 6–8 December 2024; Springer Nature: Cham, Switzerland, 2025; Volume 1393, pp. 387–395. [Google Scholar]
- Liu, Q.; Zhao, X.; Wang, X.; Qin, M.; Sun, W. A multi-scale airspace sectorization framework based on QTM and HDQN. Aerospace 2025, 12, 552. [Google Scholar] [CrossRef]
- Han, B.; Qu, T. A dynamic airspace grid map based on 3D subdivision framework. Int. Arch. Photogramm. Remote Sens. Spat. Inf. Sci. 2025, 48, 555–560. [Google Scholar] [CrossRef]
- Mohamed Salleh, M.F.B.; Low, K.H. Concept of operations (ConOps) for traffic management of unmanned aircraft systems (TM-UAS) in urban environment. In Proceedings of the AIAA Information Systems—AIAA Infotech@Aerospace, Grapevine, TX, USA, 9–13 January 2017; AIAA: Reston, VA, USA, 2017; p. 0223. [Google Scholar]
- Zhu, D.; Chen, Z.; Xie, X.; Chen, J. Discretization method to improve the efficiency of complex airspace operation. Aerospace 2023, 10, 780. [Google Scholar] [CrossRef]
- Labib, N.S.; Danoy, G.; Musial, J.; Brust, M.R.; Bouvry, P. A multilayer low-altitude airspace model for UAV traffic management. In Proceedings of the 9th ACM Symposium on Design and Analysis of Intelligent Vehicular Networks and Applications, Miami Beach, FL, USA, 25–29 November 2019; ACM: New York, NY, USA, 2019; pp. 57–63. [Google Scholar]
- Kopardekar, P.H. Unmanned Aerial System (UAS) Traffic Management (UTM): Enabling Low-Altitude Airspace and UAS Operations; National Aeronautics and Space Administration: Washington, DC, USA, 2014. [Google Scholar]
- Zhai, W.; Tong, X.; Miao, S.; Cheng, C.; Ren, F. Collision detection for UAVs based on GeoSOT-3D grids. ISPRS Int. J. Geo-Inf. 2019, 8, 299. [Google Scholar] [CrossRef]
- Shen, K.; Shivgan, R.; Medina, J.; Dong, Z.; Rojas-Cessa, R. Multidepot drone path planning with collision avoidance. IEEE Internet Things J. 2022, 9, 16297–16307. [Google Scholar] [CrossRef]
- Guan, X.; Lyu, R.L.; Shi, H.X.; Chen, J. A survey of safety separation management and collision avoidance approaches of civil UAS operating in integration national airspace system. Chin. J. Aeronaut. 2020, 33, 2851–2863. [Google Scholar] [CrossRef]
- Vincent-Boulay, N.; Marsden, C. A geospatial approach to modeling airspace risk factors. J. Open Aviat. Sci. 2025, 3, 1–22. [Google Scholar] [CrossRef]
- Zhang, M. Safe path correction method for ambulance aircraft based on low-altitude wind prediction. IEEE Access 2020, 8, 20577–20596. [Google Scholar] [CrossRef]
- Yang, J.; Wang, Y.; Hang, X.; Delahaye, D. A review on airspace design and risk assessment for urban air mobility. IEEE Access 2024, 12, 157599–157611. [Google Scholar] [CrossRef]
- Sunil, E.; Hoekstra, J.; Ellerbroek, J.; Bussink, F.; Nieuwenhuisen, D.; Vidosavljevic, A.; Kern, S. Metropolis: Relating airspace structure and capacity for extreme traffic densities. In Proceedings of the 11th USA/Europe Air Traffic Management R&D Seminar (ATM Seminar 2015), Lisbon, Portugal, 23–26 June 2015. [Google Scholar]
- Xie, H.; Ji, X.; Yin, J.; Zhu, Y.; Wu, Y.; Dai, S. Standardization of safety separation for multi-category unmanned aerial vehicles in low-altitude airspace operations. Appl. Sci. 2025, 15, 7501. [Google Scholar] [CrossRef]
- Tuncal, A.; Erol, U. Integrating unmanned aerial vehicles in airspace: A systematic review. J. Aviat. Res. 2024, 6, 89–115. [Google Scholar] [CrossRef]
- Baum, M.S. Unmanned Aircraft Systems Traffic Management: UTM; CRC Press: Boca Raton, FL, USA, 2021. [Google Scholar]
- Kopardekar, P.; Rios, J.; Prevot, T.; Johnson, M.; Jung, J.; Robinson, J.E., III. Unmanned aircraft system traffic management (UTM) concept of operations. In Proceedings of the AIAA Aviation Forum and Exposition, Washington, DC, USA, 13–17 June 2016. [Google Scholar]
- Du, Z.M.; Fan, J.Z. Progress and application of safety margin research. China Saf. Sci. J. 2004, 14, 6–10. (In Chinese) [Google Scholar]
- Sahr, K.; White, D.; Kimerling, A.J. Geodesic discrete global grid systems. Cartogr. Geogr. Inf. Sci. 2003, 30, 121–134. [Google Scholar] [CrossRef]
- Zhou, J.; Ben, J.; Wang, R.; Zheng, M.; Du, L. Lattice quad-tree indexing algorithm for a hexagonal discrete global grid system. ISPRS Int. J. Geo-Inf. 2020, 9, 83. [Google Scholar] [CrossRef]
- Geospatial Intelligence in Joint Operations. Available online: https://irp.fas.org/doddir/dod/jp2_03.pdf (accessed on 18 August 2025).
- Headquarters, Department of the Army. Grids and Grid References; U.S. Government Printing Office: Washington, DC, USA, 1967; pp. 17–20. [Google Scholar]
- MicroImages Inc. Google Maps Structure. Available online: http://www.microimages.com/documentation/TechGuides/78googleMapsStruc.pdf (accessed on 17 May 2012).
- Cheng, C.; Tong, X.; Chen, B.; Zhai, W. A subdivision method to unify the existing latitude and longitude grids. ISPRS Int. J. Geo-Inf. 2016, 5, 161. [Google Scholar] [CrossRef]
- Sun, G.; Qu, T.; Han, B.; Sun, H.; Zhang, Q. Research on airspace grid modeling based on GeoSOT global subdivision model. In Proceedings of the 2021 IEEE 3rd International Conference on Civil Aviation Safety and Information Technology (ICCASIT), Weihai, China, 14–16 October 2021; IEEE: Piscataway, NJ, USA, 2021; pp. 501–505. [Google Scholar]
- GB/T 39409-2020; BeiDou Grid Code. China National Standardization Administration: Beijing, China, 2020.
- Shu, P.; Zheng, Y.; Shi, H.; Liu, S.; Sun, H.; Zhou, X. Three-dimensional grid model of airspace resources based on Beidou grid code. In Proceedings of the 2021 IEEE 3rd International Conference on Civil Aviation Safety and Information Technology (ICCASIT), Weihai, China, 14–16 October 2021; IEEE: Piscataway, NJ, USA, 2021; pp. 380–383. [Google Scholar]
- Wang, S.; Zhan, X.; Zhai, Y.; Chi, C.; Shen, J. Highly reliable relative navigation for multi-UAV formation flight in urban environments. Chin. J. Aeronaut. 2021, 34, 257–270. [Google Scholar] [CrossRef]
- Lyu, H.M.; Sun, W.J.; Shen, S.L.; Zhou, A.-N. Risk assessment using a new consulting process in fuzzy AHP. J. Constr. Eng. Manag. 2020, 146, 04019112. [Google Scholar] [CrossRef]
- Zhang, J.; Li, Z.; Luo, X.; Zhao, Y.; Lu, F. Study of urban unmanned aerial vehicle separation in free flight based on track prediction. Appl. Sci. 2024, 14, 5712. [Google Scholar] [CrossRef]
- Liu, M.; Zhang, H.; Yang, J.; Zhang, T.; Zhang, C.; Bo, L. A path planning algorithm for three-dimensional collision avoidance based on potential field and B-spline boundary curve. Aerosp. Sci. Technol. 2024, 144, 108763. [Google Scholar] [CrossRef]
- Liu, H.; Wu, G.; Zhou, L.; Pedrycz, W.; Suganthan, P.N. Tangent-based path planning for UAV in a 3-D low altitude urban environment. IEEE Trans. Intell. Transp. Syst. 2023, 24, 12062–12077. [Google Scholar] [CrossRef]
Disclaimer/Publisher’s Note: The statements, opinions and data contained in all publications are solely those of the individual author(s) and contributor(s) and not of MDPI and/or the editor(s). MDPI and/or the editor(s) disclaim responsibility for any injury to people or property resulting from any ideas, methods, instructions or products referred to in the content. |
© 2025 by the authors. Licensee MDPI, Basel, Switzerland. This article is an open access article distributed under the terms and conditions of the Creative Commons Attribution (CC BY) license (https://creativecommons.org/licenses/by/4.0/).