Featured Application
This study provides full-scale crash test evidence demonstrating the effectiveness of Truck-Mounted Attenuators (TMAs) in reducing occupant injury during high-speed rear-end collisions in highway work zones. The results can be directly applied to improve roadside safety hardware design, optimize TMA configurations, and support the development or revision of evaluation standards for work-zone protection systems. In addition, the comparison between FSM (Flail Space Model)-based indices and ATD (Anthropomorphic Test Device)-measured responses offers practical guidance for enhancing occupant injury assessment methodologies in future safety evaluations.
Abstract
Rear-end collisions involving maintenance vehicles remain a critical source of severe injuries and fatalities in highway work zones. Existing studies on Rear Impact Guards (RIGs) and Truck-Mounted Attenuators (TMAs) have primarily relied on vehicle-based acceleration metrics or low-speed tests, leaving uncertainty regarding their performance under high-energy impact conditions. This study investigates occupant injury risk and vehicle crash behavior through full-scale frontal impact tests conducted at 80 km/h using a 2002 Renault SM520 passenger car against (1) a truck equipped with a RIG and (2) the same truck equipped with a TMA. Hybrid III 50th percentile ATDs, high-speed imaging, and multi-axis accelerometers were employed to measure occupant kinematics and injury responses. Occupant Risk Indices (THIV (Theoretical Head Impact Velocity), ASI (Acceleration Severity Index), PHD (Post-impact Head Deceleration), and ORA (Occupant Ridedown Acceleration)) and the ATD-based HIC36 were evaluated to assess crash severity. The RIG test exhibited severe underride, resulting in an HIC36 value of 1810, far exceeding the FMVSS 208 limit. In contrast, the TMA significantly reduced occupant injury risk, lowering HIC36 by 83.5%, and maintained controlled vehicle deceleration without compartment intrusion. Comparisons between FSM-based indices and ATD-measured injury responses revealed discrepancies in impact timing and occupant motion, highlighting limitations of current evaluation methodologies. The findings demonstrate the necessity of high-speed testing and ATD-based injury assessment for accurately characterizing RIG/TMA performance and provide evidence supporting improvements to roadside safety hardware standards and work-zone protection strategies.
1. Introduction
In the United States, the total number of victims from rear-end collisions slightly increased from 9211 in 2018 to 9630 in 2023. The number of fatalities during the same period averaged approximately 2890 per year, with the highest record in 2021 at 3255 deaths. For suspected serious injuries, the annual average was 834, and for fatal injuries, the average was 2890. Altogether, severe or fatal injuries accounted for about 39% of all cases, representing a significant proportion [1]. Although No Apparent Injuries represented approximately 35% of total casualties, the continuous occurrence of serious and fatal injuries demonstrates that the risks associated with rear-end collisions cannot be overlooked.
Work zones are frequently established due to pavement deterioration or structural distress arising from environmental factors and long-term traffic loading. According to data from the Federal Highway Administration (FHWA) and the National Highway Traffic Safety Administration (NHTSA), rear-end collisions in work zones accounted for about 21% of all work zone accidents in 2022 [2]. In the absence of adequate energy-absorbing devices, rear-end collisions often lead to catastrophic outcomes, underscoring the importance of effective crash energy management systems.
On ordinary roads and highways, maintenance or construction projects are often carried out by closing only partial lanes in order to minimize traffic disruption. In such situations, both workers and vehicle occupants must be simultaneously protected from collisions. However, the protective capacity of Rear Impact Guards (RIGs) alone has proven insufficient in preventing severe occupant injuries during high-speed rear-end impacts. To enhance safety, TMAs are attached to the rear of work trucks, where they absorb and dissipate collision energy, protecting both the occupants of the impacting vehicle and workers ahead of the support truck.
In this study, full-scale crash tests were conducted at an impact speed of 80 km/h, which is notably higher than the 56 km/h conditions commonly used in previous research and more representative of real-world rear-end collisions involving maintenance vehicles. The tests evaluated the collision behavior and occupant responses of a passenger vehicle impacting a support truck equipped with a RIG, followed by additional tests using a TMA to examine differences in vehicle motion, underride behavior, and Occupant Risk Indices. Furthermore, the relationships between Occupant Risk Indices—derived from vehicle kinematic data used in roadside safety hardware evaluations—and Occupant Injury Indices—derived from Hybrid III ATD measurements—were analyzed. Using 44 full-scale crash test datasets collected in 2024, the occurrence timing and sequence of each index were compared to identify the specific collision phases they represent and to evaluate potential limitations, such as indices that may omit critical events or provide information unrelated to actual injury risk.
This study addresses the limitations of previous RIG and TMA research by incorporating high-speed (80 km/h) full-scale crash testing, direct ATD-based injury measurements, and a comparative assessment against conventional FSM-based indices. By highlighting discrepancies between theoretical occupant risk metrics and actual ATD kinematics, this work provides new insights into the validity and applicability of current evaluation methodologies for roadside safety hardware. Therefore, the objective of this study is to experimentally evaluate and compare occupant injury risk between RIG- and TMA-equipped vehicles under high-speed impact conditions and to clarify the relationship between vehicle-derived indices and true biomechanical injury responses.
This study offers three methodological innovations beyond existing RIG/TMA research. First, unlike previous studies that mainly relied on low-speed (50–60 km/h) evaluations or vehicle-based acceleration data, this work conducts high-energy 80 km/h full-scale crash tests with ATD instrumentation, enabling more realistic assessment of severe rear-end collisions. Second, a direct comparative framework is introduced between FSM-derived indices (THIV, ASI, PHD) and ATD-measured injury responses (HIC36), revealing fundamental differences in index occurrence timing and occupant kinematics that have not been identified in prior studies. Third, by analyzing 44 full-scale crash tests, this study provides the first systematic investigation of the temporal sequence of major occupant risk indices, offering methodological insight for future performance evaluation standards.
2. Current Status and Performance Test Criteria
2.1. Rear-End Collision Characteristics and RIG Standards
When a TMA is not installed, the impacting vehicle may slide underneath the rear of the work truck—a phenomenon known as underride. To prevent this, FMVSS (Federal Motor Vehicle Safety Standard) No. 223 specifies static load testing and installation requirements for RIGs [3]. However, limited research and standards exist to evaluate the actual effectiveness of static load tests under real-world dynamic collision conditions.
As of 2022, rear-end collisions in work zones accounted for approximately 21% of all work zone crashes. A GAO (Government Accountability Office) report showed that between 2008 and 2017, an annual average of 219 fatal underride collisions involving large trucks occurred, accounting for about 0.63% of all traffic fatalities [4]. In 2008 alone, 539 fatal rear-end truck crashes were reported, of which about 63% involved underride; in 26% of these, passenger vehicles intruded under the truck’s rear up to the windshield [5].
In Europe, United Nations Economic Commission for Europe (UNECE) Regulation No. 58—Uniform Provisions Concerning the Approval of Rear Underrun Protective Devices (RUPDs) [6] specifies the installation requirements and static load testing procedures for rear underrun protection plates. However, this regulation does not include provisions for full-scale crash testing.
In the United States, the FMVSS No. 223 outlines static load testing methods, as illustrated in Figure 1, but these differ significantly from the dynamic loads experienced during actual collisions. Consequently, a final rule was issued to strengthen the performance requirements, adopting Canada’s CMVSS 223 standard [7]. The updated regulation mandates that RIGs must be capable of protecting occupants of small passenger vehicles colliding at a speed of 56 km/h. The rule also emphasizes the necessity of conducting full-scale crash tests to accurately evaluate the real-world performance of RIGs [2].
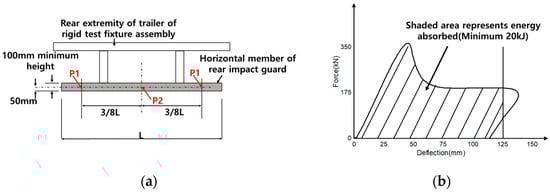
Figure 1.
Rear Impact Guard Energy Absorption Test [3]: (a) Point Load Test Locations, where P1 represents the two outer loading points and P2 denotes the central loading point; (b) Typical Force Deflection Diagram.
In the study by BRUMBELOW [8], a series of RIG crash tests were conducted The severity of occupant injuries was assessed using the HIC measured from an ATD. The results demonstrated that depending on the impact speed and condition, RIGs could fail structurally, leading to severe underride. In particular, the 2007 Hyundai full-width and 2011 Wabash 30% overlap tests showed significant underride accompanied by high HIC values and serious injury risks, as shown in Table 1.

Table 1.
Crash test result of Rear impact guard [8].
2.2. TMA Performance Evaluation Standards
Currently, the performance evaluation of TMAs is regulated under the Manual for Assessing Safety Hardware (MASH) in the United States [9], CEN/TS 16786: Road Restraint Systems—Truck-Mounted Attenuators—Performance Classes, Impact Test Acceptance Criteria, and Test Performance in Europe [10], and CD 378: Design Manual for Roads and Bridges—Impact Test and Assessment Criteria for Truck-Mounted Attenuators in the United Kingdom [11].
Although the general objectives are similar, the specific testing and evaluation procedures vary among these standards. Across all regions, TMA performance assessments have traditionally relied on vehicle acceleration and angular velocity data obtained during crash testing. However, studies that analyze Occupant Injury Indices derived from ATD measurements remain limited.
2.3. Existing Occupant Risk and Injury Indices
The occupant risk indices used in roadside safety hardware evaluations and the occupant injury indices applied in car assessment tests are summarized as follows.
2.3.1. Flail Space Model (FSM)
Michie [12] first introduced the Flail Space Model (FSM) as part of the crash testing procedures described in NCHRP Report 230 [13]. The model was subsequently maintained in NCHRP Report 350 [14] and continues to be adopted in the current MASH guidelines. FSM simplifies the interaction between the vehicle and the occupant during impact into a two-stage process [12].
First, upon impact, the vehicle begins to decelerate while the occupant continues moving forward at the pre-impact velocity. This results in contact between the occupant and the vehicle’s interior components such as the dashboard, windshield, or steering wheel.
Second, after this contact, the occupant remains in contact with the interior and experiences the same acceleration as the vehicle for the remainder of the crash event.
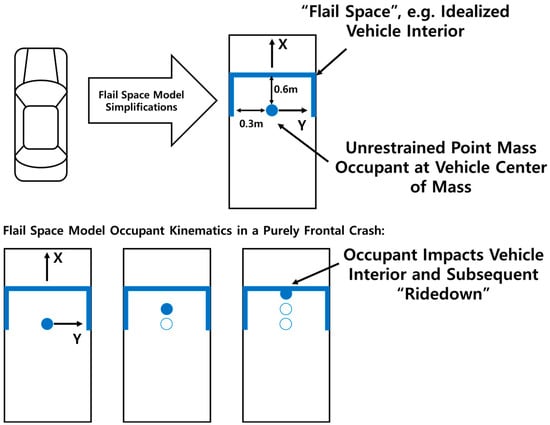
Figure 2.
FSM assumptions and simplifications [15].
- The occupant is assumed to be an unrestrained point mass positioned at the vehicle center of mass.
- Distances that the occupant is allowed to “flail” prior to impacting the vehicle interior are assumed to be 0.6 m (2 feet) longitudinally (i.e., parallel with the typical vehicle travel direction) and 0.3 m (1 foot) in the lateral direction.
- Occupant impact with the vehicle interior is completely inelastic (i.e., the occupant subsequently remains in contact with the vehicle interior and does not rebound).
- Vertical accelerations of the vehicle, as well as vehicle roll, pitch, and yaw motions, are ignored. This implies that the longitudinal/lateral motions of the occupant are independent.
As summarized above, FSM represents a simplified model of the vehicle–occupant interaction during a crash. It does not account for the effects of occupant restraint systems such as seatbelts or airbags.
It should be noted that FSM-based indices (such as THIV, ASI, and PHD) do not account for pitch rotation of the vehicle. This limitation makes FSM potentially less accurate in underride-prone collisions, where the vehicle wedges beneath the structure and tilts downward, compared with flat barrier impacts where pitch motion is minimal.
2.3.2. OIV (Occupant Impact Velocity) and THIV (Theoretical Head Impact Velocity)
In the FSM, the relative impact velocity between the virtual occupant and the vehicle interior is defined as the OIV and the THIV. OIV and THIV represent the relative velocity of the occupant at the moment of impact with the vehicle interior, and OIV is calculated as shown in Equation (1). The longitudinal (x-direction) and lateral (y-direction) motions are considered independently. The variable t represents the time required for the occupant to travel 0.6 m longitudinally or 0.3 m laterally. Typically, 0.6 m corresponds to an impact with the windshield, while 0.3 m represents an impact with the left-side window on the driver’s side. The longitudinal component of OIV is limited to 12.2 m/s, and the lateral component is limited to 4.9 m/s.
The calculation procedure for the THIV is described in detail in MASH [9] and EN 1317-1: Road Restraint Systems—Part 1: Terminology and General Criteria for Test Methods (Brussels) [16]. Unlike the OIV calculation, the THIV formulation considers the effect of vehicle rotation and is computed as shown in Equation (2). It represents the velocity of the head at the moment it first impacts the virtual plane—either in the longitudinal or lateral direction—within the vehicle’s xy-coordinate system. Here, T denotes the flight time of the head and Vx and Vy are the relative velocities of the head with respect to the vehicle coordinate system.
For frontal impacts, the threshold value of THIV is limited to 44 km/h.
2.3.3. ORA (Occupant Ridedown Acceleration) and PHD (Post-Impact Head Deceleration)
After the occupant’s head contacts the interior wall of the vehicle, it is assumed to move together with the vehicle until the end of the collision. Under this assumption, the acceleration experienced by the vehicle is considered to be the same as that acting on the occupant’s head. PHD is determined as the maximum value among the 10 ms moving average accelerations of ax and ay, and is calculated as shown in Equation (3). In Equation (3), ax and ay represent the 10 ms averaged accelerations in the longitudinal and lateral directions, respectively. The threshold limit for PHD is 20 g (gravitational acceleration), and higher values indicate an increased risk of occupant injury. ORA is calculated using only the longitudinal and lateral acceleration components of the vehicle. ORA is defined as the maximum value of the 10 ms moving average acceleration occurring after the OIV event, with a limit value of 20.49 g. Conceptually, PHD is similar to ORA, but instead of evaluating the directional components separately, it employs the resultant acceleration magnitude. Assuming that the occupant’s head moves in unison with the vehicle after striking the interior wall, both are considered to experience identical accelerations. Although the revised EN 1317-1 standard has removed PHD from its evaluation indices, some regions continue to utilize it for Occupant Risk Index analyses, and its calculation procedure is still presented in MASH.
2.3.4. ASI (Acceleration Severity Index)
The ASI is an index derived from the theoretical relationship between the magnitude and duration of acceleration acting on the human body and the likelihood of injury occurrence. ASI can be calculated using Equation (4), as defined in MASH [9] and EN 1317-1 [16], based on the tri-axial accelerations (ax, ay, az) measured at the vehicle’s center of gravity. It is expressed as a dimensionless scalar representing the quadratic sum of the ratios of the measured accelerations to their respective threshold limits. When the ASI value exceeds 1.0, the risk of injury to the occupant increases significantly.
2.3.5. HIC (Head Injury Criteria)
The HIC is an index derived from the correlation between the acceleration acting on the head of an ATD and the severity of head injury, as used in Car Assessment Tests. HIC serves as a quantitative measure of head injury severity, and its calculation procedure is presented in the FMVSS No. 208: Occupant Crash Protection [17].
It is computed using the resultant acceleration of the ATD’s head during impact, as expressed in Equation (5), where the time interval (t2 − t1) is defined as either 15 ms or 36 ms. When the time interval is set to 15 ms, the index is denoted as HIC15, and when it is 36 ms, it is referred to as HIC36. HIC15 is typically applied to short-duration impacts such as those involving the vehicle hood, whereas HIC36 is used to evaluate head impacts within the vehicle interior. According to FMVSS 208, the threshold limit for HIC36 is set at 1000. In this study, because the impact condition involved a full-frontal collision, HIC36 was employed for the injury assessment.
2.3.6. Limit Values and Occurrence Time
The threshold limits for the Occupant Risk Indices used in roadside safety hardware performance evaluations and the Occupant Injury Indices employed in car assessment tests are summarized in Table 2.
Table 2.
Limit Values by Regulation.
According to CEN/TS 16786 [10] and CD 378 [11], the maximum allowable value for the THIV is 44 km/h, and the limit for the ASI is 1.9. In MASH [9], the longitudinal and lateral limits for the OIV are specified as 12.2 m/s and 4.9 m/s, respectively. The upper limit of the ORA is 20.49 g, while FMVSS 208 [17] stipulates that the maximum permissible value of HIC36 is 1000. In a frontal impact, THIV and OIV yield equivalent values, as do PHD and ORA. THIV (or OIV) represents the occupant risk during the mid-phase of the collision, whereas PHD (or ORA) reflects the risk associated with the latter phase of the impact. Acceleration peaks occurring before the THIV (or OIV) event are not considered. In contrast, ASI and HIC are evaluated based on their maximum values over the entire collision duration and therefore do not correspond to a specific phase of the impact event. An analysis of 44 full-scale roadside safety hardware crash tests that we conducted during 2024 showed that the average ASI value was 1.30, occurring at approximately 0.088 s, while the average THIV was 36.7 km/h, occurring at about 0.109 s, as shown in Figure 3.
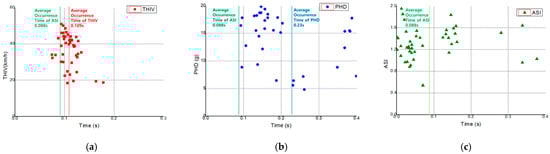
Figure 3.
Occurrence Times of THIV, PHD, and ASI: (a) THIV; (b) PHD; (c) ASI.
In 30 of these tests, ASI occurred earlier than THIV, indicating that ASI generally appears in the early phase of the collision, THIV (or OIV) during the mid-phase, and PHD (or ORA) in the latter phase.
To clarify the biomechanical relevance of these indices, it is important to note that THIV and OIV are surrogate measures of the relative velocity at which the occupant’s head or upper body is expected to contact the vehicle interior, and therefore relate directly to the likelihood of head injury. ASI is a global measure of the severity of acceleration transmitted to the occupant’s body and has been shown to correlate with the probability of thoracic injury. PHD represents the magnitude of deceleration experienced by the head after contact with the interior surface, reflecting the potential for head and neck loading during the latter phase of the crash. Although these indices provide useful approximations of occupant loading, they are derived from simplified assumptions in the Flail Space Model and do not fully capture the influence of seatbelts, airbags, or three-dimensional occupant kinematics. Consequently, comparisons with ATD-based injury measurements, such as HIC36, are essential for understanding the actual biomechanical injury risk during rear-end impacts.
3. Full-Scale Crash Test
3.1. Full-Scale Test Conditions
In this study, full-scale crash tests were conducted for two configurations: one equipped with a RIG and the other with a TMA. The support vehicle used in the tests was a 1995 Hyundai 10 t truck. The RIG, as shown in Figure 4a,b, had a cross-sectional dimension of 0.08 m (L) × 0.16 m (H) × 2.34 m (W) and was mounted at a height of 0.55 m above the ground. The TMA used in the test was specially designed and fabricated to demonstrate ideal energy-absorbing behavior. It consisted of twelve cylindrical steel tubes with a diameter of 0.6 m, height of 0.7 m, and thickness of 6 mm. The overall dimensions of the TMA assembly were 3.0 m in length, 1.8 m in width, and 0.7 m in height, and it was attached to the rear of the support truck as shown in Figure 4c,d.
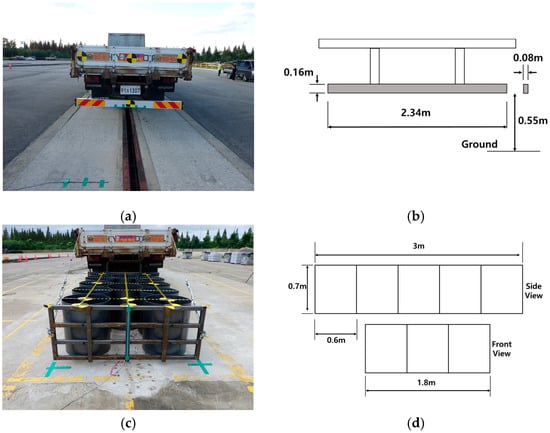
Figure 4.
Test set-up Rear Impact condition: (a) RIG; (b) RIG specification; (c) TMA; (d) TMA specification.
The impact speed of 80 km/h was chosen because it corresponds to both typical approach speeds on public roadways and the classification ranges defined in international safety standards. MASH specifies TMA performance categories at 50, 70, and 100 km/h, whereas the European PD CEN/TS 16786 defines test speeds at 50, 80, and 100 km/h. Therefore, selecting 80 km/h provides a realistic mid-level impact condition consistent with established certification criteria.
The impact vehicle, shown in Figure 5, was a 2002 Renault SM520 (Renault Korea, Busan, Republic of Korea) sedan with a curb weight of 1300 kg.
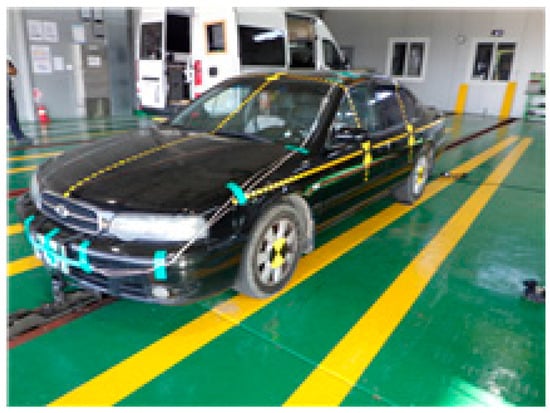
Figure 5.
Test Car (1300 kg).
3.2. Data Acquisition
To evaluate the Occupant Risk Indices (ORI), accelerometers and gyro sensors were installed at the vehicle’s center of gravity, as illustrated in Figure 6, to record motion data during the crash. For the calculation of the HIC, acceleration data were obtained using a Hybrid III 50th percentile ATD (Humanetics, MI, USA). As summarized in Table 3 and shown in Figure 6, three accelerometers and one gyro sensor were mounted at the vehicle’s center of gravity, while three additional accelerometers were attached to the ATD’s head. As shown in Figure 7, the unbelted ATD was positioned in the driver’s seat, while the belted ATD was placed in the passenger seat. The initial distance between the ATD head and the windshield was set to 0.61 m. For instrumentation, high-speed cameras and data loggers were used, as illustrated in Figure 8. Acceleration and angular velocity data at the vehicle’s center of gravity were collected using a KYOWA DIS-7000A (Kyowa Electronic Instruments Co., Ltd., Tokyo, Japan) data logger, and acceleration data for the ATD head were acquired using a DTS TDAS G5 system (Diversified Technical System, Inc., Seal Beach, CA, USA). All measurements were recorded at a sampling rate of 10 kHz to ensure sufficient temporal resolution for occupant risk analysis. To analyze vehicle kinematics during the crash test, a Phantom Miro C321 (Vision Research, Inc., Wayne, NJ, USA) high-speed camera was employed to record the driver and passenger sides at 500 frames per second.
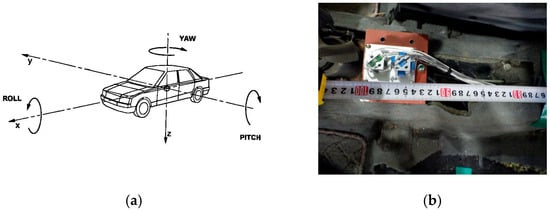
Figure 6.
Vehicle coordinate system and position of the sensor: (a) Vehicle coordinate system; (b) Position of the acceleration sensors mounted center of gravity.
Table 3.
Sensor positions in the vehicle and ATD.
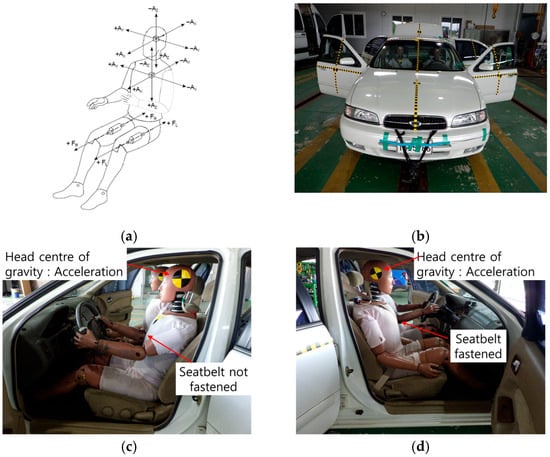
Figure 7.
ATD position: (a) ATD coordinate system; (b) Driver and Passenger; (c) Driver; (d) Passenger.
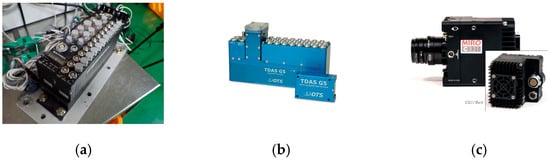
Figure 8.
Data acquisition equipment: (a) Vehicle data acquisition; (b) ATD data acquisition; (c) High speed camera.
3.3. TMA Simulation
Before conducting the full-scale crash tests, a preliminary numerical simulation was performed to verify the structural adequacy of the TMA design. The computer simulation was carried out using LS-DYNA, a widely adopted finite element analysis program for nonlinear dynamic simulations in the fields of automotive, mechanical, and fluid engineering. The material model applied an elastic modulus of 204,000 MPa, a Poisson’s ratio of 0.28, a yield strength of 280 MPa, a tangent modulus of 500 MPa, and a failure strain of 25%. For the contact conditions, automatic contact algorithms between beam and shell elements were utilized to simulate realistic interactions during impact. The entire TMA structure was modeled as shown in Figure 9a, and a 1.3 t Dodge Neon vehicle model, illustrated in Figure 9b, was used for the simulation. The analysis yielded results of THIV = 33.4 km/h, PHD = 15.9 g, and ASI = 1.23. As shown in Figure 10, the TMA underwent progressive deformation during the impact until energy absorption was completed and the collision event concluded.
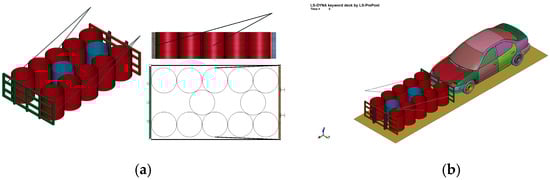
Figure 9.
Simulation Model: (a) TMA; (b) 1.3 t Vehicle.
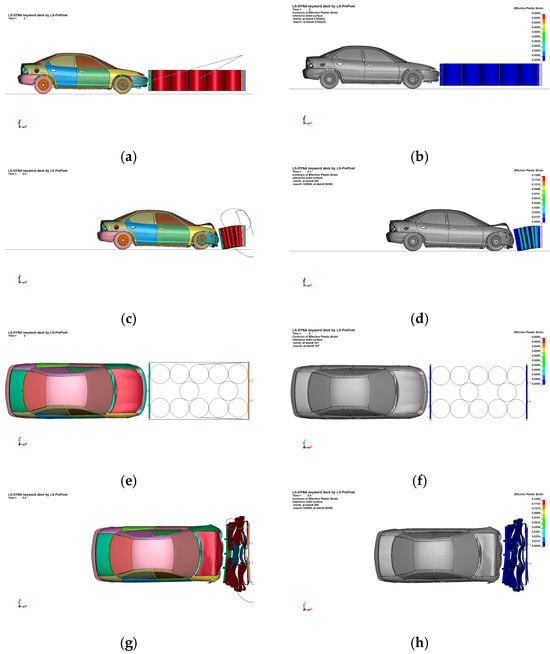
Figure 10.
LS-DYNA strain contour results showing vehicle motion over time: (a) 0.0 s; (b) 0.0 s (strain); (c) 0.4 s; (d) 0.4 s (strain); (e) 0.0 s; (f) 0.0 s (strain); (g) 0.4 s; (h) 0.4 s (strain).
3.4. Test Results
3.4.1. RIG Crash Analysis
The behavior of the impact vehicle and the occurrence times of the Occupant Risk Indices (ORI) are summarized in Table 4 and illustrated in Figure 11. Each (a), (b), (c), (d), (e), (f), (g), (h), and (i) image in Figure 11 is directly linked to the corresponding symbol and crash state summarized in Table 4, including the exact time stamp.
Table 4.
Vehicle Behavior Over Time Corresponding to the subfigures in Figure 11.
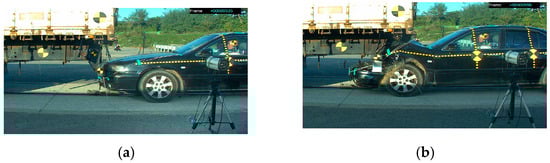
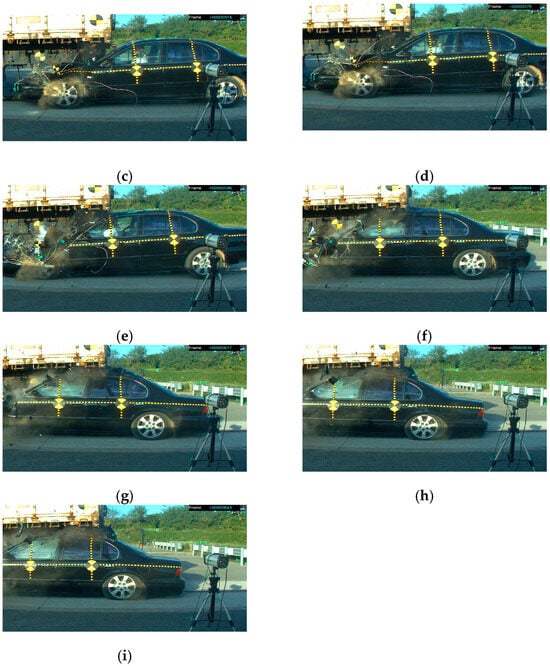
Figure 11.
Vehicle Behavior Over Time During Impact (RIG). State in Table 4.
At approximately 0.0420 s after impact initiation, the RIG was observed to deform to an angle of 90°, after which it was no longer capable of absorbing additional impact energy. The initial impact velocity of the vehicle was 80.5 km/h, and at the moment when RIG deformation was completed (0.0420 s), the vehicle speed had decreased to 71.4 km/h. According to FMVSS 223 [3], the minimum energy absorption requirement for a 125 mm static deformation is 20 kJ. Based on the vehicle mass (1300 kg) and the reduction in impact velocity, approximately 69.33 kJ of energy was dissipated during the RIG impact. This total represents the combined contribution of both RIG deformation and the front-end structural crush of the passenger vehicle. Because the FMVSS 223 static test reflects only the RIG’s inherent load-bearing capacity, distinguishing between these two contributions is essential for understanding the actual load path in a dynamic collision. The results show that while the RIG absorbs a portion of the impact energy, a substantial share is dissipated through vehicle body deformation, indicating that the crush characteristics of the passenger vehicle significantly influence overall energy absorption. At approximately 0.078 s, intrusion of the lower A-pillar region of the impact vehicle was observed, marking the onset of passenger compartment intrusion. At 0.0828 s, the HIC36 for the unbelted driver ATD was recorded, and by 0.1020 s, the ATD’s head made contact with the windshield. At 0.1383 s, the Theoretical Head Impact Velocity (THIV/OIV) occurred, coinciding with the truck’s rear frame intruding up to the upper A-pillar region. The intrusion progressed further to the B-pillar at 0.1640 s, followed by the occurrence of ASI at 0.2098 s and PHD (ORA) at 0.2172 s. After the collision, the vehicle did not come to a complete stop but continued moving forward at a residual speed of approximately 9 km/h while remaining in an underride condition beneath the support truck. It eventually came to rest along with the support vehicle. Data for the passenger-side ATD could not be analyzed due to a sensor malfunction during the test.
3.4.2. TMA Crash Analysis
The vehicle behavior and occurrence times of the Occupant Risk Indices (ORI) for the TMA crash test are summarized in Table 5 and illustrated in Figure 12 and Figure 13. Each (a), (b), (c), (d), (e), and (f) image in Figure 12 and Figure 13 is directly linked to the corresponding symbol and crash state summarized in Table 5, including the exact time stamp. As shown in Figure 12, following impact initiation, the unbelted driver ATD’s head contacted the windshield, coinciding with the occurrence of HIC36. For the belted passenger ATD, HIC36 occurred at 0.1160 s, and the ATD’s head did not contact the windshield throughout the remainder of the crash event. The Theoretical Head Impact Velocity (THIV/OIV) occurred at 0.1265 s, and at 0.1440 s, the passenger ATD’s head rotated forward to approximately 90° before rebounding to its original position. The ASI occurred at 0.2250 s, followed by the Post-Impact Head Deceleration (PHD/ORA) at 0.2311 s. The HIC36 values for the driver (unbelted) and passenger (belted) were 298 and 67, respectively, indicating a significant reduction in head injury risk with seatbelt use.
Table 5.
Vehicle Behavior Over Time Corresponding to the subfigures in Figure 13.
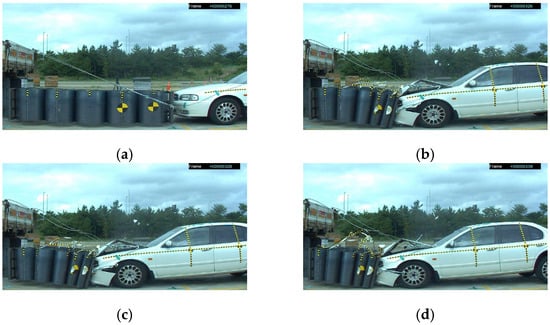
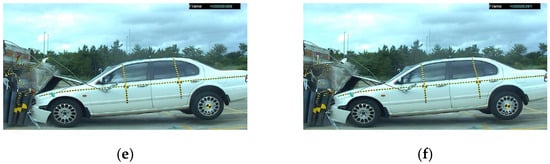
Figure 12.
Vehicle Behavior Over Time During Impact (Driver).
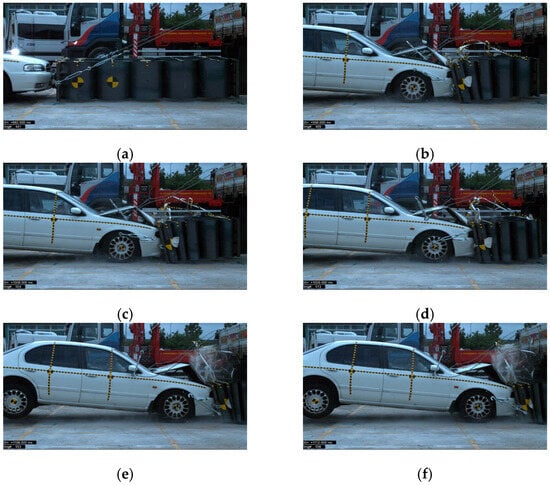
Figure 13.
Vehicle Behavior Over Time During Impact (Passenger).
A comparison between the simulation results from Section 3.3 and the full-scale crash test data is presented in Table 6 and Figure 14. The measured Occupant Risk Index (ORI) values exhibited close agreement with the predicted simulation results, with discrepancies within approximately ±2%. The THIV observed during the early impact phase showed a similar deceleration trend in both cases. After the occurrence of THIV, the PHD appeared at around 0.2 s with nearly identical magnitudes. For the ASI, values remained below 1.0 during the initial phase of the impact and reached approximately 1.2 in the latter phase, indicating consistent behavior between the simulation and experimental outcomes.
Table 6.
Simulation and Test Result.
Figure 14.
Simulation and Test of THIV, PHD, and ASI: (a) THIV; (b) PHD; (c) ASI.
Although the simulation and test results showed close agreement in the magnitude of the Occupant Risk Indices, a slight time lag was observed between the two responses. This discrepancy primarily arises from differences in modeling assumptions and physical testing conditions. In the LS-DYNA model, the use of idealized contact stiffness, simplified strain-rate material properties, and a numerically synchronized impact initiation results in an earlier onset of peak deceleration. Conversely, the full-scale test involves sensor trigger delays, localized deformation of the vehicle’s front-end structure, and structural compliance in welded joints, all of which slightly delay the measured response. These combined factors account for the minor temporal offset observed in Figure 14.
3.5. Comparative Analysis of RIG and TMA
A comparison of the vehicle deceleration profiles over time for the two test configurations is presented in Figure 15. At 0.1422 s, the velocity difference between the two test vehicles reached its maximum value of 9.6 km/h. In the case of the TMA installation, the impact vehicle exhibited a relatively uniform deceleration gradient, and the vehicle came to a complete stop upon completion of the TMA deformation. The support truck moved forward approximately 0.88 m and then came to rest on its own. In contrast, during the RIG impact, the initial deceleration slope was relatively gentle compared with that of the TMA case, and it became even more gradual after the RIG ceased to function at 0.0420 s. Subsequently, as the support truck’s frame sequentially collided with the impact vehicle’s bonnet and A- and B-pillars, the deceleration gradient increased. As shown in Figure 16, around 0.2 s, the vehicle experienced an underride condition beneath the rear portion of the truck, continued to move forward with residual speed, and eventually came to a stop after moving approximately 2.6 m together with the support truck.
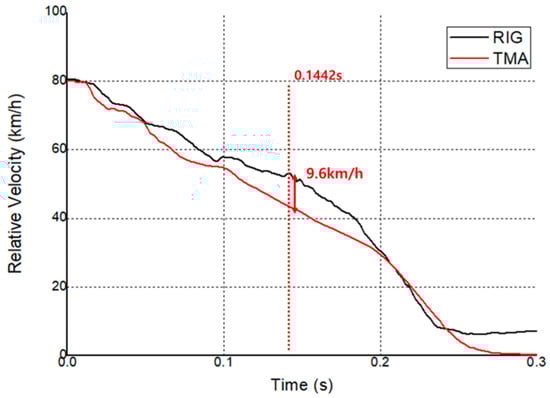
Figure 15.
Vehicle Velocity Between RIG and TMA.
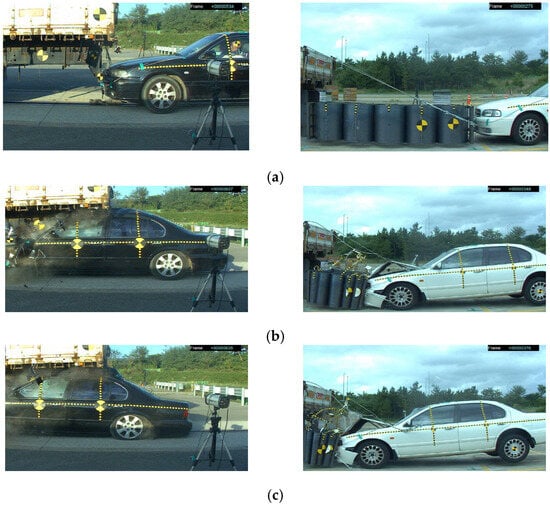
Figure 16.
Comparison of Vehicle Behavior Over Time Between RIG and TMA: (a) Before Collision; (b) Maximum Relative Velocity (0.1422 s); (c) Underride and Deceleration.
Using the data collected from both tests, the Occupant Risk Indices (ORI)—commonly applied in roadside safety hardware evaluations—and the Occupant Injury Index (HIC36)—used in car assessment tests—were calculated.
The results are summarized in Table 7.
Table 7.
Test result.
In the RIG test, the HIC36 value exceeded 1000 at 0.0775 s, surpassing the threshold specified by FMVSS 208, as shown in Figure 17. This occurrence coincided with the moment when the rear frame of the truck intruded into the A-pillar region of the impact vehicle, resulting in a sharp increase in head injury risk due to a severe underride phenomenon. In the TMA test condition, the HIC36 values were 298 for the unbelted driver and 67 for the belted passenger, both of which satisfied the FMVSS 208 requirements. Compared with the RIG case, the driver’s HIC36 value in the TMA configuration was reduced by approximately 83.5%, while the passenger’s value decreased by an additional 77% with seatbelt use. Under the TMA installation condition, the impact vehicle exhibited a consistent deceleration pattern from the onset of collision, and the HIC36 values for both the driver and passenger ATDs remained within the FMVSS 208 limits. These results clearly demonstrate the dual protective role of TMAs in mitigating vehicle deceleration severity and occupant injury potential, further amplified by seatbelt use.
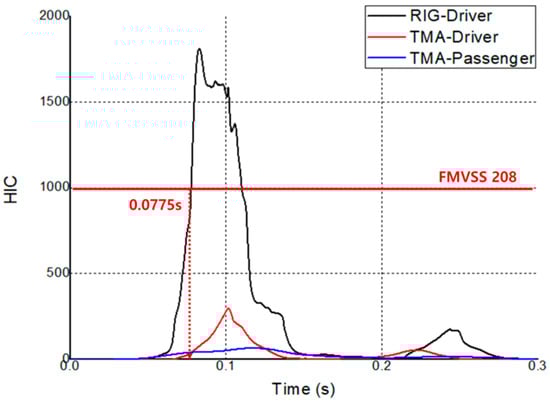
Figure 17.
HIC of RIG and TMA.
Since both the RIG and TMA tests were conducted under frontal impact conditions, the effect of vehicle rotation was negligible. Consequently, as shown in Figure 18a, the THIV and OIV graphs exhibited identical trends. In the RIG test, the PHD and ORA showed minor deviations for a very short duration; however, throughout the overall collision event, the graphs remained nearly identical, as illustrated in Figure 18b.
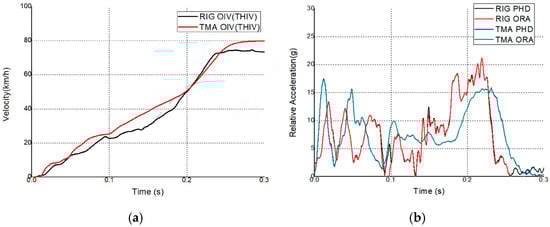
Figure 18.
Test result of RIG and TMA: (a) OIV and THIV; (b) ORA and PHD.
4. Discussion
In this study, full-scale crash tests were conducted under a higher impact velocity condition (80 km/h) compared with previous studies (56 km/h) to evaluate and compare the expected occupant injury levels in rear-end collisions involving RIGs and TMAs. The analysis was performed using both Occupant Risk Indices (THIV, OIV, PHD, ORA, and ASI) and the Occupant Injury Index (HIC36) to assess and compare occupant safety performance. Table 8 compares the HIC36 values obtained from the rear-end RIG impact tests in this study with those reported by Brumbelow [4] and from NCAP rigid wall crash tests [18,19].
Table 8.
Comparison of HIC in Rear-End Collision.
The HIC36 values for the 2011 Wabash RIG [8] and the NCAP rigid wall test [19] were found to be at similar levels. In contrast, the 2007 Hyundai RIG [8] exhibited a substantially higher HIC36 value, attributed to severe underride deformation of approximately 0.8 m in the A-pillar region, which significantly increased the injury severity to occupants. Similarly, in this study, the RIG configuration exhibited a pronounced underride phenomenon, resulting in a high HIC36 value of 1810, indicating a considerable risk of severe head injury to the occupant. Under similar test conditions, the HIC values for collisions with rigid walls (2000 SM520 and 2012 Malibu) showed significant differences compared to those for RIG impacts. This indicates that the occupant injury severity can vary depending on the intrinsic safety performance of the impacting vehicle, suggesting that roadside safety hardware evaluations should account for cases in which the collision vehicle’s structural integrity is insufficient. In the TMA installation condition, the vehicle maintained a consistent deceleration pattern throughout the initial phase of impact, and the HIC36 values for both the driver and passenger ATDs were within the FMVSS 208 limits. Compared with the RIG condition, the HIC36 value under the TMA condition was reduced by up to 83.5%, experimentally demonstrating the effectiveness of the TMA as an energy-absorbing protective device. Additionally, seatbelt use further reduced the HIC36 value by approximately 77%, confirming that occupant restraint systems such as seatbelts and airbags are highly effective in mitigating injury severity. In the TMA impact condition, the occurrence time of THIV (OIV), as observed from high-speed camera analysis, appeared slightly later than the actual head impact of the ATD. While THIV (OIV) was recorded at 0.1265 s, the ATD’s head contacted the windshield earlier, at 0.104 s, accompanied by a sharp deceleration. The initial distance between the ATD’s head and the windshield before impact was 0.61 m, which was similar to the theoretical travel distance used in THIV (OIV) calculation. However, as shown in Figure 19, the ATD’s head struck the upper portion of the windshield above its initial horizontal position. This finding indicates that the head trajectory in the actual impact differed from the idealized free-flight assumption of the FSM, explaining why the contact occurred earlier than theoretically predicted. For the belted passenger ATD, as shown in Figure 20, the motion consisted of a forward translation followed by a rotational rebound, without any secondary contact with the vehicle’s interior components.
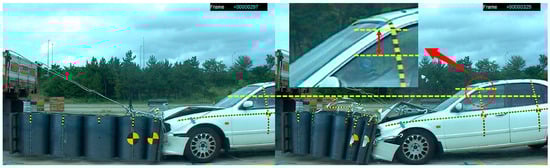
Figure 19.
Impact Location of ATD Head (Un Belted Driver) and Windshield.
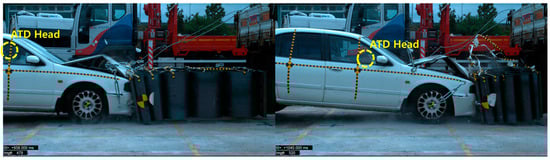
Figure 20.
ATD Head (Belted Passenger) Movement.
The velocity of the ATD’s head, obtained by integrating the resultant acceleration, was compared with the vehicle’s deceleration, as shown in Figure 21. The point at which the relative velocity between the vehicle and the ATD’s head reached zero occurred at 0.1176 s, corresponding to a displacement of 0.16 m. This result differs from the theoretically computed THIV distance, highlighting the discrepancy between the idealized FSM assumption and the actual occupant kinematics observed in the test.
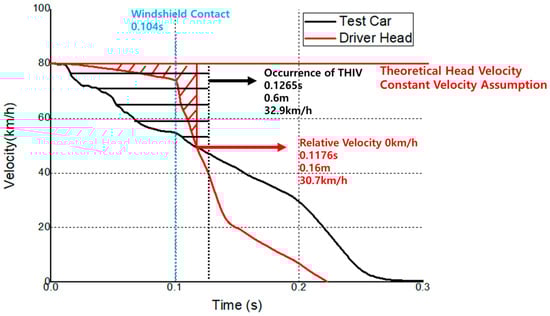
Figure 21.
Vehicle and ATD Velocity.
Figure 22 compares the deceleration profiles of the vehicle body and the ATD’s head in the TMA test. For the unbelted driver ATD, a sharp deceleration occurred at the moment of head impact with the windshield, with HIC36 forming between 0.1010 and 0.1370 s. For the belted passenger ATD, the deceleration curve was more gradual, and HIC36 occurred between 0.1160 and 0.1520 s.
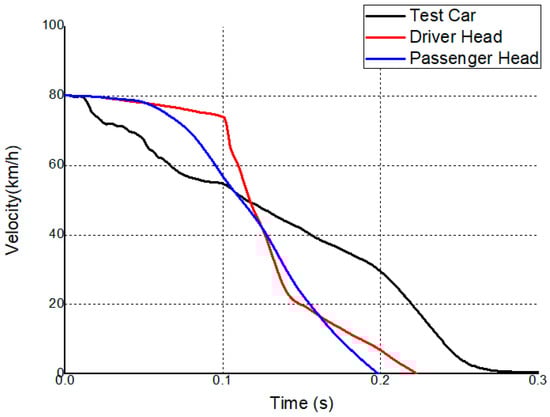
Figure 22.
Comparison of Test Car and ATD Head.
Although the test vehicle and TMA configuration differ, the resulting PHD and ASI patterns show similar trends because these indices are governed mainly by the global deceleration pulse of the combined vehicle–TMA system. Since the TMA absorbs the majority of the impact energy and its deformation response dominates the crash dynamics, variations in the geometry or stiffness of the passenger vehicle front end exert only a secondary influence on the deceleration profile. This explains the close agreement observed in PHD and ASI values across different configurations.
When applying the European [10] or British [11] standards, which do not include the PHD criterion, the RIG test results appear to satisfy the performance requirements based solely on the Occupant Risk Index values. However, as illustrated in Figure 23, in cases where underride occurs—regardless of seatbelt use—both the driver (unbelted) and passenger (belted) are exposed to a high likelihood of severe injury.
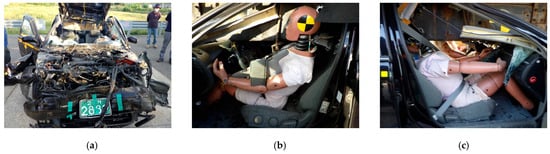
Figure 23.
After the RIG impact: (a) Front; (b) Driver; (c) Passenger.
When applying the European and British standards, if ASI occurs earlier than THIV, it becomes impossible to account for occupant safety during the latter phase of the collision. Because PHD (ORA) is calculated after the occurrence of THIV (OIV), it enables assessment of occupant risk in the post-impact phase. Therefore, excluding PHD (ORA) from the evaluation may result in an incomplete representation of occupant risk throughout the entire collision sequence. As shown in Figure 24, ASI is computed from the vehicle body acceleration data, whereas the acceleration actually experienced by the occupant varies depending on seatbelt usage. Since the acceleration profiles of the vehicle body and the ATD head differ significantly, the vehicle’s acceleration data alone cannot directly predict occupant injury severity.
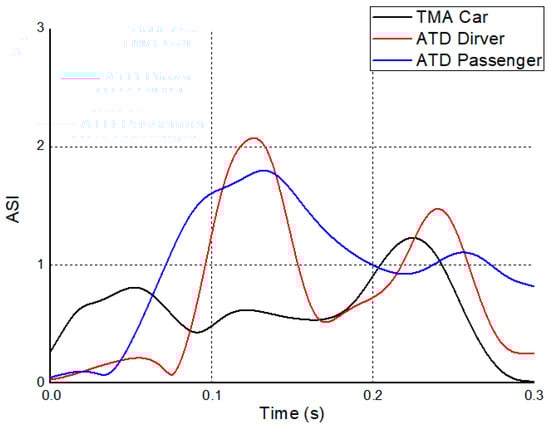
Figure 24.
ASI of Test Car & ATD.
In future assessment tests for roadside safety hardware, it will be necessary to evaluate not only the Occupant Risk Indices but also parameters that cannot be quantified solely by vehicle deformation performance. Moreover, it is essential to consider the implementation of evaluation methods that either include direct assessment of Occupant Injury Indices using ATDs or account for equivalent occupant-related effects. To further examine the occurrence timing of the Occupant Risk Indices discussed in Section 2.3.6, data from 44 full-scale crash tests—including Crash Cushions, TMAs, and Roadside Barriers—were analyzed to compare the occurrence times of THIV, PHD, and ASI. The average THIV value was 36.7 km/h, occurring at 0.109 s, while the average ASI value was 1.30, occurring at 0.088 s. Among the 44 tests, ASI occurred earlier than THIV in 30 cases, indicating that ASI typically represents the early impact phase, whereas THIV and PHD correspond to the mid-to-late phases of the collision. As summarized in Table 9, ASI appeared before THIV in most Roadside Barrier and Crash Cushion tests, while in the case of TMA, ASI occurred earlier than THIV in approximately 43% of the tests.
Table 9.
ASI Occurrence Timing Relative to THIV across Roadside Safety Devices.
In Europe, ASI has been adopted in place of PHD; however, if ASI occurs in the early stage of a collision, it cannot adequately reflect occupant safety during the later phase of impact. Therefore, it is necessary to reconsider the inclusion of meaningful Occupant Risk Indices—such as PHD—that can represent occupant safety in the post-impact phase of a collision. Although a RIG may meet the minimum static load requirements, it may still fail to provide sufficient protection under actual dynamic impact conditions. In contrast, the results confirmed that the TMA is a highly effective device for simultaneously protecting both vehicle occupants and roadside workers during rear-end collisions. The effects of the TMA’s energy absorption capability and seatbelt usage on HIC36 were experimentally verified in detail. The findings of this study are expected to serve as valuable reference data for future improvements in roadside safety hardware design and performance evaluation standards, as well as for the development and optimization of TMAs.
The present findings provide experimental validation supporting the integration of TMA systems as a crucial component in modern roadside safety hardware design.
5. Limitations
This study has several limitations.
First, only one full-scale crash test was performed for each configuration (RIG and TMA). Because full-scale crash testing requires substantial cost, facility scheduling, and complex logistics, repeated tests were not feasible. As a result, statistical generalisation is limited. The overall findings were interpreted alongside broader trends from 44 additional full-scale crash tests on various roadside safety hardware, but repeated trials would further improve reliability.
Second, different vehicle models were used in the simulation and the physical crash tests, which introduces inherent differences in structural response. Publicly accessible Finite Element Models (FEM) for roadside-safety research are limited, and the 1.3 t Dodge Neon model is commonly used due to its availability. In contrast, full-scale crash tests do not have such restrictions; an obtainable vehicle is typically purchased and adjusted to the target weight. The 2002 Renault SM520 used in the full-scale tests is an older platform and may represent a conservative, worst-case scenario compared with modern vehicles.
Third, the RIG and TMA evaluated in this study were specially built prototypes designed to enable controlled comparison between LS-DYNA simulations, occupant risk indices, and ATD measurements. Although extensive certification tests exist for commercially manufactured devices, those datasets are proprietary to individual companies and therefore could not be incorporated into this manuscript.
Lastly, the loss of passenger-side ATD data in the RIG test restricted the ability to directly compare belted and unbelted occupant responses. However, partial comparison remains possible because both driver and passenger ATD responses were successfully collected in the TMA test.
6. Conclusions
This study performed full-scale rear-end crash tests at 80 km/h to evaluate the safety performance of vehicles equipped with Rear Impact Guards (RIGs) and Truck-Mounted Attenuators (TMAs). Occupant injury levels were assessed using both vehicle-derived Occupant Risk Indices (THIV, ASI, PHD, ORA) and ATD-based biomechanical metrics (HIC36). The experimental results demonstrated that severe underride in the RIG configuration caused extreme structural intrusion and led to substantially elevated head injury risk, whereas the TMA effectively mitigated crash severity and maintained HIC36 values within the FMVSS 208 regulatory limits.
A comparative analysis revealed systematic differences between FSM-based indices and ATD responses. THIV consistently underestimated the actual timing of head impact, indicating a conceptual lag inherent in the simplified kinematic assumptions of FSM methods—particularly under underride-prone conditions where vehicle pitch and wedge-type motion occur. In contrast, PHD and ASI exhibited strong agreement between simulation and full-scale results, suggesting that these indices are governed primarily by the global deceleration characteristics of the vehicle–TMA system rather than localized structural deformation.
6.1. Key Regularities Identified in This Study
THIV systematically lagged behind ATD-measured head impact timing, showing that theoretical occupant kinematics may not fully capture early injury-critical phases in underride collisions.
PHD and ASI presented stable consistency across simulation and crash tests, confirming that mid-to-late-phase deceleration behavior is dominated by system-level crash dynamics.
Underride-prone impacts produced earlier and sharper ATD head responses, highlighting a biomechanical injury mechanism that current FSM-based indices cannot adequately represent due to neglect of pitch motion.
Analysis of 44 full-scale crash tests conducted across diverse roadside safety hardware—including barriers, crash cushions, and TMAs—revealed a consistent temporal sequence of occupant-risk indices.
ASI occurred during the early crash phase (~0.088 s), THIV/OIV during the mid-phase (~0.109 s), and PHD/ORA during the late phase (~0.23 s).
This recurring pattern demonstrates that each metric corresponds to a distinct stage of the overall impact event.
6.2. Scientific and Practical Implications
These findings provide evidence that current rear-impact protection requirements—particularly for RIGs—may be insufficient for higher-speed scenarios that exceed existing certification criteria. The demonstrated performance of the TMA at 80 km/h supports its implementation in highway work zones and underscores the importance of incorporating ATD-based biomechanical injury assessment into future safety hardware evaluation procedures. Furthermore, the observed discrepancies between FSM-derived indices and ATD responses indicate that established occupant-risk methodologies should be refined to better account for underride behavior and early-phase impact dynamics.
6.3. Future Work
Future evaluations of roadside safety hardware should integrate both vehicle-based indices (THIV, ASI, PHD, ORA) and ATD-derived injury metrics to provide a comprehensive assessment of occupant protection. Additional research is needed to analyze occupant kinematics under various restraint conditions, investigate advanced energy-absorbing designs, and refine assessment criteria for high-speed rear-end collisions. A broader investigation into pitch-sensitive injury mechanisms will also be essential for improving the scientific reliability of future occupant-risk evaluation frameworks.
Author Contributions
Conceptualization, B.-K.M. and D.C.; methodology, B.-K.M.; software, K.-J.K.; validation, B.-K.M., J.-C.K. and K.-J.K.; formal analysis, K.-J.K.; investigation, J.-C.K.; resources, B.-K.M.; data curation, B.-K.M. and D.C.; writing—original draft preparation, B.-K.M.; writing—review and editing, K.-J.K. and D.C.; visualization, J.-C.K.; supervision, D.C.; project administration, D.C.; funding acquisition, J.-C.K. All authors have read and agreed to the published version of the manuscript.
Funding
This work was supported by research fund of Chungnam National University in 2025.
Institutional Review Board Statement
Not applicable.
Informed Consent Statement
Not applicable.
Data Availability Statement
The full-scale crash test data used in this study were obtained through institutional testing programs and are subject to confidentiality agreements; therefore, the raw data are not publicly available. The vehicle models used for LS-DYNA simulations are available from publicly accessible databases provided by the National Highway Traffic Safety Administration (NHTSA) and the National Crash Analysis Center (NCAC) at https://web.archive.org/web/20160408180243/, http://www.ncac.gwu.edu/vml/models.html (accessed on 5 April 2025). Processed data supporting the findings of this study are available from the corresponding author upon reasonable request.
Acknowledgments
The authors would like to express their gratitude to the Korea Expressway Corporation Research Institute for providing access to the crash testing facilities and technical support during the full-scale experiments.
Conflicts of Interest
Author Byung-Kab Moon was employed by the Korea Expressway Corporation. Author Kyoung-Ju Kim was employed by the Road Kinematics Co., Ltd. The remaining authors declare that the research was conducted in the absence of any commercial or financial relationships that could be construed as a potential conflict of interest.
Abbreviations
The following abbreviations are used in this manuscript:
| RIG | Rear Impact Guard |
| TMA | Truck Mounted Attenuator |
| FSM | Flail Space Model |
| THIV | Theoretical Head Impact Velocity |
| OIV | Occupant Impact Velocity |
| PHD | Post-impact Head Deceleration |
| ORA | Occupant Ridedown Acceleration |
| ASI | Acceleration Severity Index |
| HIC | Head Injury Criterion |
| ATD | Anthropomorphic Test Device |
| FMVSS | Federal Motor Vehicle Safety Standard |
| MASH | Manual for Assessing Safety Hardware |
| CEN | European Committee for Standardization |
| EN | European Norm (Standard) |
| NCAP | New Car Assessment Program |
| NHTSA | National Highway Traffic Safety Administration |
| NCAC | National Crash Analysis Center |
| FHWA | Federal Highway Administration |
| GAO | Government Accountability Office |
| UNECE | United Nations Economic Commission for Europe |
References
- National Highway Traffic Safety Administration (NHTSA). Fatality Analysis Reporting System (FARS) File Downloads. Available online: https://www.nhtsa.gov/file-downloads?p=nhtsa/downloads/FARS/ (accessed on 5 April 2025).
- Federal Highway Administration (FHWA). Work Zone Facts and Statistics; U.S. Department of Transportation: Washington, DC, USA, 2023. Available online: https://ops.fhwa.dot.gov/wz/resources/facts_stats.htm (accessed on 24 April 2025).
- National Highway Traffic Safety Administration (NHTSA). Federal Motor Vehicle Safety Standards; Rear Impact Guards, Rear Impact Protection. Final Rule; U.S. Department of Transportation: Washington, DC, USA, 2022; Docket No. NHTSA-2022-0053; RIN 2127-AL58. Available online: https://www.federalregister.gov/documents/2022/07/15/2022-14330/federal-motor-vehicle-safety-standards-rear-impact-guards-rear-impact-protection (accessed on 25 April 2025).
- U.S. Government Accountability Office (GAO). Highway Safety: More Robust DOT Leadership Needed to Address America’s Roadway Death Crisis; Report No. GAO-19-264; U.S. Government Accountability Office: Washington, DC, USA, 2019. Available online: https://www.gao.gov/products/gao-19-264 (accessed on 5 April 2025).
- National Highway Traffic Safety Administration (NHTSA). Analysis of Rear Underride in Fatal Truck Crashes, 2008; U.S. Department of Transportation: Washington, DC, USA, 2013. Available online: https://www.nhtsa.gov/document/analysis-rear-underride-fatal-truck-crashes-2008 (accessed on 5 April 2025).
- United Nations Economic Commission for Europe (UNECE). Regulation No. 58—Uniform Provisions Concerning the Approval of Rear Underrun Protective Devices (RUPDs), Vehicles with Regard to the Installation of RUPDs of an Approved Type, and Vehicles with Regard to Their Rear Underrun Protection (RUP); UNECE: Geneva, Switzerland, 2016. [Google Scholar]
- CMVSS 224; Rear Impact Protection. Transport Canada: Ottawa, ON, Canada, 2023.
- Brumbelow, M.L. Crash Test Performance of Large Truck Rear Underride Guards; Report, No. 11.0074; Insurance Institute for Highway Safety: Arlington, VA, USA, 2011; pp. 1–5. [Google Scholar]
- American Association of State Highway and Transportation Officials (AASHTO). Manual for Assessing Safety Hardware (MASH); AASHTO: Washington, DC, USA, 2016. [Google Scholar]
- Committee for European Norms (CEN). Road Restraint Systems—Truck Mounted Attenuators—Performance Classes, Impact Test Acceptance Criteria and Test Performance (CEN/TS 16786:2018); CEN: Brussels, Belgium, 2018. [Google Scholar]
- British Standards Institution (BSI). Design Manual for Roads and Bridges: CD 378, Impact Test and Assessment Criteria for Truck Mounted Attenuators; BSI: London, UK, 2020. [Google Scholar]
- Michie, J.D. Collision Risk Assessment Based on Occupant Flail-Space Model. Transp. Res. Rec. 1981, 796, 1–9. [Google Scholar]
- Michie, J.D. Recommended Procedures for the Safety Performance Evaluation of Highway Appurtenances; NCHRP Report 230; Transportation Research Board, National Research Council: Washington, DC, USA, 1981. [Google Scholar]
- Ross, H.E.; Sicking, D.L.; Zimmer, R.A.; Michie, J.D. Recommended Procedures for the Safety Performance Evaluation of Highway Features; NCHRP Report 350; Transportation Research Board, National Research Council: Washington, DC, USA, 1993. [Google Scholar]
- National Academies of Sciences, Engineering, and Medicine. Evaluation and Comparison of Roadside Crash Injury Metrics; NCHRP Research Report; National Academies of Sciences, Engineering, and Medicine: Washington, DC, USA, 2023; p. 1095. [Google Scholar] [CrossRef]
- EN 1317-1; Road Restraint Systems—Part 1: Terminology and General Criteria for Test Methods. European Committee for Standardization (CEN): Brussels, Belgium, 2010.
- National Highway Traffic Safety Administration (NHTSA). Federal Motor Vehicle Safety Standard No. 208: Occupant Crash Protection; U.S. Department of Transportation: Washington, DC, USA, 2025. [Google Scholar]
- Korea Transportation Safety Authority, Vehicle Performance Test Research Center. Research Report on Crash Tests for New Car Assessment; Korea Transportation Safety Authority: Anyang, Republic of Korea, 2000. [Google Scholar]
- Korea Transportation Safety Authority, Korea Automobile Testing & Research Institute. 2012 New Car Assessment Program (NCAP) Research Report; Korea Transportation Safety Authority: Hwaseong, Republic of Korea, 2012. [Google Scholar]
Disclaimer/Publisher’s Note: The statements, opinions and data contained in all publications are solely those of the individual author(s) and contributor(s) and not of MDPI and/or the editor(s). MDPI and/or the editor(s) disclaim responsibility for any injury to people or property resulting from any ideas, methods, instructions or products referred to in the content. |
© 2025 by the authors. Licensee MDPI, Basel, Switzerland. This article is an open access article distributed under the terms and conditions of the Creative Commons Attribution (CC BY) license (https://creativecommons.org/licenses/by/4.0/).