Abstract
The extensive area of goaf makes high-temperature points highly concealed, and prolonged heating can easily trigger spontaneous coal combustion. Traditional temperature monitoring methods are limited in spatial coverage and thus fail to detect high-temperature points in a timely manner. To address this issue, this study proposes an integrated analytical method combining numerical simulation and intelligent inversion, with Taihe Coal Mine as the research object. First, A coupled flow–temperature–gas field model of the goaf was established in COMSOL Multiphysics 6.3 to simulate working-face CO concentration distributions corresponding to high-temperature points at different locations, thereby constructing a comprehensive dataset. Then, a BP neural network prediction model improved by the dung beetle optimization algorithm (DBO-BP) was trained to infer the spatial location of high-temperature points based on CO concentration distributions. Finally, a geometric prediction method was introduced to guide precise drilling within the predicted high-risk areas for field verification. The results demonstrate that the proposed DBO-BP model can effectively trace the locations of high-temperature points from CO concentration data. When combined with the geometric prediction method, it provides an efficient and reliable technical solution for the early prevention of spontaneous coal combustion in goaf.
1. Introduction
Mine fires represent one of the most critical hazards in coal mining, posing a grave threat to underground safety. Among these, spontaneous combustion of coal in goaf areas stands out as the most severe, accounting for over 90% of all mine fire incidents [1]. Gas concentration and temperature are key early-warning indicators for monitoring coal spontaneous combustion, as the coal continuously produces CO during its oxidation and heating process [2,3]. Gas monitoring in working face areas has become a critical technology for ensuring coal mine safety [4,5]. Currently, the main monitoring methods include fixed continuous monitoring and mobile patrol monitoring. Temperature monitoring in working faces and goaf serves as another crucial approach for predicting coal spontaneous combustion, as temperature variations can directly determine its development stage [5,6,7]. Currently, distributed optical fiber temperature measurement is the commonly used method for temperature monitoring [8]. Following effective early warning of spontaneous combustion through monitoring, rapid disaster control during emergencies becomes critical for emergency response. Current primary emergency methods include rapid sealing wall construction and grouting technology [9].
The spontaneous combustion of residual coal in the goaf is influenced by multiple factors. Among these, air leakage supplies the necessary oxygen for oxidation, while accumulated loose coal provides the material basis for combustion [10]. Owing to these multiple influencing factors, as well as the concealed and complex internal structure of the goaf, accurately identifying and predicting high-temperature points has long remained a technical challenge [11]. Spontaneous combustion in the goaf not only poses a severe threat to coal mine safety but also leads to substantial ecological and environmental pollution [12].
At present, no mature technology has been developed for the rapid and accurate localization of spontaneous combustion zones, nor for monitoring their temperature evolution within goaf [13,14]. This is because existing methods for measuring temperatures of concealed High-temperature points in goaf face challenges from the complex goaf environment and related technical limitations, making it difficult to accurately determine the location. The imprecise localization of high-temperature points not only severely threatens coal mine safety but may also cause ecological pollution. Therefore, accurately determining the locations of high-temperature points in the goaf during the advancing working face has become critical to preventing and controlling spontaneous combustion [15,16].
In recent years, extensive research has been conducted worldwide on the mechanisms, early warning strategies, and prevention technologies for spontaneous coal combustion in goaf. Regarding the disaster-causing mechanisms, many studies have focused on the generation patterns of indicator gases, particularly CO [17], as well as the “Three Zones” division theory for goaf [18]. To improve monitoring accuracy and reduce errors in early warning, researchers have employed various predictive methods, including neural networks, cluster analysis, and regression/correlation analysis, to construct forecasting models [19,20]. For instance, Xiao, C [21], Wang, M [22], Zhong, X [23] and Fei Gao [24] developed a PSO-XGBoost model for forecasting underground fires; and Guangyu Li et al. [25] combined machine vision with grey modeling to achieve fire identification and precise localization, thereby enhancing the static detection of exogenic mine fires. Additionally, Deng, J and Lei et al. [26] applied the Random Forest method to predict goaf temperatures and characteristic gas concentrations, highlighting its stability and generalizability.
Based on this, our study employs COMSOL Multiphysics 6.3 to construct a multi-physics coupling model for analyzing the temperature field around high-temperature points in goaf and the distribution patterns of CO as a signature gas in the working face, thereby establishing a correlation between high-temperature points and the gas concentration field. Subsequently, a Dung Beetle Optimizer-Backpropagation (DBO-BP) neural network model is constructed using Python 3.13.0. Combined with our proposed geometric prediction method, the model traces the locations of high-temperature points in the goaf, This integrated approach offers a novel solution to the longstanding challenge of locating hidden high-temperature points in concealed goaf areas.
This study aims to solve the problem of locating high-temperature points in goaf using CO gas monitoring data from working faces. The research is based on the following hypotheses: (1) a definite coupling relationship exists between the temperature field and gas concentration field in the goaf, allowing CO concentration distribution to effectively reflect the spatial position of hidden heat sources; (2) the DBO-BP model can establish a nonlinear mapping relationship between gas concentration and high-temperature point locations through training on multiphysics field data; (3) the inverse analysis model combined with geometric prediction method can achieve 3D spatial positioning of high-temperature points in the goaf, with positioning errors controllable within engineering tolerance. By verifying these hypotheses, this study establishes an integrated analytical method combining numerical simulation with intelligent inversion, providing an innovative technical approach to address traditional temperature monitoring challenges.
2. Division of the Spontaneous Combustion “Three Zones” in Goaf
2.1. Establishment of a Geometric Model for the Goaf
Based on the actual geological and mining conditions of the No. 7 working face in the Taihe Coal Mine, a three-dimensional goaf model was established, setting as follows: an inclined length of 100 m (meters), a strike length of 200 m, and a height of 20 m. The working face is 100 m long and 10 m wide. After constructing the 3D geometric model, meshing was performed. Based on field-measured data, the airflow velocity on the intake side of the working face was set to 0.5 m/s (meters per second), directed perpendicular to the model boundary surface to simulate the air inlet of the goaf. The outlet pressure was set equal to the ambient reference pressure. Considering computational performance, the mesh parameters were configured as follows: the maximum element size was 14.8 m, the minimum element size was 3.13 m, the maximum element growth rate was 1.4, the curvature factor was 1, and the narrow region resolution was 0.3. The mesh division and geometric model of the goaf are shown in Figure 1.
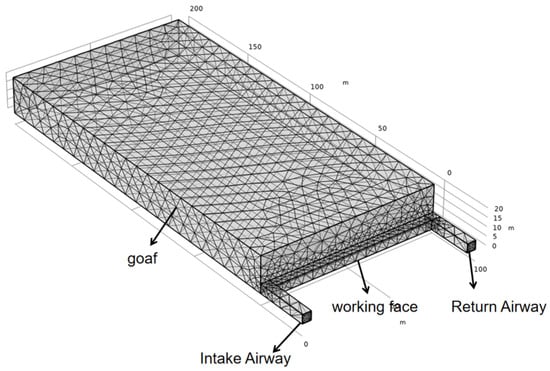
Figure 1.
Three-dimensional model of the goaf.
The goaf is regarded as a steady-state environment. The effects of air thermal expansion, moisture evaporation, and gas desorption on gas concentration distribution are neglected. The release of volatile matter and the generation of CO during coal fragmentation are also ignored. Since the oxygen consumption rate of coal oxidation is relatively low when the temperature is below 70 °C, it is approximated as the oxygen consumption rate at the spontaneous combustion point.
Due to the differences in compaction of residual coal and other media, the porosity in the goaf exhibits a non-uniform distribution, generally decreasing from the working face toward the deeper goaf. Based on this pattern, the goaf was divided into five porous media zones along the direction of face advancement. The porosity and permeability values for each zone are listed in Table 1.

Table 1.
Values of Porosity and Permeability.
The coupled flow–temperature–gas field model was developed to simulate the complex physical processes in the goaf by treating it as a porous medium, with the fluid flow governed by the Darcy–Brinkman equation that combines Darcy flow in porous regions and the Navier–Stokes equations in open channels.
2.2. Division of the Spontaneous Combustion “Three Zones” in Goaf
This study selects oxygen concentration, air leakage, and pressure as key parameters. The distribution of oxygen concentration directly reflects the oxygen consumption process in the goaf, serving as the direct basis for dividing the spontaneous combustion zones. Air leakage and pressure provide the driving force for oxygen transport, determining the distribution pattern of these zones. By combining field monitoring with numerical simulation, this approach ensures data authenticity while compensating for insufficient monitoring points, thereby enabling accurate delineation of the spontaneous combustion zones and providing reliable support for prevention and control strategies.
Two classification approaches were adopted for determining the Three Zones:
- Based on leakage airflow velocity and pressure;
- Based on oxygen concentration.
The final ranges of the zones were determined by averaging the results obtained from these two methods.
First, we divide the goaf according to the airflow velocity and pressure gradient:
- Heat Dissipation Zone: leakage airflow velocity > 0.024 m/s with a steep negative pressure gradient and a significant pressure difference.
- Oxidation Zone: 0.004 m/s ≤ leakage airflow velocity ≤ 0.024 m/s, with a gentle pressure gradient and stable airflow.
- Asphyxiation Zone: leakage airflow velocity < 0.004 m/s and disappearance of negative pressure.
The airflow and pressure distributions in the goaf are shown in Figure 2. Air Leakage Flow Field and Pressure Distribution Contour in the Goaf. As illustrated, the pressure distribution on both sides of the working face exhibits an approximately arc-symmetric pattern, with the intake roadway showing slightly higher pressure than the return roadway. This occurs because an increase in airflow velocity leads to a rise in dynamic pressure and a corresponding reduction in static pressure. The pressure is relatively high near the working face, becomes more uniform in the middle of the goaf, and approaches atmospheric pressure in the deeper regions. This pressure difference serves as the primary driving force for leakage airflow, directly influencing the distribution of oxygen. Along the depth direction of the goaf, the leakage airflow velocity gradually decreases. At approximately 20 m from the working face, the leakage velocity is about 0.024 m/s, while at around 80 m, it drops to 0.004 m/s. Therefore, the width of the Heat Dissipation Zone is 0–20 m, the Oxidation Zone spans 20–80 m, and the Asphyxiation Zone extends beyond 80 m.
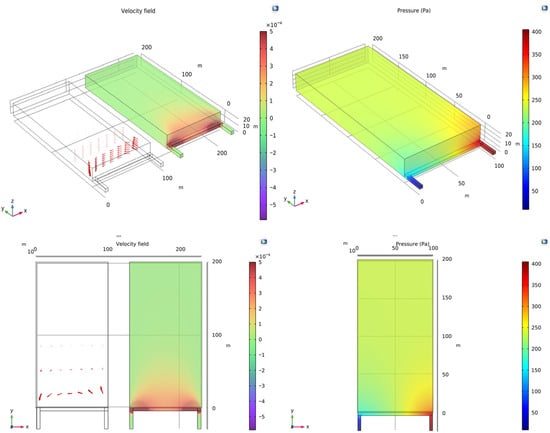
Figure 2.
Air Leakage Flow Field and Pressure Distribution Contour in the Goaf.
Another option is to divide the goaf according to φ(O2) (oxygen concentration):
- Heat Dissipation Zone: φ(O2) > 18%;
- Oxidation Zone: 8% ≤ φ(O2) ≤ 18%;
- Asphyxiation Zone: φ(O2) < 8%.
The distribution of oxygen concentration in the goaf is shown in Figure 2 and Figure 3. As illustrated, the oxygen concentration gradually decreases with increasing distance from the working face, and its spatial distribution within the goaf is irregular. Fresh air enters through the intake roadway, while leakage airflow from the working face transports oxygen into the deeper regions of the goaf. On the intake side, when the face lags by approximately 35 m, the oxygen concentration in the goaf is 18%; when the lag increases to about 65 m, it drops to 8%. On the return side, the oxygen concentration is 18% at 9 m behind the face and falls to 8% at 30 m.
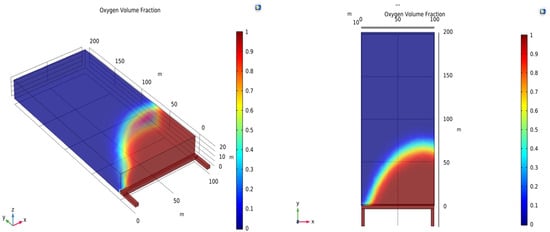
Figure 3.
Distribution of O2 Volume Fraction in the Goaf.
By averaging the results obtained from the two classification methods, the final ranges of the Spontaneous Combustion “Three Zones” in the goaf are determined, as summarized in Table 2.
Table 2.
Distribution Range of the Spontaneous Combustion “Three Zones”.
To ensure the reliability of the simulation results, systematic verification and validation procedures were implemented. The model verification included comprehensive mesh independence tests to confirm the elimination of discretization errors. For validation purposes, the simulation results were rigorously compared with field measurement data obtained from Taihe Coal Mine, incorporating CO concentration distributions and temperature profiles from multiple monitoring locations. The strong agreement between the simulated outcomes and the experimental measurements validates the model’s accuracy and reliability in representing the complex multi-physics processes within the goaf environment.
3. Distribution of Temperature Field and CO Gases in Goaf
3.1. Distribution of Temperature Field in Goaf
Within the oxidation and spontaneous combustion zone of the goaf, the air leakage velocity remains relatively low. This condition not only supplies sufficient oxygen to sustain the oxidation process of residual coal but also minimizes the removal of heat generated by oxidation. As a result, heat accumulates and temperature rises, readily leading to the formation of localized high-temperature points. We established a flow–temperature–gas field model of the goaf, in which high-temperature points were set within the oxidation zone and simplified as constant-power point heat sources (26,000 W).
The simulated temperature field isosurface distribution clouds for high-temperature points at coordinates (10, 30, 10), (50, 30, 10), and (90, 30, 10) are shown in Figure 4 where the isothermal surfaces of the temperature field exhibit approximately circular distribution characteristics. Within the goaf, temperature distribution centers around high-temperature points, showing stepwise decline with increasing diffusion radius while maintaining consistent temperature values at the same radius, forming a typical concentric circular pattern. Notably, the high-temperature point isothermals near the return airway demonstrate a more significant diffusion range. This occurs because leakage airflow passing through the intake airway high-temperature points can more effectively transfer heat to other areas of the goaf, while airflow also more prominently dilutes and diffuses the heat. Consequently, the surrounding areas of the return airway should be designated as key monitoring zones for spontaneous combustion prevention in mines.
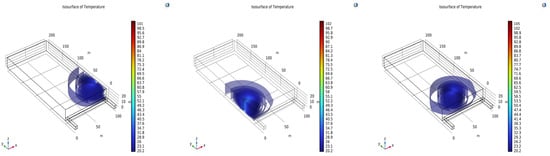
Figure 4.
Temperature field characteristics at the High-Temperature point 30 m Behind the Hydraulic Support.
Three additional high-temperature points were established along the strike direction of the working face at a distance of 40 m behind the hydraulic supports, with their heat source power remaining unchanged. The resulting temperature field isosurface distribution, obtained from the simulation, is shown in Figure 5.
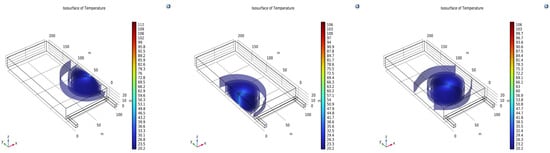
Figure 5.
Temperature Field Distribution Characteristics of High-Temperature points 40 m Behind the Hydraulic Supports.
By comparison, the isotherms surrounding high-temperature points near the roadway appear densely packed and narrow, whereas those around points located deeper in the goaf are sparser and more widely distributed. As high-temperature points extend further into the goaf interior, the temperature gradient diminishes and the affected area broadens. This pattern occurs because heat accumulates more readily in deeper goaf sections, promoting the formation of extensive high-temperature zones with elevated temperature levels and consequently greater hazard potential.
3.2. Distribution of CO Gas in Goaf
During the low-temperature oxidation of coal, active functional groups and weak chemical bonds within its molecular structure break and engage in physical adsorption and chemical oxidation reactions with oxygen, continuously generating CO. According to domestic research findings, it has been concluded that CO gas can serve as an early warning indicator for coal spontaneous combustion, and there exists a strong correlation between CO concentration and coal temperature. Specifically, for every 10 °C increase in temperature, the CO generation rate approximately doubles or more. This pattern makes changes in CO concentration a sensitive indicator for early detection of coal spontaneous combustion.
To systematically generate samples, the spatial locations of high-temperature points were set as variable parameters. By varying the location parameters of these points within the oxidation and spontaneous combustion zone, multiple simulation runs were conducted, establishing a comprehensive database of CO concentration distributions at the working face under different high-temperature point configurations. These data were organized into input–output pairs to form the training dataset for the DBO-BP neural network.
Taking the high-temperature points at coordinates (10, 30, 10), (50, 30, 10), and (90, 30, 10) as examples, the temperature cross-sections and CO gas distribution are shown in Figure 6 and Figure 7, respectively.
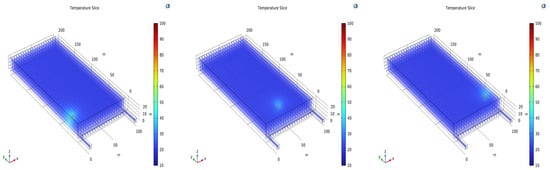
Figure 6.
Temperature Profile of High-Temperature Points 40 m Behind Hydraulic Supports.
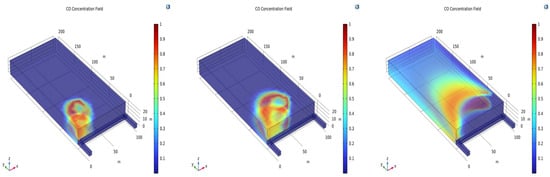
Figure 7.
CO Concentration Distribution under High-Temperature Points at Different Locations.
Simulation results reveal that the CO concentration distribution strongly depends on the spatial location of high-temperature points. The CO gas primarily generates near these high-temperature points. Driven by air leakage flow, the gas mainly migrates downwind and accumulates toward the return airway side. In contrast, fresh airflow continuously dilutes the CO concentration near the intake airway, maintaining consistently low levels. High-temperature points located near the return airway produce the highest CO concentrations, particularly in the upper corner and within the return airway itself.
Figure 8 shows the variation patterns of CO concentration at the working face caused by high-temperature points located at different positions: near the intake airway, near the return airway, and in the central goaf area.
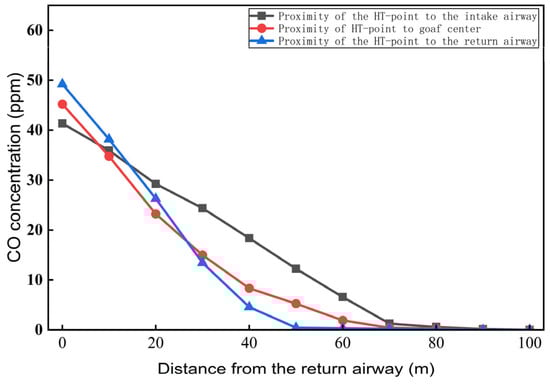
Figure 8.
CO Concentration Distribution on the Working Face under High-Temperature Points at Different Locations.
As shown in the figure, when high-temperature points in the goaf are in the low-temperature oxidation stage, their locations significantly affect the CO concentration distribution pattern on working faces. When a high-temperature point is near the intake airway, the CO concentration decreases steadily along the working face from the return toward the intake airway. Conversely, when a high-temperature point is close to the return airway, the CO concentration peaks distinctly near the return corner while remaining relatively low from the intake airway to the central goaf area, primarily influenced by working face air leakage.
Based on the simulation results, three preliminary conclusions can be drawn: First, the distribution of CO concentration on the working face can effectively indicate the location of high-temperature points. Second, air leakage is the main factor controlling CO transport, as CO generated from high-temperature points accumulates in the return airway due to airflow. Third, the return airway area is the optimal location for CO monitoring. These findings confirm the feasibility of locating hidden high-temperature points through gas monitoring.
4. Methods for Identifying High-Temperature Points in Goaf
4.1. Prediction Model Based on the DBO-BP Neural Network
The DBO-BP neural network combines the Dung Beetle Optimizer (DBO) with a Backpropagation (BP) neural network. This model utilizes DBO’s strong global optimization capability to automatically search for the optimal initial weights and thresholds of the BP network, effectively overcoming its limitations of easily falling into local optima and slow convergence. Consequently, it establishes a high-precision nonlinear mapping relationship between readily measurable CO concentration data and the spatial coordinates of high-temperature points that are difficult to detect directly. The computational workflow of the DBO-BP model is presented in Figure 9.
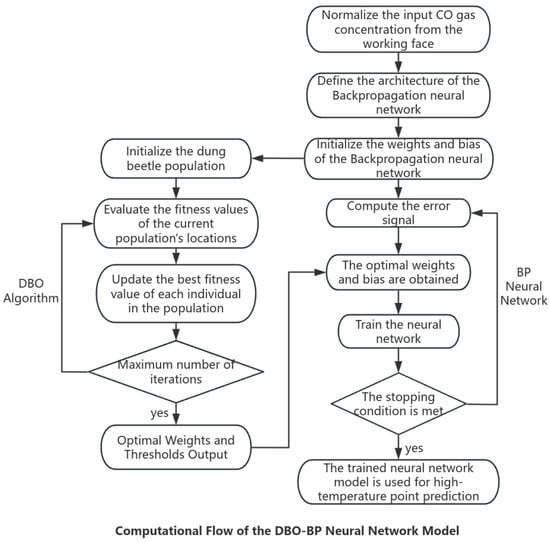
Figure 9.
Implementation Steps of the DBO-BP Neural Network.
The DBO-BP neural network model developed in Python establishes a nonlinear mapping relationship between CO concentration distribution and the spatial coordinates of high-temperature points. The hidden layer uses the Sigmoid activation function, which constrains outputs between 0 and 1, enabling effective capture of complex nonlinear relationships between inputs and outputs. The output layer employs a linear activation function, making it suitable for regression tasks and allowing accurate prediction of continuous spatial coordinate values.
The model imports CO concentration distribution data from the working face corresponding to different high-temperature points through the Python interface of COMSOL 6.3. Accordingly, the input layer is configured with 10 nodes. Since the output target is the three-dimensional spatial coordinates (x, y, z) of high-temperature points, the output layer is set to 3 nodes. The hidden layer is responsible for extracting nonlinear patterns from input features. To avoid excessive model complexity, the number of hidden layers is set to 1. The output layer performs linear weighting of the hidden layer’s outputs to generate the final predicted values.
To enhance generalization capability and prevent overfitting, an early stopping mechanism was implemented during training: the validation error was continuously monitored, and training was automatically terminated if no decrease was observed over multiple consecutive iterations. The model features a concise architecture with fast convergence speed and high prediction accuracy. The specific hyperparameter configurations are presented in Table 3.
Table 3.
Hyperparameter Configuration of the DBO-BP Prediction Model.
The model update is simulated by the following formula:
In the formula, t is the current iteration number; is the position of individual at iteration t; k is the disturbance coefficient, ∈ (0, 0.2]; is the environmental coefficient, ∈ (0, 1); is the natural coefficient, taking a value of −1 or 1 (where 1 indicates no deviation and −1 indicates deviation); is the worst position in the current population; is the change value of light intensity; is the angle between the old and new directions.
The simulation equation for the second stage is as follows:
In the formula, denotes the position of the individual at the iteration; and are independent random vectors of size 1 × D; and D indicates the dimensionality of the optimization problem.
Third-stage simulation formula:
In the formula, is a random number following a normal distribution, i.e., ~N (0, 1); is a 1 × D random variable belonging to the interval (0, 1).
The update formula for the fourth stage is:
In the formula, is a 1 × D random vector following a normal distribution; is a constant value.
During the data partitioning phase, the COMSOL-generated data sample repository is divided into training, validation, and test sets in a 7:2:1 ratio. The training set is used for iterative learning of model parameters; the validation set assists in hyperparameter tuning during model training to prevent overfitting; and the test set is employed to evaluate the model’s final generalization performance.
During the data preprocessing phase, in addition to employing the 3σ rule to remove outliers, linear interpolation to fill missing values, and normalization processing, the data underwent standardization verification. By calculating the mean and standard deviation for each feature, we verified whether the normalized data met the criteria for a standard normal distribution—zero mean and unit variance—ensuring data consistency and comparability to establish a robust data foundation for model training.
The experiment comprehensively evaluates model performance using three metrics: , and prediction latency (single-sample inference time). RMSE reflects the average error between predicted and actual values and is sensitive to outliers; intuitively measures the average absolute value of prediction errors, making it easier to interpret; prediction latency is used to evaluate model real-time capability, ensuring the model meets the millisecond-level response requirements of the underground monitoring system. , , and values were calculated, where lower and values, along with R2 values closer to 1, indicate stronger model applicability and higher prediction accuracy. The calculation formulas for , , and are as follows.
In the formula, denotes root mean square error, and denotes mean absolute error.
denotes the number of samples, denotes the sample index, represents the true value of the i-th sample, and represents the predicted value of the i-th sample. To visually demonstrate the model’s convergence speed and stability, Figure 10 shows the RMSE of the DBO-BP model on the test set as a function of iteration count and lag time.
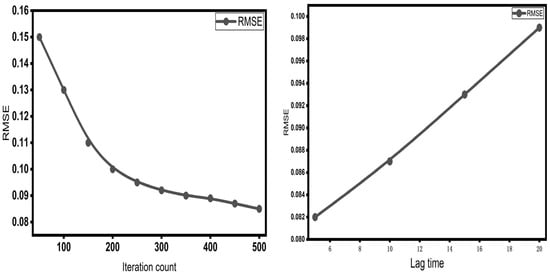
Figure 10.
Variation Curve with Iteration Count and Lag Time.
As shown in Figure 10, RMSE decreases with each iteration and stabilizes after approximately 300 iterations. However, RMSE increases as the lag time grows. Calculations based on the formula yield and values of 0.085 and 0.065, respectively, for the DBO-BP model under a 10 min lag prediction scenario. Single-sample prediction completes in just 4.5 ms, meeting the millisecond-level response requirements of underground monitoring systems. Its value reaches 0.96, indicating the model explains 96% of the data variation. This further validates the high accuracy and stability of the model inversion.
4.2. Geometric Prediction Method
Based on the conclusion presented in Section 3.1, which states that the temperature distribution within the goaf decreases gradually with increasing diffusion radius from the high-temperature point and remains constant at the same radial distance, a precise localization method is proposed. This method involves drilling temperature measurement boreholes near the predicted high-temperature point location based on the forecasting model, followed by field verification. It locates points on the same isothermal surface and rapidly determines the precise position of the high-temperature point by utilizing the center of the circumscribed circle.
The specific implementation steps of this method are illustrated in Figure 11.
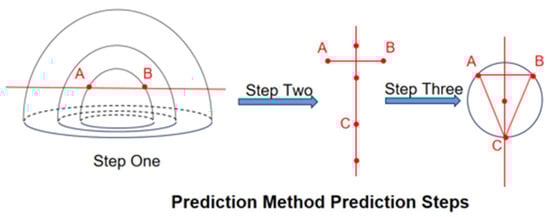
Figure 11.
Geometric Prediction Method Step Diagram.
Step 1: Locate two measurement points A and B with identical temperature values by constructing temperature measurement boreholes near the predicted high-temperature point.
Step 2: Deploy additional boreholes at the same stratigraphic level along the perpendicular bisector of the line segment connecting points A and B, and sequentially measure their temperatures. Identify and mark the measurement point with a temperature value matching points A and B as point C.
Step 3: Construct the circumcircle of triangle ABC, denoted as ⊙O. The center of this circle lies on the same vertical line as the actual high-temperature point.
Step 4: Achieve precise localization of the high-temperature point by analyzing the temperature distribution around the center point of the circumcircle and determining the vertical coordinate through temperature gradient analysis.
Traditional methods typically require the installation of numerous temperature and gas sensors in goaf areas. This approach is not only costly but also difficult and high-risk to implement, as sensors are highly susceptible to damage during roof collapses, resulting in data loss. In contrast, the geometric prediction method eliminates the need for expensive and fragile large-scale sensor networks while enabling accurate delineation of hazardous zones. This approach effectively supports the management of coal spontaneous combustion risks and enhances safety in coal mining operations.
5. Application of Precise Determination of High-Temperature Points in Abandoned Mine Areas
The geological conditions of the Seventh Working Face in Taihe Coal Mine are complex, with coal seams possessing a strong propensity for spontaneous combustion. The fully mechanized top-coal caving mining technique employed here leads to widespread residual coal distribution and substantial accumulation in the goaf, providing ample material basis for coal oxidation and temperature rise. Combined with the complex ventilation leakage patterns induced by the working face ventilation system, these conditions are highly conducive to concealed oxidation and heat accumulation deep within the goaf, significantly increasing the risk of formation and development of high-temperature points. Currently, the mine relies mainly on manual inspections and fixed-point gas monitoring for early warning. However, conventional methods face challenges in achieving comprehensive, real-time, and effective monitoring across the extensive and concealed goaf area, leading to delayed and uncertain identification of high-temperature points. As a result, undetected hidden high-temperature points likely exist in the goaf of the Seventh Working Face, where ongoing oxidation and heating processes present potential spontaneous combustion hazards.
The established prediction model was implemented at the Seventh Working Face of Taihe Coal Mine. A bundle tube system was employed to collect and analyze CO gas samples from this working face. To validate the model’s applicability and accuracy under field conditions, a portable high-precision CO detector was utilized to manually establish an approximately 100 m survey line along the working face. This survey line extended from the self-moving train cluster to the upper corner of the return airway, covering critical areas including the intake airway, central goaf, and return airway. Sampling points were systematically arranged at 10 m intervals along this line, resulting in 10 measurement points. To ensure data reliability, three consecutive measurements were taken at each point, with the average value recorded as the final CO concentration. The collected CO concentration data was then input into the prediction model to forecast the locations of high-temperature points. The layout of observation points in the working face goaf is illustrated in Figure 12.
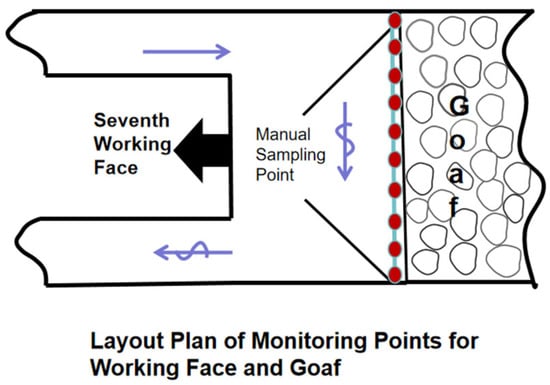
Figure 12.
Layout of Observation points in the Goaf of the Working Face.
Figure 13 presents the distribution of CO concentration at the working face, obtained through manual sampling and data processing.
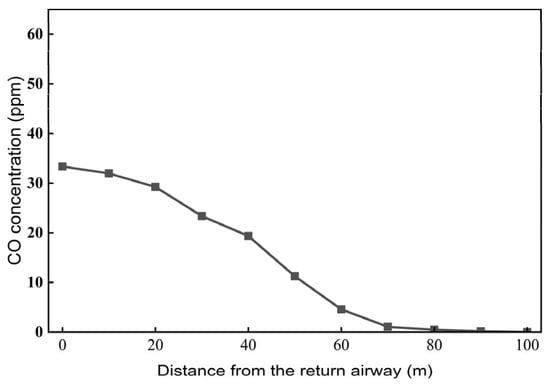
Figure 13.
CO Concentration Distribution at the Working Face.
The CO concentration distribution data from the working face is input into the DBO-BP prediction model to locate high-temperature points. Geometric prediction methods are then applied to verify the actual locations of these points on site. Figure 14 shows both the model-predicted locations and the actual measured locations.
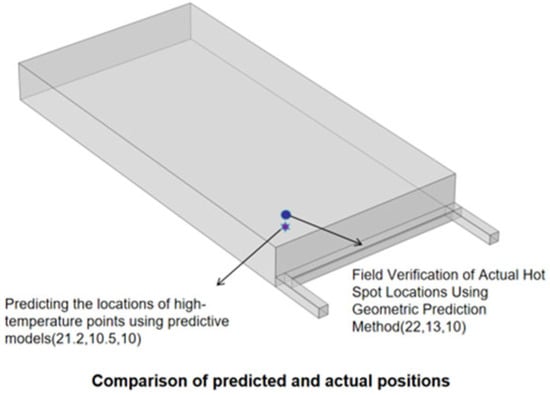
Figure 14.
Predicted vs. Actual Locations of High-Temperature Points.
The model was validated using field data from Taihe Coal Mine, demonstrating accurate spatial localization of high-temperature points. The average Euclidean distance error was 1.02 m, with 85% of prediction errors within 1.2 m and a maximum deviation of 1.8 m. These error levels meet engineering requirements for goaf applications, as they are significantly smaller than the goaf dimensions and provide sufficient accuracy for implementing fire prevention measures.
Based on the prediction results, the orientation, inclination angle, and depth of grouting boreholes are precisely designed to ensure they directly reach or cover the predicted high-temperature zones. Yellow mud slurry is employed as the primary grouting material. Using a grouting pump, the slurry is directionally and quantitatively injected into the target high-temperature points through the pre-drilled boreholes. The slurry infiltrates the coal body and absorbs significant heat through water evaporation, directly cooling the high-temperature points. After solidification, the solidified slurry effectively seals fractures in the goaf, blocking the oxygen supply and fundamentally suppressing the coal oxidation and spontaneous combustion process, thereby achieving early prevention of coal spontaneous ignition.
6. Discussion and Prospects
This study validates the effectiveness of an integrated approach combining numerical simulation with intelligent inversion for predicting spontaneous combustion risks in goaf areas. However, certain limitations regarding the model’s applicability and accuracy require further discussion.
The prediction accuracy of the DBO-BP neural network is constrained by the simplified treatment in the multiphysics modeling. Although the COMSOL simulation reveals key correlations between temperature and gas concentration fields, its idealized representation of the goaf’s porous structure affects model reliability. These inherent geological characteristics are difficult to accurately simulate, potentially leading to reduced prediction accuracy. Furthermore, while this study confirms the effectiveness of the DBO-BP model, a systematic performance comparison with other machine learning models—such as RF, SVM, and XGBoost—has not yet been conducted. Finally, the model’s predictive performance is closely tied to the coal-specific parameters used for training. Since the dataset was generated based on thermal parameters from Taihe Coal Mine samples, the model’s generalizability may be limited when applied to other mining regions. Different coal types exhibit significant variations in activation energy, heat release intensity, and oxidation pathways, which could lead to deviations in locating high-temperature points when predicting under different coal quality conditions.
Future research should focus on the following directions: introducing more realistic geological parameters into numerical simulations and expanding the coverage of training data samples to include diverse coal types, thereby enhancing model accuracy. Continuous model optimization through the collection of field data from multiple mining areas and coal seams will contribute to developing a more practically applicable intelligent early warning system for coal spontaneous combustion. Subsequent studies could also incorporate various models and evaluate their predictive accuracy and computational efficiency on identical datasets to identify the most suitable algorithm for predicting coal spontaneous combustion.
7. Conclusions
- (1)
- The multi-physics coupling model of the goaf constructed using COMSOL 6.3 precisely reveals the distribution patterns of CO gas under different high-temperature point locations, providing a high-quality data foundation for predictive modeling. Meanwhile, the temperature field within the goaf was found to exhibit an approximately concentric distribution pattern, based on which a geometric prediction method was proposed to locate high-risk regions of high-temperature points.
- (2)
- A DBO-BP neural network prediction model for high-temperature point localization was constructed in Python, trained using simulation data generated from COMSOL Multiphysics 6.3. Evaluation results indicate that the model exhibits strong predictive performance, enabling accurate identification of high-temperature points within the goaf based solely on CO concentration measurements obtained from the working face.
- (3)
- The geometric prediction method provides a reliable and efficient technical approach for on-site verification and precise localization of high-temperature points. By integrating the DBO-BP prediction model with the geometric prediction method and applying the combined approach to the precise localization of high-temperature points in the Taihe Coal Mine, coal oxidation and spontaneous combustion can be effectively suppressed at their source, thereby achieving early prevention of spontaneous combustion.
Author Contributions
C.Z.: conceptualization, methodology, validation, resources, writing—review and editing, supervision, project administration, funding acquisition. J.Y.: conceptualization, software, validation, formal analysis, investigation, data curation, writing—original draft preparation, visualization. All authors have read and agreed to the published version of the manuscript.
Funding
Financial support for this work, provided by the National Natural Science Foundation of China (No. 52374204), is gratefully acknowledged.
Institutional Review Board Statement
Not applicable.
Informed Consent Statement
Not applicable.
Data Availability Statement
The original contributions presented in the study are included in the article. Further inquiries can be directed to the corresponding author.
Conflicts of Interest
The authors declare no conflicts of interest.
References
- Su, C.; Zhang, D. Research on Prediction Model of Coal Spontaneous Combustion Risk Grade in Goaf Based on IGWO-BP. Mod. Min. 2025, 41, 218–221+229. [Google Scholar]
- Li, L.; Ren, T.; Zhong, X.; Wang, J. Study of the Oxidation Characteristics and CO Production Mechanism of Low-Rank Coal Goaf. Energies 2023, 16, 3311. [Google Scholar] [CrossRef]
- Wang, Y.; Sun, Y.; Dai, L.; Wang, K.; Cheng, G. Mechanisms of CO and CO2 Production during the Low-Temperature Oxidation of Coal: Molecular Simulations and Experimental Research. Fire 2023, 6, 475. [Google Scholar] [CrossRef]
- Gao, S.; Tang, M.; Zhao, X.; Zhou, L.; Zhang, R.; Qiu, J.; Luo, X.; Wang, J.; Wen, S. Study on multi-source analysis and prevention of CO in return corner of composite goaf. Case Stud. Therm. Eng. 2025, 76, 107362. [Google Scholar] [CrossRef]
- Lu, P.; Huang, Y.; Jin, P.; Yang, S.; Wang, M.; Wang, X. Optimization of a Marker Gas for Analyzing and Predicting the Spontaneous Combustion Period of Coking Coal. Energies 2023, 16, 7802. [Google Scholar] [CrossRef]
- Guo, J.; Jin, Y.; Wang, F.; Yang, P.; Sun, M. Research on Multi-Level Warning Method of Coal Spontaneous Combustion Based on Logistic Regression Analysis. J. Saf. Sci. Technol. 2022, 18, 88–93. [Google Scholar]
- Zhao, N.; Zhang, Y.; Zhao, X.; Yang, N.; Wang, Z.; Guo, Z.; Tong, J.; Zhang, Y.; Liu, Z. Temperature Distribution Regularity and Dynamic Evolution of Spontaneous Combustion Coal Gangue Dump: Case Study of Yinying Coal Mine in Shanxi, China. Sustainability 2023, 15, 6362. [Google Scholar] [CrossRef]
- Chufeng, Z. Research on Fault Diagnosis of Coal Mine Underground Equipment Based on Fiber Optic Sensing Technology. Coal Mine Mach. 2025, 46, 220–222. [Google Scholar] [CrossRef]
- Chen, T.; Bin, L. Low-oxygen comprehensive emergency treatment technology for fully mechanized mining face overlying extremely large goaf with close distance. Saf. Coal Mines 2021, 52, 101–105. [Google Scholar] [CrossRef]
- Ren, X. Practice of Fire Prevention and Control in Fully Mechanized Working Face of Composite Coal Seam Prone to Spontaneous Combustion in Positive Pressure Ventilation Mine. Min. Saf. Environ. Prot. 2022, 49, 90–93+99. [Google Scholar] [CrossRef]
- Qin, B.; Ma, D. Research Progress and Challenges in Prevention and Control of Combined Disasters of Coal Spontaneous Combustion and Methane in Coal Mine Goaf. J. China Coal Soc. 2025, 50, 392–408. [Google Scholar] [CrossRef]
- Jueraiti, M.; Liu, J.; Lin, M.; Jin, L.; Yu, J.; Wang, T.; Liu, T.; Wu, H.; Tian, R.; Ding, Y.; et al. Preparation and Performance Characterization of a Molasses-Based Composite Inhibitor for Coal Spontaneous Combustion in Steeply Inclined Goafs. Case Stud. Therm. Eng. 2025, 75, 107148. [Google Scholar] [CrossRef]
- Gao, S.; Tang, M.; Luo, X.; Zhou, L.; Qiu, J.; Zhang, R. Dynamic Simulation Study on Space-Time Evolution Law of Coal Spontaneous Combustion Hazardous Zone and High-Temperature Points in Goaf. Int. J. Heat Mass Transf. 2025, 251, 127321. [Google Scholar] [CrossRef]
- Guo, J.; Li, S.; Cai, G.B.; Li, R.H.; Jin, Y. Discussion on New Technologies of Hidden Fire Source Detection and Coal Temperature Sensing by Acoustic Method for Goaf. J. Saf. Sci. Technol. 2021, 17, 5–11. [Google Scholar]
- Shen, J.; Li, J. Determination of Heat Source Location in Goaf and Selection of Cooling Method. China Min. Mag. 2025, 34, 308–313. [Google Scholar]
- Deng, J.; Wang, J.; Ren, S.; Wang, C.; Qu, G.; Ma, L. Identification and Detection Technology for High-Temperature Spontaneous Combustion Points in Goaf Areas. J. China Coal Soc. 2024, 49, 885–901. [Google Scholar] [CrossRef]
- Jiamei, C. Investigation of Spontaneous Combustion Zones and Index Gas Prediction System in Goaf of “Isolated Island” Working Face. Fire 2022, 5, 67. [Google Scholar] [CrossRef]
- Ma, H.; Ren, W.; Wang, Y.; Deng, H.; Zhang, D. Prediction Model of Spontaneous Combustion “Three Zones” in Goaf. Fuel 2025, 397, 135402. [Google Scholar] [CrossRef]
- Tang, C.; Li, H.; Guo, G.; Cao, J.; Zha, J.; Li, R. A New Paradigm for Safe and Accurate Design of Underground Coal Gasification Coal Pillars Based on Physics-Informed Neural Networks. Eng. Appl. Artif. Intell. 2025, 160, 111957. [Google Scholar] [CrossRef]
- Chen, L.; Qi, X.; Tang, J.; Xin, H.; Liang, Z. Reaction Pathways and Cyclic Chain Model of Free Radicals During Coal Spontaneous Combustion. Fuel 2021, 293, 120436. [Google Scholar] [CrossRef]
- Xiao, C.; Liu, H.; Shi, F.; Deng, C.; Lai, J. Research and Implementation of Intelligent Control Platform Architecture for Coal Mine Based on Digital Twin. Min. Saf. Environ. Prot. 2023, 50, 43–49. [Google Scholar] [CrossRef]
- Wang, M.; Niu, X. Natural Prediction Model of Goaf Residual Coal Based on Data Reconstruction and Enhancement. Saf. Coal Mines 2022, 53, 86–93. [Google Scholar] [CrossRef]
- Zhong, X.; Wang, J.; Zhou, K. Monitoring and Early Warning Technology of Coal Spontaneous Combustion in Coal Mines: Research Status and Intelligent Development Trends. Ind. Mine Autom. 2021, 47, 7–17. [Google Scholar] [CrossRef]
- Gao, F.; Wang, P.; Wang, D.; Yang, Y.; Zhang, X.; Bai, G. Model for Predicting CO2 Adsorption in Coal Left in Goaf Based on Backpropagation Neural Network. Energies 2023, 16, 3760. [Google Scholar] [CrossRef]
- Li, G.; Li, S.; Miao, Y. Identification and Positioning Method of Mine External Fire Based on Machine Vision and Grey Model. Min. Saf. Environ. Prot. 2023, 50, 82–87. [Google Scholar] [CrossRef]
- Lei, C.; Deng, J.; Cao, K.; Xiao, Y.; Ma, L.; Wang, W.; Ma, T.; Shu, C. A Comparison of Random Forest and Support Vector Machine Approaches to Predict Coal Spontaneous Combustion in Gob. Fuel 2018, 239, 297–311. [Google Scholar] [CrossRef]
Disclaimer/Publisher’s Note: The statements, opinions and data contained in all publications are solely those of the individual author(s) and contributor(s) and not of MDPI and/or the editor(s). MDPI and/or the editor(s) disclaim responsibility for any injury to people or property resulting from any ideas, methods, instructions or products referred to in the content. |
© 2025 by the authors. Licensee MDPI, Basel, Switzerland. This article is an open access article distributed under the terms and conditions of the Creative Commons Attribution (CC BY) license (https://creativecommons.org/licenses/by/4.0/).