Abstract
Land subsidence is the geological hazard caused by natural or human factors, resulting in a regional decrease in ground elevation due to the compression of the surface soil of the earth’s crust, which has brought huge losses to the national economy. The physical model tests were conducted to study the land subsidence induced by triple pumping including Pumping I, Pumping II and Pumping III. A total of 41 LVDTs were installed to monitor the settlement of the ground, and pictures of the front of the model were taken to obtain the section settlement via the particle image velocimetry (PIV) software. On Path 1, the subsidence is −1.40 mm, −1.50 mm, −1.86 mm, and −2.36 mm after Pumping I; it is −3.15 mm, −3.56 mm, −3.45 mm, and −4.57 mm after Pumping II; and it is −1.29 mm, −0.68 mm, −0.86 mm and −1.65 mm after Pumping III. The closer the soil is to the pumping well, the more severe the settlement after pumping. In the confined aquifer, the pore pressure in the soil experiences a process of initial decrease followed by an increase, which is the manifestation of the drawdown cone on pore pressure. In the layered settlement of the soil, compression in the upper and lower clay layers is significant, accounting for the majority of surface subsidence, while the confined aquifer experiences almost no compression. The results can offer a reference for the prevention and control of land subsidence in soft soil areas.
1. Introduction
More than 150 countries and regions have experienced land subsidence [], often occurring in economically vibrant central cities []. The losses caused by land subsidence have reached approximately 46 billion USD in Shanghai [,], with an average economic loss of about 153 million USD for every 1 mm of subsidence. There is a large amount of soft clay distributed in Shanghai [,], which has the characteristics of high water content, high compressibility and low permeability [,], resulting in the severe challenges in handling bearing capacity and foundation settlement [,,,]. Liu et al. [] investigated the nonlinear compressibility, permeability, the yielding due to structural degradation and their effects on consolidation behavior of structured soft soils. Groundwater recharge has been used to reduce settlement in soft soil sites [,,], but it is costly. For example, in Shanghai, the amount of groundwater required for recharge even exceeds the available pumping capacity []. In addition, although land subsidence can be triggered by various factors, its primary cause is the excessive extraction of groundwater [,,,,]. Bangkok, Thailand, has been experiencing significant land subsidence since 1968 [], and the magnitude of subsidence has continued to increase despite various mitigation efforts. Soil improvement can be significantly enhanced by combining two well-established methods: prefabricated vertical drains (PVDs) and deep cement mixing (DCM) columns []. Land subsidence research was often conducted through model box tests whose initial condition and boundary conditions were easy to control, which was convenient for the relevant research on land subsidence mechanisms [,,]. However, in the relevant research on land subsidence caused by pumping groundwater, due to the enormous scope of influence of pumping-induced land subsidence [] and slow development, there were still some hardships in the control of materials and boundary conditions in the indoor model test, with few related research pairs.
When designing and conducting indoor model tests, it is essential to consider the characteristics of land subsidence caused by groundwater pumping. To simplify the process, it may be necessary to focus on specific aspects of the problem. For example, if the effect of the cone of depression is not of interest, the drawdown from multiple wells can be simplified as uniform precipitation within the confined aquifer. However, if the descent funnel is a factor, appropriate devices must be established to simulate the pumping well []. By connecting pumping pipes to the soil, it became easier to uniformly extract water from confined aquifers. This helped to analyze ground and layered settlement caused by large-scale pumping. However, during model experiments, there were potential issues that could affect the accuracy of the results. In current land subsidence tests, the saturation degree of topsoil was disregarded []. When conducting model tests, it is essential to consider that soil moisture can evaporate during consolidation and may not be replenished in time during pumping, leaving the surface soil unsaturated. However, allowing water in the soil to evaporate can lead to errors in the test results due to the long consolidation time of the soil []. In addition, in the model test of land subsidence induced by pumping, the control of the pumping flow rate was important. Different flow rates and whether the flow rate was uniform will directly affect the distribution and changes in pore pressure. Unfortunately, in the experiment, the uniform flow rate during pumping was often not well simulated []. In soil layers, the pore water pressure could vary significantly. Past studies have overlooked this fact and only controlled the pore water pressure of a confined aquifer, or ignored the differences in pore water pressure between layers altogether. To properly study pumping-induced settlement, it is crucial to limit evaporation, regulate the pumping flow rate, and control the pore water pressure of each layer separately during the model test.
This paper examines the distribution of pore water pressure and surface settlement resulting from single and multiple pumping in a confined aquifer through indoor model testing. By utilizing PIV in combination with LVDT measurement data, the variation in layered settlement in the soil is deduced. Through a peristaltic pump and a water level control tank layered in levels, the soil can attain a stable seepage state during the pumping process. This allows for a more precise simulation of soil deformation caused by repeated pumping in a confined aquifer.
2. Experimental Model and Methods
2.1. Experimental Model
According to the geological and hydro-geological background in Shanghai, the soil layers from the top downward are brown-yellow clay layer, silty clay layer, silt sand layer, clayey soil layer and silt sand layer []. The silty clay of layer No. 4 and the silty sand was used to simulate the clay layer and confined aquifer, respectively. The physical and mechanical parameters of soils for the model are summarized in Table 1. As shown in Figure 1, the experimental device mainly consists of a model box, a layered water level control tank, a groundwater pumping device, a data measurement system, and data acquisition equipment. The model box, as shown in Figure 2a, is the main area for testing, with dimensions of 1000 mm × 900 mm × 1400 mm in width, length, and height, consisting of an uncovered metal plate box, tempered glass, and a methyl methacrylate upper cover. The uncovered box is composed of metal plates with holes on the left and right sides and tempered glass plates at the front and rear. The holes on the metal plates are water holes for boundary replenishment after water pumping. The use of tempered glass on the front and rear surfaces of the model box is to measure the internal displacement of the soil using PIV during the testing process. Twelve pore water pressure transducers (PPT) and earth pressure cells (EPC) were used for each type, with four arranged in the middle of each layer of soil, as shown in Figure 2b. A total of 41 LVDTs were used, and Figure 2b,c, respectively, show the composition framework and arrangement of the LVDT.

Table 1.
Physical and mechanical properties of soils for the model test.
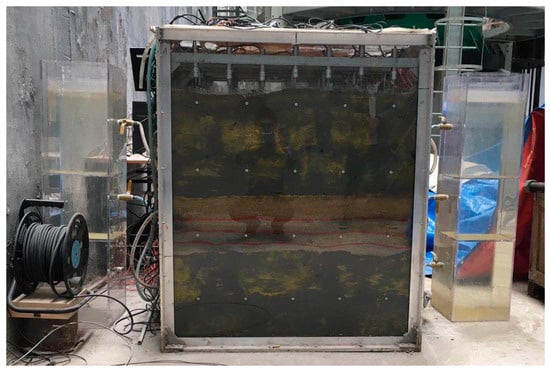
Figure 1.
The overall scheme of the installation.
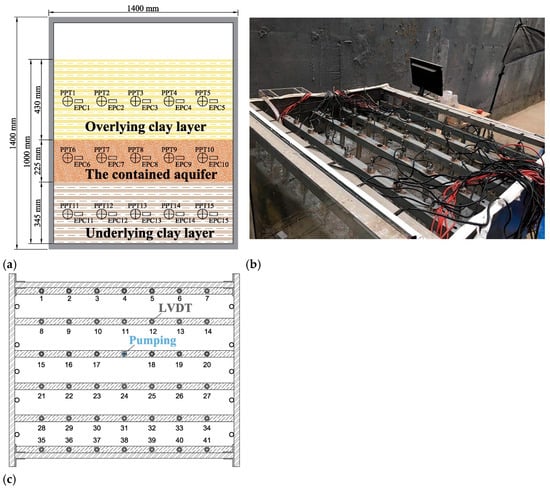
Figure 2.
Model box and sensers in the soil: (a) arrangement of water pressure transducers (PPT) and earth pressure cells (EPC); (b) frame for LVDT; (c) arrangement of sensors and pumping from top view.
In previous model tests, the lids on the model box were seldom used. Nevertheless, considering the long period of the test and the inevitable evaporation loss of water in the soil, to minimize water loss, a lid was necessary. In order to better meet the condition of the pore pressure difference between the confined aquifer and adjacent clay layers, rubber films were pasted by the universal glue at the junction of the confined aquifer and adjacent clay layers to prevent water seepage along the wall. Installation of perforated drainage pipes and application of Baseline in the model box was necessary to expedite soil consolidation and mitigate boundary effects. The water tank made of methyl methacrylate panels was divided into three parts, corresponding to the three layers of soil in the model box, which can control the water level of the three layers of soil separately and avoid mutual interference. The three areas of the water tank were equipped with water outlets and external control valves, which can manually control the opening and closing of the supply boundary. The external valve was connected to the same inlet and outlet water distributor through a rubber pipe, which can simultaneously replenish water to the three water inlets on the metal side plate of the model box. The peristaltic pump can meet the pumping requirements within the range of 10~300 mL/min, which is capable of better meeting the requirements of constant flow Pumping in model tests.
2.2. Experimental Procedures and Instrumentation
The procedures of the model test were as follows:
- (1)
- The soil pressure box, pore water pressure gauge, and linear displacement gauge were all calibrated;
- (2)
- The soil layer was filled by layer. The soil pressure cells and pore water pressure transducers were buried at the corresponding positions, and the linear displacement transformer was installed on the surface of the soil. When filling the sand layer by layer, the water was replenished every 5 cm increase in thickness to make it saturated;
- (3)
- The soil was consolidated and stabilized under self-weight conditions. To determine its stability, it was necessary to meet the requirements of stable values measured by the soil pressure cells, pore water pressure transducers, and linear displacement transformers;
- (4)
- After the soil was solidified and stabilized, the pumping water was conducted from the confined aquifer. PumpingⅠ lasted for 30 min, with the pumping rate of 100 mL/min and the pumping capacity of 3000 mL;
- (5)
- After the pumping completion, the peristaltic pump was turned off and all data were observed and recorded during its recovery process;
- (6)
- When the soil reached the stable state again, Pumping II was conducted for 60 min, with the pumping speed of 100 min/min and the pumping capacity of 6000 mL;
- (7)
- After the pumping completion, the peristaltic pump was turned off and all data were observed and recorded during its recovery process;
- (8)
- When the soil reached the stable state again, Pumping Ⅲ was conducted for 90 min, with the pumping speed of 100 mL/min and the pumping volume of 9000 mL;
- (9)
- After the pumping completion, the peristaltic pump was turned off and all data were observed and recorded during its recovery process;
- (10)
- After the data stabilizing, the experiment was completed.
After the soil consolidating, the peristaltic pump with a controllable flow rate was used for three pumping operations, with pumping volumes of 3 L, 6 L, and 9 L, respectively. The pumping rate during the three pumping operations was approximately 100 mL/min. Paths 1~4 were selected for analysis of different spatial positions, as shown in Figure 3.
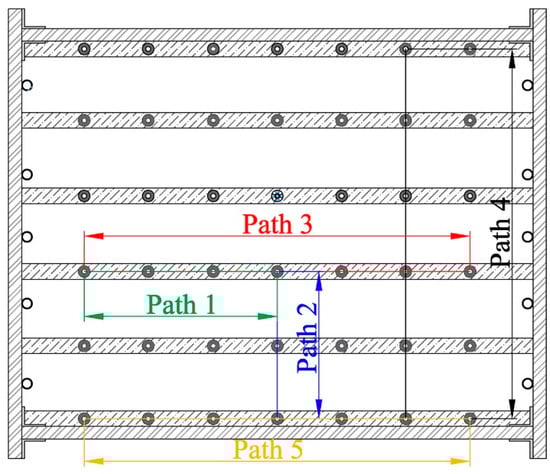
Figure 3.
Five paths for ground settlement.
3. Test Result Analysis
3.1. Land Subsidence Variation Due to Triple Pumping
As shown in Figure 4a, after the completion of Pumping I, when the subsidence exceeds 1 mm, the time required for LVDT No. 21 located farthest from the pumping well is significantly longer than that for the LVDTs at the other three locations. Land subsidence during this period is mainly caused by the consolidation of adjacent clay layers above and below. The soil experiences a rapid subsidence phase lasting for one day before entering the secondary consolidation stage, during which the subsidence rate gradually decreases. After approximately 125 h of secondary consolidation, the subsidence along all paths stabilizes, with the rate of subsidence development reducing to about 0.01 mm/h.
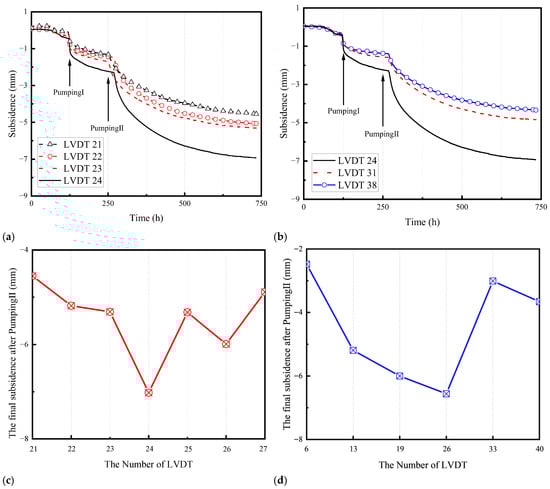
Figure 4.
Variations in subsidence in different paths for the first two pumping: (a) Path 1; (b) Path 2; (c) Path 3; (d) Path 4.
After Pumping I, and without any water replenishment, Pumping II was carried out with a total volume of 6 L, a pumping flow rate of 100 mL/min, and a duration of 60 min. Pumping II produced a subsidence response with a smoother time history, characterized mainly by slow, long-term accumulation, in contrast to the rapid subsidence observed within the first 24 h of Pumping I. LVDT No. 24 required approximately 450 h to reach a stable rate of 0.01 mm/h, whereas the other LVDTs stabilized after about 350 h. The final cumulative settlement of LVDTs No. 21~24 is summarized in Table 2 after Pumping I and Pumping II, respectively.
Table 2.
Cumulative settlement of LVDTs No. 21~24 on Path 1 after Pumping I and Pumping II.
The subsidence over time on Path 2, monitored by LVDTs No. 24, No. 31 and No. 38, is illustrated in Figure 4b, reflecting a spatial impact similar to that of Figure 4a. After two rounds of pumping on Paths 3 and Path 4, the final subsidence data obtained by LVDT at each monitoring point shows that the closer the location of the pumping well, the more severe the subsidence caused, illustrated in Figure 4c,d. On path 3, the data monitored by LVDTs No. 21~27 are −4.55 mm, −5.18 mm, −5.31 mm, −7.02 mm, −5.43 mm, −5.99 mm and −4.89 mm, respectively. Except for the subsidence monitored by LVDT No. 24, the differences at other points are relatively small, which may be due to the smaller size of the model box and the lower stress level, while the increase in effective stress caused by pumping varies less among the small range of model boxes.
As shown in Figure 5a, land subsidence caused by Pumping III exceeded 50% of the final value between the 100th and 200th hour. LVDTs No. 21–24 recorded subsidence values of −1.29 mm, −0.68 mm, −0.86 mm, and −1.65 mm, respectively. By the 200th hour, the subsidence had reached −0.92 mm, −0.65 mm, −0.86 mm, and −1.07 mm, corresponding to 71.2%, 94.3%, 68.8%, and 64.6% of their final values. This indicates that the subsidence induced by Pumping III was significantly smaller than that observed during the previous two pumping operations. The spatial distribution pattern shown in Figure 5b is similar to that in Figure 4b. Figure 5c,d show the final subsidence recorded by the LVDTs at each monitoring point along Path 3 and Path 4 after Pumping III. Along Path 3, LVDTs No. 21−27 measured subsidence values of −1.29 mm, −0.69 mm, −1.25 mm, −1.58 mm, −1.46 mm, −1.24 mm, and −1.29 mm, respectively.
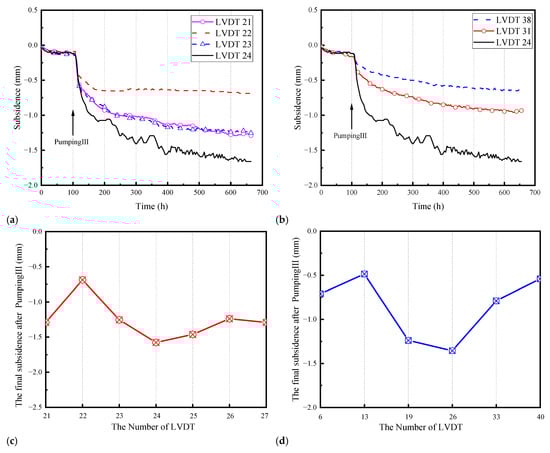
Figure 5.
Variations in subsidence in different paths for Pumping III: (a) Path 1; (b) Path 2; (c) Path 3; (d) Path 4.
In summary, a significant portion of the subsidence caused by withdrawn water is due to secondary consolidation. Under the same pumping conditions, subsidence stability takes longer to achieve for LVDT closer to the well. However, its impact weakens beyond a certain range, that is, the effective stress changes induced by the following pumping have little effect on the compression of the confined aquifer, due to being greatly compressed by Pumping I. The elastic modulus of the confined aquifer increases to a certain extent.
In this experiment, LVDTs evenly distributed on the soil surface were used to record soil subsidence, facilitating the evaluation of interference effects. The data collected by the LVDTs were conducted to generate three-dimensional (3D) and two-dimensional (2D) subsidence maps for the three pumping operations, as shown in Figure 6. After Pumping I, the subsidence center coincides with the pumping well location, and surface subsidence is continuous in the central region of the soil. In contrast, the edges of the model box exhibit relatively minor surface subsidence, as illustrated in Figure 6a,b. Following Pumping II, the position of the subsidence center remains largely unchanged, but the magnitude of subsidence increases noticeably. Additionally, the area influenced by boundary friction after Pumping I shows a slight reduction, as seen in Figure 6c,d. Once the ground had stabilized after Pumping I, two subsidence centers, A and B, emerged near each other on the surface. After the subsidence caused by Pumping II was stable, the position of subsidence center A with a more significant subsidence value remained unchanged. In comparison, subsidence center B with a smaller value moved a certain distance towards subsidence center A. From the changes in the three-dimensional nephograms, compared to subsidence center A, subsidence center B had a more significant increase in subsidence caused by Pumping II. The soil deforms over time due to pumping, moving vertically and horizontally towards the precipitation center or pumping well. Following the stabilization of the subsidence induced by Pumping Ⅲ, there were two areas where significant subsidence occurred. These locations were similar to the two previous subsidence centers. However, subsidence center B experienced greater settlement than subsidence center A, as illustrated in Figure 6e,f. Subsidence center B is distributed near the pumping well but does not completely coincide with the location of the pumping well. Therefore, pumping not only causes soil deformation in the vertical direction but also the horizontal direction. When evaluating environmental problems caused by precipitation, in addition to the subsidence issue that has always been highly valued, the impact of the horizontal direction also needs to be further emphasized by society.
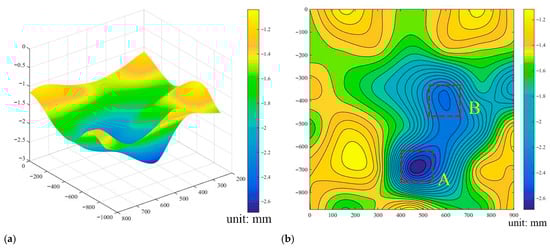
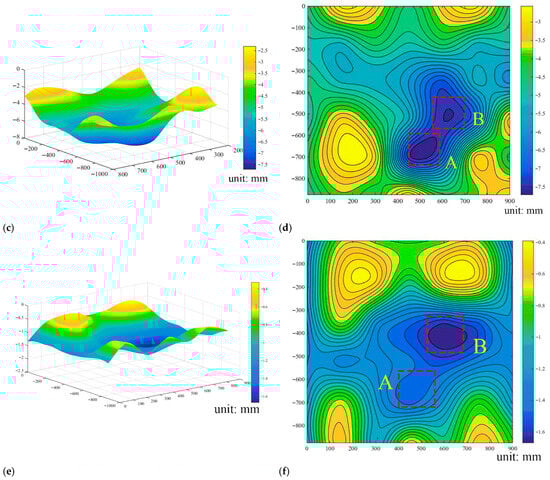
Figure 6.
Subsidence nephogram after triple pumping: (a) 3D nephogram after Pumping I; (b) 2D nephogram after Pumping I; (c) 3D nephogram after Pumping II; (d) 2D nephogram after Pumping II; (e) 3D nephogram after Pumping III; (f) 2D nephogram after Pumping III.
3.2. Subsidence Fixed by PIV and LVDT Results
Figure 7 illustrates the subsidence of Path 5 measured by LVDT and GeoPIV-RG after Pumping II, respectively. The error is within 5% of the subsidence monitored by LVDT. Through data fitting at the test points, the functional relationship between LVDT and GeoPIV-RG was established, as shown in Figure 7b, where L is the accurate subsidence monitored by LVDT (mm); P is the subsidence measured by GeoPIV-RG. Overall, the results of LVDT and GeoPIV-RG for the surface layer are very close. Therefore, selecting four paths (A1, A2, A3, A4) in the main view of Figure 2a, we used GeoPIV-RG to calculate the soil subsidence at different depths, as shown in Figure 8.
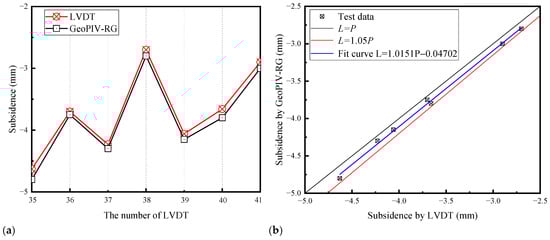
Figure 7.
Comparison of subsidence measured by LVDT and GeoPIV-RG: (a) Comparison chart; (b) Error analysis.
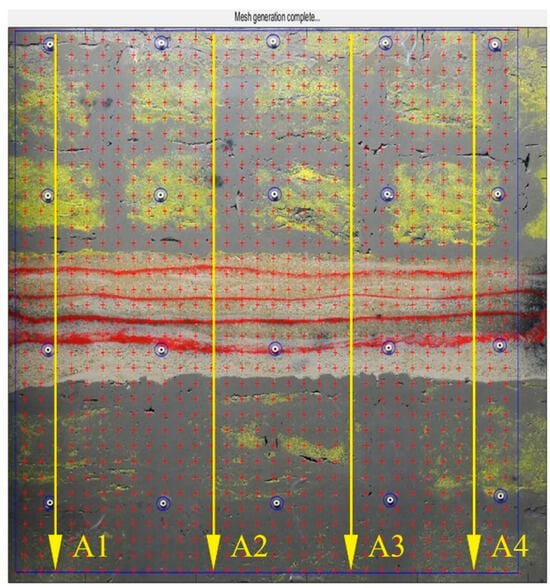
Figure 8.
Four settlement paths measured by GeoPIV-RG from front view of model.
As shown in Figure 9a, for the first two pumping, the four curves from A1 to A4 have maximum cumulative settlement values of −4.73 mm, −3.73 mm, −3.56 mm, and −3.37 mm. The corresponding upper layer soft clay compression amounts are 1.27 mm, 1.29 mm, 1.00 mm, and 0.77 mm, accounting for 27.2%, 34.4%, 28.0%, and 22.7% of the maximum settlement, respectively. The lower layer soft clay soil compression accounts for a considerable proportion of 73.0%, 66.1%, 71.3%, and 75.6%, respectively. In the soil compression caused by Pumping I and Pumping II of 9L, the compression amount of the underlying clay layer was significantly greater than that of the overlying clay layer.
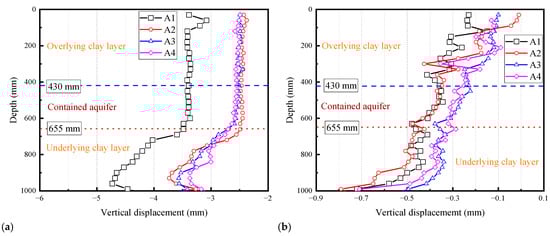
Figure 9.
Settlement along four paths measured by GeoPIV-RG: (a) after Pumping II; (b) after Pumping III.
As shown in Figure 9b, the internal displacement of the soil induced by Pumping III was slight compared to the previous pumping. However, the overall trend is similar to the previous two, with the main deformation distributed in the overlying and underlying clay layers. The four curves from A1 to A4 have maximum cumulative settlement values of −0.62 mm, −0.74 mm, −0.56 mm, and −0.74 mm, corresponding to upper soft clay compression values of 0.21 mm, 0.31 mm, 0.25 mm, and 0.42 mm, accounting for 34.2%, 41.4%, 44.8%, and 56.6% of the maximum settlement, respectively. Compared to the previous two pumping operations, the proportion of the overlying clay layer in the compression caused by Pumping III has increased.
3.3. Pore Water Pressure Variation Due to Triple Pumping
Figure 10 illustrates the variation in pore pressure with time in different soil layers caused by the first and second pumping, as well as the comparison of pore pressure in different soil layers. Figure 10a–c represents the pore pressure data collected by piezometers at different distances from the pumping well in the same soil layer. There were differences in the measured pore pressure between the overlying and underlying clay layers at different distances from the pumping well, while the pore pressure values measured by the piezometers at different distances from the pumping well in the middle sand layer were very close. In the overlying clay layer, the pore pressure difference at different positions is relatively small before Pumping II. However, as Pumping II was completed, the difference in pore pressure between the two positions also increased. For the middle sand layer, the influence of pumping on the pore pressure difference at different positions is not significant. As for the underlying soft clay layer, the pore pressure difference between the two positions started to occur after Pumping I. The most probable cause of this phenomenon is that with the implementation of pumping, the soft clay layer undergoes a significant degree of consolidation, while the sand layer undergoes a lesser degree of consolidation. The greater the consolidation, the more pronounced the change in permeability coefficient, resulting in a significant difference in pore pressure distribution within the same soil layer. Although the overlying and underlying soft clay layers have similar soil properties, their different positions result in different consolidation pressures, leading to a significant difference in compaction degree between the two soil layers right from the beginning. The pore pressure difference within the overlying soft clay layer begins to appear only after experiencing two pumping events, while the underlying soft clay layer shows a pore pressure difference after Pumping I. As shown in Figure 10d, the change in soil compaction caused by precipitation, which then affects the permeability coefficient and finally results in uneven pore pressure distribution, was also reflected. In the overlying clay layer, whether it was the first or second pumping, the pore pressure changed rapidly. However, for the underlying clay layer, the pore pressure change is faster after Pumping I than that after Pumping II.
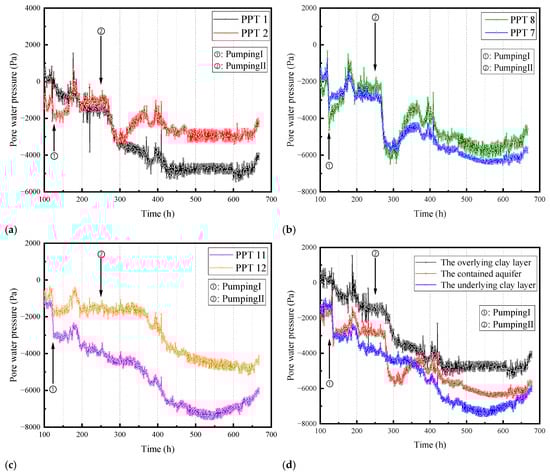
Figure 10.
The variation in pore water pressure by Pumping I and Pumping II: (a) Overlying clay layer; (b) Contained aquifer; (c) Underlying clay layer; (d) All layers.
Three different soil layers were studied regarding the variation in pore pressure and its comparison after Pumping III, as shown in Figure 11. Figure 11a–c represent the pore pressure measurements obtained by pore pressure gauges placed at different distances from the pumping well within the same soil layer. The pore pressure measurements at different distances from the pumping well in the three soil layers show minimal differences, indicating the presence of a phenomenon where the pore pressure decreases and then rebounds. After Pumping III, the pore pressure in the overlying soft clay layer and the intermediate standard sand layer begins to decline rapidly. However, in the underlying soft clay layer, the pore pressure decrease caused by pumping is relatively gradual. Figure 11d illustrates that the pore pressure variations caused by PumpingⅢ exhibit similarities among the three soil layers, with no significant distinctions observed in terms of the rate or magnitude of change. This can be attributed to the potential formation of seepage channels within the soft clay layer or along the wellbore wall after multiple pumping events. As a result, the pore pressure changes are promptly transmitted among the different soil layers, leading to minimal discrepancies in the pore pressure variations observed across the three soil layers.
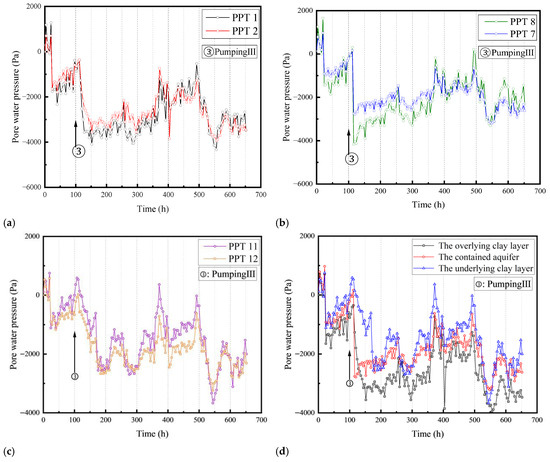
Figure 11.
The Variation in Pore water pressure by Pumping III: (a) Overlying clay layer; (b) Contained aquifer; (c) Underlying clay layer; (d) All layers.
Thus, the compactness of a soil layer directly affects the distribution of pore pressure. In standard sand layers, their high void ratio, low density, and relatively large elastic modulus make it difficult for the effective stress increments caused by pumping to produce significant changes. As a result, the change in void ratio is limited, and pore pressure remains nearly uniform across different locations. In contrast, for soft clay layers, variations in consolidation stress across the layer influence the pore pressure response after repeated pumping. Higher consolidation stresses require fewer pumping cycles to induce uneven pore pressure distribution, and the resulting changes in pore pressure are more pronounced.
3.4. Total Stress Variation Due to Triple Pumping
Figure 12 illustrates the variation in the total stress, monitored by EPC, inside each clay layer over time during Pumping I and Pumping II. The total stress of overlying or underlying clay layers, as well as the contained aquifer layer, varied based on the distance from the pumping well. However, the trend of the total stress over time remained consistent within the same soil layer.
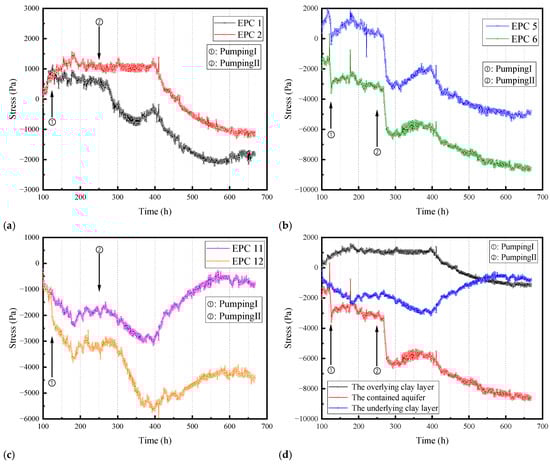
Figure 12.
Variations in total stress by Pumping I and Pumping II: (a) Overlying clay layer; (b) Contained aquifer; (c) Underlying clay layer; (d) All layers.
As shown in Figure 12a, it takes some time for the variation in pore pressure in a confined aquifer to transmit to the soft clay layer, resulting in a lag in the total stress change in the overlying clay layer. After Pumping II, the total stress in the overlying soil began to decrease, instead of the slight change after Pumping I, and after a continuous decrease for a period of time, the total stress began to rebound to a certain extent before continuing to decrease. The reason is likely due to precipitation causing a falling funnel. After stopping pumping, the cone of depression gradually flattens, causing a certain degree of recovery of the water level above the funnel, thereby causing a certain degree of recovery of pore pressure and subsequently leading to a rebound of total stress. The gradual reduction in total stress following a rebound may be caused by the loss of water on the surface of the soil layer above, as it transitions from fully saturated to unsaturated soil, and the subsequent decrease in water level over some time.
Compared to the overlying soil layer, the total stress of the contained aquifer layer shown in Figure 12b changes rapidly. As soon as the pumping starts, there is an immediate change in the total stress level. In the confined aquifer layer, the decrease and rebound in total stress caused by Pumping I and Pumping II may be induced by the formation and recovery of a cone of depression. After Pumping II, the time required for the rebound of the total stress is significantly longer than the duration of the rebound after the first pumping, owing to the larger pumping amount, which takes longer to recover the cone of depression.
As shown in Figure 12c, compared to the other two layers, the total stress difference at various positions is significant in the underlying soft clay layer due to its denser and higher consolidation stress. After Pumping II, the degree of total stress rebound in the underlying soft clay layer is greater with the more significant trend of rebound.
Select the EPC closest to the pumping well in each layer of soil to compare the changes in total stress in the three layers of soil, as shown in Figure 12d. Overall, the total stress changes in the overlying clay layer and confined aquifer are relatively similar, while the total stress development in the underlying soft clay layer is significantly different from these two layers. Pumping operations occurred in the confined aquifer, with the most significant total stress change in the three layers. Specifically, the total stress changed as soon as the pumping implementation, with a greater amplitude of the change than the other two layers. In the overlying and underlying clay layers, the effect of pumping on the total stress exhibits a lag effect, especially after Pumping II.
Figure 13 illustrates the variation in the total stress, monitored by EPC, inside each clay layer over time during Pumping III. Figure 13a–c represent the total stress data collected by the soil pressure box in each soil layer. Unlike the changes in pore pressure within each soil layer, the changes in total stress are almost completely synchronous within the three soil layers. As shown in Figure 13d, after pumping, for the change in total stress, the central standard sand layer showed the most significant change, followed by the overlying clay layer, while the underlying clay layer showed a slight change, with changes of −3500 Pa, −2000 Pa, and −1000 Pa, respectively.
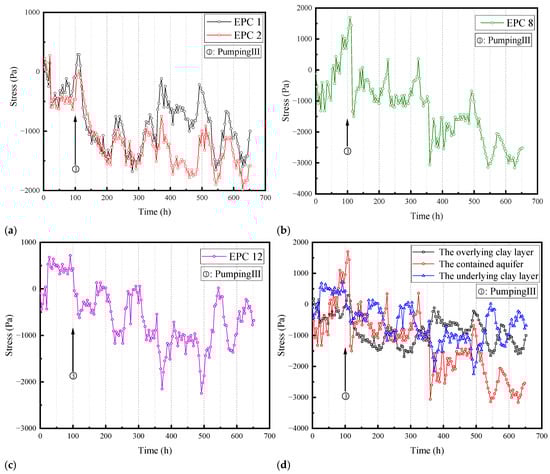
Figure 13.
The variation in total stress by Pumping III: (a) Overlying clay layer; (b) Contained aquifer; (c) Underlying clay layer; (d) All layers.
4. Conclusions
This paper conducted the model test by LVDT, PPT, and EPC arranged inside the soil layer, combined with the GeoPIV-RG software, to simulate the process of land subsidence induced by triple pumping in confined aquifers. The spatiotemporal distribution law of land subsidence induced by precipitation is studied. The main conclusions are as follows.
- (1)
- The spatial distribution of land subsidence induced by pumping is more severe as it approaches the pumping well. As the distance from the same pumping well increases, its ground settlement rapidly decreases, but the rate of decline is not directly proportional to the increase in distance. The land subsidence induced by pumping accounts for the majority of the total subsidence in terms of the time distribution occurring in a relatively short period of time after pumping.
- (2)
- The subsidence induced by pumping is composed of the compression amount of each soil layer. The majority of land subsidence is caused by the compression of the overlying and underlying clay layers, with only a minor contribution from the confined aquifer’s compression.
- (3)
- After pumping, the pore pressure and total stress in the soil often decrease before increasing due to the formation of a cone of depression. The cone of depression causes a decrease in pore pressure in the soil layer, and after the completion of pumping, the falling funnel gradually flattens out, and the pore pressure of the soil inside the falling funnel also recovers to a certain extent.
- (4)
- Compared with the previous two pumping operations, the proportion of overlying clay-layer compression caused by Pumping III has increased to a certain extent. Although Pumping III has the same total amount as Pumping I and Pumping II, it significantly reduces clay compression and subsidence.
Author Contributions
Conceptualization, Z.-D.C.; methodology, Z.-D.C., J.-J.J. and W.-H.G.; software, J.-J.J. and W.-H.G.; validation, L.Y.; formal analysis, L.Y.; investigation, J.-J.J. and W.-H.G.; resources, L.Y.; data curation, L.Y.; writing—original draft preparation, J.-J.J. and W.-H.G.; writing—review and editing, L.Y. and Z.-D.C.; supervision, Z.-D.C.; project administration, Z.-D.C.; funding acquisition, Z.-D.C. All authors have read and agreed to the published version of the manuscript.
Funding
This study was funded by the Fundamental Research Funds for the Central Universities (Grant No. 2024KYJD1001).
Institutional Review Board Statement
Not applicable.
Informed Consent Statement
Not applicable.
Data Availability Statement
The raw data supporting the conclusions of this article will be made available by the authors on request.
Conflicts of Interest
The authors declare no conflicts of interest.
References
- Faunt, C.C.; Sneed, M.; Traum, J.; Brandt, J.T. Water availability and land subsidence in the Central Valley, California, USA. Hydrogeol. J. 2016, 24, 675–684. [Google Scholar] [CrossRef]
- Nguyen, M.; Lin, Y.N.; Tran, Q.C.; Ni, C.-F.; Chan, Y.-C.; Tseng, K.-H.; Chang, C.-P. Assessment of long-term ground subsidence and groundwater depletion in Hanoi, Vietnam. Eng. Geol. 2022, 299, 106555. [Google Scholar] [CrossRef]
- Cui, Z.; Jia, Y. Analysis of electron microscope images of soil pore structure for the study of land subsidence in centrifuge model tests of high-rise building groups. Eng. Geol. 2013, 164, 107–116. [Google Scholar] [CrossRef]
- Tang, Y.Q.; Cui, Z.D.; Wang, J.X.; Lu, C.; Yan, X.X. Model test study of land subsidence caused by high-rise building group in Shanghai. Bull. Eng. Geol. Environ. 2008, 67, 173–179. [Google Scholar] [CrossRef]
- Zheng, Y.; Sun, H.; Hou, M.; Ge, X. Microstructure evolution of soft clay under consolidation loading. Eng. Geol. 2021, 293, 106284. [Google Scholar] [CrossRef]
- Shen, S.L.; Xu, Y.S. Numerical evaluation of land subsidence induced by groundwater pumping in Shanghai. Can. Geotech. J. 2011, 48, 1378–1392. [Google Scholar] [CrossRef]
- Lin, P.; Chen, X.; Jiang, M.; Song, X.; Xu, M.; Huang, S. Mapping shear strength and compressibility of soft soils with artificial neural networks. Eng. Geol. 2022, 300, 106585. [Google Scholar] [CrossRef]
- Liang, Z.X.; Sun, H.; Huang, Z.; Niu, F. The influences of natural structure damage and stress path on mechanical behaviors of soft clay. Bull. Eng. Geol. Environ. 2023, 82, 208. [Google Scholar] [CrossRef]
- Castellazzi, P.; Arroyo-Domínguez, N.; Martel, R.; Calderhead, A.I.; Normand, J.C.L.; Gárfias, J.; Rivera, A. Land subsidence in major cities of Central Mexico: Interpreting InSAR-derived land subsidence mapping with hydrogeological data. Int. J. Appl. Earth Obs. Geoinf. 2016, 47, 102–111. [Google Scholar] [CrossRef]
- Jiang, J.; Cui, Z. Instability of High Liquid Limit Soil Slope for the Expressway Induced by Rainfall. Appl. Sci. 2022, 12, 10857. [Google Scholar] [CrossRef]
- Jun, S.H.; Kwon, H.J. Constitutive Relationship Proposition of Marine Soft Soil in Korea Using Finite Strain Consolidation Theory. J. Mar. Sci. Eng. 2020, 8, 429. [Google Scholar] [CrossRef]
- Zamanirad, M.; Sarraf, A.; Sedghi, H.; Saremi, A.; Rezaee, P. Modeling the Influence of Groundwater Exploitation on Land Subsidence Susceptibility Using Machine Learning Algorithms. Nat. Resour. Res. 2020, 29, 1127–1141. [Google Scholar] [CrossRef]
- Liu, W.; Shi, Z.; Zhang, J.; Zhang, D. One-dimensional nonlinear consolidation behavior of structured soft clay under time-dependent loading. Geomech. Eng. 2019, 18, 299–313. [Google Scholar] [CrossRef]
- Roy, D.; Robinson, K.E. Surface settlements at a soft soil site due to bedrock dewatering. Eng. Geol. 2009, 107, 109–117. [Google Scholar] [CrossRef]
- Wang, X.; Luo, Z.; Li, Z.; Zhao, Q.; Dai, J. The impact of groundwater recharge on land subsidence: A case study from the Cangzhou test area, Hebei Province, China. Hydrogeol. J. 2023, 31, 813–825. [Google Scholar] [CrossRef]
- Hason, M.F.; Smith, R.; Vajedian, S.; Pommerenke, R.; Majumdar, S. Global land subsidence mapping reveals widespread loss of aquifer storage capacity. Nat. Commun. 2023, 14, 6180. [Google Scholar] [CrossRef]
- Cui, Z.; Tang, Y. Land subsidence and pore structure of soils caused by the high-rise building group through centrifuge model test. Eng. Geol. 2010, 113, 44–52. [Google Scholar] [CrossRef]
- Ortega-Guerrero, A.; Rudolph, D.L.; Cherry, J.A. Analysis of long-term land subsidence near Mexico City; field investigations and predictive modeling. Water Resour. Res. 1999, 35, 3327–3341. [Google Scholar] [CrossRef]
- Fernández-Merodo, J.A.; Ezquerro, P.; Manzanal, D.; Béjar-Pizarro, M.; Mateos, R.M.; Guardiola-Albert, C.; García-Davalillo, J.C.; López-Vinielles, J.; Sarro, R.; Bru, G.; et al. Modeling historical subsidence due to groundwater withdrawal in the Alto Guadalentín aquifer-system (Spain). Eng. Geol. 2021, 283, 105998. [Google Scholar] [CrossRef]
- Huang, Q.B.; Miao, C.; Yuan, Y.; Qu, Y.; Gou, Y. Failure analysis of metro tunnel induced by land subsidence in Xi’an, China. Eng. Fail. Anal. 2023, 145, 106996. [Google Scholar] [CrossRef]
- Yu, H.R.; Gong, H.; Chen, B.; Liu, K.; Gao, M. Analysis of the influence of groundwater on land subsidence in Beijing based on the geographical weighted regression (GWR) model. Sci. Total Environ. 2020, 738, 139405. [Google Scholar] [CrossRef]
- Edalat, A.; Khodaparast, M.; Rajabi, A.M. Detecting Land Subsidence Due to Groundwater Withdrawal in Aliabad Plain, Iran, Using ESA Sentinel-1 Satellite Data. Nat. Resour. Res. 2020, 29, 1935–1950. [Google Scholar] [CrossRef]
- Phien-Wej, N.; Giao, P.H.; Nutalaya, P. Land subsidence in Bangkok, Thailand. Eng. Geol. 2006, 82, 187–201. [Google Scholar] [CrossRef]
- Nguyen, B.P.; Nguyen, T.T.; Nguyen, T.; Guo, W. Analytical model for consolidation and bearing capacity of soft soil stabilized by combined PVD-deep cement mixing columns. Bull. Eng. Geol. Environ. 2023, 82, 286. [Google Scholar] [CrossRef]
- Wu, J.; Shi, B.; Cao, D.-F.; Jiang, H.-T.; Wang, X.-F.; Gu, K. Model test of soil deformation response to draining-recharging conditions based on DFOS. Eng. Geol. 2017, 226, 107–121. [Google Scholar] [CrossRef]
- Tang, Y.Q. Study on land subsidence under different plot ratios through centrifuge model test in soft-soil territory. Environ. Earth Sci. 2012, 66, 1809–1816. [Google Scholar] [CrossRef]
- Li, F.K.; Liu, G.; Tao, Q.; Zhai, M. Land subsidence prediction model based on its influencing factors and machine learning methods. Nat. Hazards 2023, 116, 3015–3041. [Google Scholar] [CrossRef]
- Budhu, M.; Adiyaman, I.B. Mechanics of land subsidence due to groundwater pumping. Int. J. Numer. Anal. Methods Geomech. 2010, 34, 1459–1478. [Google Scholar] [CrossRef]
- Cui, Z.; Jia, Y.; Yuan, L. Distribution law of soil deformation caused by decompression of confined water. Environ. Earth Sci. 2016, 75, 1281. [Google Scholar] [CrossRef]
- Walker, R.; Indraratna, B. Consolidation analysis of a stratified soil with vertical and horizontal drainage using the spectral method. Géotechnique 2009, 59, 439–449. [Google Scholar] [CrossRef]
- Shen, S.; Ma, L.; Xu, Y.; Yin, Z. Interpretation of increased deformation rate in aquifer IV due to groundwater pumping in Shanghai. Can. Geotech. J. 2013, 50, 1129–1142. [Google Scholar] [CrossRef]
- Cui, Z.; Li, Z.; Jia, Y. Model test study on the subsidence of high-rise building group due to variation of groundwater level. Nat. Hazards 2016, 84, 35–53. [Google Scholar] [CrossRef]
Disclaimer/Publisher’s Note: The statements, opinions and data contained in all publications are solely those of the individual author(s) and contributor(s) and not of MDPI and/or the editor(s). MDPI and/or the editor(s) disclaim responsibility for any injury to people or property resulting from any ideas, methods, instructions or products referred to in the content. |
© 2025 by the authors. Licensee MDPI, Basel, Switzerland. This article is an open access article distributed under the terms and conditions of the Creative Commons Attribution (CC BY) license (https://creativecommons.org/licenses/by/4.0/).