Abstract
The increasing variety in last-mile delivery demands requires diverse vehicle-drone collaboration models to meet various scenarios. Meanwhile, growing environmental concerns demand that we optimize not just delivery efficiency but also sustainability. This study thus proposes a unified multi-mode framework for collaborative multi-vehicle, multi-drone delivery networks to enable fair model comparisons. We introduce a hybrid metaheuristic algorithm combining NSGA-II and VND using specialized encoding and neighborhood structures to handle complex constraints, thereby comprehensively enhancing both efficiency and sustainability. Experiments on nine benchmark instances across three models reveal a nonlinear trade-off between efficiency and sustainability, with our migratory-relay model consistently outperforming others in terms of the Pareto front across multiple comparisons. Sensitivity analysis shows diminishing returns from adding more drones; while the first drone can cut emissions by up to 23.1%, additional drones bring progressively smaller reductions. These findings provide a strong framework and practical insights for designing sustainable urban logistics systems.
1. Introduction
The final stage of the supply chain, last-mile delivery, is widely recognized as a critical bottleneck, challenged by increasingly personalized customer demands, escalating operational costs, and high energy consumption. Amid rising energy prices and mounting pressure for sustainable practices, carbon emissions have evolved from a peripheral environmental concern into a core operational metric, on par with delivery efficiency []. In this context, the Vehicle Routing Problem with Drones (VRP-D) has garnered significant academic attention. Vehicle–drone collaboration promises to enhance operational flexibility and reduce the carbon footprint of last-mile logistics. However, this integration introduces coordination complexities that may offset anticipated efficiency gains, particularly in multi-vehicle, multi-drone systems.
Most existing studies focus on single-objective optimization. Yu et al. [] and De Bianco-Hokama et al. [] minimize delivery time using mixed-integer linear models, while others emphasize energy consumption [] or cost []. Although such works achieve notable improvements, they often neglect the interaction between operational and environmental objectives. Recent dual-objective approaches report simultaneous reductions in cost and emissions—for instance, Baldisseri et al. [] achieved 20–30% savings, and Meng et al. [] reported 20% File –25% reductions across metrics, yet few examine the non-linear trade-offs or diminishing returns underlying these results.
In terms of environmental modeling, most studies incorporate carbon emissions as an auxiliary measure rather than a central decision objective. Typical approaches estimate emissions using fixed or simplified coefficients, capturing overall tendencies but overlooking factors such as payload or flight conditions [,]. While such formulations are computationally tractable, they limit deeper comparative insights into how different collaboration structures affect sustainability outcomes. Early analyses (e.g., Stolaroff et al. []) have also suggested that load and range can significantly influence emission accuracy. Operationally, drone–truck coordination strategies remain fragmented. Existing models, ranging from single-drone systems [,] to multi-drone vehicles [,], lack a unified framework for comparative optimization.
From an algorithmic perspective, encoding design critically affects metaheuristic search performance. Common hierarchical or two-stage encodings require a pre-specified vehicle number, constraining solution diversity []. Likewise, “cluster-first, route-second” methods [] restrict drone flexibility by enforcing rigid delivery boundaries. These approaches, inherited from classical VRPs, often fail to capture the structural complexity of vehicle–drone collaboration. Designing an encoding scheme that balances representational richness and search efficiency remains an open methodological challenge.
In synthesizing the existing research, it is evident that while research on vehicle-drone delivery is maturing, several critical gaps remain which motivated this study. First, most existing studies focus on single economic or temporal objectives, leaving the trade-off between operational efficiency and environmental sustainability insufficiently explored. Second, although numerous drone coordination strategies have been proposed, they are rarely examined within a unified framework, hindering a consistent assessment of their performance under varying conditions. Finally, from a methodological perspective, more flexible solution representations are required to jointly address routing, scheduling, and mode-selection decisions in multi-objective VRP-D problems.
Thus, this paper makes the following contributions.
- 1.
- Unified Multi-mode Framework
To address the fragmented nature of prior studies that have focused on specific coordination modes or single-objective goals, we have developed a unified description framework. This framework integrates three representative coordination paradigms: anchor-chain, mothership-swarm, and migratory-relay. The unified structure facilitates consistent formulation and enables fair cross-model comparisons by establishing coordination flexibility. Furthermore, it reveals how flexibility influence both efficiency and sustainability.
- 2.
- Problem-Oriented Evolutionary Solver with Adaptive Neighborhoods
Recognizing that existing metaheuristic approaches often fail to capture the structural interdependence between vehicles and drones due to the complex constraints of the problem, we design a problem-oriented extension of NSGA-II that incorporates a Variable Neighborhood Descent (VND) module. The contribution lies in enabling efficient and feasible exploration of complex coordination patterns through specially designed encoding schemes and neighborhood structures, offering a versatile optimization tool applicable to diverse last-mile delivery contexts.
- 3.
- Systematic Evaluation of the Efficiency–Sustainability Trade-off
While most prior works report performance improvements in isolation, our study conducts a systematic multi-scenario analysis to reveal the intrinsic trade-off between operational efficiency and environmental impact. The proposed evaluation framework provides a systematic means to analyze the efficiency–sustainability relationship, advancing theoretical understanding of multi-objective trade-offs in collaborative logistics systems.
These contributions focus on addressing the following research questions (RQs) in the collaborative delivery of vehicles and drones:
RQ1: What is an effective approach for unifying different coordination modes in vehicle-drone delivery?
RQ2: How can the complex interdependencies between vehicles and drones be better addressed in optimization algorithms for delivery operations?
RQ3: What is the trade-off between efficiency and sustainability in vehicle-drone delivery?
The remainder of this paper is organized as follows. Section 2 reviews the relevant literature. Section 3 formulates the mathematical model. Section 4 details the proposed algorithmic framework. Section 5 presents the computational experiments and discusses the results. Finally, Section 6 concludes the study and suggests directions for future research.
2. Literature Review
Research on collaborative truck-drone delivery systems has grown substantially since the seminal work of Murray and Chu [], who first formalized the concept. They introduced two foundational problems: the Flying Sidekick Traveling Salesman Problem (FSTSP), featuring a single truck paired with a single drone, and the Parallel Drone Scheduling Traveling Salesman Problem (PDSTSP), where independent fleets of trucks and drones operate from a central depot. While groundbreaking, these initial models were limited to a single drone per truck and did not consider energy constraints. Subsequent work sought to address these limitations. Agatz et al. [] independently proposed the closely related Traveling Salesman Problem with Drone (TSP-D), which differed from the FSTSP in its drone launch-and-recovery mechanics and constrained drone operations by endurance range instead of flight time. They developed an Adaptive Large Neighborhood Search (ALNS) heuristic to find high-quality solutions. Building on this, Bouman et al. [] developed an exact dynamic programming algorithm, enabling the solution of larger instances to optimality. Further refining the model, Ha et al. [] introduced a TSP-D variant that incorporated waiting costs, proposing both exact methods and heuristics. Their GRASP heuristic demonstrated superior solution quality compared to earlier methods on instances with up to 100 customers, though it required greater computational effort.
Expanding beyond single-truck scenarios, Wang et al. [] introduced the more general Vehicle Routing Problem with Drones (VRP-D), which accommodates multiple trucks and drones. While their objective was to minimize completion time, the model did not account for drone range limitations. Schermer et al. [] addressed this gap by explicitly modeling finite drone endurance, proposing a two-phase heuristic that outperformed the baseline algorithms from Wang et al. []. In a similar vein, Poikonen et al. [] contributed by establishing worst-case performance bounds applicable to broader distance and cost metrics while also integrating battery lifetime and operational costs into their objective.
More recent research has focused on incorporating greater realism by adding complex operational constraints. For instance, some studies have tackled physical variabilities, such as variable drone speeds [] and stochastic travel times, with the latter being formulated as a Markov Decision Process and solved via reinforcement learning to manage high dimensionality []. In parallel, other work has sought to improve the tractability of these models, such as by introducing customer-based allocation rules to simplify the FSTSP formulation []. Further research has addressed scheduling complexities like time windows and traffic uncertainty, using advanced techniques like branch-and-price to outperform standard solvers []. The scope of operations has also been broadened to include simultaneous pickup-and-delivery tasks, sometimes in environments with no-fly zones []. Energy modeling has become more sophisticated, with considerations for drone hovering costs and battery replacement strategies []. Furthermore, researchers are beginning to tackle dynamic environments, such as those with real-time customer demands, using two-stage optimization models and novel metaheuristics [].
A review of optimization objectives in VRP-D studies shows that most research has concentrated on minimizing either operational cost [,,] or delivery completion time [,,]. Multi-objective formulations have also been proposed, typically addressing trade-offs between cost and time [] or between cost and customer service levels [,]. In addition, a growing body of work has begun to incorporate sustainability considerations. For instance, Zhang et al. [] analyzed vehicle energy consumption in collaborative delivery systems, while Ma et al. [] explored electric vehicle–drone coordination through neural architecture search. Other studies have integrated carbon-related parameters into VRP-D formulations [], extending the scope of optimization objectives beyond traditional economic and temporal dimensions.
Overall, the body of research on vehicle-drone delivery has progressively expanded in both scope and methodological sophistication. Early studies primarily addressed single-truck, single-drone scenarios with simplified assumptions, while subsequent work extended the problem to multi-vehicle, multi-drone systems, incorporating diverse operational constraints such as drone endurance, scheduling complexities, and dynamic travel conditions. More recent contributions have introduced advanced metaheuristics, exact algorithms, and multi-objective formulations to better capture the interplay between operational efficiency, service quality, and sustainability considerations. Collectively, these developments illustrate an evolving landscape in which both modeling realism and algorithmic capabilities continue to advance, providing a robust foundation for further exploration of coordinated multi-agent delivery systems.
3. Problem Definition and Mathematical Models
This section develops the formal mathematical framework for the dual-objective Vehicle Routing Problem with Drones (VRP-D), which is designed to formally represent and compare three distinct vehicle-drone coordination strategies: the Anchor-Chain, Mothership-Swarm, and the novel Migratory-Relay models. Within this comprehensive structure, the problem is modeled as a dual-objective optimization framework that jointly considers two competing perspectives—operational efficiency, represented by total completion time, and environmental sustainability, represented by total carbon emissions. This formalization provides a rigorous foundation for the hybrid algorithm developed in Section 4 and enables the systematic performance evaluation and sensitivity analyses conducted in Section 5.
3.1. Unified Multi-Mode Framework
We define three distinct vehicle-drone coordination models, each representing a different operational paradigm.
Mode I: Single-Drone Anchor-Chain Model
As shown in Figure 1a, this model represents a fundamental one-to-one collaboration between a truck and a drone. The truck acts as a mobile depot, or “anchor,” for the drone. After the truck departs from the depot, it can launch the drone at a specific customer location (a launch node). While the drone serves a sequence of nearby customers (its “chain”), the truck proceeds independently along its own route to serve other customers. The drone must later rendezvous with the truck at a downstream location (a recovery node) before the pair continues its operations.

Figure 1.
Schematic diagram of three models; (a) Schematic diagram of Single-Drone Anchor-Chain Model; (b) Schematic diagram of Mothership-Swarm Model; (c) Schematic diagram of Migratory Bird Relay Model.
Mode II: Mothership-Swarm Model
Illustrated in Figure 1b, this model scales up the collaboration to a one-to-many “mothership” paradigm. A single truck is equipped with a fleet, or “swarm”, of multiple drones. At a launch node, the truck can deploy several drones simultaneously. Each drone then operates independently to serve its own assigned set of customers before returning to the truck at a pre-determined recovery node.
Mode III: Migratory Bird Relay Model
This model, shown in Figure 1c, represents a many-to-many collaborative system involving multiple trucks, each equipped with a certain number of drones. As in the other models, a drone is launched from a “parent” truck. However, the key innovation of this “migratory” model is that it can rendezvous with and be recovered by any feasible truck in the fleet that is at a suitable location.
The core operational assumptions are as follows:
- Each truck begins and ends its route at the depot.
- Drones are carried by the trucks and can be launched and recovered at customer locations or the depot.
- A customer can be served by either a truck or a drone, but not both (exclusive service).
- All operations are subject to vehicle and drone payload capacities, energy/fuel limitations, and spatiotemporal synchronization for drone launch and recovery.
- Micro-operational factors such as drone landing area capacity, queuing and safety restrictions are not considered.
To structure the mathematical formulation, we group the constraints into seven logical categories: (1) customer-related, (2) truck-related, (3) drone-related, (4) truck-drone coordination, and (5) routing continuity constraints, (6) temporal feasibility and synchronization Constraints, (7) resource consumption constraints. The detailed formulation is presented next. The sets, constants, and variables utilized in the model are delineated in Table 1, Table 2 and Table 3, respectively.

Table 1.
Table of sets used.

Table 2.
Table of constants used.

Table 3.
Table of decision variables used.
- 1.
- customer-related constraints:
Constraint (1) ensures that each customer is served exactly once, either by a truck or by a drone.
- 2.
- truck-related constraints:
Constraints (2) and (3) guarantee that each truck follows a single closed route, departing from and returning to the depot. Constraint (4) enforces the payload capacity limit of each truck. Constraint (5) restricts the number of drones carried by a truck to its loading bay capacity.
- 3.
- drone-related constraints:
Constraint (6) ensures that the total payload assigned to each drone does not exceed its maximum carrying capacity. Constraint (7) requires that the energy consumed during a drone’s mission does not exceed its battery capacity.
- 4.
- truck–drone coordination constraints:
Constraint (8) enforces synchronization between trucks and drones, i.e., if a truck arrives at a customer before the assigned drone, it must wait for the drone (and vice versa). Constraints (9) and (10) stipulate that each drone’s launch and recovery points must coincide with truck service nodes.
- 5.
- Routing Continuity Constraints:
Constraints (11) and (12) require that after servicing a customer, each drone must depart from the customer location. Constraint (13) similarly requires that each truck must leave a customer location after completing service.
- 6.
- Temporal Feasibility and Synchronization Constraints:
Constraint (14) ensures temporal feasibility: the arrival time of a drone at customer must be no earlier than the arrival time at the previous customer plus the travel time between and .
- 7.
- Resource Consumption Constraints:
Constraint (15) models the reduction in a drone’s payload as deliveries are completed. Constraint (16) tracks the depletion of drone energy as packages are delivered. Constraint (17) stipulates that a truck can only launch a drone if at least one available drone is onboard.
The level of drone involvement can vary significantly depending on the operational model and the optimization objectives. To quantify the role of drones in the delivery process, we introduce the Drone Participation Ratio (DPR), which is defined as:
where if customer i is served by a drone and denotes the total number of customers.
A feasible solution to the VRP-D must simultaneously make several interdependent decisions. We identify seven principal degrees of freedom (DoF) that define the solution structure:
- Customer-to-Mode Assignment (DoF 1): Decide whether each customer is served by a truck or a drone.
- Truck Customer Assignment (DoF 2): Assign customers designated for truck delivery to specific truck routes.
- Truck Customer Sequencing (DoF 3): Determine the visit order for customers on each truck’s route.
- Drone Customer Assignment (DoF 4): Assign customers designated for drone delivery to a specific “parent” truck.
- Drone Sortie Grouping (DoF 5): Group drone-served customers into feasible delivery sorties (i.e., which customers are served together by one drone trip).
- Drone Customer Sequencing (DoF 6): Determine the visit order for customers within a single drone sortie.
- Drone Launch/Recovery Node Selection (DoF 7): Specify the truck route nodes from which each drone sortie is launched and at which it is recovered.
Coordination of the three modes can be achieved by constraining these seven DoFs, as detailed below: Mode I can be obtained by setting the value of DoF 5 to 1 and limiting the recovery nodes in DoF 7 to the launch vehicle only; Mode II can be derived from Mode I by lifting the restriction on DoF 5 being 1; Mode III can be obtained by simultaneously removing the constraints on DoFs 5 and 7. This approach thus enables unified modeling of the three modes with progressively increasing flexibility.
3.2. Objective Functions
To quantitatively capture the trade-off between efficiency and sustainability, the dual-objective optimization model defines two objective functions: minimizing total completion time and minimizing total carbon emissions.
- 1.
- minimizing the total completion time
The first objective is defined as minimizing the makespan of the entire delivery schedule. The makespan is the time when the last truck returns to the depot. The objective function is:
- 2.
- minimizing total carbon emissions
The second objective is to minimize the total carbon emissions generated by the truck and drone fleets. Truck and drone carbon emissions are computed from fuel and electricity consumption, respectively. Specifically, the carbon emission of a truck traveling along edge i,j is calculated as the product of the truck’s fuel consumption rate and the travel distance , further multiplied by the emission factor . For drones, the carbon emission is obtained by multiplying the drone’s power consumption by the travel time , and then scaling by the emission factor .
Accordingly, the objective function for minimizing carbon emissions can be expressed as follows:
For trucks, a load-sensitive fuel consumption model is adopted, where the fuel consumption rate is assumed to vary linearly with the carried load. Specifically, let the fuel consumption rate under a full load be , that under an empty load be , the maximum vehicle capacity be Q, and the actual carried load be . The fuel consumption rate can thus be represented as a linear function of the vehicle load.
For drones, recent studies on routing models in drone delivery problems (e.g., Cheng et al. []; Poikonen and Golden []) have incorporated more realistic energy consumption functions, which take into account aerodynamic drag, payload handling time, flight speed, and battery mass, among other factors. In particular, the energy consumption model proposed by Cheng et al. [] has been widely adopted, as it enables precise estimation of energy demand based on the drone’s real-time payload during flight. According to this model, energy consumption is directly related to the payload weight.
Specifically, let W denote the drone’s own weight, m the payload weight, g the gravitational constant, the air density, ζ the rotor disc area, and n the number of rotors. The parameters used are shown in Table 4.

Table 4.
Table of parameters used.
4. The Solution Process Based on the NSGA-II Algorithm Combined with Variable Neighbourhood Descent
To address the proposed dual-objective VRP-D, this study develops a hybrid metaheuristic that integrates the Non-Dominated Sorting Genetic Algorithm II (NSGA-II) with a Variable Neighborhood Descent (VND) procedure. Within this framework, the VND component fulfills two key roles:
- Exploitation: It intensifies the local search around promising solutions generated by NSGA-II, refining solution quality and accelerating convergence toward the Pareto front.
- Structural Refinement: It applies a set of tailored neighborhood operators that effectively handle the intricate constraints of vehicle–drone coordination—operations that conventional crossover and mutation cannot readily achieve.
By combining the global exploration capability of NSGA-II with the targeted local optimization of VND, the proposed hybrid framework enhances convergence quality and ensures a well-distributed set of Pareto-optimal solutions.
4.1. Encoding Scheme
To represent a solution, we propose a three-layer chromosome structure. This encoding scheme captures the essential assignment and sequencing decisions in a structure that facilitates effective crossover and mutation operations. The remaining, more complex degrees of freedom are handled by a deterministic decoding procedure and refined by the VND local search.
Layer 1: Customer Permutation (Integer String): A random permutation of all n customers. This layer primarily defines the overall sequence from which truck routes are built.
Layer 2: Service Mode (Binary String): A binary string of length n. A value of 1 at index i means the customer at that position in Layer 1 is served by a drone; 0 means service by a truck.
Layer 3: Route Partition (Binary String): A binary string of length n-1 used to partition the customer sequence from Layer 1 into separate truck routes. A 1 indicates that the current customer is the last in its route, thus creating a “split”.
Figure 2 illustrates the encoding–decoding correspondence using a simplified example with three vehicles and twelve customers. The decoding results produce unique vehicle and drone paths.

Figure 2.
Encoding and decoding diagram: (a) Schematic diagram of chromosome coding methods; (b) Schematic diagram of chromosome decoding method.
This coding method already encompasses DoFs 1–4, and 6. DoFs 5 and 7 need to be determined by further constructing the neighborhood structures for drone sortie grouping and drone recovery node relocation. Additionally, to further address the “lock-in” effect, the search range within the drone recovery node relocation neighborhood structure is expanded from the launch vehicle’s customer points to any vehicle’s customer points, thereby altering the decoded landing positions to enable cross-vehicle drone landings as described in Mode III.
4.2. Neighborhood Structures
After obtaining a feasible solution through chromosome decoding, the algorithm performs a more intensive local exploration via a Variable Neighborhood Descent procedure. A series of neighborhood operators are then applied to conduct structured local searches, each tailored to the specific constraints of different operational models. The specific neighborhood structure is as follows:
- Recovery Node Relocation
This operator aims to optimize the rendezvous point between a drone and its recovery truck. The specific search space depends on the operational mode and available drone resources, as summarized below.
Model I (Single-Drone Collaboration)
As shown in Figure 3, the relocation move simply reassigns the recovery node for one drone sortie. The candidate nodes are restricted to the segment of the truck route between the current launch point and the next launch node which ensures temporal feasibility and prevents route overlap.
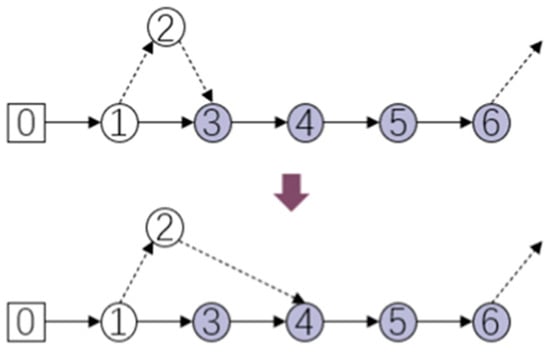
Figure 3.
Schematic diagram of drone collection point selection for model1.
Model II (Multi-Drone Collaboration)
As shown in Figure 4, when a truck has spare drones at the moment of recovery, the new recovery position of the active drone can be flexibly reassigned to any subsequent node along the same route. However, if the truck deploys its last available drone, the feasible set is restricted to the interval between the current launch node and the next task requiring a drone launch.

Figure 4.
Schematic diagram of drone collection point selection for model2; (a) The parent truck has a spare drone at launch; (b) The parent truck has no spare drones at launch.
As shown in Figure 5, this situation extends intra-route relocations by allowing a drone to be recovered by any feasible truck in the fleet. When spare drones exist, the recovery node may lie on either the same route or any other vehicle’s route. When the launching truck has no spare drone, the intra-route candidate set remains constrained, but inter-vehicle recovery is still permitted.
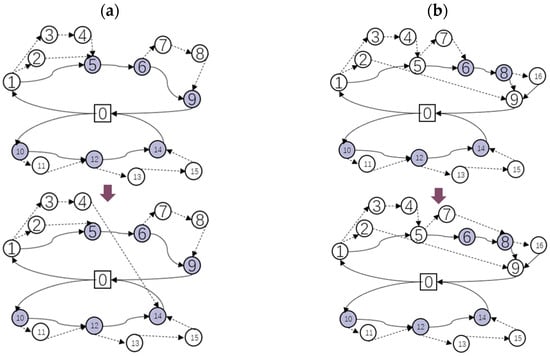
Figure 5.
Schematic diagram of drone collection point selection for model3; (a) The parent truck has a spare drone at launch; (b) The parent truck has no spare drones at launch.
- 2.
- Sortie Grouping
This operator applies only to multi-drone scenarios (Models II and III) and enhances parallelism by splitting long sorties into multiple shorter ones. As shown in Figure 6, when the truck possesses k drones at the launch node, a multi-customer sortie can be divided into up to k sub-sorties. Each sub-sortie shares the same launch and recovery nodes but serves a subset of customers.
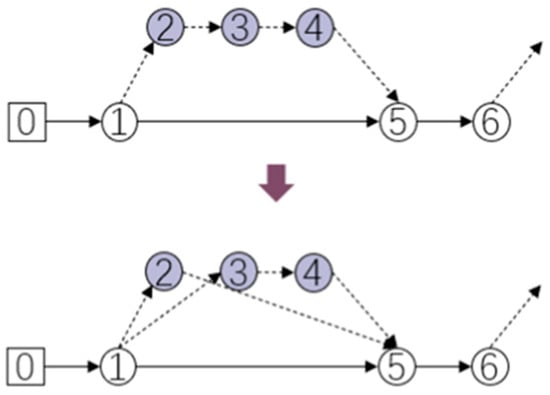
Figure 6.
Schematic diagram of drone path batching rules.
4.3. NSGA-II Framework with an Innovative Variable Neighborhood Mechanism
The local search component of our algorithm departs from a traditional Variable Neighborhood Descent (VND), where neighborhoods are explored sequentially and improvements are typically made on a single route at a time. Such a route-by-route approach is often myopic in a highly constrained system like the VRP-D, as a local improvement in one drone’s sortie can negatively impact the feasibility or performance of the overall solution.
To overcome this, we introduce a holistic neighborhood search procedure that is applied as an improvement step to each individual in the offspring population. Instead of accepting piecemeal changes, this strategy generates a single new candidate solution by applying all relevant neighborhood operators across all drone sorties at once. The entire modified solution is then evaluated as a whole. This integrated approach is designed to preserve the global coordination and structural integrity of the solution. The pseudo-code is shown in the table below (Algorithm 1).
| Algorithm 1. Pseudocode for the neighbourhood process. |
| function P = OverallNeighborhoodSearch(P, Mode, Params) |
| % Overall neighborhood search based on operation mode |
| switch Mode |
| case 1 % Single vehicle–single drone |
| P = RechooseRecovery(P, Params); |
| case {2,3} % Single vehicle–multi drone/Multi vehicle–multi drone |
| % Step 1. Split routes |
| SubRoutes = SplitRoute(P, Mode, Params); |
| % Step 2. Traverse subroutes and apply neighborhood operations |
| for r = 1:length(SubRoutes) |
| feasibledrones = CountAvailableDrones(SubRoutes{r}, Params); |
| if feasibledrones > 0 |
| SubRoutes{r} = RechooseRecovery(SubRoutes{r},Params, feasibleUAVs); |
| end |
| end |
| % Step 3. Merge updated subroutes |
| NewP = MergeSubRoutes(SubRoutes, Params); |
| % Step 4. Update solution if domination holds |
| if Dominates(NewP, P), P = NewP; end |
| end |
| end |
This entire procedure functions as a powerful local improvement mechanism that is embedded within the main NSGA-II framework. The complete algorithmic framework is illustrated in Figure 7.
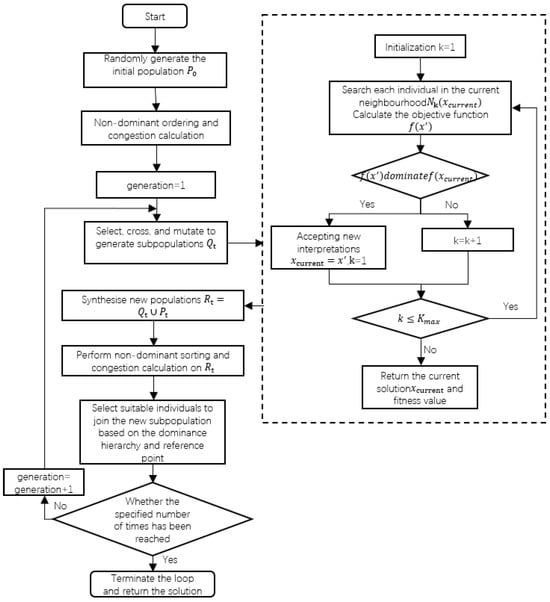
Figure 7.
Flowchart of the improved NSGA2 code with variable neighbourhood descent.
5. Experiments and Analyses
5.1. Dataset Instances
To evaluate the performance of the proposed model and algorithm, a set of nine benchmark instances was constructed, systematically varying along two dimensions: spatial distribution and problem scale.
The spatial layouts are derived from the well-known Solomon R1, C1, and RC1 benchmark sets for the VRP, producing three customer distribution patterns:
- Clustered (C-type): Customers grouped in distinct clusters.
- Random (R-type): Customers randomly distributed across the service area.
- Random–Clustered (RC-type): A hybrid pattern combining both clustered and random distributions.
For each distribution type, three instance sizes were generated to represent small (101:20 customers), medium (102:50 customers), and large (103:80 customers) problem scales.
To focus exclusively on the trade-offs introduced by vehicle–drone collaboration, time-window constraints from the original benchmarks were removed. Customer demands were also adjusted so that a subset of customers could be feasibly served by drones, while the remainder required truck delivery.
5.2. Parameter Settings
The parameters of the proposed hybrid metaheuristic were calibrated based on established evolutionary computation principles and preliminary experiments to ensure convergence stability and Pareto diversity.
Population size and generation count were scaled with instance size: 100 individuals for 1000 generations (20 customers), 150 for 2000 generations (50 customers), and 200 for 2000 generations (80 customers).
Crossover and mutation probabilities were adaptively controlled within [0.6, 0.95] and [0.05, 0.3], respectively, to balance global exploration and local exploitation during different search phases.
The Variable Neighborhood Descent (VND) procedure was limited to 100 iterations and terminated after 20 consecutive non-improving steps.
5.3. Algorithm Performance and Effectiveness Verification
To verify the overall performance and robustness of the proposed hybrid solver (H-NSGA-II), a series of comparative experiments were conducted under three collaborative models. For each mode, three datasets of increasing scale (small, medium, and large) were employed to assess the algorithm’s solution quality across different problem sizes. The proposed H-NSGA-II was compared with representative literature corresponding to the conventional optimization paradigm for that coordination type:
Mode I: Standard NSGA-II (without the proposed variable neighborhood descent, VND).
Mode II: A conventional Two-Stage heuristic (routing + scheduling decomposition) [].
Mode III: The adaptive large neighborhood search (ALNS) widely used in multi-vehicle routing problems [].
Each experiment was independently repeated 20 times to mitigate randomness, and three key performance indicators were recorded:
- Feasible solution ratio (%), measuring the robustness of constraint handling.
- Spacing metric (SP), reflecting solution uniformity and diversity along the Pareto front.
- Average hypervolume (HV), quantifying the overall quality and coverage of the obtained Pareto front. The results are summarized in Table 5.
 Table 5. Table of algorithm comparison experiment results.
The experimental results across all three coordination models and dataset scales demonstrate the superior performance of H-NSGA-II compared to the respective baselines. Across small, medium, and large instances, H-NSGA-II consistently achieves higher feasible solution rates, smaller SP values, and larger hypervolume (HV) indicators. This indicates that the integration of the VND module substantially improves convergence precision and Pareto front uniformity, particularly as problem dimensionality and vehicle–drone coupling constraints increase. Notably, in high-complexity scenarios such as Model III, traditional heuristics like ALNS fail to produce sufficient feasible solutions, whereas H-NSGA-II maintains both high feasibility and diversity. These findings collectively demonstrate that H-NSGA-II provides a reliable and generalizable solution framework for multi-vehicle, multi-drone coordination problems across diverse operational scenarios.
5.4. Objective Conflict Analysis
To gain deeper insights into the interplay and potential conflicts between the two optimization objectives—maximum completion time and carbon emission—this study first conducts conflict relationship analysis experiments. Taking the single-truck chained model as an example, a weighted single-objective function is constructed to integrate the two objectives into a unified indicator. A weight coefficient α is introduced to reflect preferences toward either completion time or carbon emissions. The weighted objective function is defined as:
In this formulation, T and C denote the completion time and carbon emissions, respectively, while Tref and Cref represent the best single-objective values obtained from the three models, serving as normalization references. Subsequently, eleven equally spaced values of α ∈ [0, 1] (i.e., 0, 0.1, …, 1.0) are selected. For each weight setting, the optimization is performed, and the resulting objective values are recorded. This process yields a series of solutions under different preference weights, which collectively form the time–emissions trade-off curve.
Figure 8 plots the trade-off frontier for instance C101. In the low-α region (emission-oriented preference), the frontier is relatively flat, indicating a zone of easy gains where notable time reductions incur minimal additional emissions. Conversely, in the high-α region (time-oriented preference), the curve steepens sharply, forming a zone of diminishing returns where further time savings demand disproportionately higher emissions.
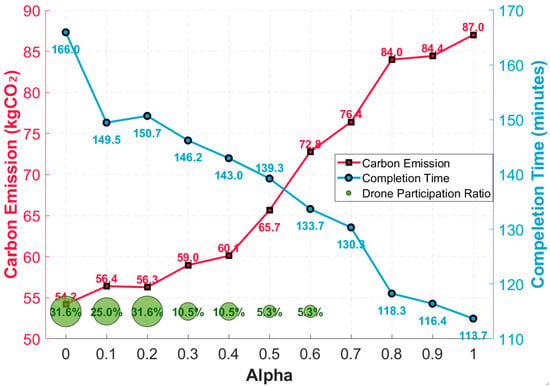
Figure 8.
Carbon emissions, completion time, and drone participation under different Alphas.
Bubble size denotes the Drone Participation Ratio (DPR), which decreases from 31.6% in the emission-optimal solution (α = 0) to 5.3% in the time-optimal one (α = 1). The balanced region (α ≈ 0.4–0.6) corresponds to moderate DPR values (5–10%), suggesting that optimal performance arises from judicious drone utilization rather than maximal deployment.
5.5. Statistical Superiority Analysis on Combined Pareto Front
Following the conflict analysis, this section evaluates the overall performance of the three proposed operational models. The H-NSGA-II algorithm was applied to all three models across nine benchmark instances, generating 27 distinct Pareto-optimal fronts. To compare the models’ performance under the dual-objective framework, we use the merged Pareto front analysis method. This method constructs a global Pareto front by consolidating all non-dominated solutions from the three models across all test instances, allowing for a comprehensive evaluation of each model’s solution quality on a global scale.
Specifically, we calculate the Global Non-dominated Solutions Ratio (GNSR), defined as:
where denotes the number of solutions from Model m that are included in the global merged Pareto front. represents the total number of Pareto solutions generated by Model m.
As evidenced in Table 6, the Migratory Relay Model (Model III) demonstrates unequivocal dominance, with an average GNSR of 77.2% across all benchmark instances. This indicates that more than two-thirds of its generated solutions belong to the global non-dominated set—significantly outperforming both the Mothership-Swarm (48.4%) and Anchor-Chain (21.3%) models. The consistency of this advantage across all nine test instances provides compelling evidence that Model III’s superior performance in simultaneously optimizing both completion time and carbon emissions. These findings establish a theoretical foundation for the practical compromise solutions analyzed in the subsequent section.

Table 6.
Global Non-dominated Solution Ratio (GNSR) Analysis.
5.6. Multi-Objective Optimization Results Analysis
Building upon the preceding analysis of solution set composition, we now shift focus to the practical task of selecting specific operational plans. To enable a rigorous comparison, a single, well-balanced compromise solution was identified from each front using the Technique for Order Preference by Similarity to Ideal Solution (TOPSIS). As Figure 9 illustrates, TOPSIS selects the solution on the Pareto frontier that is closest to the ideal point (representing the best possible time and emission values) and farthest from the negative-ideal point. This process yields a representative performance vector—comprising completion time, carbon emission, and drone participation ratio—for each model on each instance, with the resulting best-compromise solutions summarized in Table 7.
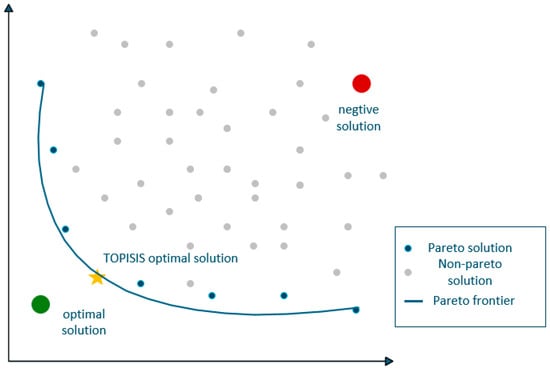
Figure 9.
Pareto Frontier and TOPSIS Selection Diagram.

Table 7.
Performance of different models on different datasets.
Given the substantial variation in magnitude of completion time and carbon emissions across datasets, a direct comparison of their raw values is not feasible. Therefore, a unified multi-criteria ranking framework leveraging normalization and weighted aggregation was adopted for a fair model evaluation.
First, for both performance indicators—completion time (T) and carbon emissions (C), the global minimum and maximum values across all models and datasets were determined to provide a common comparison basis. Each indicator was then normalized to the interval [0, 1] using a standard min–max transformation. The two normalized indicators were then combined through a weighted sum to produce a composite score:
where and represent the relative importance of operational efficiency and environmental sustainability, respectively.
To ensure robustness, several configurations were tested (Table 8), including two normalization methods (Min–Max, IQR-based), two weight settings (0.3:0.7 and 0.7:0.3), and an alternative ranking criterion (PROMETHEE II) that evaluates each dataset independently via net-flow scores (ϕ).

Table 8.
Comprehensive performance and ranking table of three models under different evaluation methods.
The summarized results in Table 8 confirm that across all normalization, weighting, and ranking configurations, the results remained consistent: Model 3 (Migratory Relay) > Model 2 (Mothership-Swarm) > Model 1 (Anchor-Chain). The corresponding visualization in Figure 10 further illustrates this pattern: Model 3 achieves the top rank in five out of nine datasets, showing clear dominance in both completion time and emission.
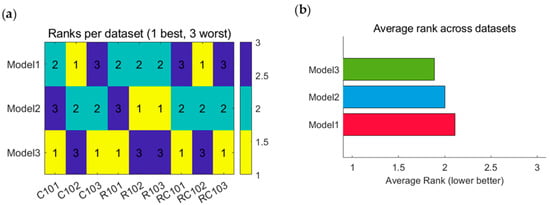
Figure 10.
Performance of different models across various datasets (Taking the benchmarking method as an example.); (a) Hot map of model ranks under different datasets; (b) Average rank across datasets.
A deeper understanding of these performance differences is obtained through an additional analysis of the Drone Participation Ratio (DPR). Specifically, box plots are used to compare the distribution of DPR values across the three models, while scatter plots with linear regression examine the correlation between DPR and the Composite Score. As illustrated in Figure 11, this analysis reveals whether the models inherently encourage different levels of drone utilization and clarifies how the degree of drone participation influences overall solution quality.
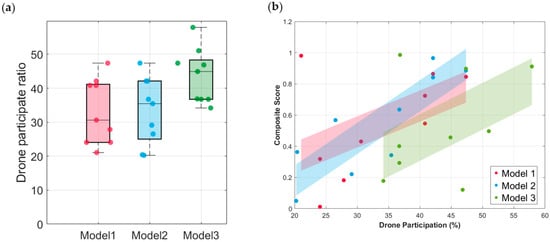
Figure 11.
Performance of different models; (a) Box plot of drone participation rates for different models; (b) Drone participation vs. composite score.
Figure 11a shows distinct differences among the three models in drone utilization. Model 3 exhibits the highest median DPR, indicating both greater and more flexible drone usage. Model 1 shows the lowest and most stable DPR due to its single-drone constraint, while Model 2 lies between the two, with moderate but reliance on drones. Figure 11b plots DPR against the composite performance score, revealing a clear positive correlation: solutions that successfully incorporate a higher proportion of drone deliveries tend to achieve a better overall balance between time and emissions. Contrary to the expected “inverted U-shaped” trend, performance did not decline at high DPR levels. This suggests that, within the tested problem scales, coordination complexity has not yet offset the benefits of extensive drone usage. The threshold at which diminishing returns emerge likely occurs only in larger or denser networks, which merits further investigation.
5.7. Sensitivity Analysis of Drone Fleet Size
The preceding experiments compared the models under a fixed drone fleet size. However, in practice, the number of drones is a critical and flexible operational parameter. To assess how the number of available drones per truck affects system performance, we conduct a sensitivity analysis to systematically investigate how the number of available drones per truck impacts system performance. This analysis is based on Model 2 (Mothership-Swarm), which represents a classical and widely studied vehicle-drone coordination framework.
For large-scale instances, we tested d = {0, 1, 2}. For small-scale instances, we extended the analysis to include d = 3. To quantify the incremental benefit of each additional drone, we define the Marginal Improvement Rate for completion time (ΔT) and carbon emissions (ΔC) as follows:
The impact of the drone fleet size is evaluated from two complementary perspectives to provide a holistic view:
- Impact on the Best-Compromise Solution (Small-Scale): For small-scale instances, where a single operational plan is often desired, we use TOPSIS to select the best-compromise solution from the Pareto front for each value of d. We then track the trajectory of this single point’s performance as the drone fleet grows.
- Impact on the Pareto Frontier (Large-Scale): For large-scale instances, a more strategic perspective is adopted. We analyze the shift of the entire Pareto front, particularly the improvements at the extreme points (the absolute minimum time and minimum emissions) as d increases.
Figure 12 presents the results of the sensitivity analysis on the TOPSIS-selected compromise solutions. For carbon emissions, increasing the number of drones (d) consistently improves environmental performance, though with diminishing marginal returns. The largest reduction is achieved when introducing the first drone (e.g., in instance R101, emissions decrease by 31 kg or 23%), with subsequent drones contributing smaller gains. In contrast, the impact on completion time is more complex and non-monotonic. In some cases (e.g., R101), adding drones slightly increases completion time. This occurs because a larger drone fleet expands the Pareto front, introducing new, more environmentally efficient solutions that may entail a marginally longer delivery time. The TOPSIS method, in seeking a balanced compromise, consequently selects points that favor these greater emissions savings at a slight temporal cost.

Figure 12.
Bar chart for dual-objective sensitivity analysis of model 2; (a) changes in completion time of TOPSIS solution with the number of drones; (b) changes in carbon emission of TOPSIS solution with the number of drones.
In summary, expanding the drone fleet primarily enhances environmental performance while its effect on delivery time is secondary and contingent on the specific trade-offs embodied in the selected solution.
Figure 13 illustrates the phenomenon of diminishing marginal returns in both minimum completion time and carbon emissions as the drone fleet size increases. The most substantial gains for both objectives are achieved when introducing the first drone (from d = 0 to d = 1), with emission reductions of up to 23% and time savings exceeding 8%. In contrast, adding a second drone (d = 1 to d = 2) yields markedly smaller improvements, typically below 3%. This pattern confirms that the core operational benefits are captured with the initial deployment.
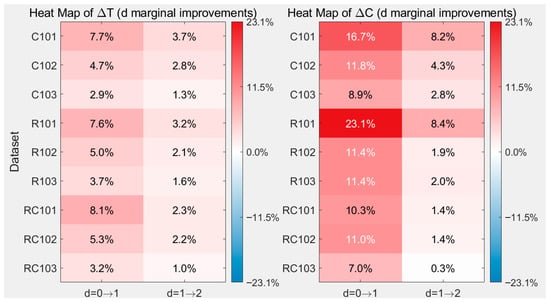
Figure 13.
Marginal benefit heatmap of optimal solutions for individual targets.
Furthermore, the heatmap’s color gradients reveal that the diminishing-return effect is more pronounced in large-scale instances, highlighting the influence of the size problem on the effectiveness of additional drone resources. These patterns provide a quantitative basis for understanding the relationship between fleet size and performance, informing discussions on resource allocation strategies.
6. Conclusions
This study addressed the critical challenge of balancing operational efficiency and environmental sustainability in last-mile logistics by developing a novel, unified a multi-mode framework for collaborative multi-truck, multi-drone delivery systems. Our work was guided by three core research questions concerning the modeling of distinct coordination strategies, the design of an efficient solution approach, and the analysis of the efficiency–sustainability trade-off. Through a comprehensive experimental analysis using nine benchmark instances, we arrive at the following key conclusions, which collectively affirm the consistency of our results with the stated objectives.
First, regarding the fundamental trade-off, our experiments confirm that the trade-off curve between total completion time (makespan) and total carbon emissions exhibits a distinct non-linear, convex shape, revealing a “Zone of Easy Gains” where significant time savings can be achieved with minimal emission penalties, and a “Zone of Diminishing Returns” where further time compression becomes extremely carbon-intensive.
Second, the Migratory Bird Relay Model (Mode III) consistently demonstrated superior performance in jointly minimizing completion time and carbon emissions, as evidenced by its dominance of the combined Pareto front where it contributed an average of 77.2% of the globally non-dominated solutions. This inherent advantage in solution quality is directly reflected in practical decision-making, where Model III also yielded the best-compromise solution in the majority of instances according to TOPSIS analysis and multiple comparisons. This robust and balanced performance across diverse scenarios confirms the decisive advantage of coordination flexibility, enabling an effective trade-off between operational efficiency and environmental sustainability.
Third, the role of drones is pivotal, quantified by the Drone Participation Ratio (DPR). We observed a strong positive correlation between higher DPR and a better composite performance score, indicating that effective drone integration is key to balancing the two objectives. Model III naturally facilitated this by achieving the highest median DPR. Furthermore, a crucial practical finding from our sensitivity analysis is the law of diminishing marginal returns for drone fleet size. The first drone per truck yields the most substantial improvements, while the marginal benefit of adding subsequent drones decreases rapidly.
Despite these encouraging findings, several limitations warrant further investigation. The current models assume static conditions, homogeneous fleets, and complete information. Future research should extend this framework to incorporate dynamic elements like real-time traffic and customer demands, heterogeneous vehicle and drone capabilities, and more complex urban environments. Investigating the tipping point where drone coordination complexity begins to outweigh its benefits in mega-scale scenarios also presents a compelling direction for further work.
Author Contributions
Conceptualization, Y.C. and W.S.; methodology, Y.C.; software, W.S.; validation, Y.C., W.S. and W.Y.; formal analysis, Y.C.; investigation, W.S.; resources, Y.C.; data curation, W.S.; writing—original draft preparation, W.S.; writing—review and editing, Y.C.; visualization, W.S.; supervision, W.Y.; project administration, W.Y. All authors have read and agreed to the published version of the manuscript.
Funding
This research received no external funding.
Data Availability Statement
The instance dataset presented in the study is included in the article. The benchmark problem datasets presented in the study are openly available at https://gitcode.com/open-source-toolkit/ca894/ (accessed on 17 September 2025).
Conflicts of Interest
The authors declare no conflict of interest.
Abbreviations
The following abbreviations are used in this manuscript:
| VRP-D | Vehicle Routing Problem with Drones |
| DPR | Drone Participation Ratio |
| VND | Variable Neighborhood Descent |
| NSGA | Non-Dominated Sorting Genetic Algorithm |
| TOPSIS | Technique for Order Preference by Similarity to Ideal Solution |
| FSTSP | Flying Sidekick Traveling Salesman Problem |
| GNSR | Global Non-dominated Solutions Ratio |
References
- Tran, T.P.A.; Gavade, S.A. Evaluating sustainable last mile delivery solutions: A multi-criteria decision analysis. J. Supply Chain Manag. Sci. 2025, 6. [Google Scholar] [CrossRef]
- Yu, V.F.; Lin, S.-W.; Jodiawan, P.; Lai, Y.-C. Solving the flying sidekick traveling salesman problem by a simulated annealing heuristic. Mathematics 2023, 11, 4305. [Google Scholar] [CrossRef]
- Hokama, P.H.D.B.; Lintzmayer, C.N.; San Felice, M.C. A faster heuristic for the traveling salesman problem with drone. Optim. Lett. 2025, 19, 771–791. [Google Scholar] [CrossRef]
- Guo, J.; Song, R.; He, S. Vehicle and onboard UAV collaborative delivery route planning: Considering energy function with wind and payload. J. Syst. Eng. Electron. 2025, 36, 194–208. [Google Scholar] [CrossRef]
- Gacal, J.; Urera, M.; Cruz, D.E. Flying sidekick traveling salesman problem with pick-up and delivery and drone energy optimization. In Proceedings of the 2020 IEEE International Conference on Industrial Engineering and Engineering Management (IEEM), Singapore, 14–17 December 2020; pp. 1167–1171. [Google Scholar]
- Baldisseri, A.; Siragusa, C.; Seghezzi, A.; Mangiaracina, R.; Tumino, A. Truck-based drone delivery system: An economic and environmental assessment. Transp. Res. Part D Transp. Environ. 2022, 107, 103296. [Google Scholar] [CrossRef]
- Meng, Z.; Zhou, Y.; Li, E.Y.; Peng, X.; Qiu, R. Environmental and economic impacts of drone-assisted truck delivery under the carbon market price. J. Clean. Prod. 2023, 401, 136758. [Google Scholar] [CrossRef]
- Xiao, Q.; Gao, J. The Multi-Visit Vehicle Routing Problem with Drones under Carbon Trading Mechanism. Sustainability 2024, 16, 6145. [Google Scholar] [CrossRef]
- Zhu, L.; Wang, T.; Ma, X.; Yang, L.; Lou, X. Route optimization of green truck-drone collaborative delivery with multiple drops considering demand distribution. Int. J. Sustain. Transp. 2025, 19, 854–862. [Google Scholar] [CrossRef]
- Stolaroff, J.K.; Samaras, C.; O’Neill, E.R.; Lubers, A.; Mitchell, A.S.; Ceperley, D. Energy use and life cycle greenhouse gas emissions of drones for commercial package delivery. Nat. Commun. 2018, 9, 409. [Google Scholar] [CrossRef]
- Lu, Y.; Yang, C.; Yang, J. A multi-objective humanitarian pickup and delivery vehicle routing problem with drones. Ann. Oper. Res. 2022, 319, 291–353. [Google Scholar] [CrossRef]
- Freitas, J.C.; Penna, P.H.V.; Toffolo, T.A. Exact and heuristic approaches to drone delivery problems. arXiv 2021, arXiv:2108.01996. [Google Scholar] [CrossRef]
- Wu, G.; Mao, N.; Luo, Q.; Xu, B.; Shi, J.; Suganthan, P.N. Collaborative truck-drone routing for contactless parcel delivery during the epidemic. IEEE Trans. Intell. Transp. Syst. 2022, 23, 25077–25091. [Google Scholar] [CrossRef]
- Jeong, H.Y.; Lee, S. Drone routing problem with truck: Optimization and quantitative analysis. Expert Syst. Appl. 2023, 227, 120260. [Google Scholar] [CrossRef]
- Luo, Q.; Wu, G.; Ji, B.; Wang, L.; Suganthan, P.N. Hybrid multi-objective optimization approach with pareto local search for collaborative truck-drone routing problems considering flexible time windows. IEEE Trans. Intell. Transp. Syst. 2021, 23, 13011–13025. [Google Scholar] [CrossRef]
- Arishi, A.; Krishnan, K.; Arishi, M. Machine learning approach for truck-drones based last-mile delivery in the era of industry 4.0. Eng. Appl. Artif. Intell. 2022, 116, 105439. [Google Scholar] [CrossRef]
- Murray, C.C.; Chu, A.G. The flying sidekick traveling salesman problem: Optimization of drone-assisted parcel delivery. Transp. Res. Part C-Emerg. Technol. 2015, 54, 86–109. [Google Scholar] [CrossRef]
- Agatz, N.; Bouman, P.; Schmidt, M. Optimization approaches for the traveling salesman problem with drone. Transp. Sci. 2018, 52, 965–981. [Google Scholar] [CrossRef]
- Bouman, P.; Agatz, N.; Schmidt, M. Dynamic programming approaches for the traveling salesman problem with drone. Networks 2018, 72, 528–542. [Google Scholar] [CrossRef]
- Quang Minh, H.; Deville, Y.; Quang Dung, P.; Minh Hoang, H. On the min-cost Traveling Salesman Problem with Drone. Transp. Res. PART C Emerg. Technol. 2018, 86, 597–621. [Google Scholar]
- Wang, X.; Poikonen, S.; Golden, B. The Vehicle Routing Problem with Drones: Several Worst-Case Results. Optim. Lett. 2017, 11, 679–697. [Google Scholar] [CrossRef]
- Schermer, D.; Moeini, M.; Wendt, O. A matheuristic for the vehicle routing problem with drones and its variants. Transp. Res. Part C Emerg. Technol. 2019, 106, 166–204. [Google Scholar] [CrossRef]
- Poikonen, S.; Wang, X.; Golden, B. The vehicle routing problem with drones: Extended models and connections. Networks 2017, 70, 34–43. [Google Scholar] [CrossRef]
- Michelotto, F. An Exact and Heuristic Approach for the Traveling Salesman Problem with Drone and Variable Drone Speeds Selection. Available online: https://thesis.unipd.it/handle/20.500.12608/36505 (accessed on 19 September 2025).
- Liu, Z.; Li, X.; Khojandi, A. The flying sidekick traveling salesman problem with stochastic travel time: A reinforcement learning approach. Transp. Res. Part E Logist. Transp. Rev. 2022, 164, 102816. [Google Scholar] [CrossRef]
- Boccia, M.; Mancuso, A.; Masone, A.; Sterle, C. A feature based solution approach for the flying sidekick traveling salesman problem. In Proceedings of the International Conference on Mathematical Optimization Theory and Operations Research, Novosibirsk, Russia, 6–10 July 2021; pp. 131–146. [Google Scholar]
- Joo, J.; Lee, C. An Exact Algorithm for Robust Drone-Vehicle Routing Problem with Time Windows. Korean Inst. Ind. Eng. 2023, 2023, 939–983. [Google Scholar]
- Liu, Y.-Q.; Han, J.; Zhang, Y.; Li, Y.; Jiang, T. Multivisit drone-Vehicle Routing Problem with Simultaneous Pickup and Delivery Considering No-Fly Zones. Discret. Dyn. Nat. Soc. 2023, 2023, 1183764. [Google Scholar] [CrossRef]
- Han, J.; Liu, Y.; Li, Y. Vehicle routing problem with drones considering time windows and dynamic demand. Appl. Sci. 2023, 13, 13086. [Google Scholar] [CrossRef]
- Kuroswiski, A.R.; Pires, H.B.; Passaro, A.; Frutuoso, L.N.; Senne, E.L.F. Hybrid genetic algorithm and mixed integer linear programming for flying sidekick tsp. arXiv 2023, arXiv:2304.13832. [Google Scholar] [CrossRef]
- Dukkanci, O.; Kara, B.Y.; Bektas, T. The drone delivery problem. SSRN Electron. J. 2019, 10. [Google Scholar] [CrossRef]
- Madani, B.; Ndiaye, M. Traveling salesman problem with a moving depot: A mathematical formulation and a saving-based algorithm. In Proceedings of the AIP Conference Proceedings, Crete, Greece, 24–27 September 2024; p. 090010. [Google Scholar]
- Mao, N.; Wu, G.; Luo, Q.; Shi, J. A Variable Neighborhood Descent Method for Cooperative Delivery Routing Problem of Trucks and Drones. In Proceedings of the International Conference on Autonomous Unmanned Systems, Guangzhou, China, 6–8 December 2021; pp. 1537–1546. [Google Scholar]
- Lei, D.; Chen, X. An improved variable neighborhood search for parallel drone scheduling traveling salesman problem. Appl. Soft Comput. 2022, 127, 109416. [Google Scholar] [CrossRef]
- Mara, S.T.W.; Elsayed, S.; Essam, D.; Sarker, R. Vehicle routing problem for an integrated electric vehicles and drones system. In Proceedings of the International Conference on Intelligent Transport Systems, Lisbon, Portugal, 15–16 December 2022; pp. 197–214. [Google Scholar]
- Wang, K.; Yuan, B.; Zhao, M.; Lu, Y. Cooperative route planning for the drone and truck in delivery services: A bi-objective optimisation approach. J. Oper. Res. Soc. 2020, 71, 1657–1674. [Google Scholar] [CrossRef]
- Das, D.N.; Sewani, R.; Wang, J.; Tiwari, M.K. Synchronized truck and drone routing in package delivery logistics. IEEE Trans. Intell. Transp. Syst. 2020, 22, 5772–5782. [Google Scholar] [CrossRef]
- Zhang, S.; Liu, S.; Xu, W.; Wang, W. A novel multi-objective optimization model for the vehicle routing problem with drone delivery and dynamic flight endurance. Comput. Ind. Eng. 2022, 173, 108679. [Google Scholar] [CrossRef]
- Ma, J.; Ma, X.; Li, C.; Li, T. Vehicle-drone collaborative distribution path planning based on neural architecture search under the influence of carbon emissions. Discov. Comput. 2024, 27, 42. [Google Scholar] [CrossRef]
- Kuo, R.; Edbert, E.; Zulvia, F.E.; Lu, S.-H. Applying NSGA-II to vehicle routing problem with drones considering makespan and carbon emission. Expert Syst. Appl. 2023, 221, 119777. [Google Scholar] [CrossRef]
- Cheng, C.; Adulyasak, Y.; Rousseau, L.-M. Drone routing with energy function: Formulation and exact algorithm. Transp. Res. Part B Methodol. 2020, 139, 364–387. [Google Scholar] [CrossRef]
- Poikonen, S.; Golden, B. Multi-visit drone routing problem. Comput. Oper. Res. 2020, 113, 104802. [Google Scholar] [CrossRef]
- Windras Mara, S.T.; Rifai, A.P.; Sopha, B.M. An adaptive large neighborhood search heuristic for the flying sidekick traveling salesman problem with multiple drops. Expert Syst. Appl. 2022, 205, 117647. [Google Scholar] [CrossRef]
Disclaimer/Publisher’s Note: The statements, opinions and data contained in all publications are solely those of the individual author(s) and contributor(s) and not of MDPI and/or the editor(s). MDPI and/or the editor(s) disclaim responsibility for any injury to people or property resulting from any ideas, methods, instructions or products referred to in the content. |
© 2025 by the authors. Licensee MDPI, Basel, Switzerland. This article is an open access article distributed under the terms and conditions of the Creative Commons Attribution (CC BY) license (https://creativecommons.org/licenses/by/4.0/).