Article

Analysis of Factors Influencing Skin Factor in Conventional Perforation Completion and Prediction Model Research

1
Fourth Gas Production Plant, Yanchang Gas Field, Shaanxi Yanchang Petroleum (Group) Co., Ltd., Yan’an 716000, China
2
Shaanxi Provincial Key Laboratory of Oil and Gas Well and Reservoir Seepage Mechanics & Rock Mechanics, Xi’an Shiyou University, Xi’an 710065, China
3
Qingdao Jerry Industrial Control Technology Co., Ltd., Qingdao 266000, China
*
Author to whom correspondence should be addressed.
Appl. Sci. 2025, 15(23), 12616; https://doi.org/10.3390/app152312616 (registering DOI)
Submission received: 31 August 2025 / Revised: 21 September 2025 / Accepted: 29 October 2025 / Published: 28 November 2025

Abstract

Perforation completion is one of the primary methods for putting oil and gas wells into production, and the influencing factors and prediction of perforation skin factors have long been key research topics in the petroleum industry. This study systematically investigates the effects of multiple factors (including perforation depth, phase angle, shot density, hole diameter, damage zone depth, and damage severity) on the perforation skin factor in both low-permeability and medium-to-high-permeability reservoirs. The research first established a coupled flow model for conventional perforation completion using ANSYS Fluent 2024R1 numerical simulation software, which integrates perforation geometric parameters and formation damage-related parameters; then, conducting single-factor sensitivity analysis to obtain qualitative relationships between individual perforation parameters and well skin factor; it subsequently uses orthogonal experimental design to explore multi-factor combined effects and applied gray correlation theory to calculate factor-skin factor correlation coefficients; finally, it adopts the least squares method for linear and nonlinear fitting based on orthogonal experimental data (with linear fitting average error of 45.3% and nonlinear fitting error of 7.4%, thus selecting the nonlinear formula as the prediction model). The findings provide valuable insights for optimizing perforation parameters and predicting well skin factors under different reservoir conditions.

1. Introduction

Perforation completion is one of the most critical well completion methods for oil and gas production, as the effectiveness of perforation directly determines well integrity and further governs the efficiency of fluid flow from reservoirs to wellbores. However, the success of perforation completion is inherently dependent on the quality of prior wellbore drilling—wellbore drilling methods lay the foundational conditions for subsequent perforation operations, and “good wellbore drilling” (characterized by stable wellbore walls, minimal formation damage, and accurate well trajectory) is a prerequisite for optimizing perforation performance and ensuring reservoir productivity.
Currently, three mainstream wellbore drilling methods dominate the petroleum industry. Rotary drilling is the most widely applied approach, relying on drill bit rotation to break rock while circulating drilling fluid to clean the wellbore, cool the drill bit, and support the well wall; it adapts to most conventional reservoir lithologies and burial depths, providing a basic and reliable wellbore structure for perforation. Directional drilling uses downhole steering tools and real-time trajectory measurement systems to precisely control the wellbore path, enabling access to scattered, thin-layered, or horizontally distributed target reservoirs. This method ensures the wellbore passes through high-quality reservoir intervals, which is critical for subsequent perforation to effectively connect with productive zones and avoid invalid perforation in non-reservoir layers. Underbalanced drilling maintains wellbore pressure lower than reservoir pressure during drilling, reducing the invasion of drilling fluid and its solid phases into the formation. It is particularly suitable for low-permeability reservoirs, as it minimizes damage to the near-wellbore zone and preserves the original permeability of the reservoir—creating favorable conditions for fluid flow after perforation by reducing the baseline flow resistance that perforation needs to overcome. The selection of these drilling methods is determined by reservoir characteristics such as permeability, lithology, and distribution, and their implementation quality directly affects the initial state of the near-wellbore region (e.g., damage extent, wellbore geometry regularity), thereby influencing the calculation and optimization of the subsequent perforation skin factor.
The perforation skin factor, a key metric quantifying the additional flow resistance in the near-wellbore region induced by perforation operations and residual formation damage from drilling, has long been a core focus of research in the petroleum engineering field. Accurate prediction of this factor is essential for optimizing perforation schemes and maximizing well productivity. Globally, extensive efforts have been devoted to developing methodologies for perforation skin factor prediction, which can be broadly categorized into four types: analytical models, semi-analytical models, numerical models, and laboratory-based electrical analogy experiments.
The theoretical groundwork for perforation skin factor analysis was laid in 1942 by M. Muskat [1,2], who pioneered the first analytical model by simplifying perforation tunnels as spiral-distributed sink points around the wellbore. In the early 1950s, researchers including R.A. Howard, M.S. Tr. Watson, J.M. McDowell, and M. Muskat conducted electrical analogy experiments to quantify relationships between perforation parameters and skin factor [2]. However, the oversimplified assumptions adopted in these early studies—such as neglecting formation heterogeneity and perforation-induced crushed zones—led to significant errors, greatly limiting their practical applicability in real reservoir scenarios.
Numerical modeling advanced significantly in 1966 when M.H. Harris [3] pioneered finite difference methods to study ideal perforation conditions, opening up a new avenue for more accurate simulation of perforation-related flow behaviors. A breakthrough came in 1988 when S.M. Tariq and M.J. Ichara [4,5,6] developed a widely recognized semi-analytical FEM-based skin factor model, which combined the computational efficiency of analytical methods with the accuracy of numerical methods, gaining extensive attention and application in the industry.
At China University of Petroleum, researchers Lang Zhaoxin and Zhang Lihua [7] developed a regression model for predicting perforation completion skin factor by combining finite element numerical simulation with nonlinear regression methods. Similarly, a research team from Southwest Petroleum University including Tang Yula and Pan Yingde [8] conducted quantitative studies on the relationship between perforation parameters and well skin factor using finite element methods, enriching the domestic theoretical system of perforation completion and providing targeted guidance for Chinese oilfields.
In 2006, Turhan Yildiz [9,10] developed a comprehensive review of over a dozen existing perforation skin factor models in the literature, concluding that most current models essentially consider only single-factor influences. He demonstrated that representing the combined effects of multiple factors on perforation skin through linear superposition of individual factors is fundamentally inaccurate. This critical limitation was subsequently corroborated by Datong Sun and Mikhail in their 2011 and 2013 studies [11,12,13,14], which compared skin factor predictions from computational fluid dynamics (CFD) software Ansys Fluent 2024R1 with results from the Karakas–Tariq semi-analytical model and found that linear superposition-based models could produce errors exceeding 30% in multi-factor scenarios. The limitation was further emphasized by Arian Velayati, 2018 [15], who noted that linear models ignore the interaction between perforation parameters that affect near-wellbore pressure distribution, leading to unreasonable optimization suggestions.
In this study, a comprehensive perforation completion model was developed using ANSYS Fluent numerical simulation software; the developer is ANSYS, Inc., 2600 Ansys Drive, Canonsburg, PA 15317, USA. and the version is 2024R1., incorporating multiple critical parameters, including perforation depth, diameter, shot density, and phase angle, as well as damage zone depth and severity. Based on this model, single-factor analysis was first conducted to investigate the individual effects of perforation depth, shot density, diameter and phase angle on skin factor. Subsequently, orthogonal experimental design was employed to perform multi-factor analysis of perforation completion skin effect. Finally, a predictive model for perforation skin factor was established through nonlinear regression analysis. This research provides a theoretical foundation for accurate skin factor calculation and optimized design in conventional perforation completion of oil and gas wells, integrating numerical simulation with statistical analysis to overcome the limitations of traditional analytical approaches while considering both geometric parameters and formation damage characteristics. The methodology systematically progresses from single-parameter evaluation to multi-factor interaction analysis, culminating in the development of a practical predictive tool validated through rigorous numerical and statistical techniques

2. Establishment of Fluid Flow Model for Conventional Perforated Completion

2.1. Physical Model of Conventional Perforated Completion

The perforation completion typically consists of perforation tunnels, near-wellbore damaged zones, and reservoir formations (as shown in Figure 1a). The reservoir boundary serves as the fluid inlet while the wellhead acts as the outlet. Formation fluids flow from the reservoir boundary through the porous media into the wellbore via the perforation tunnels.

2.2. Establishment of Mathematical Model for Fluid Flow in Conventional Perforated Completion

The physical model of perforated completion is shown in Figure 1. To establish its corresponding mathematical model, the following assumptions are made:
  • The near-wellbore zone is a homogeneous reservoir with uniform thickness, and the flow in the formation follows porous media.
  • The perforation tunnels have equal diameters, and the influence of the compacted zone is not considered.
  • The fluid flow is assumed to be steady-state seepage, and the flow in the perforation tunnels is regarded as laminar due to low velocity.
Flow through porous media is typically described by Darcy’s law, while flow within perforation tunnels is generally characterized by the Navier–Stokes equations. The steady-state Navier–Stokes equations are as follows:
The mass conservation equation:
d i v ρ u = 0
In Equation (1):
ρ represents fluid density (kg/m3).
div() is the divergence operator.
μ stands for crude oil viscosity (Pa·s).
The momentum conservation equation:
d i v ρ u u = d i v μ g r a d u ρ x + S x
d i v ρ ν u = d i v μ g r a d ν ρ y + S y
d i v ρ w u = d i v μ g r a d w ρ z + S z
In Equations (2)–(4):
u, v, w represent velocities in the x, y, z directions (m/s).
grad denotes the gradient operator.
S is the source term (S = 0 when simulating fluid flow within perforation tunnels).
The scale of porous media in the near-well reservoir is typically measured in meters, while the geometric dimensions of perforation tunnels are usually measured in millimeters. Therefore, to quantitatively describe the fluid transport mechanism in perforated completions, it is necessary to couple and solve the porous media seepage and pipe flow across these two distinct scales (reservoir and perforation tunnels). To reduce numerical instability in the coupled flow model and improve solution accuracy, the influence of porous media seepage is simulated by adding a source term to the momentum equation. This source term consists of two components: the viscous loss term and the inertial loss term.
S i = j = 1 3 D i j μ ν j + j = 1 3 C i j 1 2 ρ ν ν j
In Equation (5):
Si represents the momentum source term in the i-direction (x, y, z).
D denotes the fluid viscous resistance coefficient.
C represents the fluid inertial resistance coefficient.
In high-velocity flows, the constant C in the porous media momentum source term can be used to correct for inertial losses. If the fluid velocity is low, C can be set to 0 to neglect inertial losses, considering only the viscous resistance of the fluid.

3. Analysis of Single Factors in Conventional Perforated Completions Under Different Reservoir Conditions

According to the 2021 petroleum industry standards [16], reservoirs can be classified into high-permeability, medium-permeability, and low-permeability reservoirs based on their permeability, as detailed in Table 1. Typically, ultra-low and extremely low-permeability reservoirs employ fractured completions. Therefore, this study examines the impact of perforation parameters on oil and gas well production under reservoir permeability conditions of 10 × 10−3 μm2, 50 × 10−3 μm2, 200 × 10−3 μm2, 500 × 10−3 μm2, and 1000 × 10−3 μm2.
The perforation completion parameters and other reservoir parameters are shown in Table 2.

3.1. Perforation Depth Sensitivity Analysis

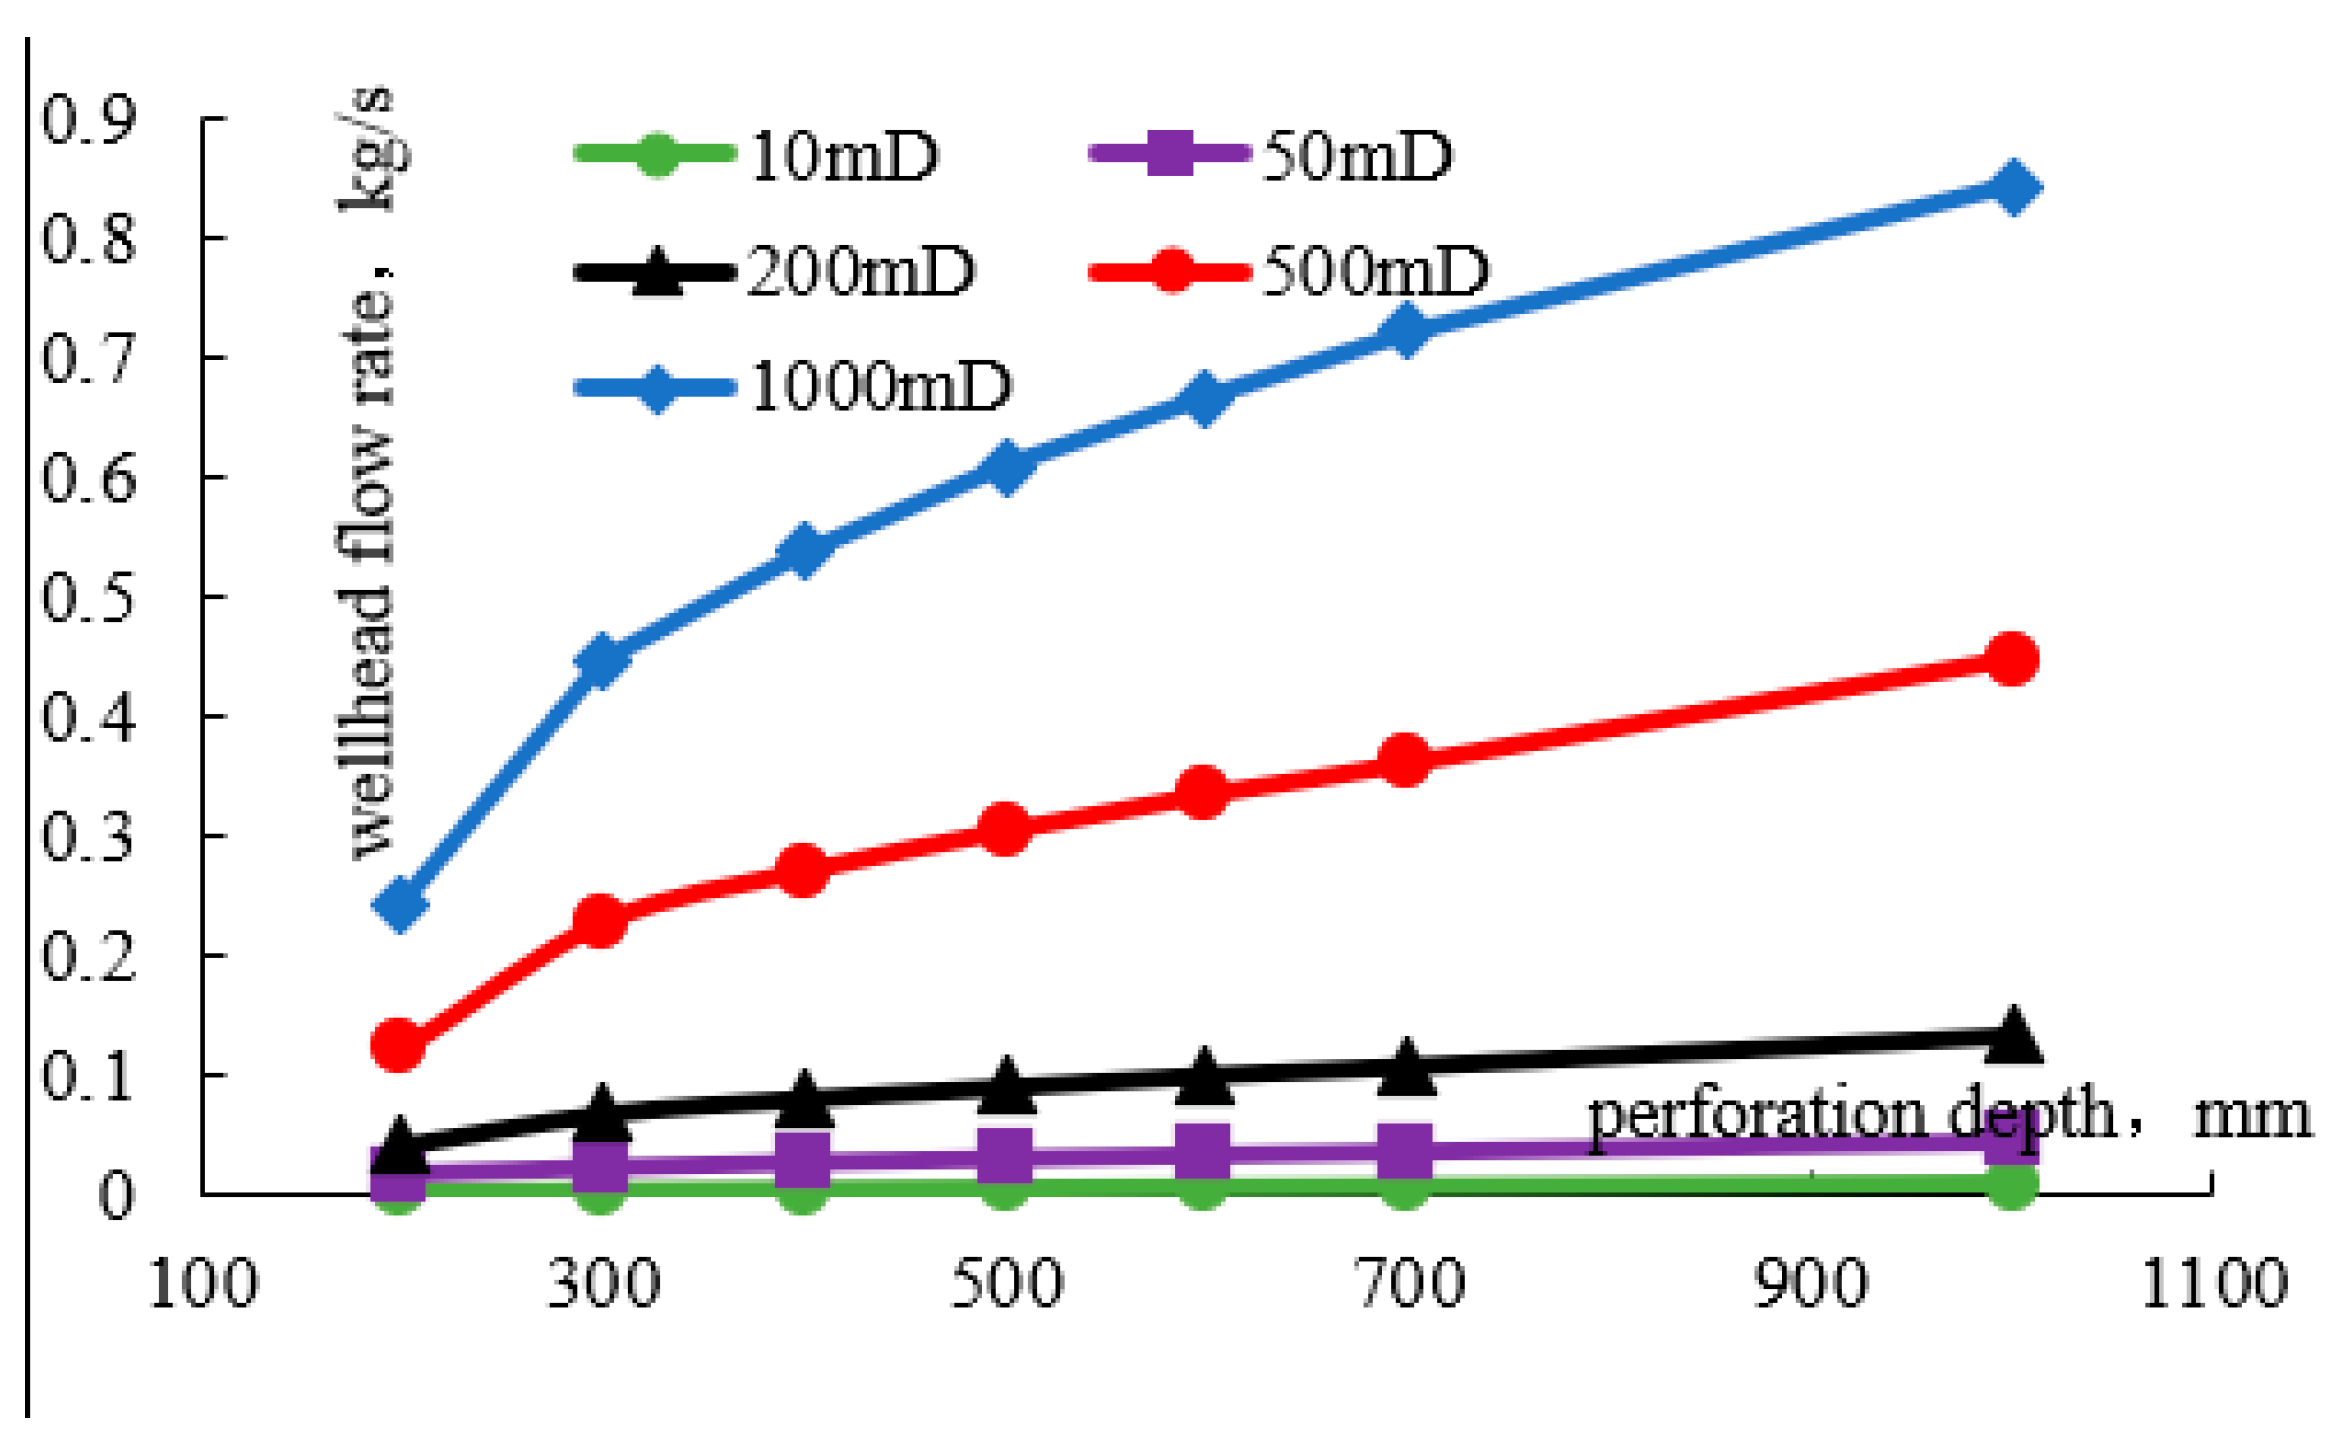
With all other parameters held constant (as shown in Table 2) and assuming a constant production pressure differential of 10 MPa for the oil well, the corresponding wellhead flow rates at perforation depths of 200 mm, 300 mm, 400 mm, 500 mm, 600 mm, 700 mm, and 1000 mm are shown in Figure 2. As can be seen from Figure 2, the wellhead flow rate increases with greater perforation depth. Since the damaged zone radius is 280 mm, the wellhead flow rate shows a significant increase when the perforation depth is extended from 200 mm to 300 mm.
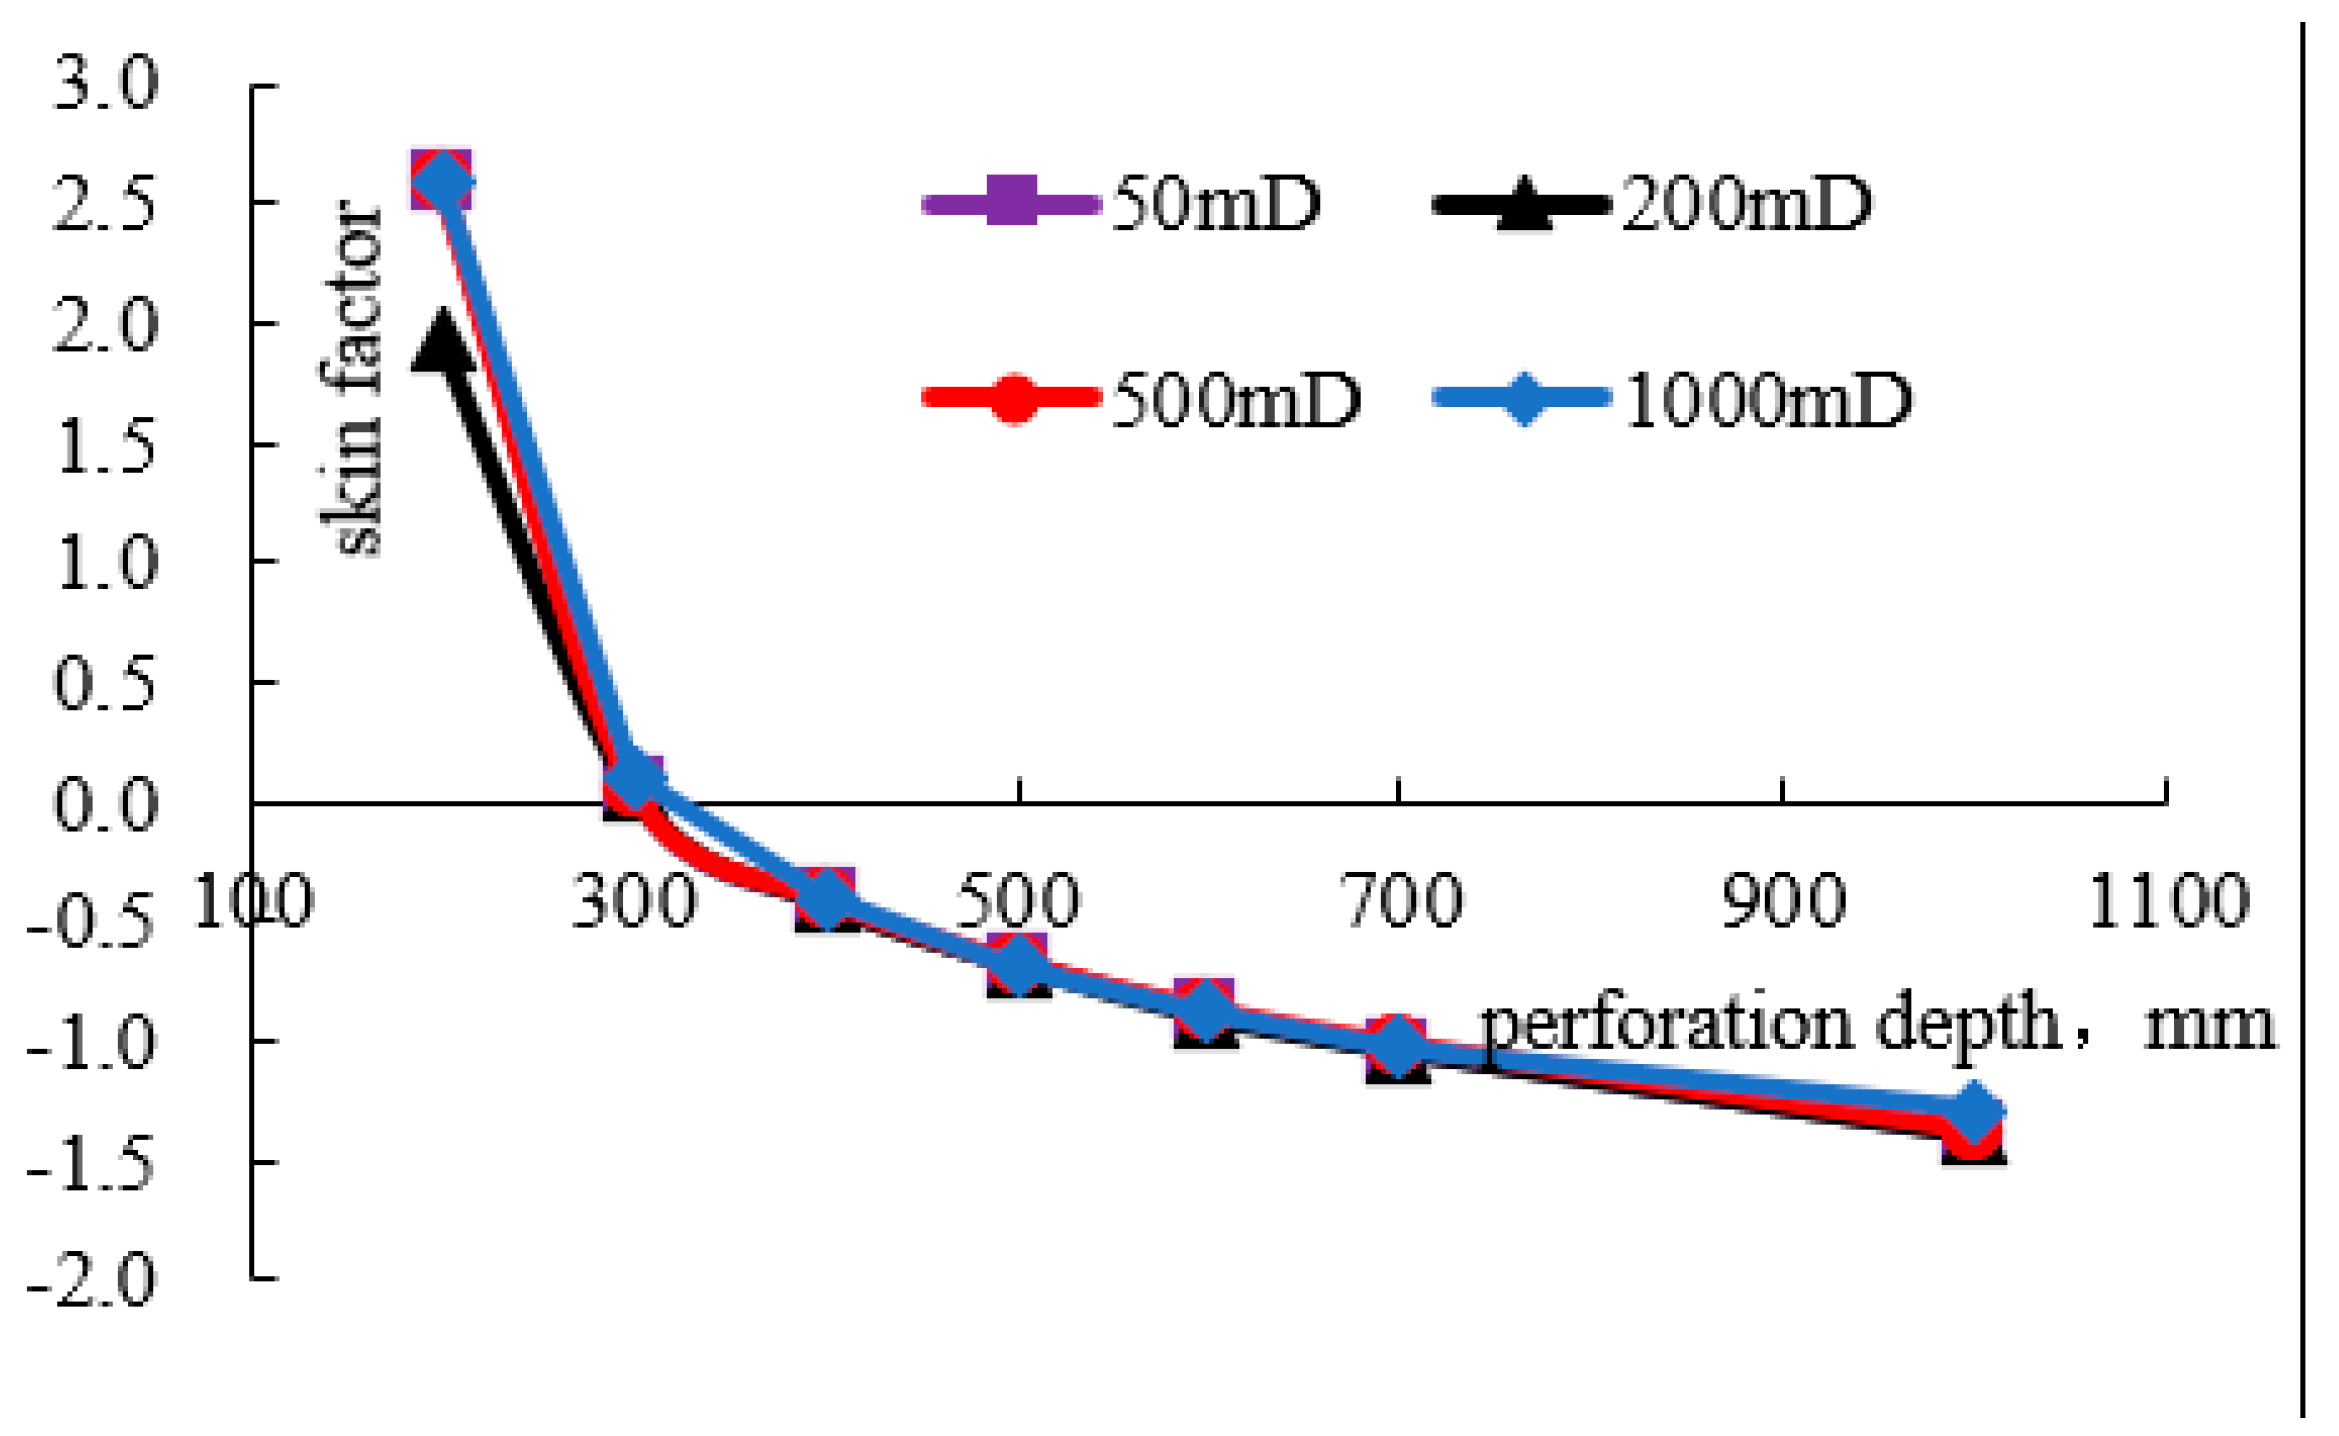
From the skin factor calculation Formula (6), the skin factors corresponding to different perforation depths under various reservoir conditions can be obtained. The curve of skin factor versus perforation depth is plotted in Figure 3. As shown in Figure 3, the skin factor decreases with increasing perforation depth, and the skin factors are nearly identical across reservoirs with different permeability values.
s = 2 π K h Δ p Q μ ln r e r w 3 4
In Equation (6):
Δp represents the production pressure differential (MPa).
K denotes the reservoir permeability (μm2).
h stands for the formation thickness (m).
Q indicates the wellhead flow rate (m3/s).
re is the radius of drainage (m).
rw represents the wellbore radius (m).
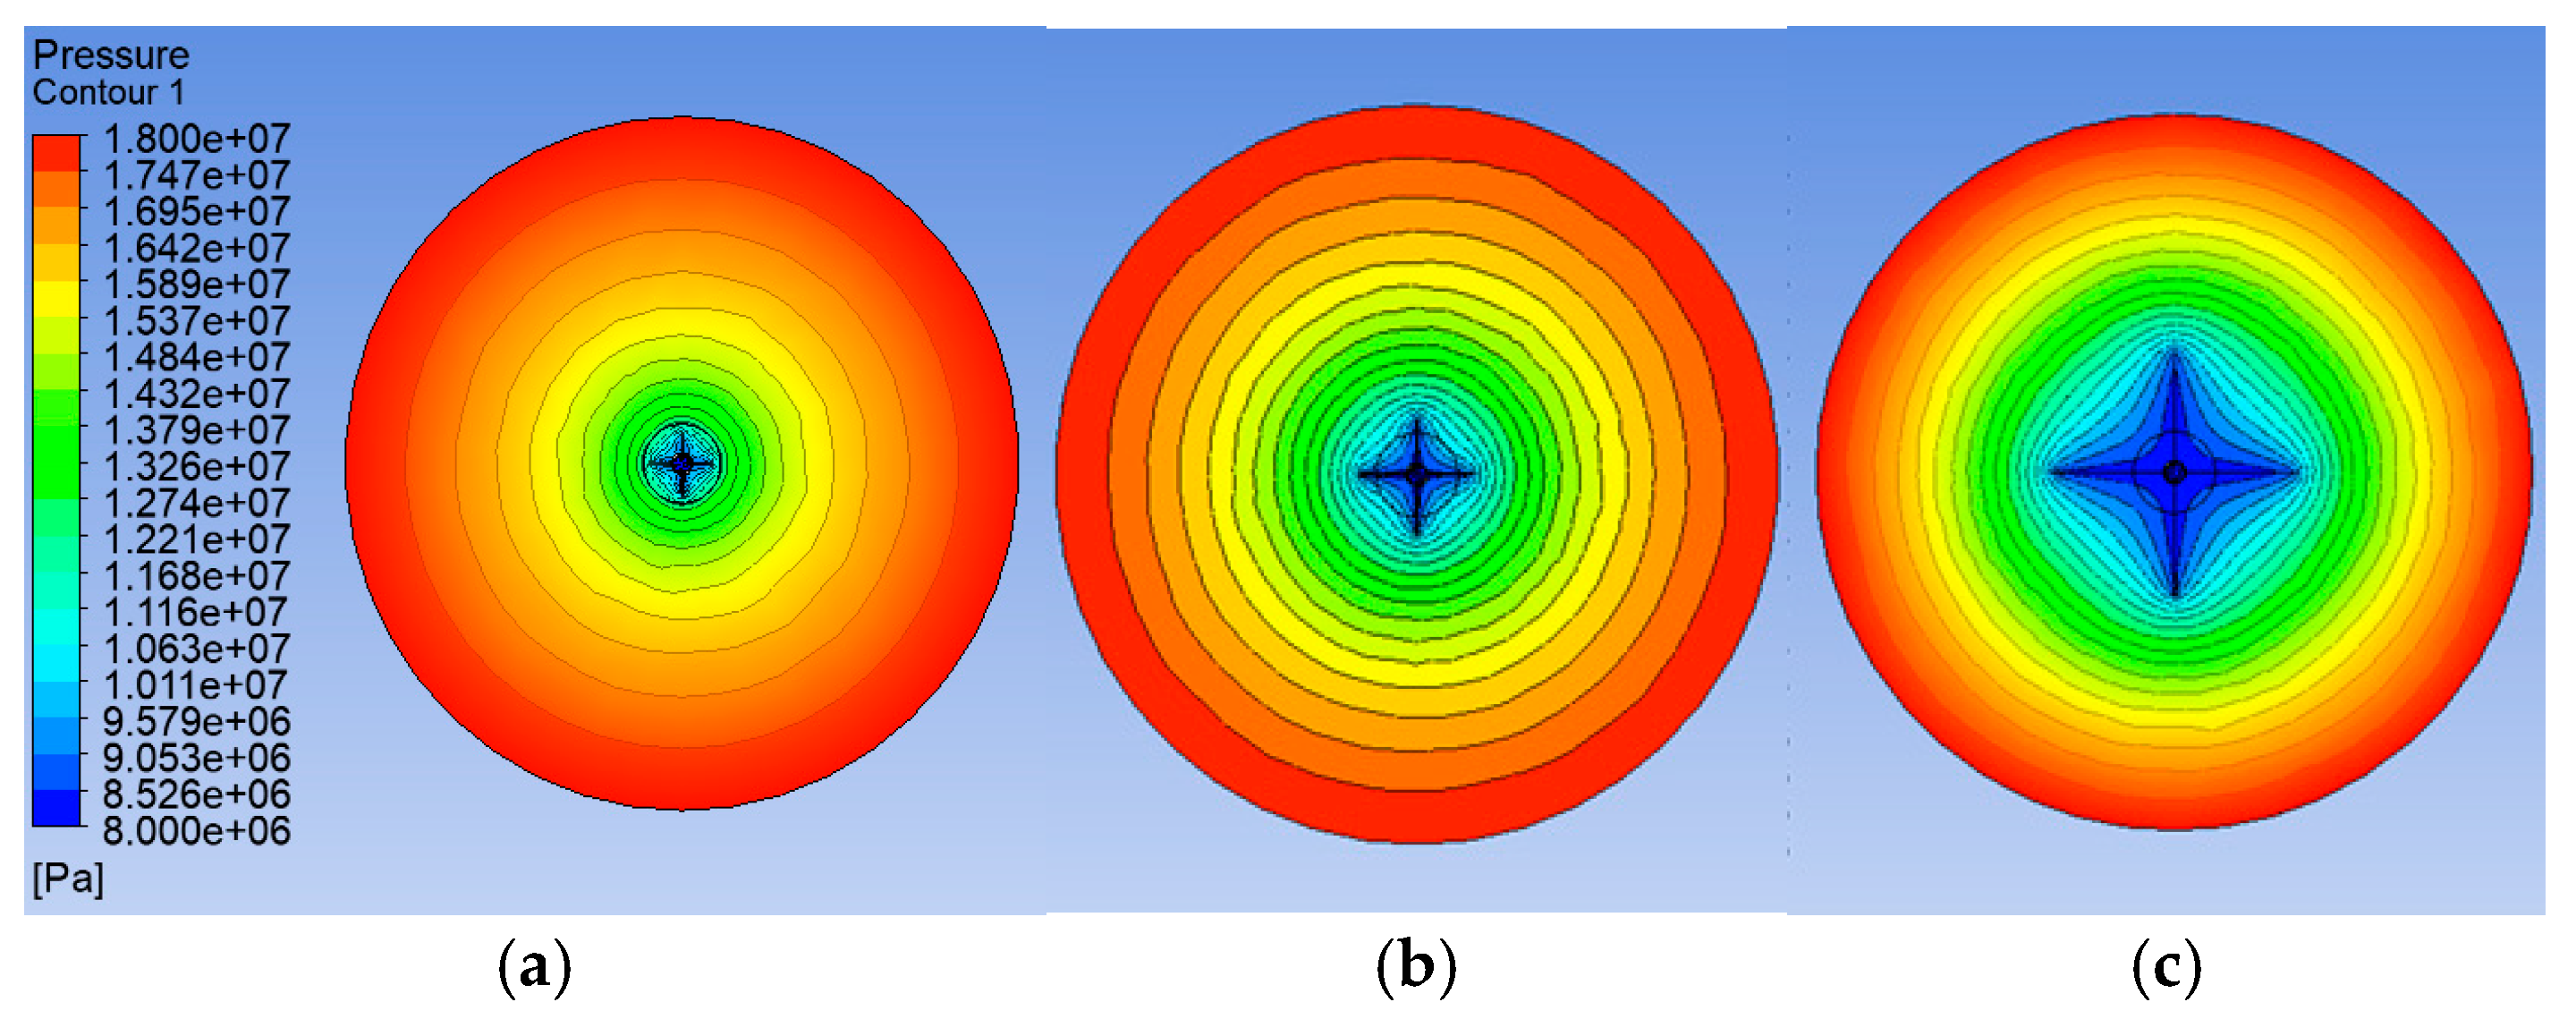
As shown in Figure 4, the perforation depth has a significant impact on the reservoir pressure field. As the perforation depth increases, the low-pressure zone near the well expands, and the isobars become more widely spaced, indicating reduced flow resistance in the near-wellbore region.

3.2. Shot Density Sensitivity Analysis

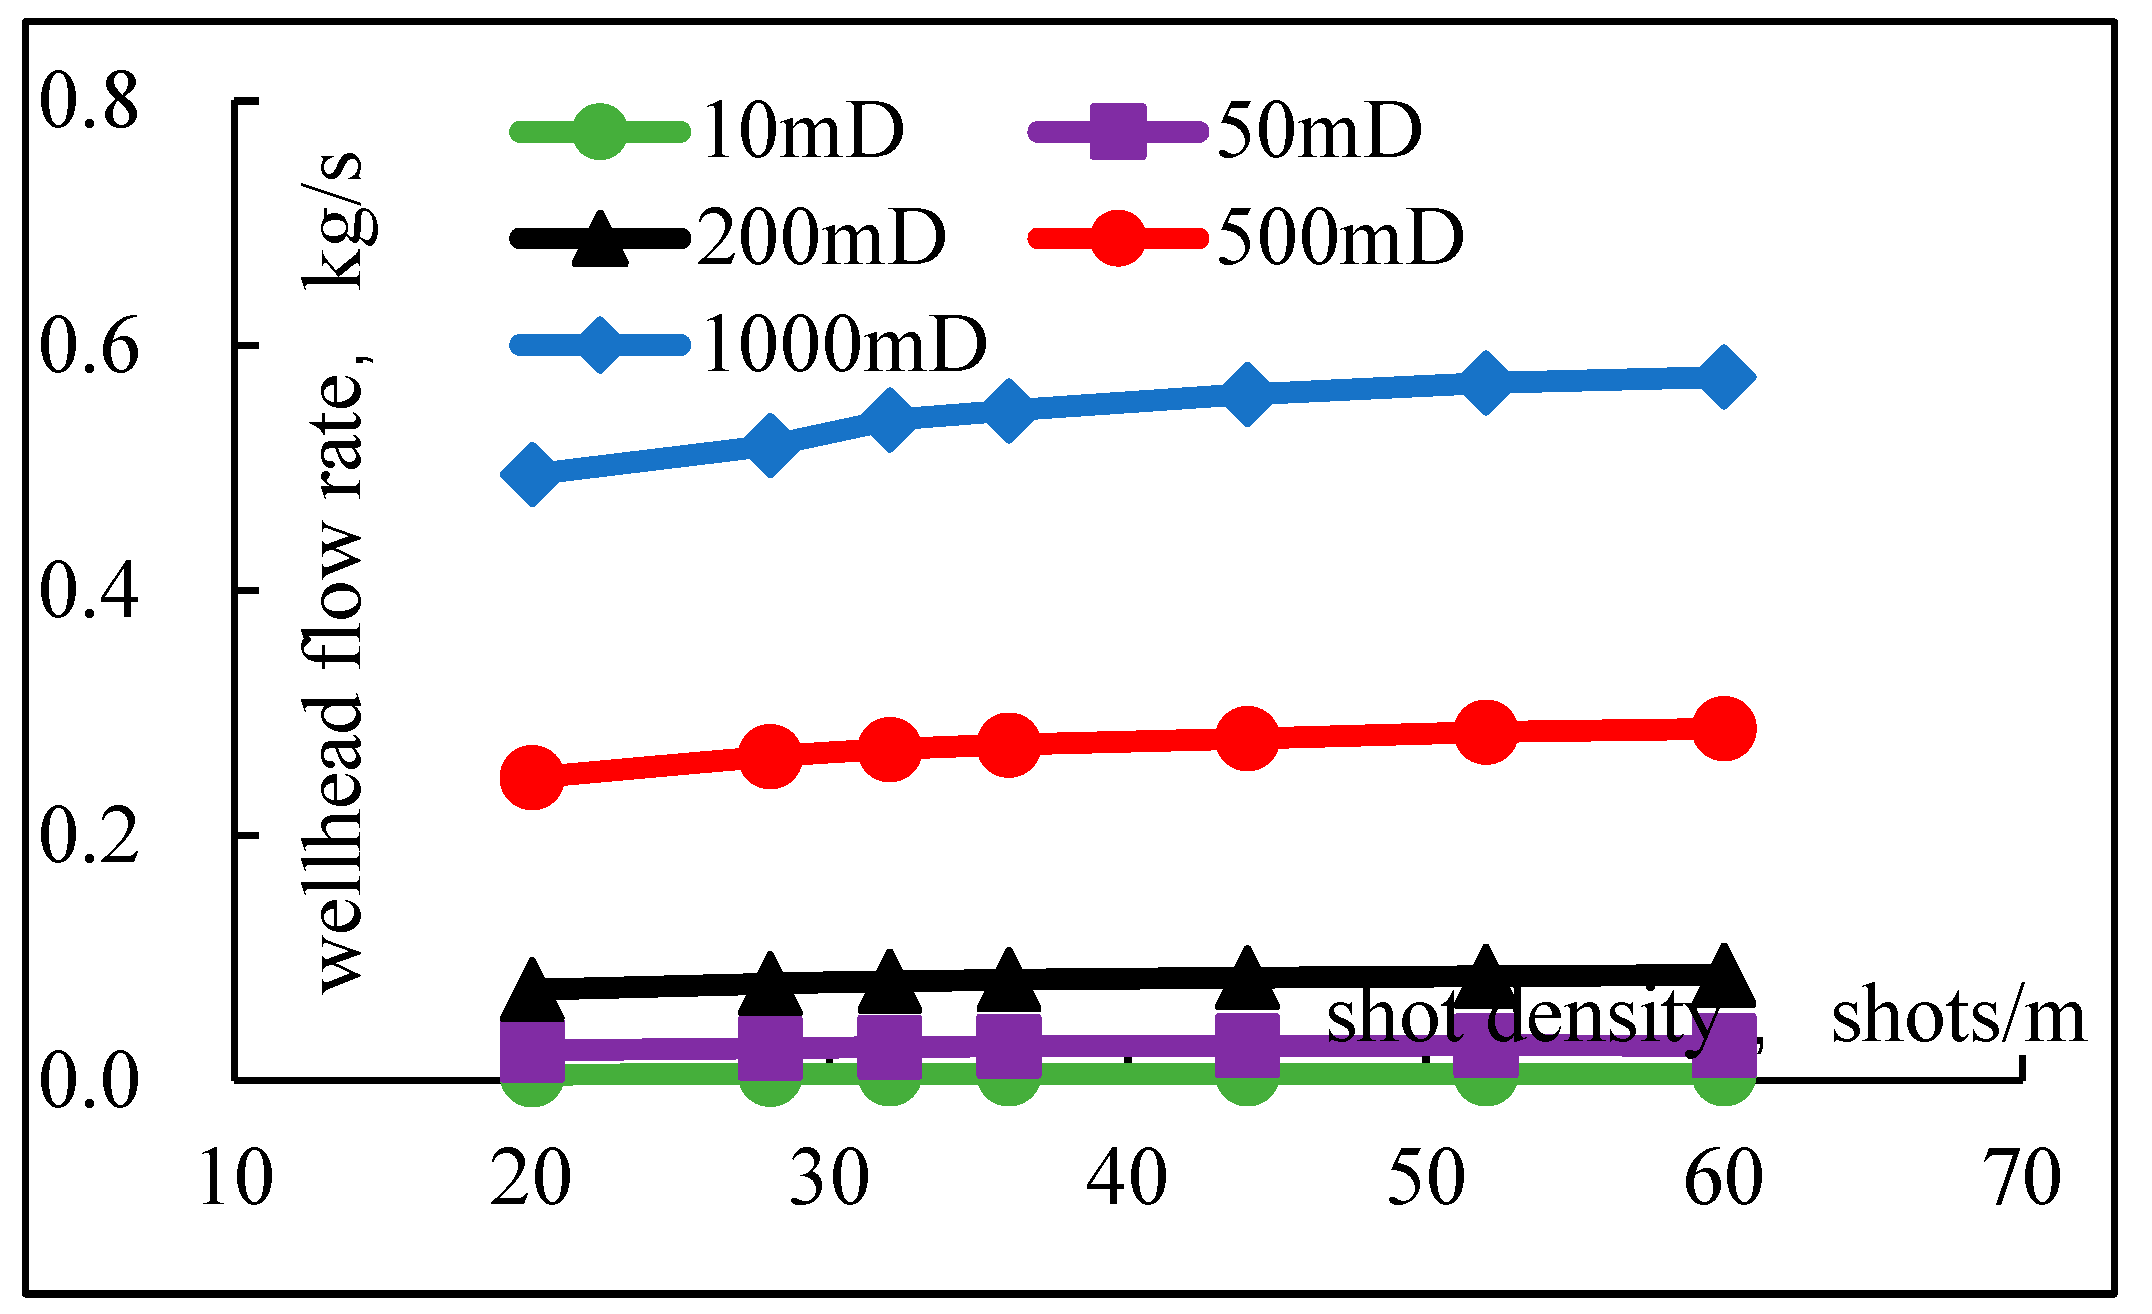
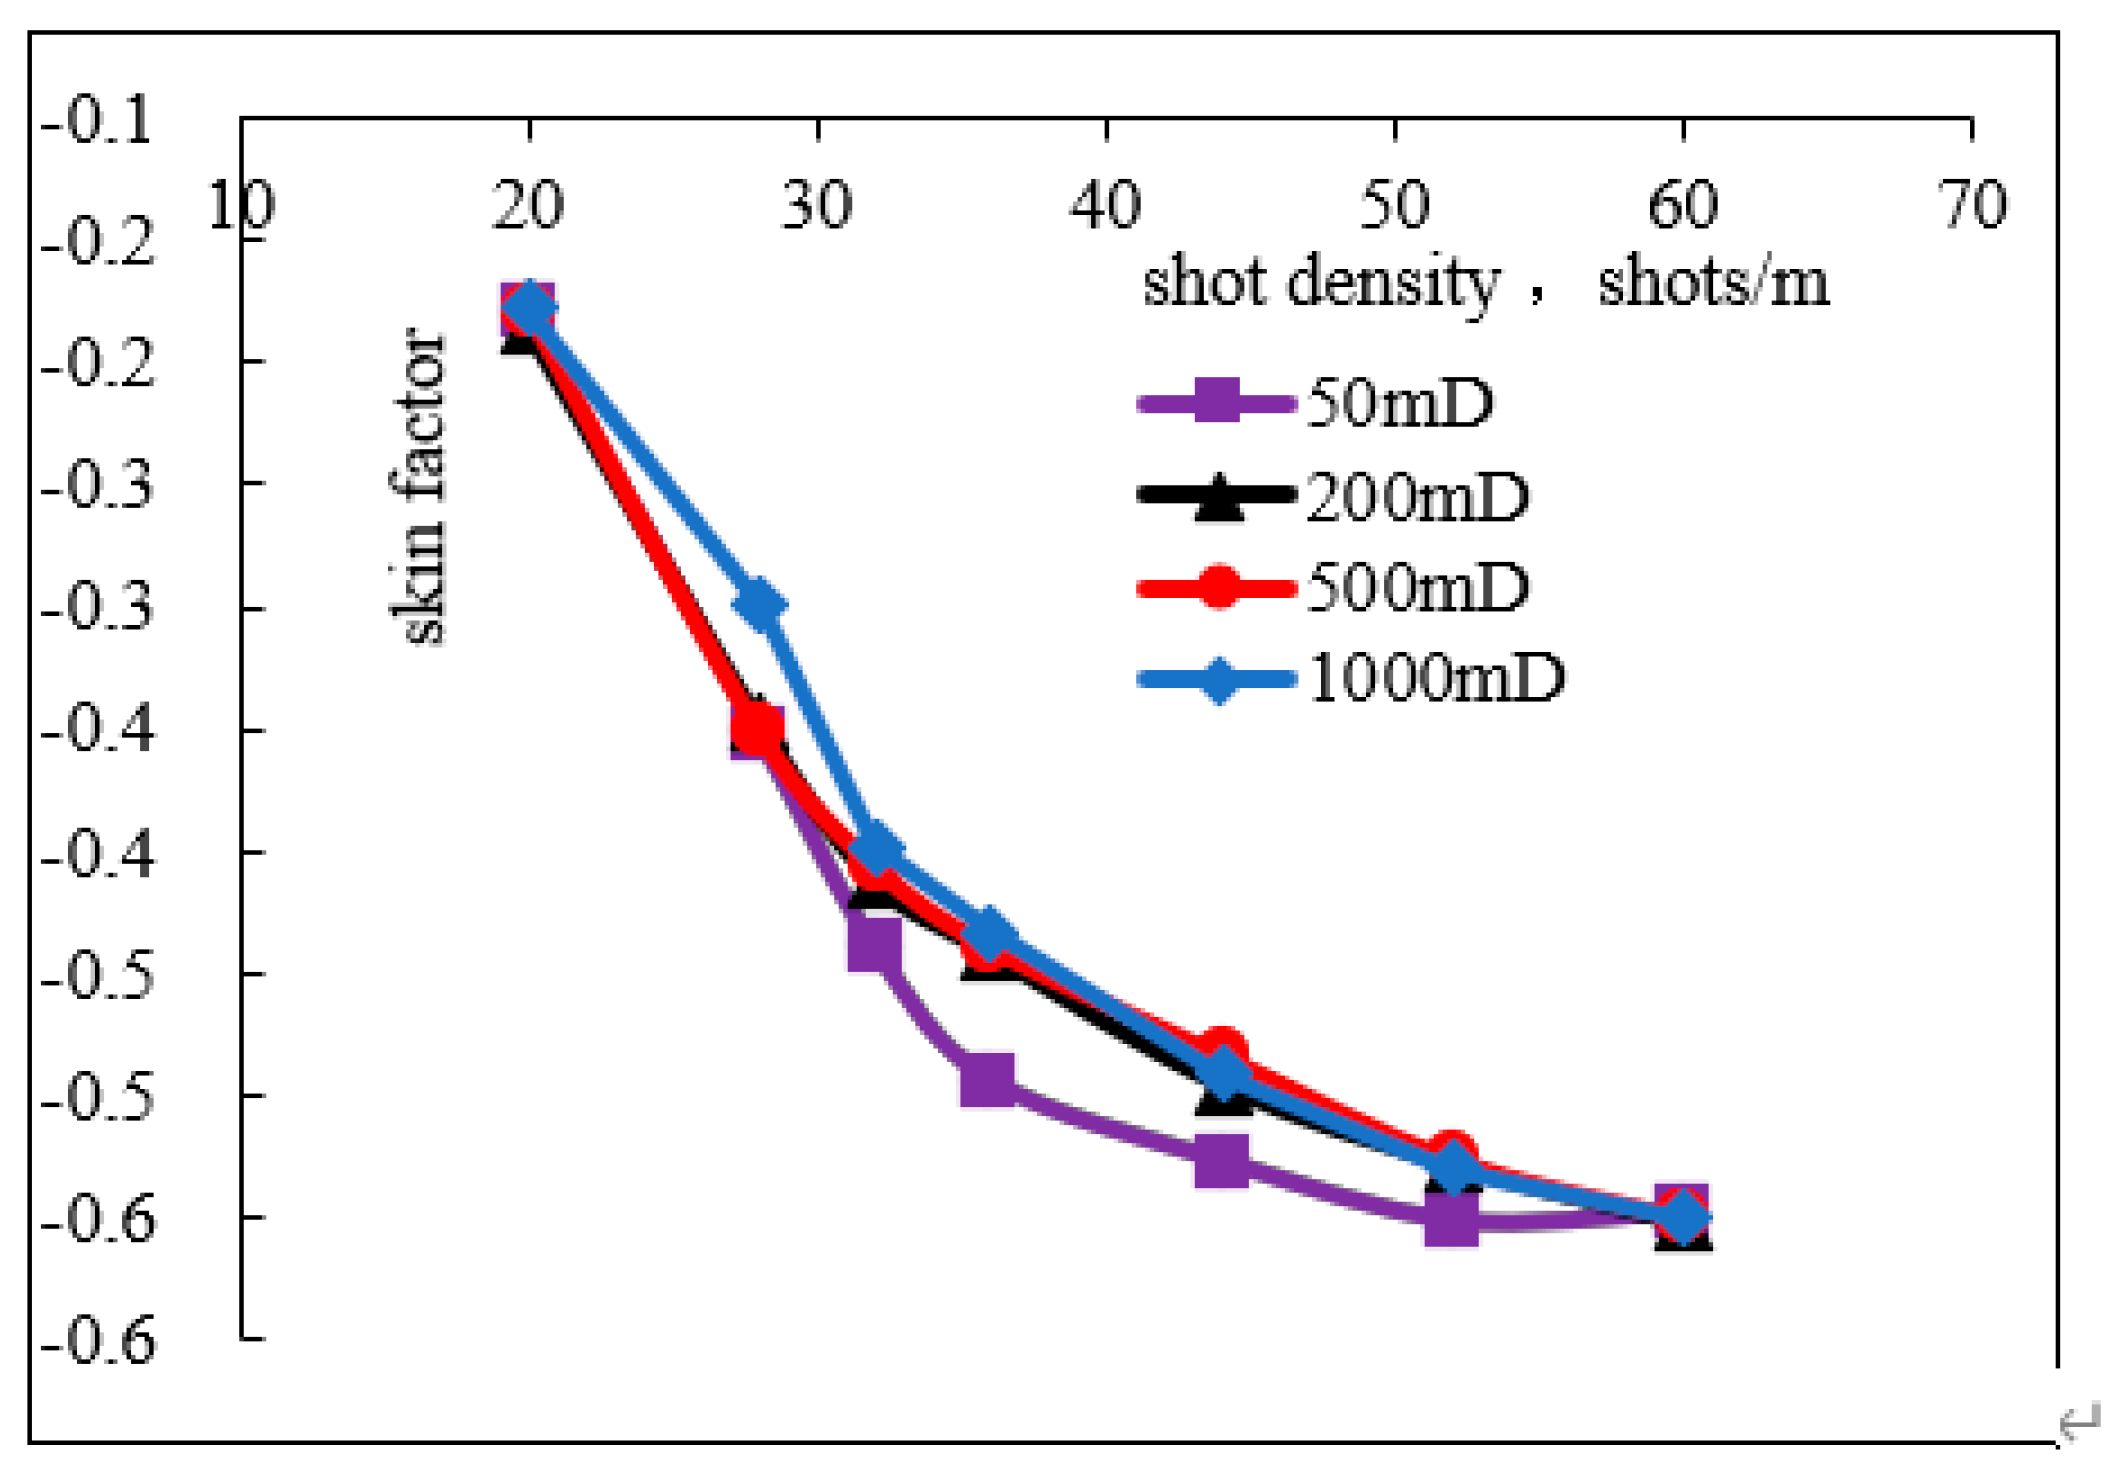
With all other parameters held constant and under a fixed production pressure differential of 10 MPa, the variations in wellhead flow rate at shot densities of 20, 28, 32, 36, 44, 52, and 60 shots per meter (SPM) are shown in Figure 5. The corresponding changes in skin factor under different shot densities, calculated using Equation (6), are presented in Figure 6. As evident from Figure 5 and Figure 6, increasing the shot density beyond 36 SPM yields diminishing improvements in well performance. The perforation distance includes the longitudinal and circumferential directions, among which the longitudinal perforation distance is directly determined by the perforation density. In this experiment, the perforation density ranges from 20 to 60 holes per meter, corresponding to a longitudinal perforation distance of 16.7–50.0 mm. It can be seen from Figure 5 and Figure 6 that when the longitudinal perforation distance is reduced from 50.0 mm to 27.8 mm (corresponding to the perforation density increasing from 20 holes per meter to 36 holes per meter), the wellhead flow rate increases significantly and the skin factor visibly decreases; when the longitudinal perforation distance is further reduced to 16.7 mm (with a perforation density of 60 holes per meter), the changes in flow rate and skin factor tend to slow down, indicating that there is an optimal critical value for the longitudinal perforation distance (about 27.8 mm), and if it is too small, the diversion gain will be saturated.
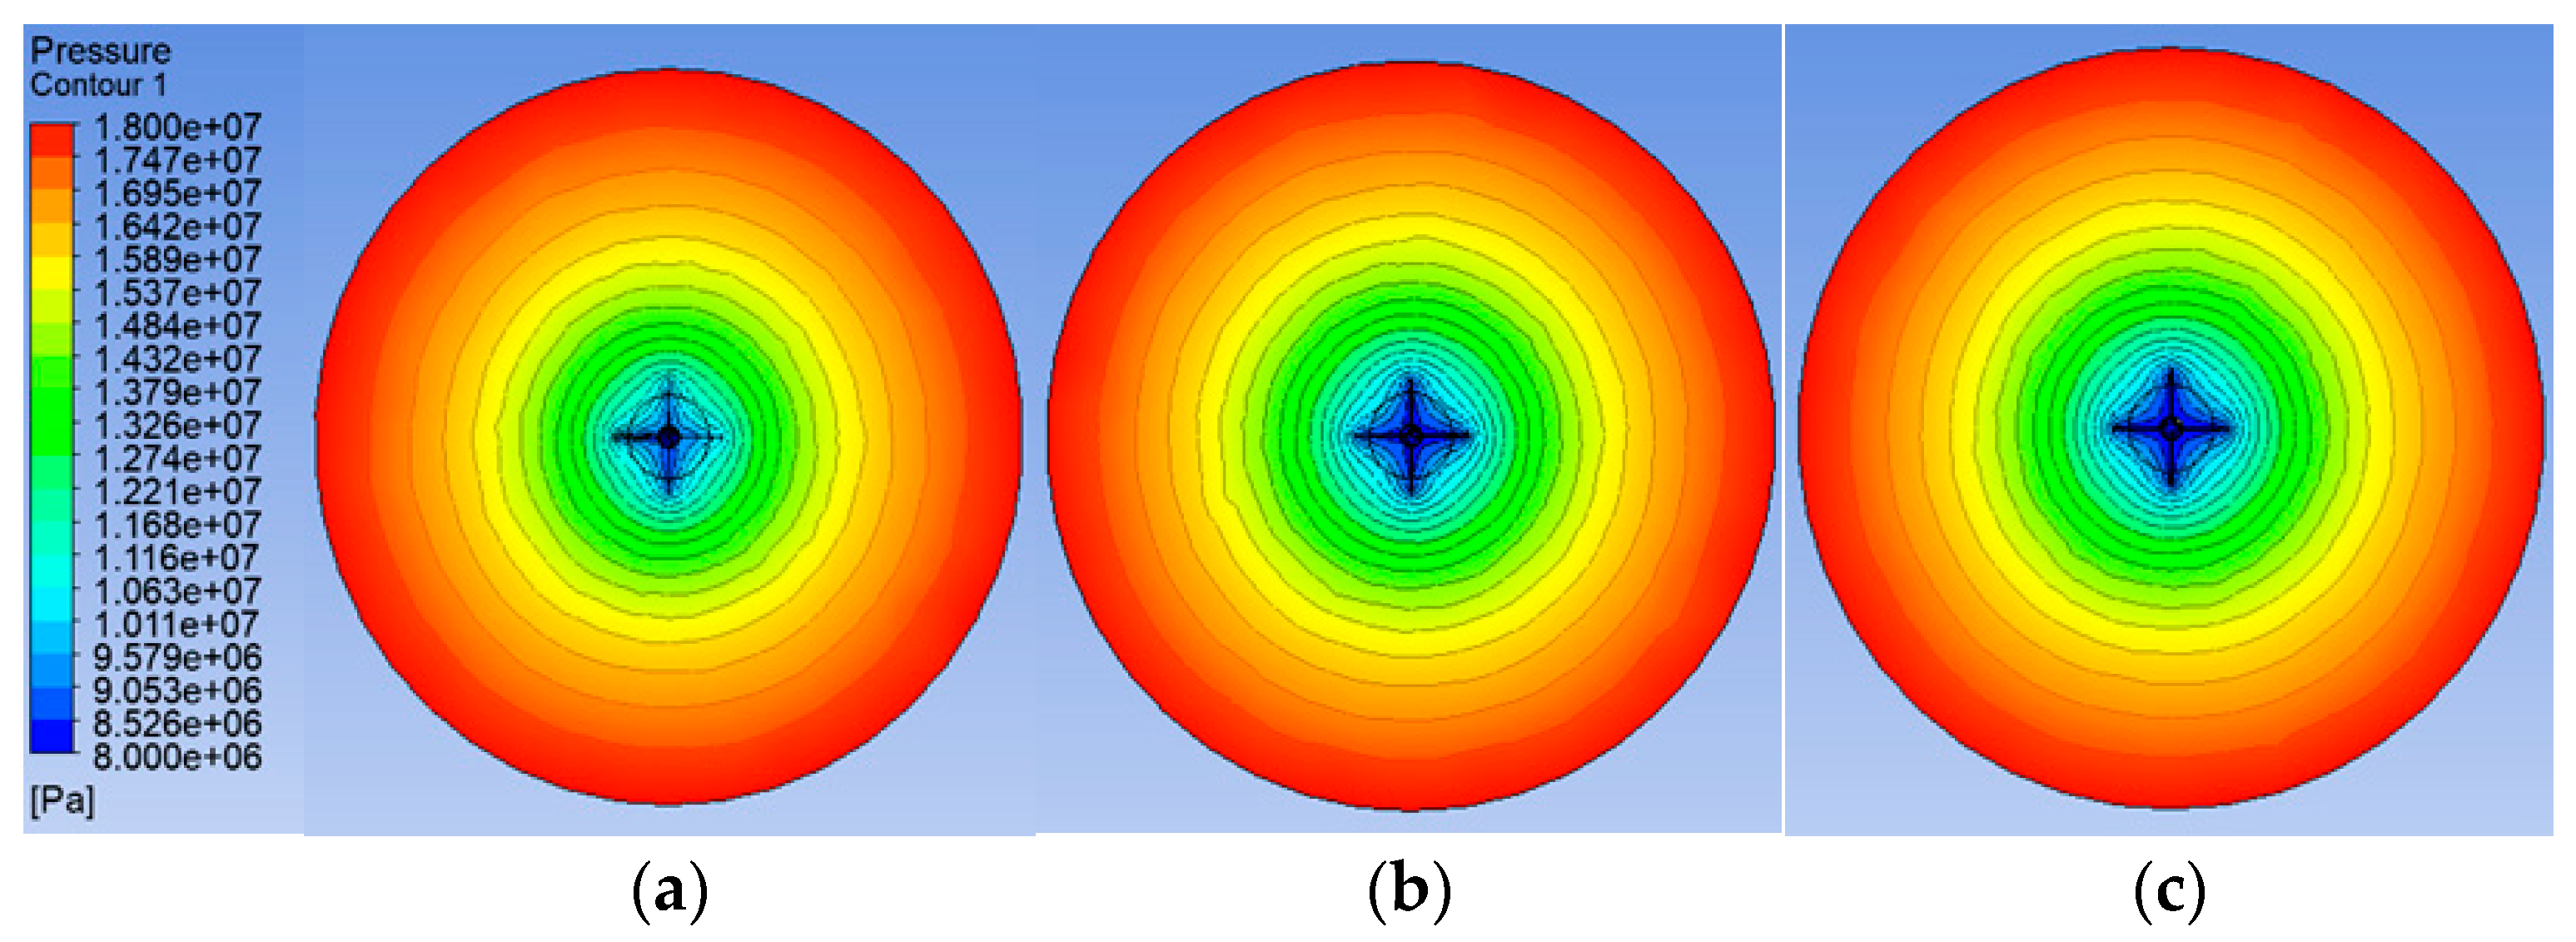
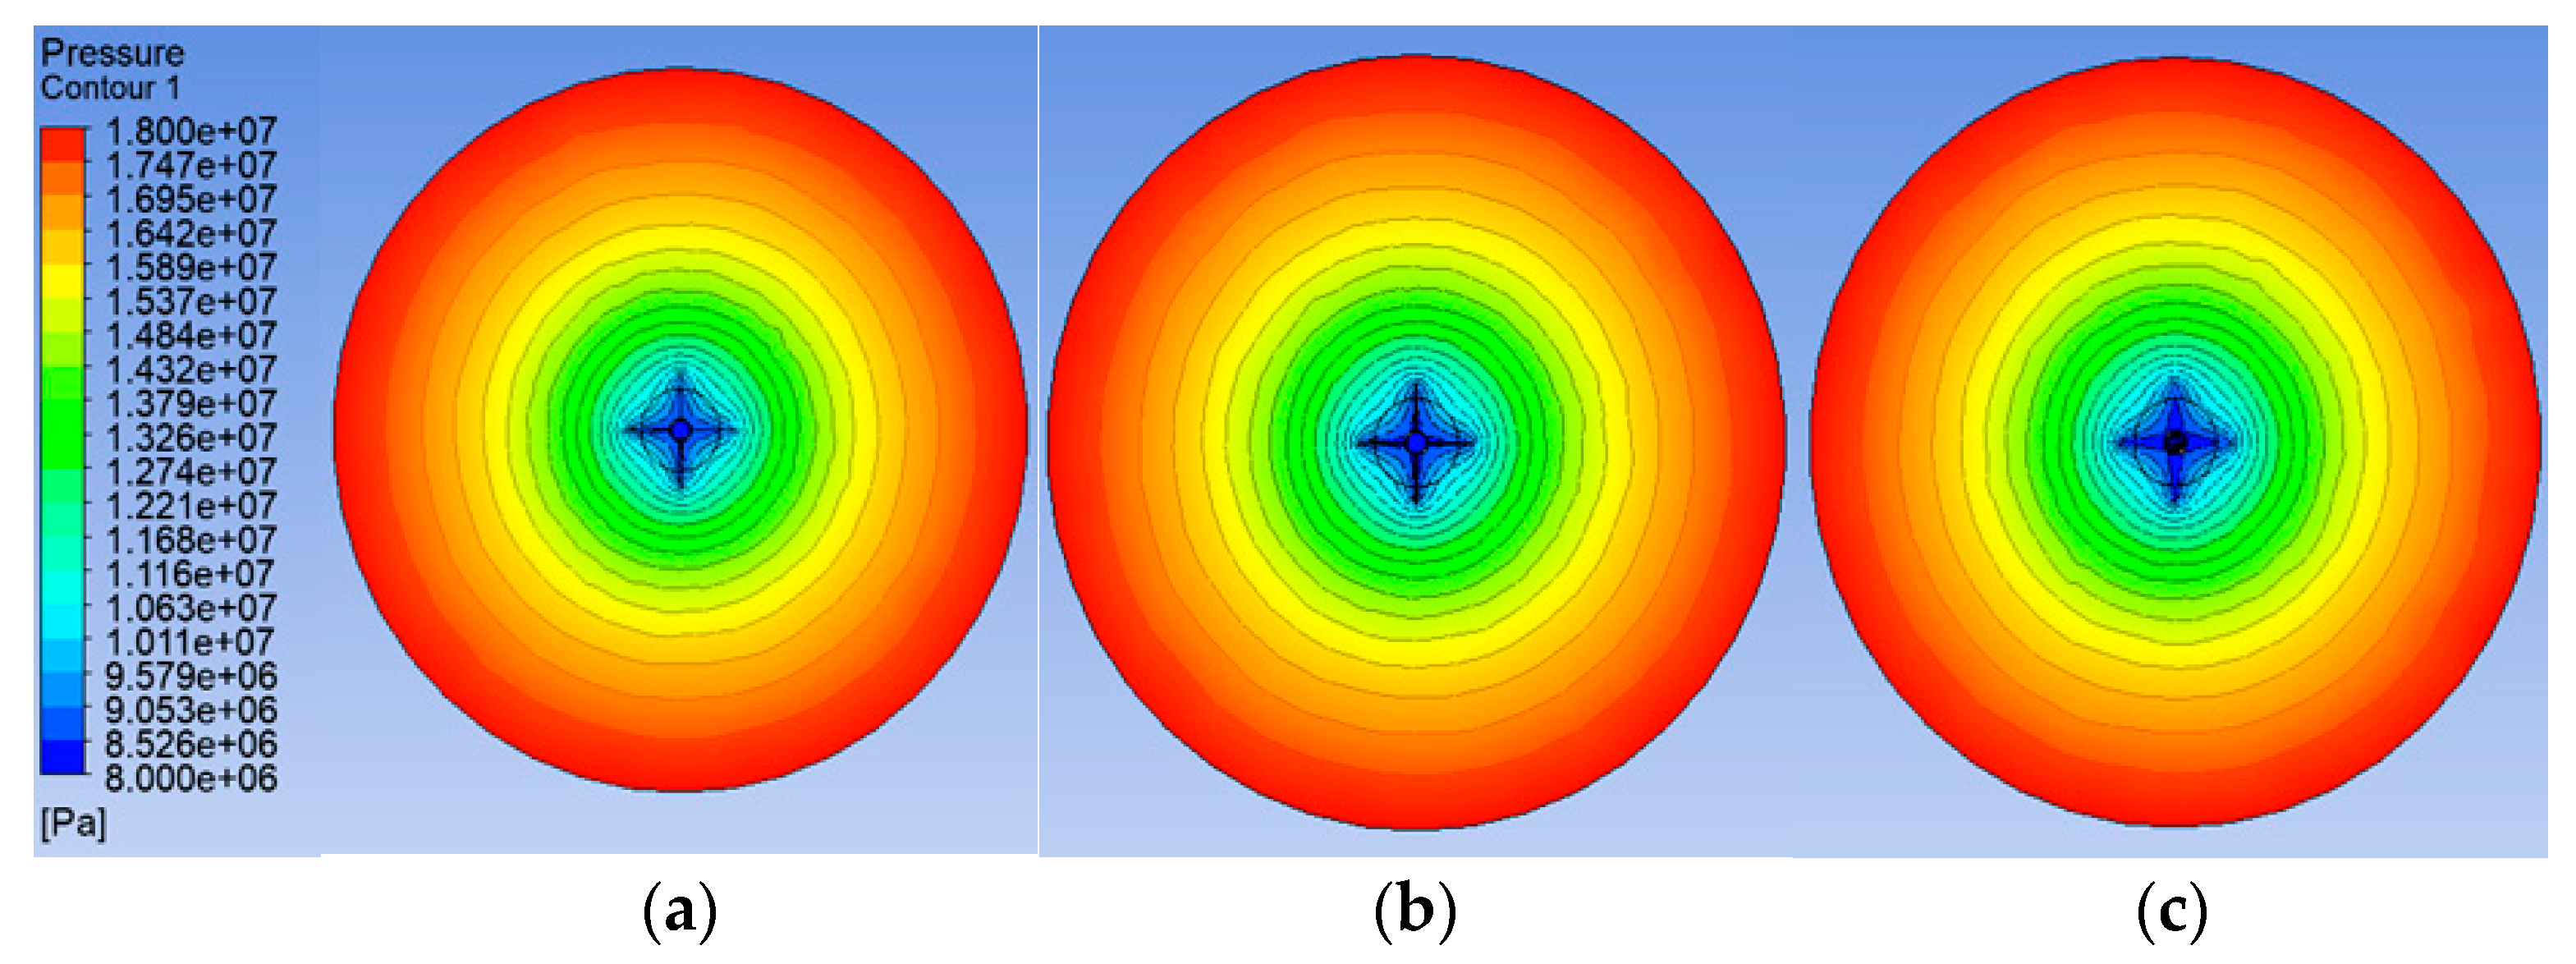
As shown in Figure 7, the low-pressure zone near the wellbore gradually expands with increasing shot density, indicating progressively reduced flow resistance—though the changes are not particularly pronounced.

3.3. Perforation Diameter Sensitivity Analysis

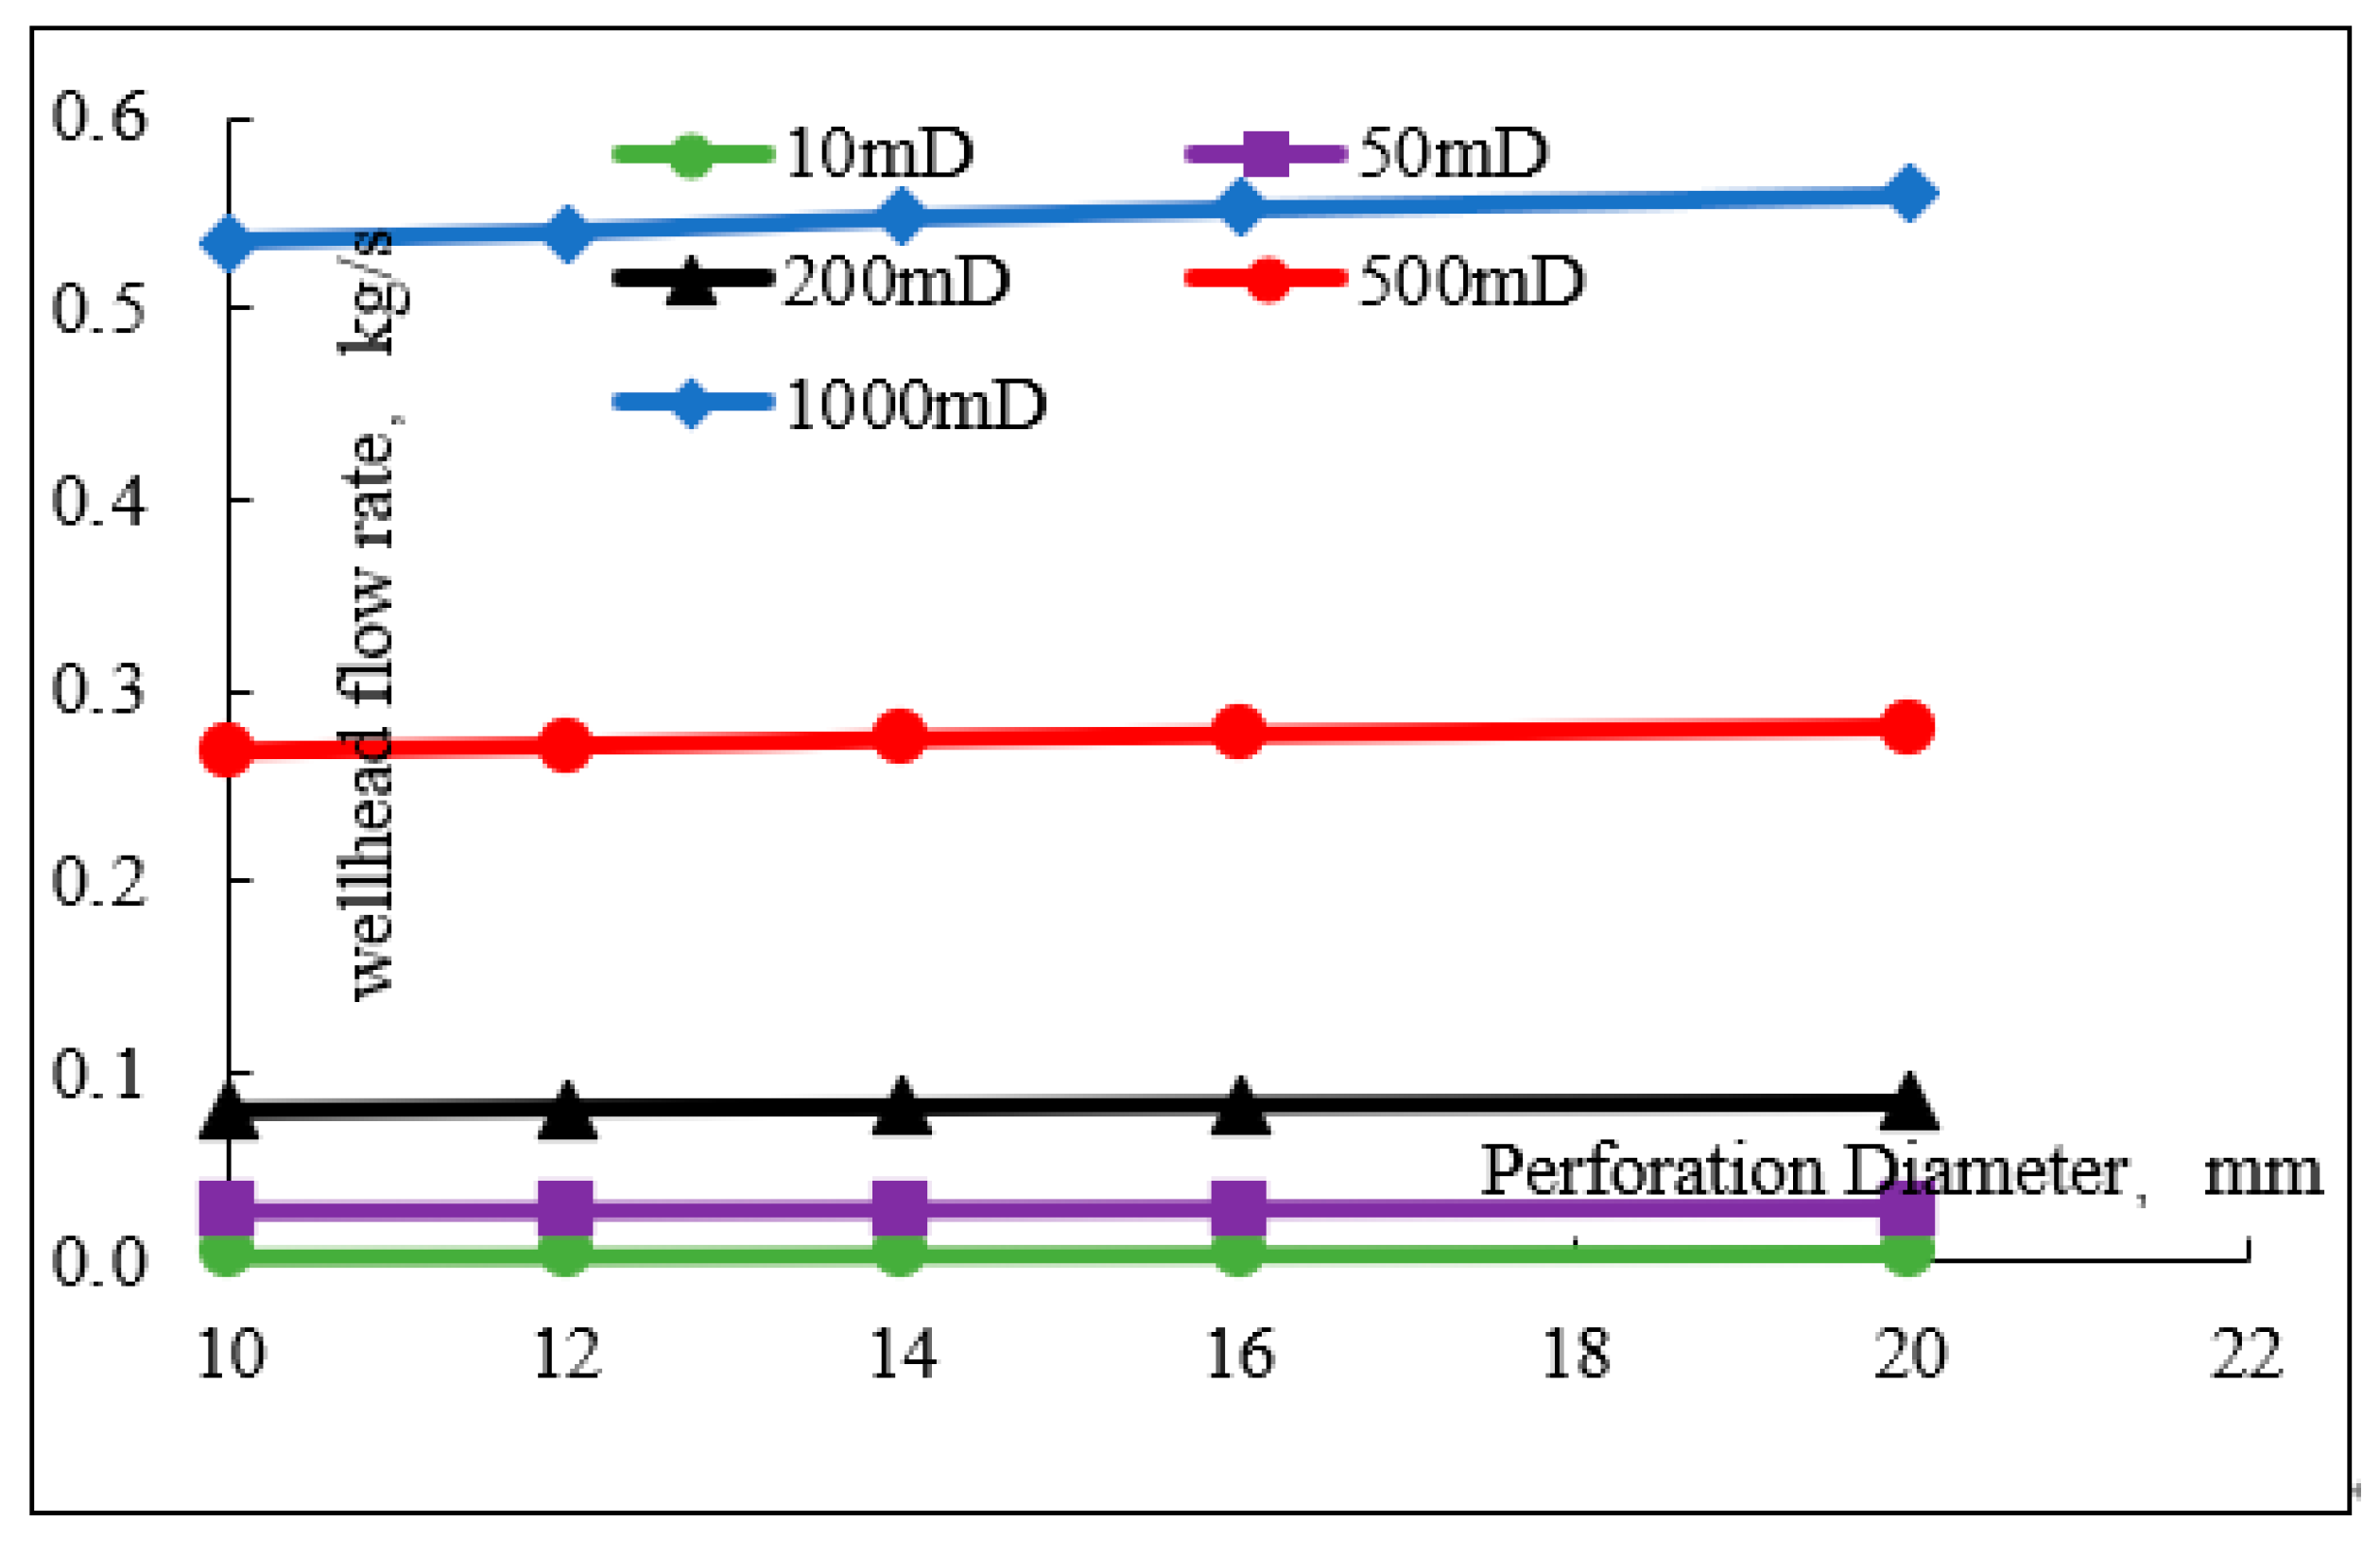
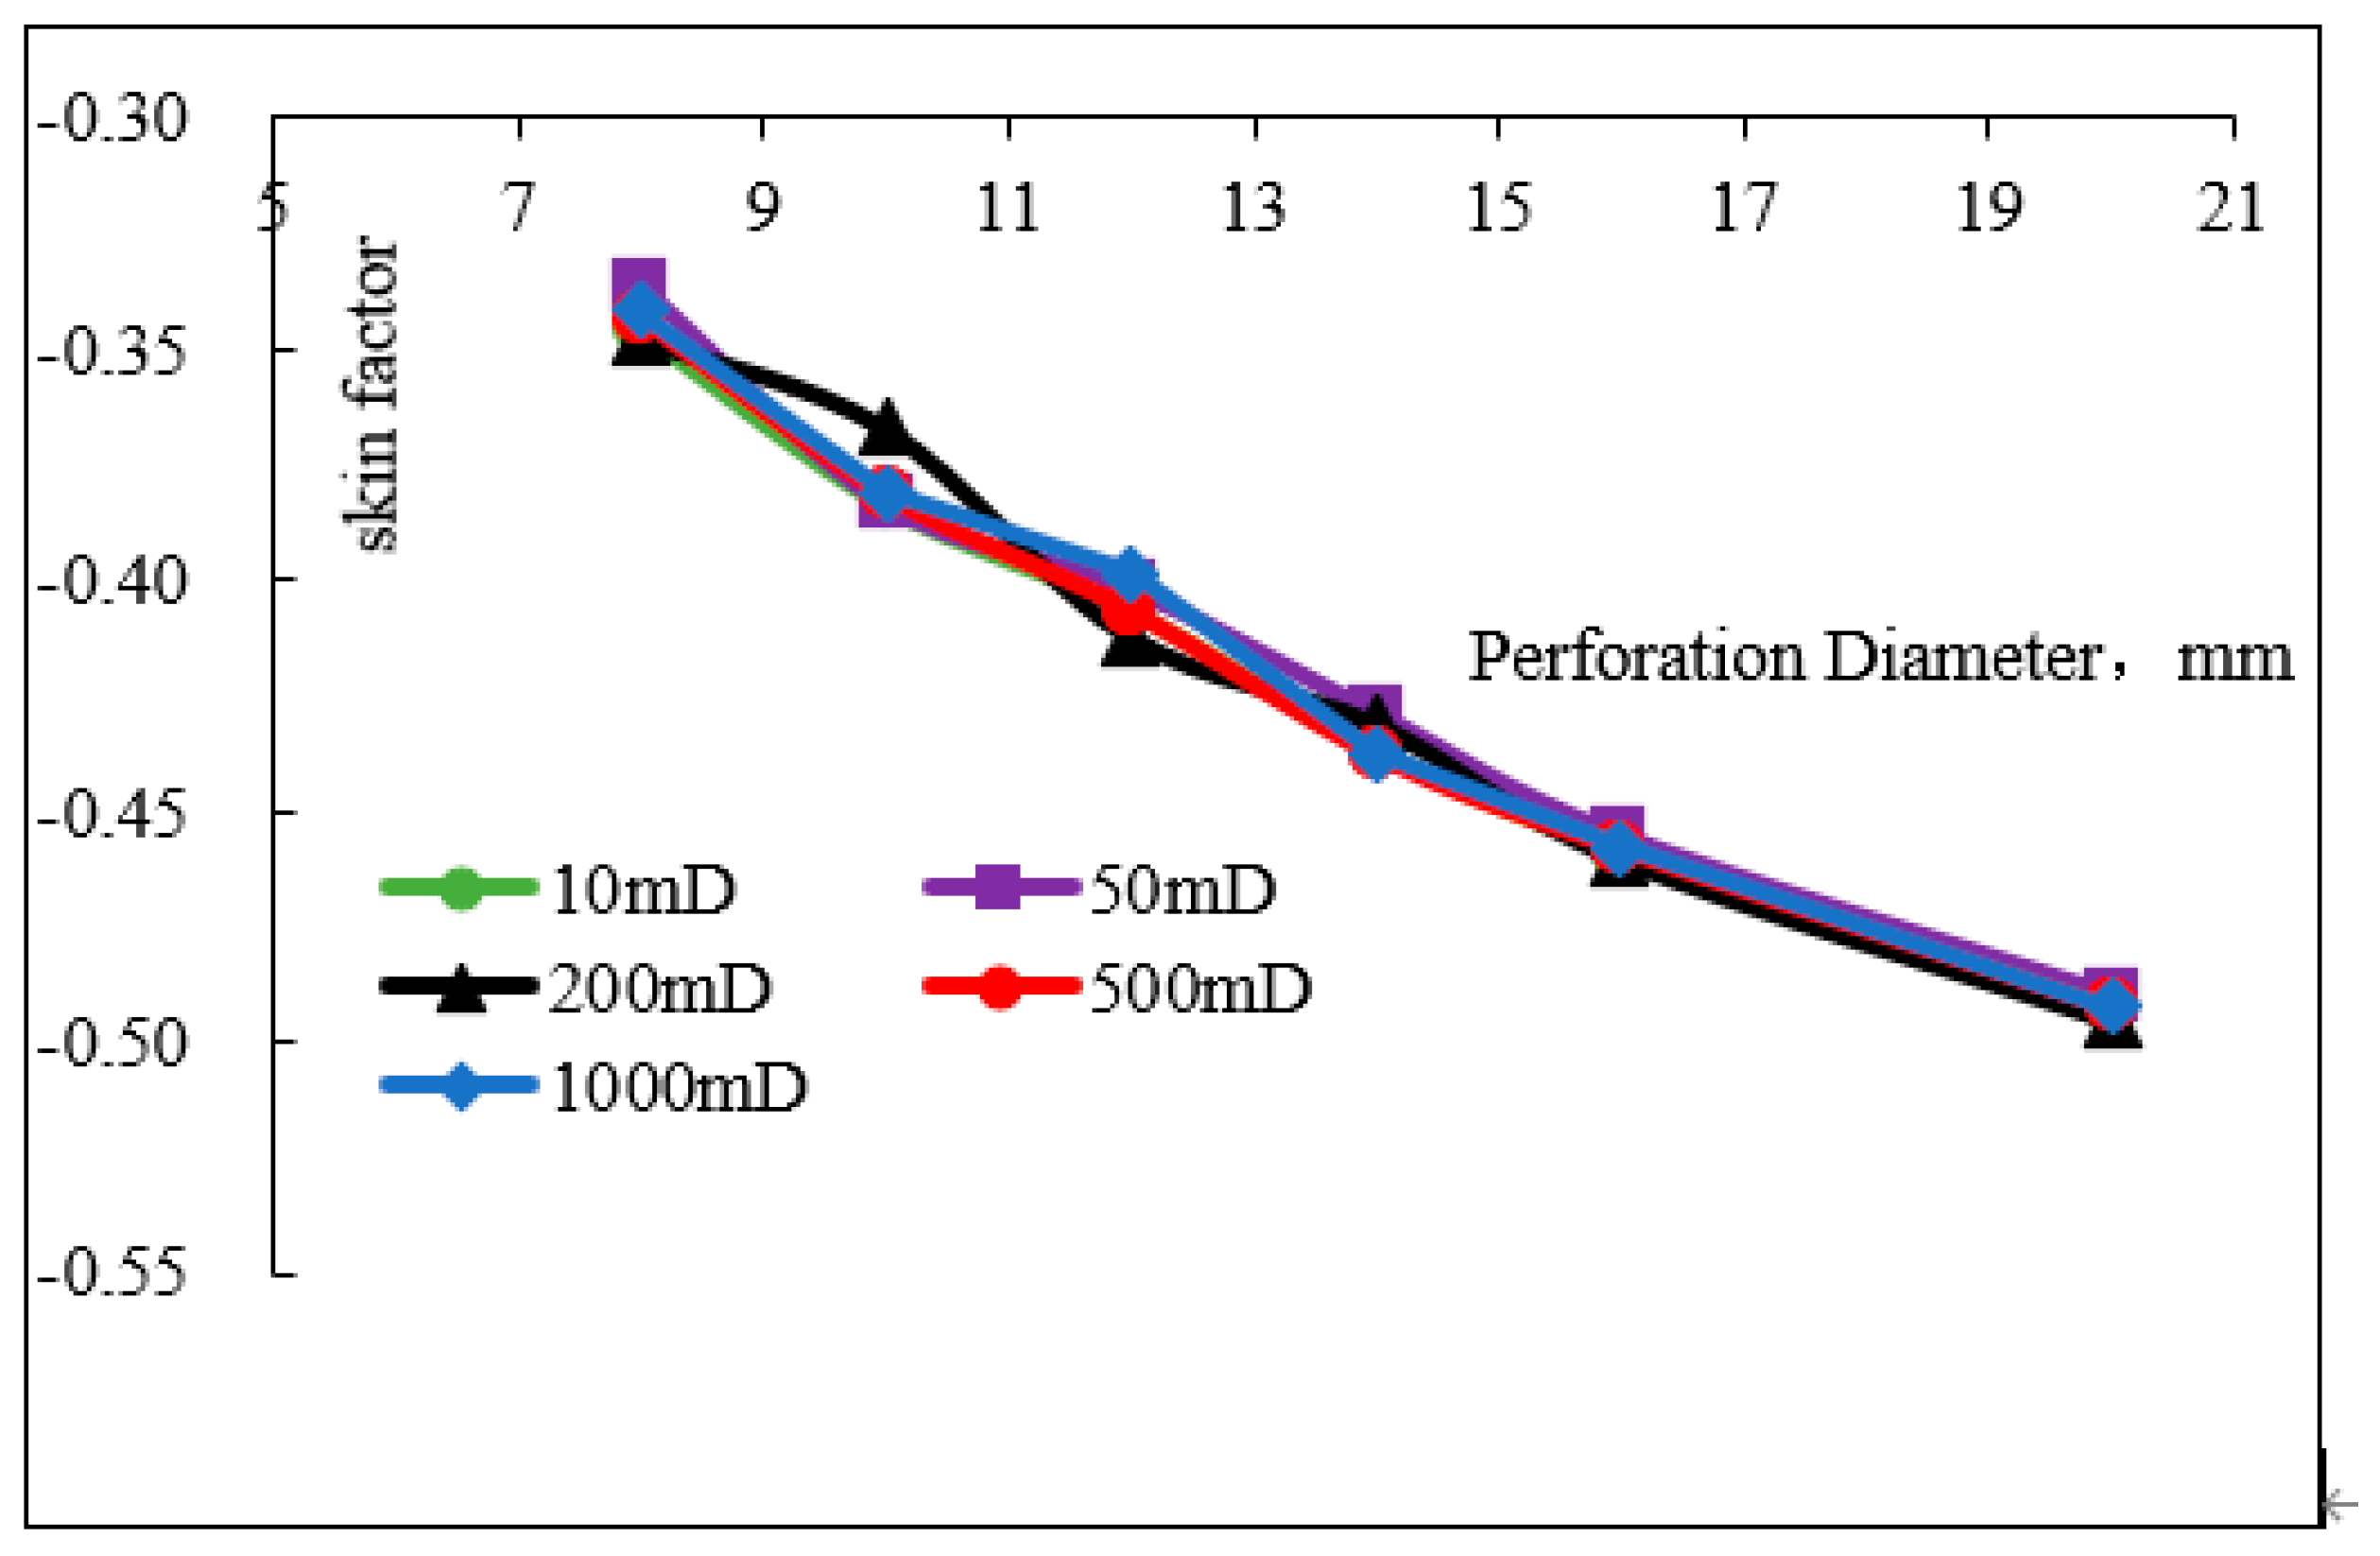
With all other parameters held constant and under a fixed production pressure differential of 10 MPa, the variations in wellhead flow rate at perforation diameters of 8 mm, 10 mm, 12 mm, 14 mm, 16 mm, and 20 mm are shown in Figure 8. The corresponding changes in skin factor for different perforation diameters, calculated using Equation (6), are presented in Figure 9.
As shown in Figure 10, the low-pressure zone near the wellbore gradually expands with increasing perforation diameter, indicating progressively reduced flow resistance—though the changes are not particularly pronounced.

3.4. Phase Angle Sensitivity Analysis

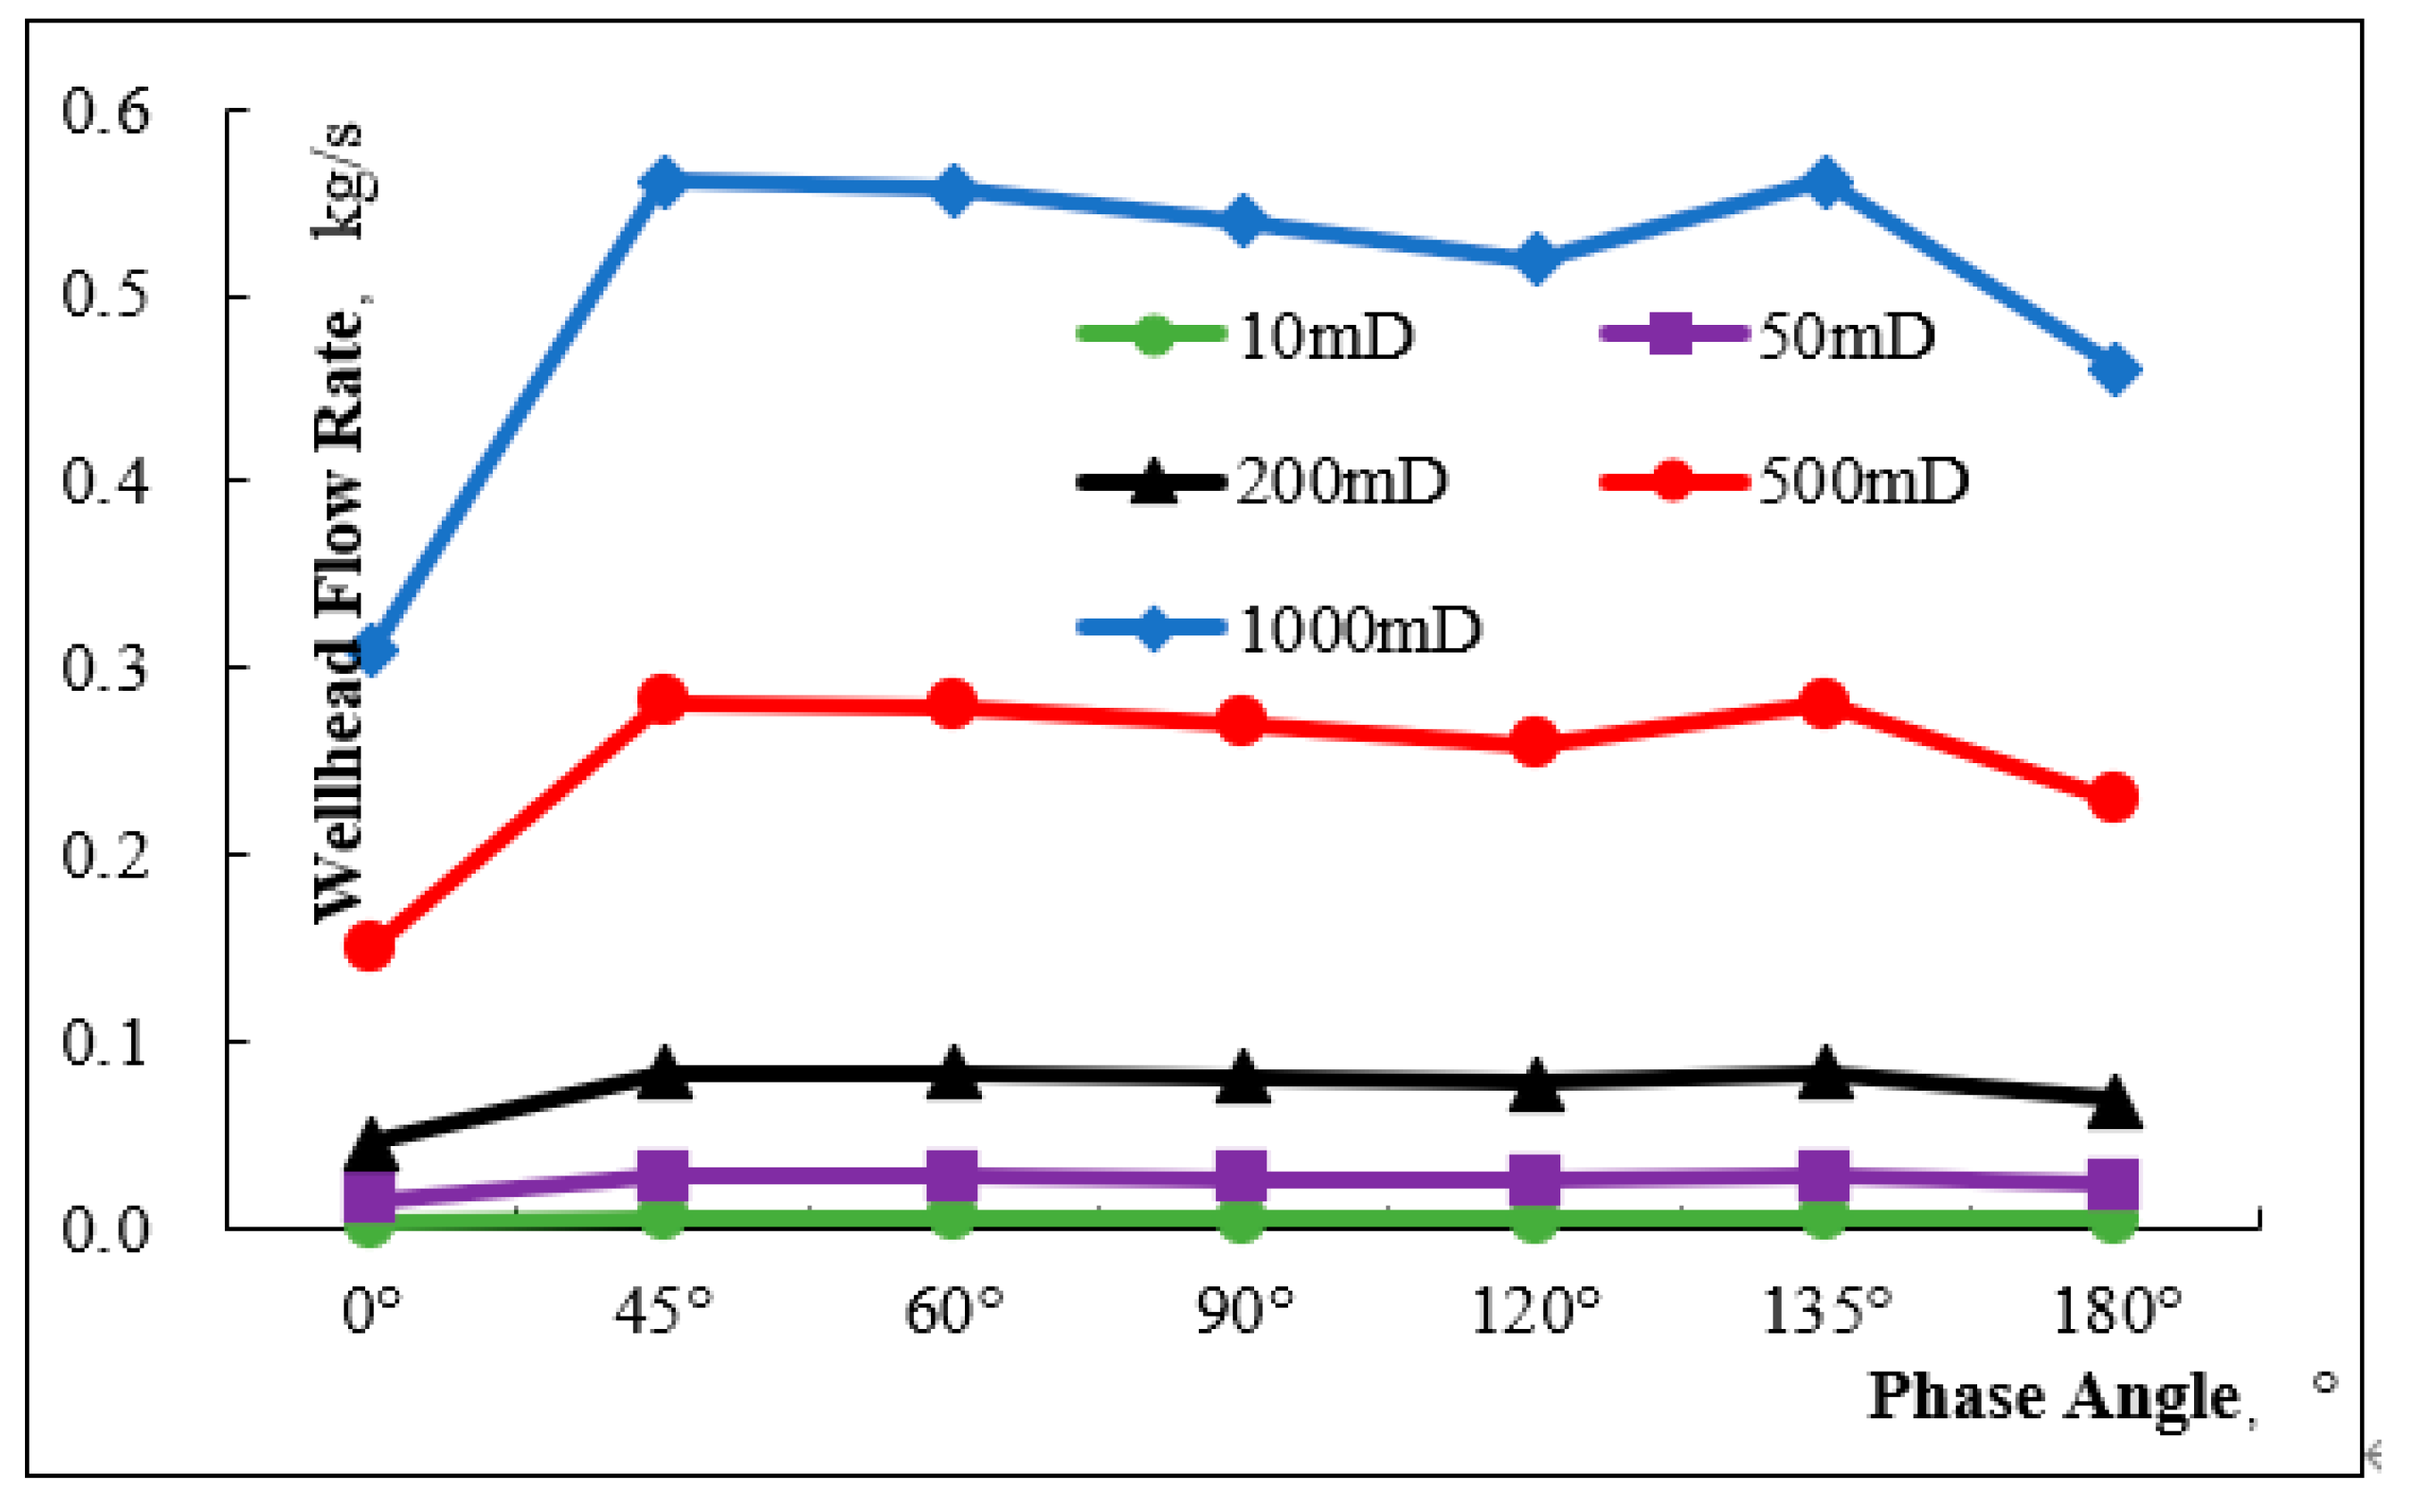
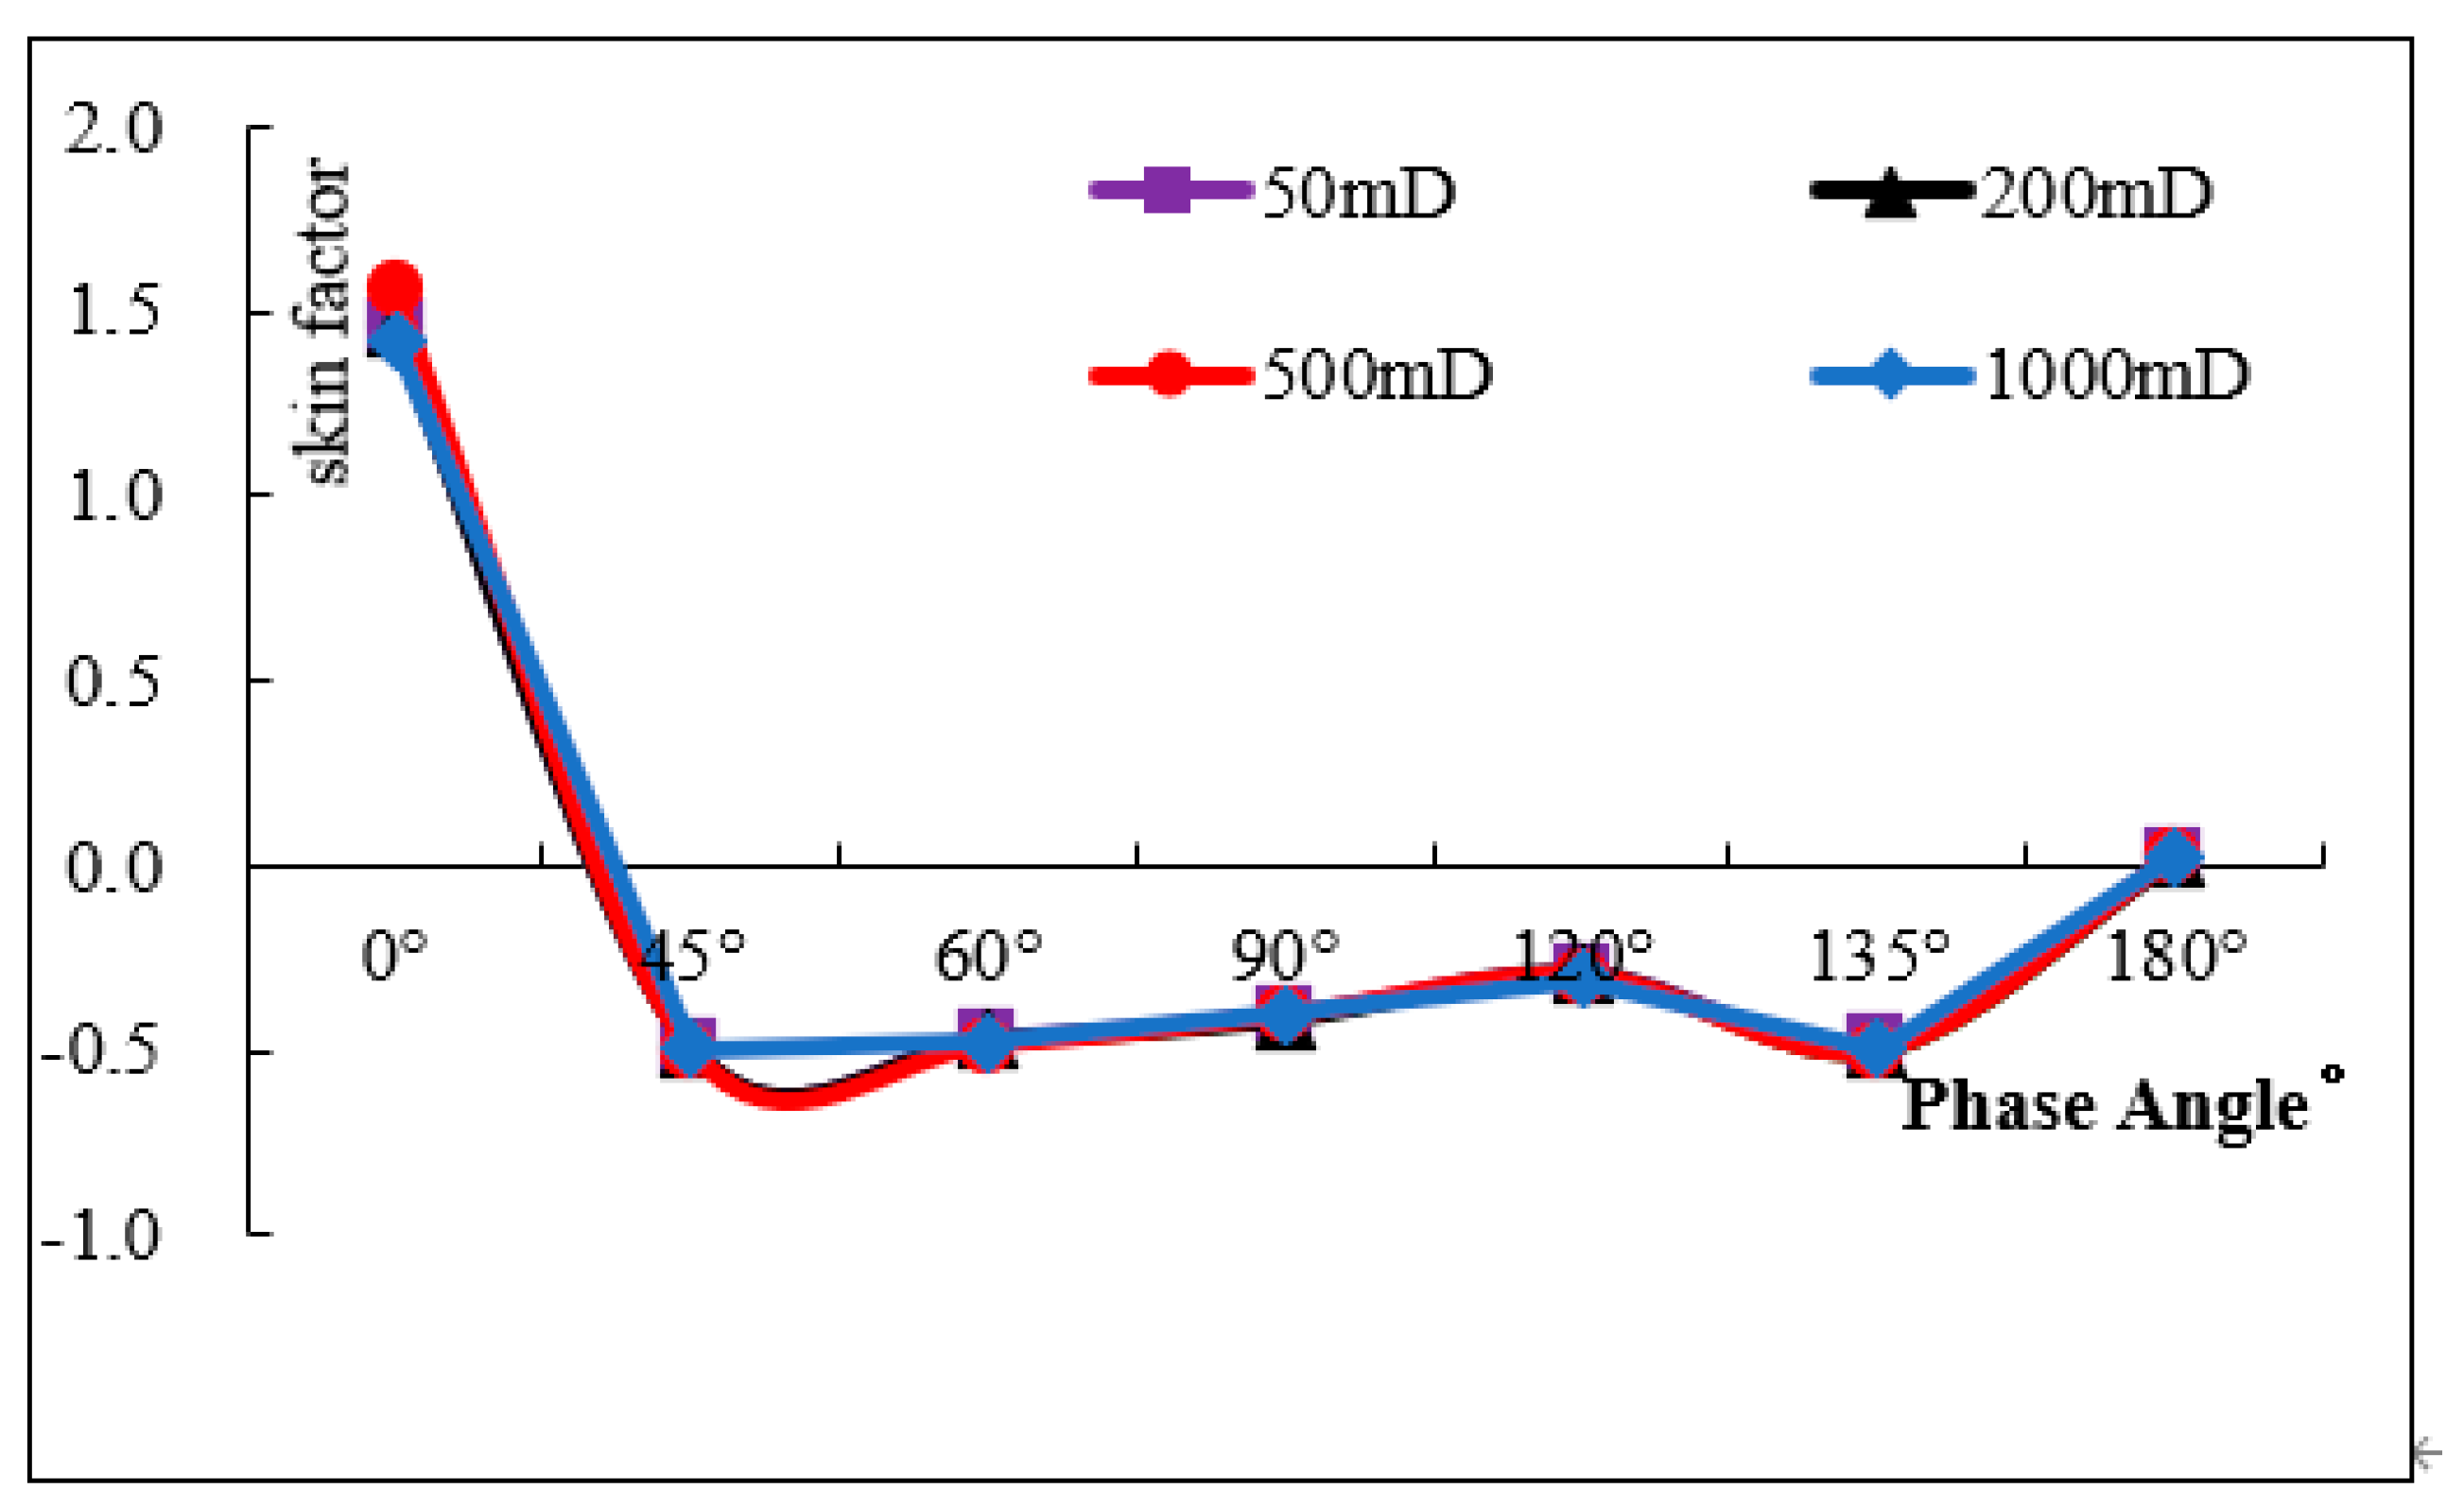
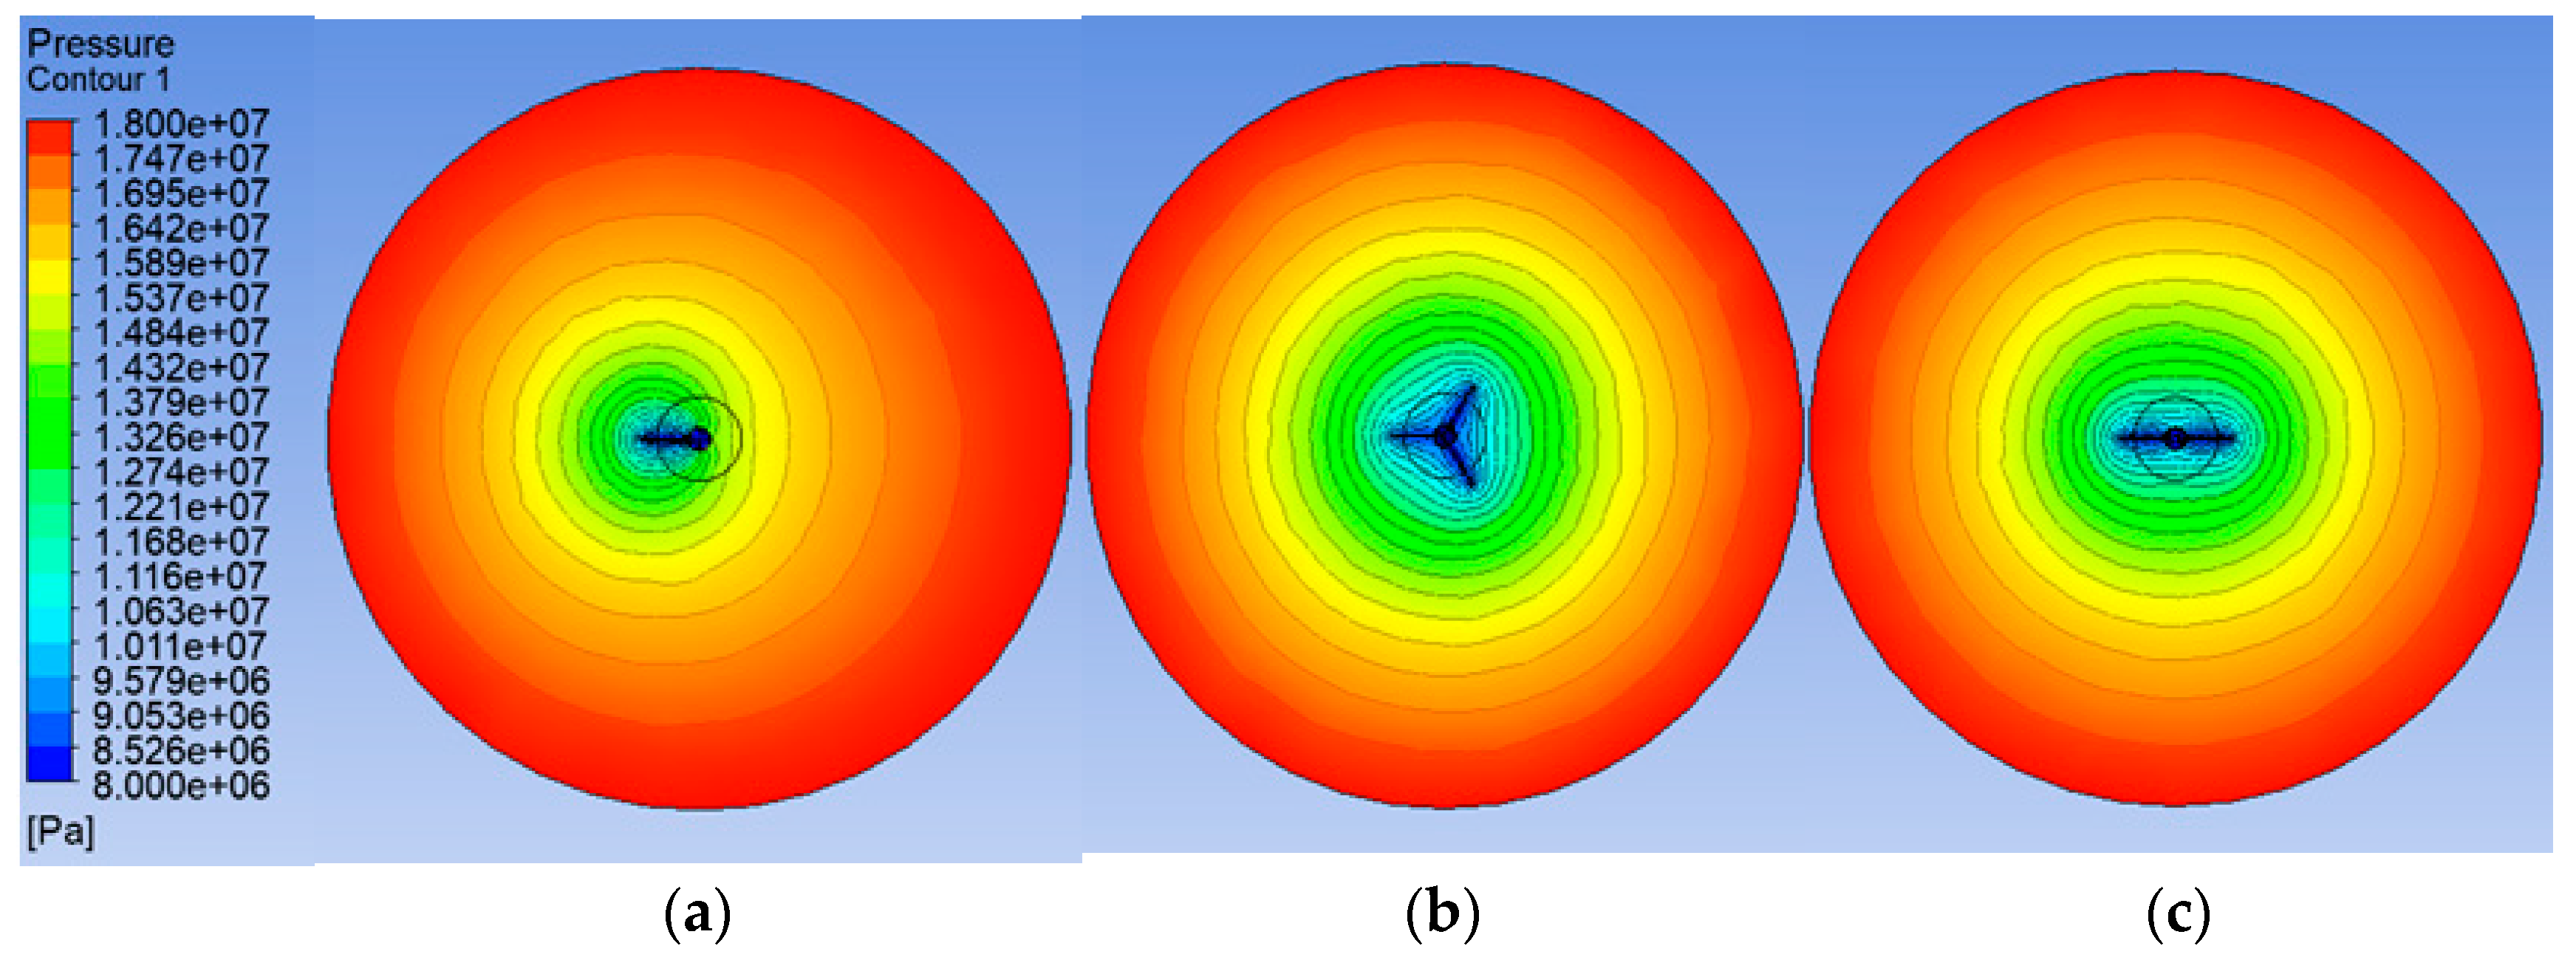
With all other parameters held constant and under a fixed production pressure differential of 10 MPa, the variations in wellhead flow rate at phase angles of 0°, 45°, 60°, 90°, 120°, 135°, and 180° are shown in Figure 11. The corresponding changes in skin factor under different phase angles, calculated using Equation (6), are presented in Figure 12. The circumferential perforation distance is jointly determined by the phase angle and the wellbore radius (given as 85 mm in Table 2). In the experiment, the phase angles ranging from 0° to 180° correspond to circumferential perforation distances of 0–170.0 mm: When the phase angles are 45°/135°, the circumferential perforation distances are 60.1 mm/156.1 mm, respectively. At this time, the distribution of the near-well low-pressure zone is more uniform (Figure 13b), the fluid convergence efficiency is higher, and the skin factor is lower. When the phase angle is 0°, the circumferential perforation distance is 0 mm (perforations coincide), and the pressure field is concentrated but prone to causing local damage to the wellbore. When the phase angle is 180°, the circumferential perforation distance is 170.0 mm (wellbore diameter), and the dispersed perforations lead to insufficient coverage of the pressure field, which is not conducive to fluid diversion.
It can be seen from Figure 13 that different perforation phase angles have a significant impact on the pressure field in the near-wellbore zone, and the morphology of the pressure field in the near-wellbore zone is directly affected by the morphology of the perforation phase.

4. Multi-Factor Analysis of Skin Factor in Conventional Perforation Completion Under Different Reservoir Conditions

The above content studies the single-factor sensitivity analysis of perforation parameters under different reservoir conditions. In actual production, the perfection of perforated wells is affected by multiple factors. Herein, an orthogonal experiment is designed to study the main controlling factors affecting the perfection of perforated wells.

4.1. Orthogonal Experiment and Gray Relational Analysis

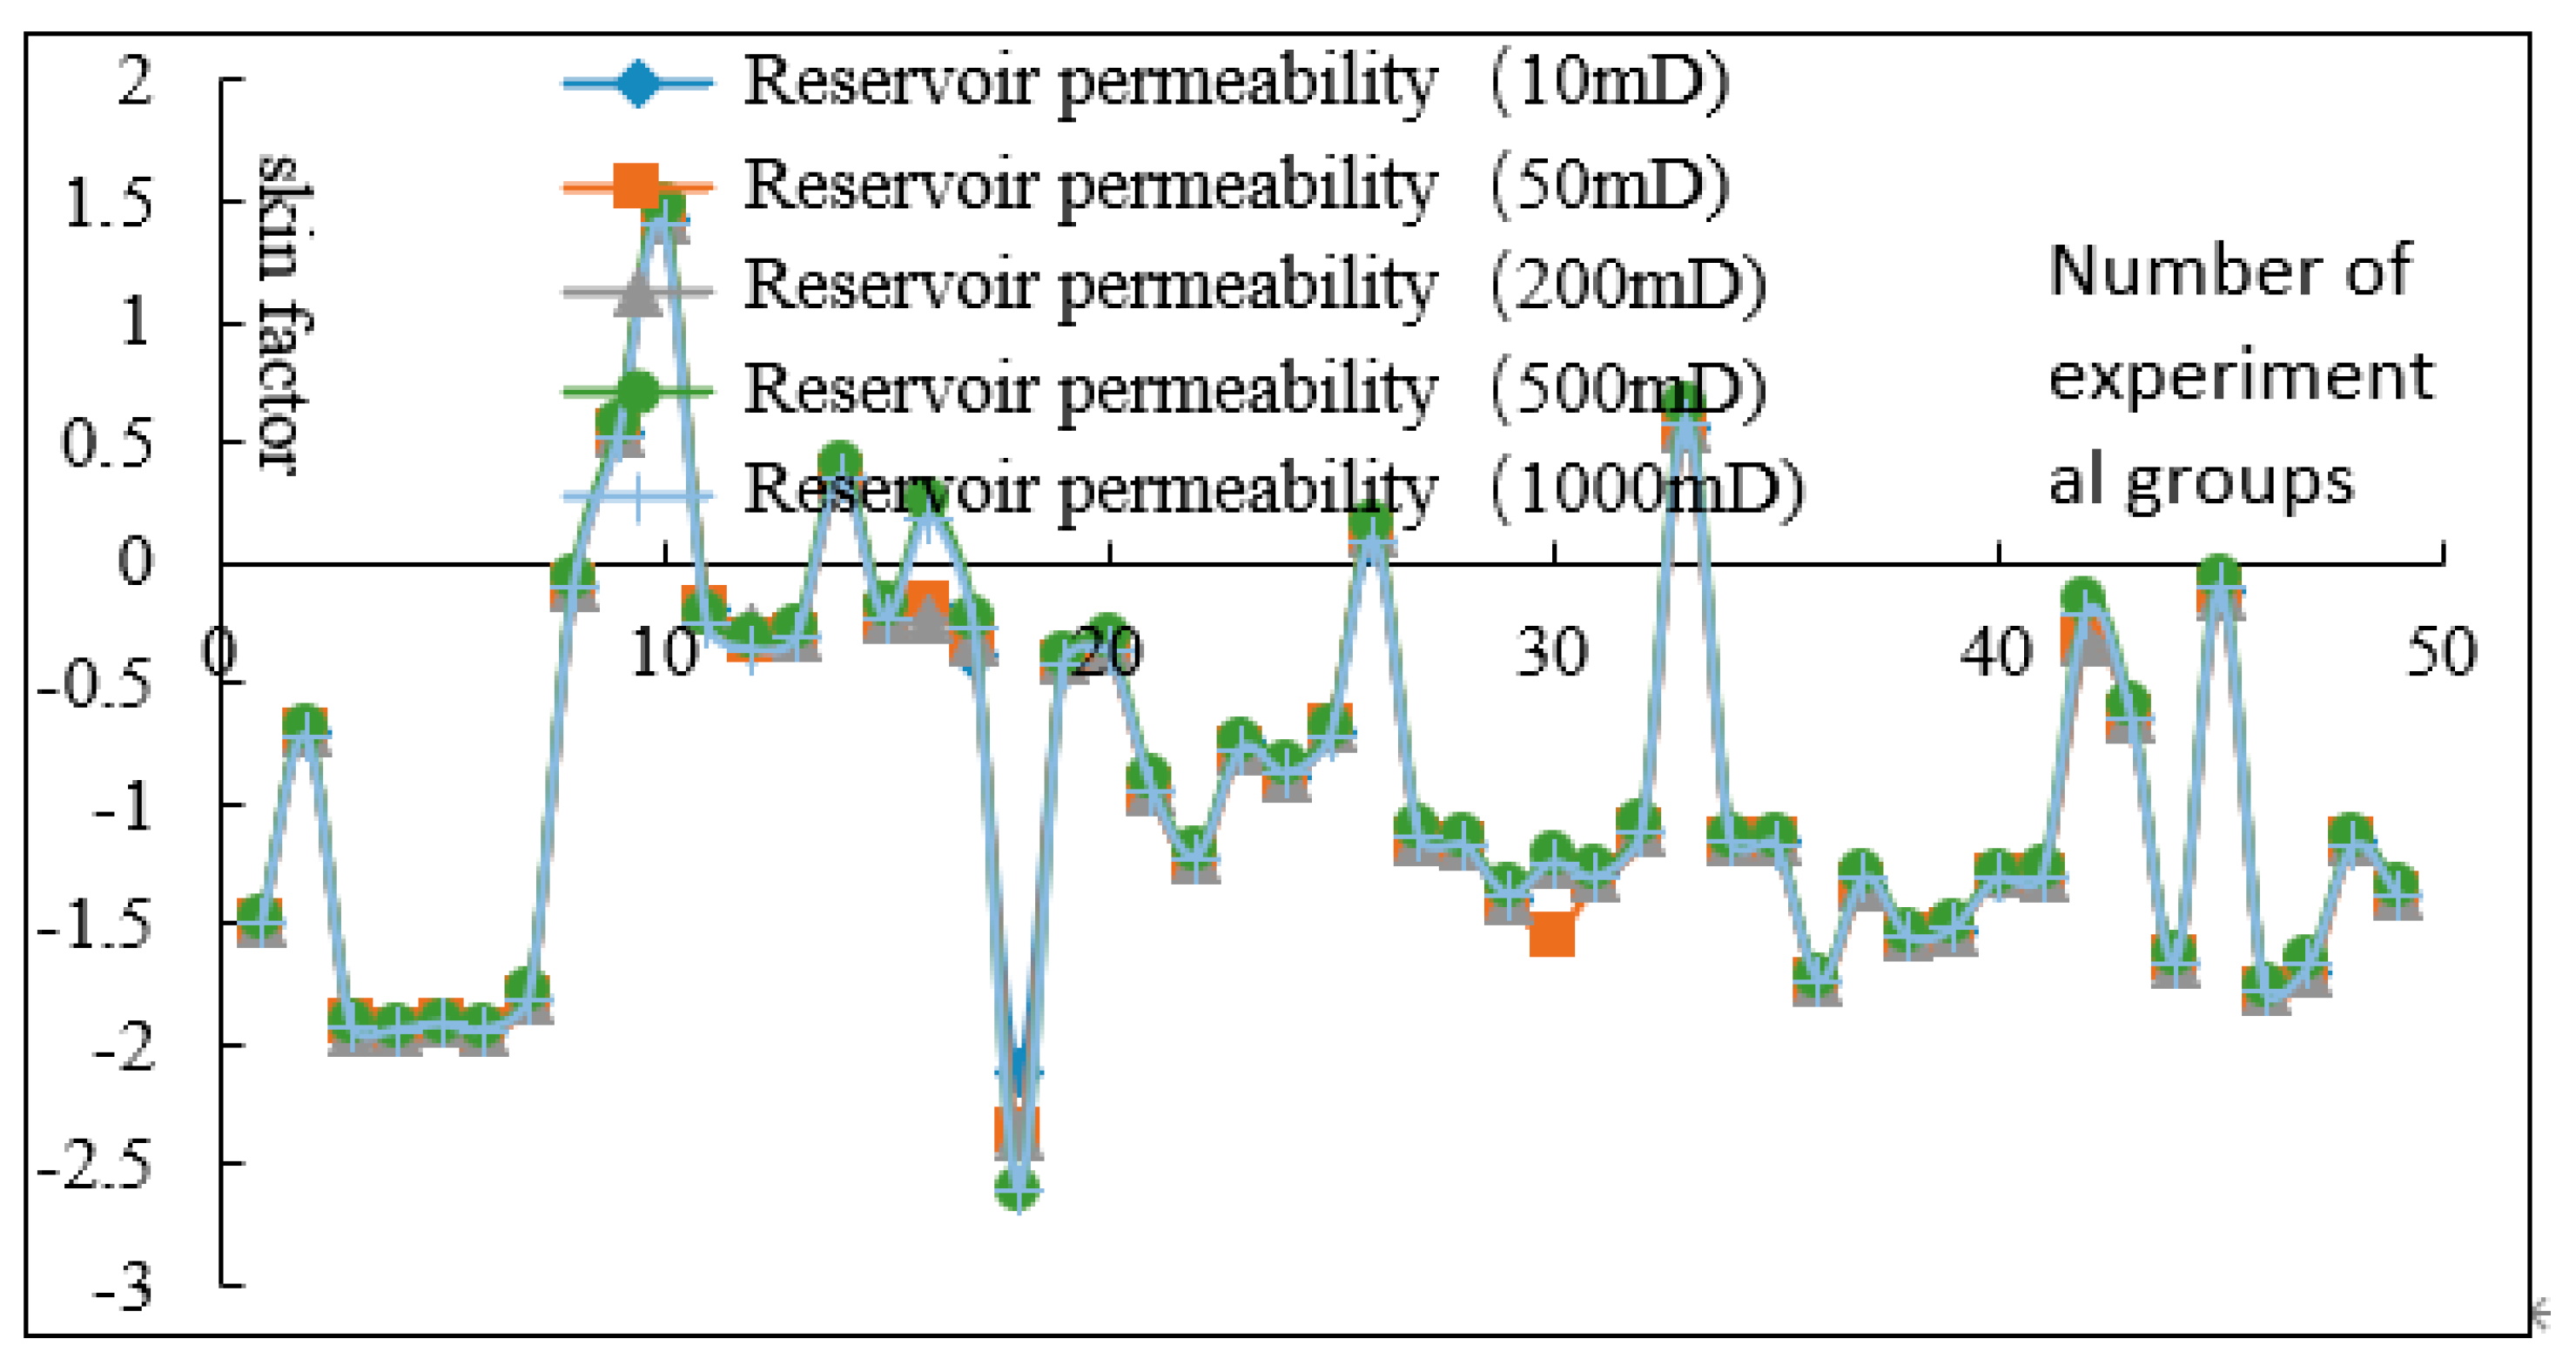
The orthogonal experimental table for conventional perforation completion with six factors and seven levels is designed as shown in Table 3. When the reservoir permeability is 1000 mD, the wellhead flow rates and skin factors corresponding to each orthogonal experiment are listed in Table 3. In this paper, the skin factors corresponding to each orthogonal experiment under the conditions of reservoir permeability being 10 × 10−3 μm2, 50 × 10−3 μm2, 200 × 10−3 μm2 and 500 × 10−3 μm2 are also calculated, as shown in Figure 14. It can be seen from the figure that the skin factor of the oil well under the influence of multiple factors is also independent of the reservoir permeability.
Based on the data in Table 3, the correlation coefficients of various factors to the oil well skin factor can be obtained by using the gray relational theory. The results of gray relational analysis (Table 4) show that the perforation density and phase angle are the third and second key factors affecting the skin factor, respectively. Essentially, the longitudinal and circumferential perforation distances indirectly affect the near-well flow resistance by changing the spatial distribution of diversion channels. Therefore, the perforation distance can be used as an intuitive reference index for optimizing the perforation scheme. Combined with the single-factor analysis of perforation parameters, the reasonable ranges of each parameter for conventional perforation completion in reservoirs with different permeabilities are shown in Table 5. During perforation operations, efforts should be made to increase the perforation depth; the optimal phase angles are 45°/135°; the perforation density should be greater than 36 holes per meter; and the perforation diameter has a relatively small impact on the oil well skin factor. In this orthogonal experiment, the perforation distance, as a derivative index of perforation density and phase angle, changes synchronously with the experimental parameters: The longitudinal perforation distance is calculated to be 16.7–50.0 mm from the perforation density (20–60 holes/m), and the circumferential perforation distance is calculated to be 0–170.0 mm from the phase angle (0–180°) and the wellbore radius (85 mm).

4.2. Regression Model of Skin Factor for Conventional Perforation Completion

Based on the data in Table 3, the least square method is used for linear fitting and nonlinear fitting of the data, respectively, to derive the quantitative formulas between each parameter and the oil well skin factor. Through calculation, the average error of linear fitting is 45.3%, and that of nonlinear fitting is 7.4%. Therefore, the nonlinear fitting formula is selected as the skin factor calculation model for conventional perforation completion. The statistical table of regression coefficients is shown in Table 6, and the nonlinear fitting formula is as shown in Equation (7):
S =   2 . 083 + i = 1 6 a i x i + i = 1 6 a i + 6 x 1 x i + i = 2 6 a i + 11 x 2 x i + i = 3 6 a i + 15 x 3 x i + i = 4 6 a i + 18 x 4 x i + i = 5 6 a i + 20 x 5 x i + i = 6 6 a i + 21 x 6 x i
where S is the skin factor; x1 is the perforation depth, mm; x2 is the perforation density, holes/m; x3 is the perforation diameter, mm; x4 is the depth of the damaged zone, mm; x5 is the damage degree of the damaged zone; x6 is the phase angle degree.

5. Conclusions and Insights

In this paper, a mathematical model for coupled flow of fluid is established, which considers the seepage in the near-well reservoir porous media and the Navier–Stokes equation in the perforation holes. The coupled flow model is solved using Fluent software. The following conclusions and insights are obtained during the research process.
(1) Through single-factor and multi-factor analyses of perforation parameters, it can be concluded that under the condition of fixed perforation parameters, reservoir permeability has no impact on the magnitude of the perforation skin factor.
(2) The gray correlation coefficients of perforation parameters to the oil well skin factor, in descending order, are perforation depth, phase angle, perforation density, and perforation diameter. From the single-factor analysis, it can be concluded that during perforation operations, efforts should be made to increase the perforation depth; the optimal phase angles are 45°/135°; the perforation density should be greater than 36 holes per meter; the optimal perforation distance is 27.8 mm; and the perforation diameter has a relatively small impact on the oil well skin factor.
(3) A nonlinear quantitative relationship between various parameters and the oil well skin factor was established using the least square method, providing a theoretical basis for the optimal design of oil well perforation parameters.

Author Contributions

Conceptualization, Z.M., M.C., S.Y., J.L., G.L., Y.L., S.Z., Z.R. and C.Z.; Methodology, Z.M., M.C., G.L., Y.L., S.Z., Z.R. and C.Z.; Software, Z.M., M.C., Y.L., S.Z., Z.R. and C.Z.; Validation, Z.M. and C.Z.; Formal analysis, Z.M., M.C., S.Y., J.L., G.L., S.Z. and Z.R.; Investigation, Z.M., M.C., S.Y., J.L., G.L., S.Z. and Z.R.; Resources, Z.M., J.L., Z.R. and C.Z.; Data curation, J.L., Z.R. and C.Z.; Writing—original draft, M.C. and S.Y.; Writing—review & editing, M.C. and S.Y.; Supervision, Z.R. All authors have read and agreed to the published version of the manuscript.

Funding

This research received no external funding.

Institutional Review Board Statement

Not applicable.

Informed Consent Statement

Not applicable.

Data Availability Statement

The original contributions presented in the study are included in the article, further inquiries can be directed to the corresponding author.

Conflicts of Interest

Authors Zhongguo Ma, Sen Yang and Gang Liu were employed by the company Shaanxi Yanchang Petroleum (Group) Co., Ltd. Author Chao Zhang was employed by the company Qingdao Jerry Industrial Control Technology Co., Ltd. The remaining authors declare that the research was conducted in the absence of any commercial or financial relationships that could be construed as a potential conflict of interest.

References

  1. Muskat, M. The Effect of Casing Perforations on Well Productivity. Pet. Technol. 1942, 151, 175–187. [Google Scholar] [CrossRef]
  2. McDowell, J.M.; Muskat, M. The Effect on Well Productivity of Formation Penetration Beyond Perforated Casing. Pet. Trans. AIME 1950, 189, 309–312. [Google Scholar] [CrossRef]
  3. Harris, M.H. The Effect of Perforating on Well Productivity. J. Pet. Technol. 1966, 18, 518–528. [Google Scholar] [CrossRef]
  4. Tariq, S.M. Evaluation of Flow Characteristics of Perforations Including Nonlinear Effects with the Finite-Element Method. SPE Prod. Eng. 1987, 2, 104–112. [Google Scholar] [CrossRef]
  5. Tariq, S.M.; Ichara, M.J.; Ayestaran, L. Performance of Perforated Completions in the Presence of Anisotropy, Laminations, or Natural Fractures. SPE Prod. Eng. 1989, 4, 376–384. [Google Scholar] [CrossRef]
  6. Karakas, M.; Tariq, S.M. Semianalytical Productivity Models for Perforated Completions. SPE Prod. Eng. 1991, 6, 73–82. [Google Scholar] [CrossRef]
  7. Lang, Z.; Zhang, L.; Gao, H. Numerical simulation study on CO2 huff and puff development of heavy oil reservoirs. J. Pet. Univ. Nat. Sci. Ed. 2000, 24, 37–40. [Google Scholar]
  8. Tang, Y.; Pan, Y.; Zhu, J. Finite Element Numerical Simulation Study on Perforation Completion of Gas Wells with Non-Darcy Flow. J. Southwest Pet. Inst. 2006, 2–140. [Google Scholar]
  9. Yildiz, T. Assessment of Total Skin Factor in Perforated Wells. SPE Reserv. Eval. Eng. 2006, 9, 61–76. [Google Scholar] [CrossRef]
  10. Yildiz, T.; Langlinais, J.P. Calculation of Pressure Losses Across Gravel Packs. In Proceedings of the SPE Formation Damage Control Symposium, Bakersfield, CA, USA, 8–9 February 1988; [SPE 17167]. Society of Petroleum Engineers: Richardson, TX, USA, 1988. [Google Scholar]
  11. Sun, D.; Li, B.; Gladkikh, M.; Satti, R.; Evans, R. Comparison of Skin Factors for Perforated Completions Calculated with Computational-Fluid-Dynamics Software and the Karakas-Tariq Semianalytical Model. SPE Drill. Complet. 2013, 28, 21–33. [Google Scholar] [CrossRef]
  12. Sun, D.; Li, B.; Gladkikh, M.; Satti, R.; Evans, R. Comparison of Skin Factors for Perforated Completions Calculated with Computational Fluid Dynamics Software and a Semi-Analytical Model. In Proceedings of the SPE European Formation Damage Conference, Noordwijk, The Netherlands, 7–10 June 2011; SPE 143663. Society of Petroleum Engineers: Richardson, TX, USA, 2011. [Google Scholar]
  13. Sun, D.; Satti, R.; Ochsner, D.; Sampson, T.; Li, B.; Gladkikh, M. Experimental and Computational Study of Flow Characteristics in a Drilled Perforated Core. In Proceedings of the SPE International Symposium and Exhibition on Formation Damage Control, Lafayette, LA, USA, 15–17 February 2012; SPE 151113. Society of Petroleum Engineers: Richardson, TX, USA, 2012. [Google Scholar]
  14. Li, B.; Sun, D.; Satti, R. Statistical Analysis of Significant Factors Affecting Perforation Flow at Well Scale. In Proceedings of the SPE International Symposium and Exhibition on Formation Damage Control, Lafayette, LA, USA, 15–17 February 2012; [SPE 150122]. Society of Petroleum Engineers: Richardson, TX, USA, 2012. [Google Scholar]
  15. Velayati, A.; Roostaei, M.; Fattahpour, V.; Mahmoudi, M.; Nouri, A.; Alkouh, A.; Fermaniuk, B.; Kyanpour, M. Design Optimization of Slotted Liner Completions in Cased and Perforated Wells: A Numerical Skin Model. In Proceedings of the SPE International Heavy Oil Conference and Exhibition (SPE-193670-MS), Kuwait City, Kuwait, 10–12 December 2018; Society of Petroleum Engineers: Richardson, TX, USA, 2018. [Google Scholar]
  16. API SPEC 5CT-2021; Specification for Casing and Tubing. American Petroleum Institute: Washington, DC, USA, 2021; pp. 2–5.
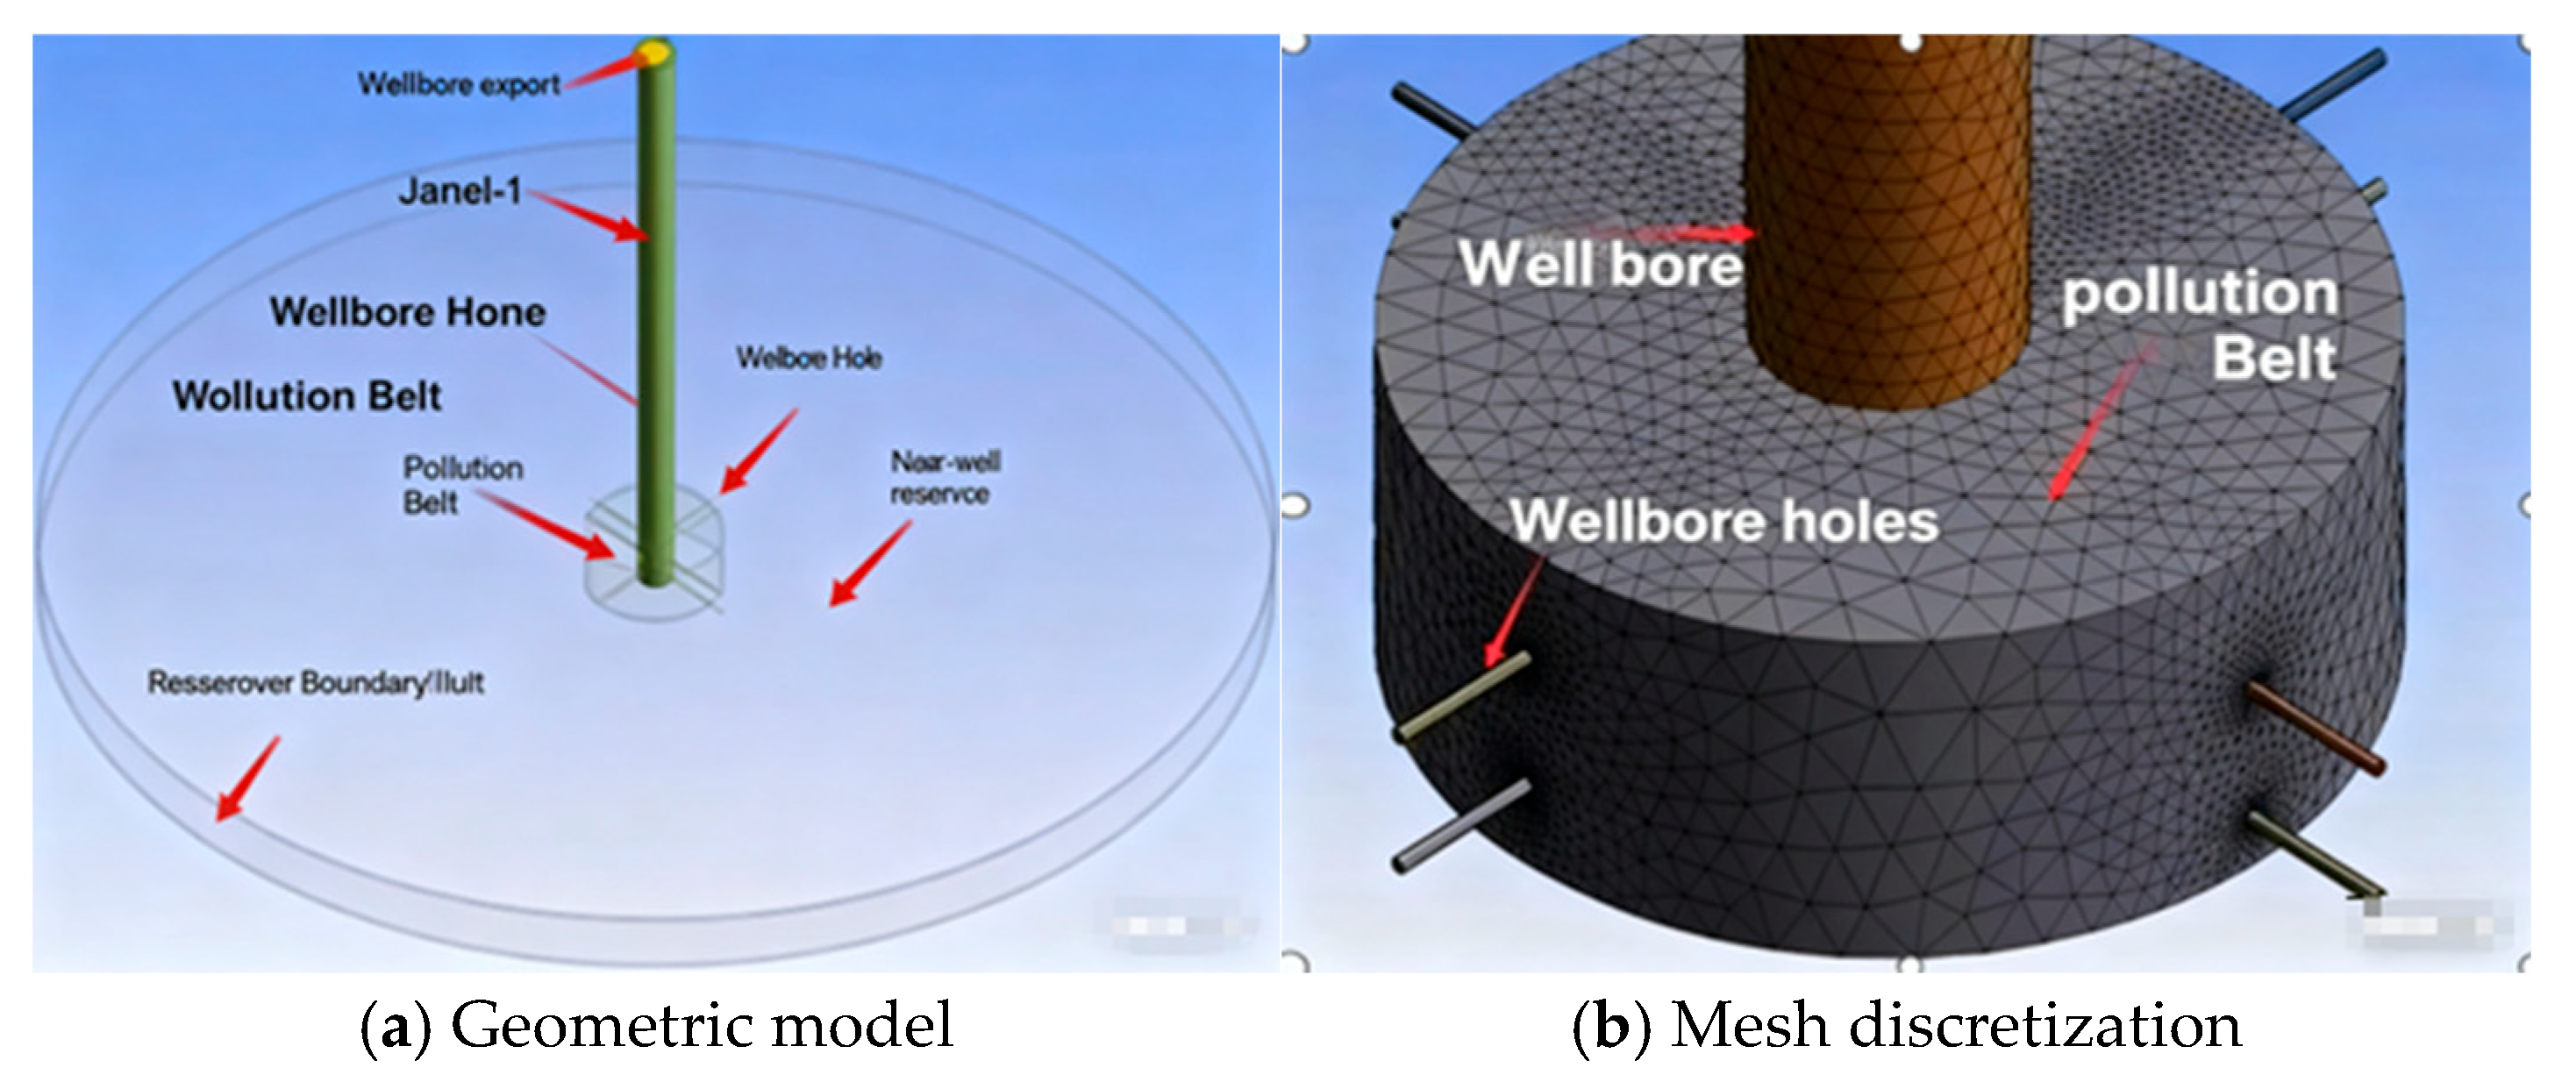
Figure 1. Schematic diagram of reservoir fluid flow in perforation completion.
Applsci 15 12616 g001
Figure 2. Graph of the relationship between perforation depth and wellhead flow rate under different reservoir conditions.
Applsci 15 12616 g002
Figure 3. Relationship between perforation depth and skin factor under different reservoir conditions.
Applsci 15 12616 g003
Figure 4. Planar pressure fields at different perforation depths. (a) Pressure field at 200 mm perforation depth; (b) pressure field at 500 mm perforation depth; (c) pressure field at 1000 mm perforation depth.
Applsci 15 12616 g004
Figure 5. Relationship between shot density and wellhead flow rate under different reservoir conditions.
Applsci 15 12616 g005
Figure 6. Relationship between shot density and skin factor under different reservoir conditions.
Applsci 15 12616 g006
Figure 7. Planar pressure fields at different shot densities. (a) Pressure field at 20 shots/m; (b) pressure field at 32 shots/m; (c) pressure field at 60 shots/m.
Applsci 15 12616 g007
Figure 8. Relationship between perforation diameter and wellhead flow rate under different reservoir conditions.
Applsci 15 12616 g008
Figure 9. Relationship Between Perforation Diameter and Skin Factor Under Different Reservoir Conditions.
Applsci 15 12616 g009
Figure 10. Planar pressure fields at different perforation diameters. (a) Pressure field at 8 mm perforation diameter; (b) pressure field at 12 mm perforation diameter; (c) pressure field at 20 mm perforation diameter.
Applsci 15 12616 g010
Figure 11. Relationship between phase angle and wellhead flow rate under different reservoir conditions.
Applsci 15 12616 g011
Figure 12. Relationship between phase angle and skin factor under different reservoir conditions.
Applsci 15 12616 g012
Figure 13. Planar pressure fields at different phase angles. (a) Pressure field at 0° phase angle; (b) pressure field at 60° phase angle; (c) pressure field at 180° phase angle.
Applsci 15 12616 g013
Figure 14. Statistical chart of skin factors corresponding to each orthogonal experiment under different reservoir conditions.
Applsci 15 12616 g014
Table 1. Reservoir classification criteria.
Reservoir
Classification
High-Permeability ReservoirMedium-Permeability ReservoirLow-Permeability Reservoir
Conventional Low-PermeabilityExtra-Low
Permeability
Ultra-Low
Permeability
Permeability 10−3 um2>50050–50010–501–100.1–1
Table 2. Statistical table of perforation completion parameters and other reservoir parameters.
Perforation Depth/mmShot
Density Shots/m
Perforation Diameter/mmPhasing
Angle/°
Formation Thickness/mDamage
Radius/mm
Damage
Radius/mpas
Crude
Density kg/m3
Wellbore
Radius/mm
Near-Well Outer Radius/
mm
500401090128010880853000
Table 3. Orthogonal experimental table for multi-factor analysis of conventional perforation completion.
No.Perforation Depth/mmPerforation
Density/Holes/m
Perforation
Diameter/mm
Damage Zone Depth/mmDamage
Degree of Damage Zone
Phase
Angle/
Degree
Reservoir Permeability Is 1000 mD
Wellhead Flow Rate/kg/sSkin
Factor
11600601650011800.97−1.498
2160020143300.900.62−0.728
316002881900.74451.41−1.921
41600326500.58601.44−1.941
5160036104000.421351.40−1.917
6160052162600.26901.44−1.939
7160044121200.11201.25−1.805
830060141900.261200.48−0.110
9300208500.11800.390.517
10300286400100.311.400
1130032102600.9450.51−0.260
1230036161200.74600.53−0.362
1330052125000.581350.52−0.312
1430044203300.42900.410.351
155006084000.58900.51−0.231
165002062600.421200.440.189
1750028101200.261800.51−0.276
1850032165000.105.06−2.603
1950036123301450.55−0.424
2050052161900.9600.53−0.365
215004414500.741350.69−0.939
227006061200.91350.81−1.221
2370020105000.74900.64−0.776
2470028163300.581200.67−0.876
2570032121900.421800.62−0.726
267003620500.2600.450.094
2770052144000.1450.77−1.140
287004482601600.79−1.173
2990060103300.1600.90−1.380
30900201619011350.82−1.250
319002812500.9900.85−1.306
3290032204000.741200.76−1.113
3390036142600.581800.390.586
349005281200.4200.78−1.162
359004465000.26450.78−1.165
3611006016500.42451.18−1.737
37110020124000.26600.86−1.311
38110028202600.11351.02−1.557
39110032141201900.99−1.519
4011003685000.91200.86−1.313
4111005263300.741800.85−1.305
42110044101900.5800.50−0.209
43140060122600.7400.60−0.642
44140020201200.58451.10−1.655
45140028145000.42450.48−0.109
4614003283300.261351.23−1.782
4714003661900.1901.11−1.672
48140052105011200.79−1.179
49140044164000.91800.90−1.382
Table 4. Statistical table of multi-factor gray relational analysis for conventional perforation completion.
ParametersPerforation Depth/mmPhase
Angle/°
Perforation
Density/Holes/m
Perforation
Diameter/mm
Contamination
Degree of the
Damaged Zone
Depth of the Damaged Zone/mm
Correlation coefficient0.8900.8120.7600.7230.7050.700
Ranking123456
Table 5. Reasonable ranges of each parameter for conventional perforation completion in different reservoirs.
ParametersPerforation Depth/mmPhase Angle/°Perforation Density/Holes/mPerforation Diameter/mm
Reasonable rangeDeep penetration45/135More than 36 holes/mHave little impact
Table 6. Statistical table of regression coefficients.
a1–1012345678910
−0.004−0.2120.42410.0115−3.261−0.0251 × 10⁻⁶−2 × 10−56 × 10−5−5 × 10⁻⁶
a11–2011121314151617181920
0.00131 × 10−50.0019−0.0067 × 10−60.27720.0002−0.0110.0001−0.014
a21–3021222324252627282930
−0.001−3 × 10−60.0033−7 × 10⁻⁵−3.2200.02050.0001
Disclaimer/Publisher’s Note: The statements, opinions and data contained in all publications are solely those of the individual author(s) and contributor(s) and not of MDPI and/or the editor(s). MDPI and/or the editor(s) disclaim responsibility for any injury to people or property resulting from any ideas, methods, instructions or products referred to in the content.