Abstract
Hybrid electric vehicles (HEVs) frequently cycle their internal combustion engines (ICE), potentially cooling the three-way catalyst (TWC). This challenges the use of compressed natural gas (CNG), as methane (CH4) requires high temperatures for TWC oxidation. This study experimentally investigates the performance, engine-out emissions (CO, NOx, CH4, NMHC, CO2), and catalyst temperatures of a Toyota RAV4 hybrid vehicle on gasoline (G), CNG, and dual fuel (MIX) during the WLTC. Engine-out emissions were measured upstream of the TWC. Results showed similar engine work output (~17.8 kWh/100 km), while CNG significantly reduced fuel mass consumption (−18.7%) and CO2 emissions (−27.5%) compared to gasoline, driven by both its higher LHV and higher average BTE. CO (−32.3%) and NOx (−34.0%) emissions were lower with CNG, linked to leaner operation and significantly retarded ignition timing for NOx control. However, CH4 emissions drastically increased with CNG. This study reveals a synergy between the same retarded ignition timing strategy used to successfully control engine-out NOx (−34.0%) and created a positive secondary effect, raising pre-TWC temperatures by 4.5%. Higher thermal condition is essential for the aftertreatment of chemically stable methane, highlighting a direct link between the engine’s NOx control logic and the potential to mitigate methane slip.
1. Introduction
The transport sector is a significant contributor to global emissions, accounting for approximately one quarter of direct carbon dioxide (CO2) emissions from fuel combustion [], and within the European Union, it is the only economic sector where greenhouse gas (GHG) emissions have increased since 1990, now accounting for 28% of the Union’s total GHGs []. Methane (CH4), the primary component of natural gas, is a potent greenhouse gas with a global warming potential (GWP) that is significantly higher than that of CO2 []. Utilizing CH4 as a fuel in internal combustion engines (ICE) offers a potential environmental impact on the transport sector []. Natural-gas-powered vehicles can provide lower fuel consumption and CO2 emissions compared to gasoline or diesel, primarily due to the higher hydrogen to carbon ratio of methane []. Previous researchers have shown that operating an internal combustion engine on natural gas can significantly improve energy efficiency and lower emissions compared to gasoline, with reported decreases in brake-specific fuel consumption (BSFC) of up to 20% and CO2 emissions of up to 25% [,]. More recent studies, specifically assessing emissions under dynamic Worldwide Harmonized Light Vehicles Test Procedure (WLTP) conditions, confirm CO2 reductions but also highlight the critical trade-off of high CH4 emissions, which impacts the overall CO2-equivalent benefit and underscores the need for optimized catalytic converters [].
Hybrid electric vehicles (HEVs), with an integrated internal combustion engine and one or more electric machines, are becoming more attractive due to their lower emissions and increased fuel economy []. To realize this potential, many current hybrids utilize the Atkinson cycle, which improves engine thermal efficiency by employing a longer expansion stroke than compression stroke and allows for a more complete conversion of heat into mechanical work before the exhaust valve opens, ultimately yielding better overall fuel economy [,,]. However, the New European Driving Cycle (NEDC) was long considered to be non-representative of real-world conditions [,] and it has been replaced by the WLTP, which was designed to be more accurate [,]. WLTP’s stricter conditions caused an average 21% increase in certified CO2 emissions [,]. The test’s higher dynamism impacts the effectiveness of fuel-saving technologies, where HEVs may encounter more difficulties than conventional powertrains []. Indeed, recent studies continue to evaluate the complex energy and environmental performance of hybrid vehicles according to WLTP, analyzing the influence of battery energy utilization, and specific control strategies on the final emissions and efficiency [].
The dual-fuel technology of gasoline and compressed natural gas is a potential option to enhance engine performance []. This method can improve the fuel conversion efficiency, obtain high thermal efficiencies, and have a performance of no less than those of dedicated gasoline engines (especially the reaction in break mean effective pressure (BMEP)), through adjusting such parameters as CNG injection amount and ignition advance angle [,]. For example, some investigations indicate that CNG use results in a 15% reduction in fuel consumption and a 3–5% increase in brake thermal efficiency. These improvements are caused in part by better combustion behavior and improved phasing, because the higher knock resistance of CNG is advantageous at high loads [,].
Other than performance, dual-fuel mode can have environmental advantages for carbon monoxide (CO) and hydrocarbon (HC) emissions under certain conditions compared to only gasoline when operating under stoichiometric conditions []. However, this approach presents a complex set of trade-offs. The reductions tend to vary, depending upon the fuel blend and the injection strategy, often with a nitrogen oxide (NOx) emission increase; however, the latter can be controlled by methods such as EGR. In addition, controlling the methane slip is still a challenge for dual-fuel engine calibration. Although the mixing ratio and the conditions of combustion can be adjusted to minimize the total hydrocarbon under certain situations [,]. While CNG can effectively reduce CO and non-methane hydrocarbon (NMHC) emissions, it tends to increase CH4 and NOx emissions, highlighting the need for balanced control strategies [].
In order to reduce exhaust emissions, the TWCs are used []. The electronic control module (ECM) controls the fuel injection volume based on the signals from the air fuel ratio sensor and oxygen sensor, optimizing the CO, HC, and NOx emissions and purify them into CO2, water (H2O), and nitrogen (N2) in modern spark ignition engines [,]. However, the TWC is only effective once it reaches its operational light off temperature, which causes a period of high emissions during the initial phase of engine operation [,]. This cold start period is particularly challenging in HEVs, where frequent engine restarts can prevent the catalyst from consistently maintaining its optimal operating temperature [,]. To address this challenge, researchers focus on developing various strategies. To address this challenge, researchers are focusing on various strategies, methods, or systems—electrically heated catalysts (EHC), thermal energy storage systems (TESS), engine parameter optimization, and cylinder deactivation applications, especially in HEVs [,,]. In addition, the choice of fuel itself is a critical area of investigation. While gaseous fuels like CNG can improve combustion stability and reduce certain engine-out pollutants during a cold start due to a better mixture formation, they also introduce a distinct challenge for aftertreatment systems [,,,]. The TWC requires a significantly higher temperature to effectively oxidize the chemically stable methane, which is the main component of natural gas [].
This study aims to address the specific gap by providing simultaneous measurements of catalyst temperatures and pre-catalyst concentrations of raw emissions (CO2, CO, NOx, CH4, and NMHC) for gasoline, CNG, and dual-fuel modes across the entire Worldwide Harmonized Light Vehicles Test Cycle (WLTC). These data are used to conduct a novel analysis of the synergies and trade-offs between different engine control strategies and the aftertreatment boundary conditions. The research investigates the consequences of two different gaseous fuel calibrations. The CNG mode used a slightly lean mixture (λ≈1.05–1.06), which necessitated retarding the ignition timing to manage in-cylinder NOx, and the MIX mode with near stoichiometric point calibration strategy allowed for an advanced ignition, which was similar to gasoline. Comparing these approaches revealed a crucial secondary benefit of the lean-burn strategy: this same NOx management technique also raised pre-catalyst temperatures, creating the more favorable thermal conditions required for methane oxidation.
2. Materials and Methods
This study focuses on the energy and ecological performance of hybrid vehicles through experimental testing on a chassis dynamometer. The vehicle’s 2AR-FXE spark-ignition (SI) engine (Toyota Motor Corporation, Toyota, Japan) was operated using three fuel modes: gasoline (G), compressed natural gas, and a dual-fuel G/CNG mixture (MIX) at high engine speeds.
2.1. The Vehicle Specifications, Experimental Test Setup and Equipment
The experimental investigation was conducted on a 2017 Toyota RAV4 hybrid passenger car (model code—AVA42L; Toyota Motor Corporation, Toyota, Japan), equipped with a front-wheel drive (FWD) system. The general specifications of the vehicle, including its mass, dimensions, and aerodynamic properties, are summarized in Table 1.

Table 1.
The general specifications of the hybrid passenger car Toyota RAV4.
The vehicle is powered by the Toyota Hybrid System II (THS-II; Toyota Motor Corporation, Toyota, Japan). The system’s primary power unit is a 2.5 L, four-cylinder 2AR-FXE engine operating on the Atkinson cycle, coupled with two motor-generators (MGs). The energy storage system is a Nickel–Metal Hydride (Ni-MH) high voltage battery. The detailed specifications of the engine and hybrid powertrain components are presented in Table 2.

Table 2.
The specifications of the internal combustion engine and hybrid powertrain.
The experimental tests were performed on a chassis hub dynamometer stand Dynolyze® Small (Dynolyze, Lahti, Finland). For this setup, the front road wheels were removed, and the dynamometer hubs were mounted directly on the vehicle’s wheel hubs. To ensure the cooling of the powertrain and a stable operating temperature during the tests, a cooling fan was placed in front of the vehicle. The vehicle was manually driven by an operator to follow the prescribed WLTC speed–time profile, which was displayed on a real-time feedback monitor. The vehicle test setup is shown in Figure 1.
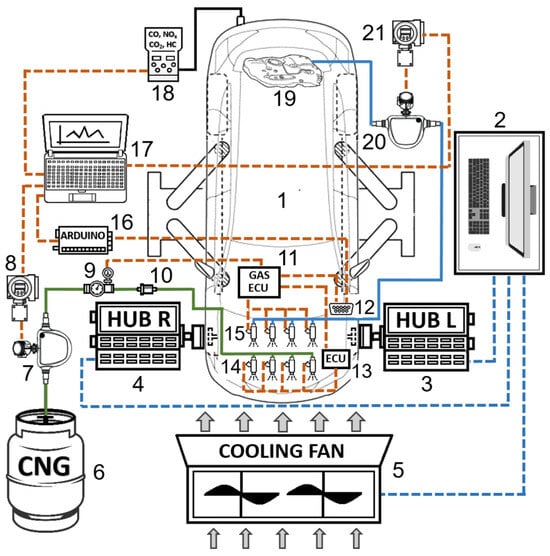
Figure 1.
Vehicle test setup: 1—hybrid car Toyota RAV4 (AVA42L), 2—hub dynamometer control stand Dynolyze® Small, 3—left brake hub, 4—right brake hub, 5—cooling fan, 6—compressed natural gas tank, 7—high pressure coriolis gas flow meter Emerson Micro Motion HPC015M, 8—transmitter Emerson Micro Motion 5700, 9—high pressure gas reducer Tomasetto Achille CNG AT12, 10—gas filter, 11—electronic control unit AEB MP48, 12—on-board diagnostics port OBD-II, 13—electronic control unit Toyota RAV4, 14—gasoline injectors, 15—gas injectors HANA H2001, 16—Arduino UNO R3, 17—data acquisition system, 18—emission measurement system MRU MGAprime, 19—gasoline fuel tank, 20—coriolis fuel mass flow meter Emerson Micro Motion ELITE CMF010M, and 21—transmitter Emerson Micro Motion 5700.
To enable gas operation, a secondary port-injection fuel system was installed, which delivered natural gas from a high-pressure tank to the intake manifold through HANA H2001 (Hana Engineering, Hwaseong-si, Republic of Korea) injectors. A two-stage pressure reducer, Tomasetto Achille CNG AT12 (Tomasetto Achille Spa, Castegnero, Italy), was used to lower the gas supply to a stable operating pressure (1.2 bar) for injectors. To prevent freezing from gas expansion, the reducer was integrated and connected into the internal combustion engine’s cooling system. The specifications of the injectors are summarized in Table 3.

Table 3.
The specifications of the injectors, HANA H2001.
The sequential compressed natural gas injection system is controlled by an AEB MP48 (Landi Renzo S.p.A., Cavriago, Italy) electronic control unit (ECU). It intercepts the original gasoline injection signals from the car’s ECU, which are used as a base input. The signals are correlated with real-time SI engine operating parameters: engine speed and engine load (derived from the intake manifold absolute pressure (MAP) sensor). The required gas quantity is determined from its internal calibration map and converted into an injector opening duration. Corrections are then applied, based on the current gas pressure and temperature. The CNG ECU is adapted to apply calibration strategies for the different fuel modes, enabling a direct comparison of their impact. The system was calibrated (CNG mode) to target an air–fuel ratio (λ ≈ 1.05–1.06), with the scientific aim of investigating the energetic and ecological trade-offs of slightly lean-burn operation. In contrast, the MIX mode calibration targeted a stoichiometric air–fuel ratio (λ ≈ 1.0), consistent with the gasoline operation. The calibration maps of the CNG ECU were tuned on the dynamometer stand for CNG and MIX operation across all tested engine speed and load points.
The fuel consumption of gasoline was measured using a Coriolis mass flow meter Emerson Micro Motion ELITE CMF010M (Emerson Electric Co., St. Louis, MO, USA), with a stated accuracy of ±0.05%, while a high-pressure Coriolis flow meter Emerson Micro Motion HPC015M (accuracy ± 0.5% of batch) was used for the natural gas. Each meter was paired with an Emerson 5700 transmitter for signal processing.
The composition of the raw engine-out exhaust gas was analyzed upstream of the TWC, using MRU MGAprime (MRU Messgeräte für Rauchgase und Umweltschutz GmbH, Neckarsulm-Obereisesheim, Germany). The sampling probe was installed in the common collector of the exhaust manifold, where the four runners merge. The probe was positioned at the same axial distance from the cylinder head, as the vehicle’s primary narrow-band oxygen sensor (approximately 40 cm along the runner path), and was mounted on the opposite side of the collector pipe. The specifications of the emission measurement system are presented in Table 4.

Table 4.
The characteristics of the MRU MGAprime emission analyzer.
The vehicle and engine operating parameters were acquired in real time from the on-board diagnostics (OBD-II) port, using a custom-built Arduino UNO R3 USB to RS-232 to controller area network (CAN) bus converter and MATLAB Simulink (version R2024b Update 4) data processing software. As shown in the data acquisition schematic (Figure 2), signals from the vehicle’s CAN bus were transmitted via the converter to a virtual COM port on a host computer. The MATLAB Simulink model was used to receive, parse, and log the parameters, which included engine load, engine coolant temperature, intake manifold absolute pressure, engine speed, vehicle speed, ignition timing, intake mass air flow rate, catalyst temperature, and excess air coefficient (λ). The data were sampled at a frequency of 10 Hz (0.1 s intervals).
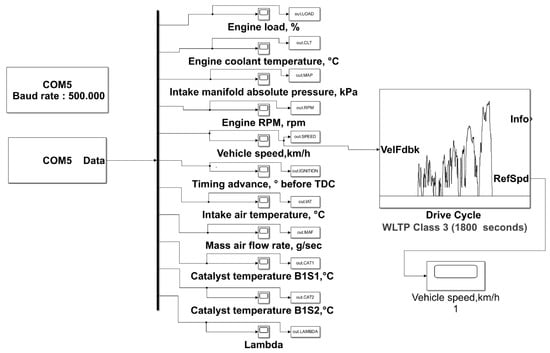
Figure 2.
The MATLAB Simulink model, used for real-time data acquisition from the vehicle’s CAN bus.
2.2. Experimental Testing Conditions and Fuel Properties
The dynamometer system Dynolyze® Small is equipped with eddy current brakes that are capable of a maximum braking torque of 3500 Nm per axle and an approximate braking power of 626 kW per axle pair. During the tests, the dynamometer applied a road load simulation according to vehicle’s parameters: curb weight, frontal area, air drag coefficient, tire radius, and a rolling resistance coefficient.
The tests were conducted according to the WLTP. The WLTC 3b cycle was used, which is applicable to vehicles with a power-to-mass ratio that is greater than 34 W/kg and a maximum speed equal to or exceeding 120 km/h. The entire cycle has a duration of 1800 s, covers a distance of 23.267 km, and has an average speed of 46.5 km/h. The profile is dynamic across all phases, with frequent acceleration and deceleration events, and is designed to be more accurate to real-world driving conditions. Figure 3 shows the speed–time profile of the driving cycle.
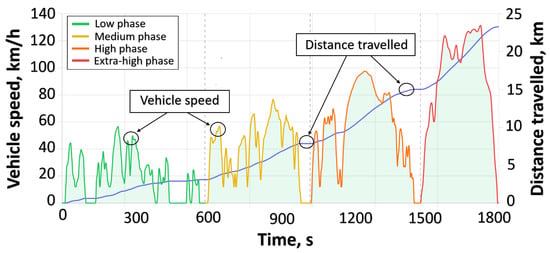
Figure 3.
The speed–time profile and cumulative distance of the WLTC Class 3b driving cycle.
The cycle is structured into four distinct phases with progressively higher speeds: low, medium, high, and extra-high. Each phase is designed to represent different driving scenarios, from urban and suburban streets to rural roads and highways. Throughout the test, the vehicle reaches a top speed of 131.3 km/h but also spends about 13% of the time at a standstill. The most intense acceleration, at 1.666 m/s2, is demanded during the high-speed phase, while sharp decelerations of −1.5 m/s2 are a recurring feature in the first three phases. Notably, the final extra-high phase involves the fastest driving but is dynamically smoother, with less aggressive acceleration and braking. The characteristics of each phase are summarized in Table 5.

Table 5.
The characteristics of the WLTC Class 3b driving cycle phases.
To ensure consistent initial conditions for each test, the high-voltage battery’s state of charge (SOC) was set to a consistent level of 63.5%. This was achieved by allowing the internal combustion engine to run while the vehicle was stationary until it shut off automatically, which indicates the upper SOC limit as managed by the vehicle’s hybrid control system. The dual-fuel mode consisted of primary operation on CNG, with gasoline injection being introduced at engine speeds above 2500 rpm. This was managed by a secondary fuel map in the AEB ECU, which was configured to deliver a gasoline injection pulse width equivalent to 10% of the signal from the primary ECU. The properties of the gasoline and natural gas are presented in Table 6.

Table 6.
The properties of the fuels.
2.3. Evaluation of Engine Energy and Emission Characteristics
The internal combustion engine energy efficiency was determined by calculating the ICE work output over the driving cycle, the average brake specific fuel consumption (), and the average brake thermal efficiency () for the WLTC. By integrating ICE brake power [kW], recorded during the experimental test, at a sampling interval of = 1 s, the total work performed by the internal combustion engine over the WLTC ( = 1800 s) was determined as follows:
Specific fuel consumption was calculated based on the total measured fuel mass consumption during the WLTC, () [kg], and the effective work performed by the internal combustion engine, as follows:
The fuels used were commercial gasoline (a mixture of 90% gasoline and 10% ethanol by volume), labeled as G (), or compressed natural gas, labeled as CNG (). In the case of dual-fuel mode, when the engine was fueled simultaneously with G and CNG, the total fuel consumption over the cycle was obtained by summing the G and CNG mass flow rates, measured by separate fuel mass flow meters. In this case, the fuel is labeled MIX.
The brake thermal efficiency over the WLTC was calculated by taking the lower heating value (LHV) [MJ/kg] of the fuels used and the average brake specific fuel consumption over the driving cycle into account, as follows:
For gasoline, Equation (3) employs and ; for compressed natural gas, it employs and . Under dual-fuel mode (MIX), the overall fuel energy consumption is obtained by summing the separately calculated products of each fuel’s and , i.e., .
Using the instantaneous concentrations of various pollutants (CO, CO2, CH4, NMHC, NOx) measured by the gas analyzer during the WLTC, together with the physico-chemical properties of these compounds and the measured instantaneous fuel and air consumption rates, the instantaneous mass emissions of individual exhaust components were calculated as follows:
where —concentration of the pollutant component in the exhaust gas, ppm; —molar mass of the pollutant component ( = 28.01 g/mol; = 44.01 g/mol; = 16.04 g/mol; = 44.09 g/mol; = 30.01 g/mol); and —exhaust gas mass flow rate:
where —fuel mass flow rate measured by the fuel mass flow meter [kg/h] (fuel type index: G, CNG, or MIX) and —air mass flow rate measured by the engine air mass flow meter [kg/h], with data obtained from the engine ECU.
The molar mass of the engine exhaust–gas stream was calculated at each second of the WLTC as the sum of the products of each species’ molar mass and its volume fraction, according to the following:
where —concentration of the n-th exhaust–gas component, including H2O (water vapor) and N2 [ppm]; —molar mass of that component [g/mol].
The cumulative mass of each pollutant over the WLTC was determined by the discrete time integration of the emission rate (g/s) at 1 s intervals, from the first second of the test to = 1800 s:
As defined in the EU standard, the distance-specific emissions of the various vehicle exhaust pollutants over the WLTC [g/km] are determined by taking the mass of these pollutants emitted over the test cycle and the vehicle distance traveled into account, according to the following:
The vehicle distance traveled () was obtained by a discrete-time integration of the vehicle speed over the WLTC, with a sampling interval of dt = 1 s.
3. Results
The results of the experimental tests are presented in this section, beginning with a validation of the driving cycle execution. The adherence to the WLTC speed profile was evaluated for all three fuel modes—gasoline, compressed natural gas, and a dual-fuel mixture—to ensure the fidelity of the tests and the comparability of the results. The official procedure requires that the total distance traveled remains within a ±2% tolerance of the standard, and that the instantaneous vehicle speed adheres to a ±2.0 km/h tolerance from the reference trace. A detailed summary of the driving parameters for each phase and the total cycle is provided in Table 7.

Table 7.
Detailed validation of the driving cycle parameters for each phase and the total cycle.
The results of vehicle speed and vehicle distance traveled (Figure 4) confirm that all three experimental runs were valid. The total distance deviation for each fuel mode remained within the required limits: −0.42% for gasoline, +0.19% for CNG, and −0.58% for the MIX mode. Furthermore, a more granular analysis of the average speed in each of the four cycle phases reveals enough driver accuracy, with most deviations remaining below ±2%. The largest deviations were observed in the more dynamic low and medium speed phases, which is a typical characteristic of manually driven tests, due to frequent transients.
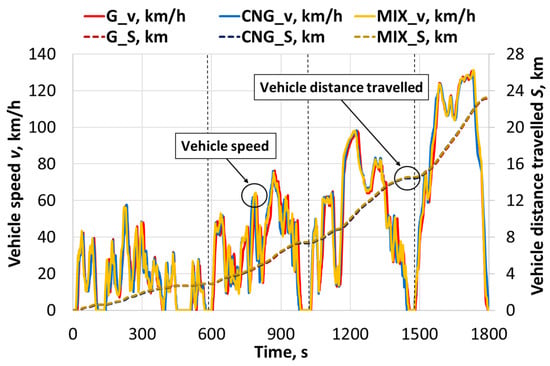
Figure 4.
Vehicle speed (v) and cumulative distance traveled (S) profiles during the WLTC for the three tested fuel modes.
The instantaneous vehicle acceleration profiles supplement the cycle validation (Figure 5). The acceleration profiles for all three fuels were nearly identical, which confirms that the driver accurately replicated the dynamic demands of the WLTC. This consistency was particularly evident during braking events. For example, the maximum deceleration values varied only slightly between the tests: −1.546 m/s2 for gasoline, −1.534 m/s2 for CNG, and −1.540 m/s2 for the dual-fuel mode. All of these measured values are in close agreement with the −1.5 m/s2 maximum deceleration specified by the official standard. The maximum acceleration values reached 1.573 m/s2 (G), 1.435 m/s2 (CNG), and 1.532 m/s2 (MIX), respectively. Although they show slight variation, as expected in a manually driven test, they all remain close to the cycle’s most aggressive requirement—1.666 m/s2, which was reached during the high-speed phase.
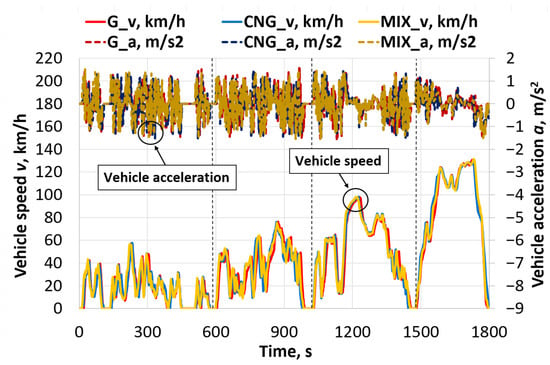
Figure 5.
Vehicle speed (v) and acceleration (a) profiles during the WLTC.
The engine’s mechanical output was very consistent across the different fuel modes. The profiles for instantaneous brake power (PB) and the curves for cumulative brake work (WB) show only minor variations between the tests (Figure 6). This confirms that the internal combustion engine performed practically the same mechanical work, regardless of the fuel used. The normalized engine work output per 100 km was 17.89 kWh/100 km for gasoline, 17.83 kWh/100 km for compressed natural gas, and 17.84 kWh/100 km for the dual-fuel mode. The total ICE-on time during the cycle reached 1043 s in gasoline mode. The operating time for natural gas was 3.6% shorter (1006 s) and 3.1% shorter for the dual-fuel mode (1011 s) compared to gasoline (in MIX mode, gasoline injectors were active for 218 s, primarily in the high and extra-high speed phases). The hybrid control system adjusted the engine’s operating points, depending on the fuel. When running on CNG and MIX, the engine produced the same total work in less time, which means it operated at a higher average power output, due to increased engine speed, while the average for gasoline was 1694 rpm, for CNG 1865 rpm, and 1878 rpm for the MIX mode. At higher rpm, engine was operating with a lower average torque: an adaptation by the hybrid system to compensate for the reduced volumetric efficiency that occurs when gaseous fuel displaces air in the intake manifold.
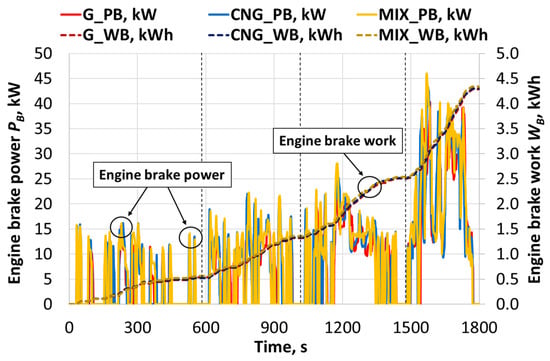
Figure 6.
Comparison of engine brake power (PB) and engine brake work (WB) over the WLTC.
Despite this consistency in work output, the engine’s brake thermal efficiency (BTE) varied depending on the fuel and the corresponding engine control strategy. The highest BTE was achieved with CNG (0.360), which was 4.3% higher than gasoline (0.345). This improvement is primarily attributed to the lean-burn strategy (average λ = 1.056) employed during CNG operation. Lean combustion enhances efficiency by reducing pumping losses (allowing a wider throttle opening) and improving the specific heat ratio of the cylinder charge []. The efficiency was achieved despite the simultaneous application of significantly retarded ignition timing, which was necessary for NOx control. Retarded ignition typically reduces thermal efficiency; however, in this case, the thermodynamic benefits of the lean-burn strategy outweighed the efficiency penalty from the non-optimal ignition timing []. In the dual-fuel (MIX) mode, the engine’s brake thermal efficiency (BTE) reached 0.358: a 3.8% improvement over gasoline. The result is particularly interesting because the MIX mode was at a stoichiometric air–fuel ratio (average λ = 1.009), much like gasoline. Without the advantage of reduced pumping losses from the lean-burn operation, the efficiency gain comes from two factors. Natural gas has inherently better combustion properties than gasoline, allowing it to form a more uniform air–fuel mixture, and the engine’s tendency to run at higher average speeds in MIX mode (1878 rpm vs. 1694 rpm for gasoline) pushed its operation into a more efficient zone on its performance map.
The normalized fuel consumption (Figure 7) for gasoline was 4.455 kg/100 km. The CNG and MIX modes were significantly lower, at 3.623 kg/100 km (an 18.7% reduction) and 3.680 kg/100 km (a 17.4% reduction), respectively. The reduction in fuel mass consumption can be attributed to two main factors. First, natural gas has a 17.4% higher LHV than gasoline, at 49.22 MJ/kg compared to 41.90 MJ/kg. When this greater energy content is combined with the engine’s higher brake thermal efficiency (BTE) in CNG mode, it leads to substantial fuel savings.
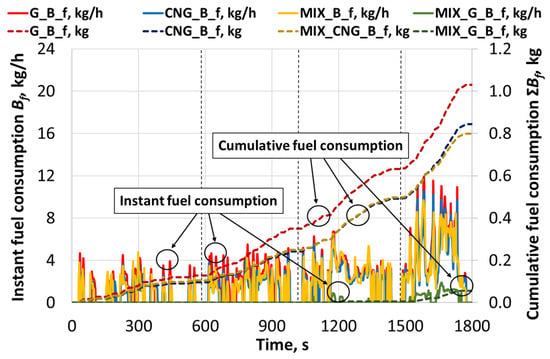
Figure 7.
The instant fuel consumption (Bf) and cumulative fuel consumption (ΣBf) over the WLTC.
According to the manufacturer’s official data, the stated combined fuel consumption was ~5.3 l/100 km, although this figure was based on the older NEDC test procedure. As the manufacturer notes, these official test results are intended for comparison and may not reflect real-world driving, which is influenced by driving style, road conditions, speed, and vehicle load. Furthermore, the type-approval testing at that time used gasoline with a maximum of 5% of ethanol (E5) as the reference gasoline. In our experiment, the consumption for G under the WLTC was 4.455 kg/100 km. Using the fuel’s measured density (~748.3 kg/m3), this value translates to 5.95 L/100 km and is 12.3% higher than the official NEDC combined figure. This significant discrepancy can be attributed to both the increased dynamism and demands of the WLTC compared to the NEDC, which better reflects real-world driving, and to the lower energy density of the G fuel used in this study compared to the E5 reference fuel that is used for the official NEDC certification.
The engine control parameters (Figure 8) illustrate how the engine control logic adjusts the fuel mixture composition and its ignition, depending on the fuel used. The final normalized fuel consumption values (kg/100 km) are derived by integrating these instantaneous mass flow rates over the total distance traveled. Analyzing the engine control system, a difference is observed in the excess air ratio (λ) values. In gasoline mode, the engine operated with a nearly ideal stoichiometric mixture, with a cycle average of λ = 1.004. Meanwhile, the CNG mode operated with a slightly leaner mixture—the average λ coefficient reached 1.056, while the MIX mode operated close to the stoichiometric (λ = 1.009). The difference in λ values directly determines the ignition timing (IT) control strategy.
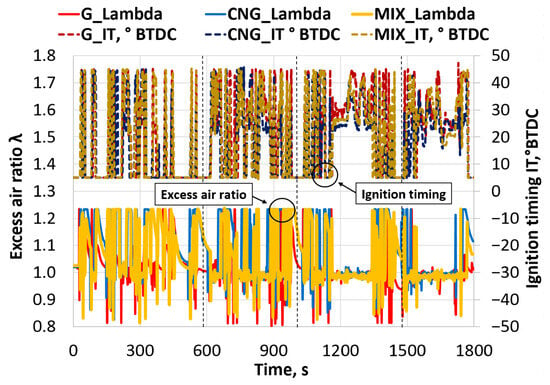
Figure 8.
Variation in excess air ratio and ignition timing (IT) during the WLTC.
Although the high knock resistance of CNG (octane number ~120), compared to gasoline, would theoretically allow for advancing the ignition timing to achieve higher thermal efficiency, the empirical data reveal that a retarded ignition strategy was applied. With gasoline and MIX fuels, operating with a mixture close to λ = 1 allows the TWC to effectively neutralize the NOx. Therefore, the engine control logic uses an early, optimized ignition timing (averaging 31.2° and 30.7° BTDC, respectively) to burn the mixture optimally early and to achieve maximum brake thermal efficiency.
However, in the case of CNG fuel, operating with a lean mixture (λ = 1.056), the TWC loses its ability to reduce NOx. To avoid the formation of high NOx emissions within the cylinder, the control system is programmed to retard the ignition timing (to an average of 26.5° BTDC over the cycle). Although such an ignition retardation strategy reduces the peak combustion temperature in the cylinder (thus limiting thermal NOx formation), it simultaneously increases the exhaust gas temperature, as combustion finishes later, closer to the start of the exhaust valve opening [,].
The engine’s control strategy for each fuel directly influenced the exhaust gas temperature (Figure 9). The pre-TWC temperature in CNG mode reached 612.3 °C (a 4.5% increase over gasoline’s 585.9 °C), and the post-TWC measurements showed a similar trend, with the CNG (474.6 °C) and MIX (467.0 °C) modes remaining higher than the gasoline (447.8 °C). The increased temperature is a positive secondary effect of the in-cylinder NOx control strategy. To reduce thermal NOx, the system retarded the ignition timing to an average of 26.5° BTDC, which caused the combustion to finish later and release more heat into the exhaust side. For a hybrid vehicle, maintaining a higher thermal condition is critical, as it helps the catalyst to warm up faster after frequent engine restarts. A quick catalyst light-off is crucial for controlling all cold-start pollutants, but it is especially necessary for oxidizing chemically stable methane, which requires a much higher temperature to become effective than other hydrocarbons. The results, therefore, reveal a synergy in the CNG strategy: the same retarded ignition timing used to solve the NOx problem also creates the necessary heat to address the methane slip problem []. However, the observed synergy reveals a major challenge. The lean mixture (λ = 1.056), while essential for higher engine BTE, simultaneously creates an oxygen-rich exhaust. A standard TWC is less effective at reducing NOx, as its reduction chemistry requires near-stoichiometric conditions. Our analysis underscores why the NOx decrease (34.0%) in-cylinder is so crucial: the aftertreatment system’s ability to assist is compromised. The result is a complex optimization challenge for the entire powertrain, requiring a balance between the engine’s internal NOx control and the catalyst’s conflicting operational limits [].
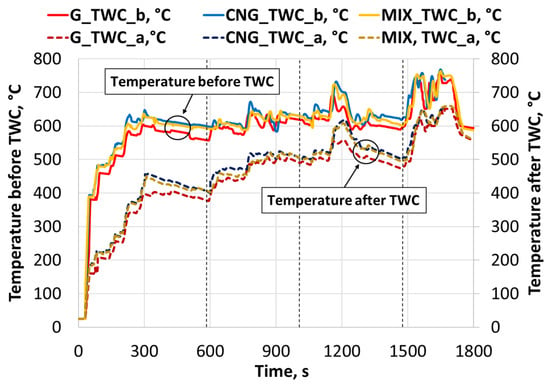
Figure 9.
The temperatures before (pre-TWC) and after (post-TWC) the catalytic converter, during the WLTC.
Instantaneous CO emissions (Figure 10) vary over a wide range, with the most significant peaks being observed during rapid accelerations, especially in the extra-high speed phase of the cycle (e.g., around 1500–1800 s) when the engine load is high. These emission spikes show how sensitive the combustion process is to the engine load and changes in the air–fuel mixture. This is particularly noticeable during acceleration, when the engine often runs on a richer mixture to provide more power. Cumulative CO emissions increase steadily throughout the cycle, and the final normalized values (g/km) clearly depend on the fuel used. With gasoline, the average CO emission was 3.56 g/km. A significant reduction was achieved in the CNG mode—2.41 g/km, which is 32.3% less than with gasoline. The mixed (MIX) mode resulted in 2.68 g/km, or 24.9% lower than gasoline.
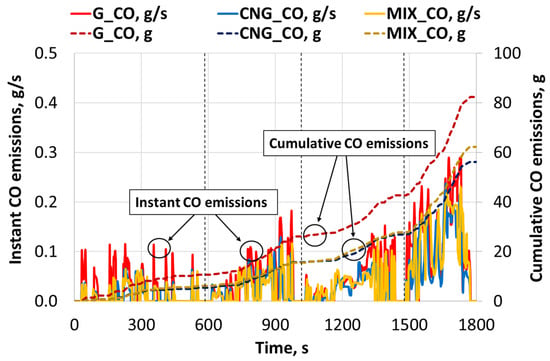
Figure 10.
Comparison of instant and cumulative CO emissions from the WLTC.
These results can be explained by fundamental differences in the fuel’s chemistry and the combustion process. CNG, being primarily methane, has a higher hydrogen-to-carbon (H/C) ratio than gasoline. This chemical structure inherently leads to less carbon monoxide as a byproduct of incomplete combustion. This effect is compounded by the leaner air–fuel mixture used in CNG mode, which ensures more available oxygen for a cleaner, more complete burn. Furthermore, the better homogeneity of the gaseous fuel and air mixture in CNG mode leads to more complete combustion, resulting in the lowest CO emissions []. In the case of gasoline, higher CO emissions are caused not only by the lower H/C ratio but also by the use of richer mixtures during the cold engine operation and acceleration phases. For the mixed mode, transient moments between fuels can cause fluctuations in the mixture composition, limiting the CO emission reduction effect compared to pure CNG.
The formation of nitrogen oxides (Figure 11) is closely related to high combustion temperature and pressure in the cylinder; therefore, the instantaneous NOx emissions are highest under high engine loads. These peaks directly reflect the conditions that are favorable for thermal NOx formation. The final NOx emissions showed a clear advantage for natural gas. Compared to gasoline’s 0.803 g/km, CNG produced only 0.530 g/km—a 34.0% reduction. The difference can be explained due to the engine’s distinct control strategies for each fuel, especially regarding ignition timing. For gasoline, the system prioritized efficiency by using an early ignition timing (average 31.2° BTDC). While effective for performance, this created high combustion temperatures that led to significant thermal NOx formation.
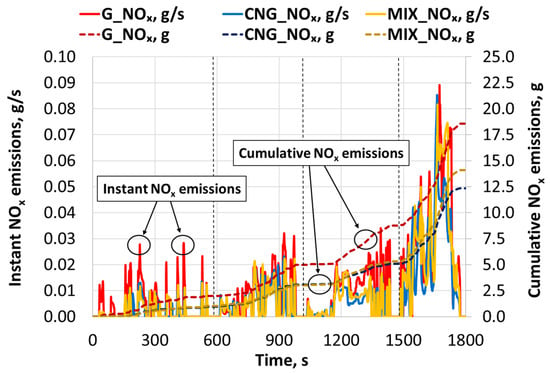
Figure 11.
Instant and cumulative NOx emissions from the WLTC.
The strategy for CNG was different, because the engine ran on a lean mixture (λ = 1.056), which normally increases NOx. To avoid a higher amount of nitrogen oxide, the electronic control unit retarded the ignition timing to an average of 26.5° BTDC and lowered the peak combustion temperature inside the cylinder. The MIX mode’s result of 0.606 g/km is an intermediate value between the pure gasoline and CNG modes. Although it ran mostly on CNG (which lowers NOx), during high-load phases, the system switched back to a gasoline-like strategy that produces more NOx, which limited the total reduction. In summary, the results indicate that CNG fuel ensures a cleaner combustion process [], while the mixed fuel mode, although having potential for reducing nitrogen oxides, requires further optimization.
The cumulative CH4 emissions (Figure 12) show a significant difference between the fuel modes. The normalized average emissions over the entire WLTC reached just 0.017 g/km using gasoline. However, switching to natural gas increased emissions to 0.241 g/km, and in mixed (MIX) mode, to 0.228 g/km. This means that using CNG increased methane emissions by a factor of approximately 14.1, and in MIX mode, by a factor of 13.3, compared to gasoline. This drastic increase in “methane slip” is directly related to the properties of methane as the main component of CNG (in this study ~95.4% by volume).
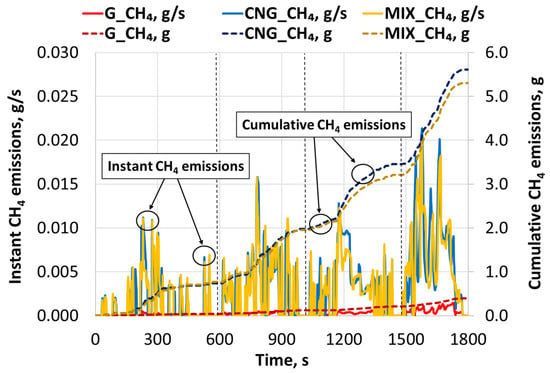
Figure 12.
Variation in instant and cumulative CH4 hydrocarbon emissions during the WLTC.
Its high auto-ignition temperature, slower flame propagation speed, and chemical stability cause a portion of CH4 to fail to combust completely in the combustion chamber [,]. The lower methane emissions in MIX mode (~5.3% less than pure CNG) can be explained by its different combustion approach. Unlike the pure CNG mode, which ran lean (λ = 1.056) and was more susceptible to methane slip, the MIX mode operated near a stoichiometric point (λ = 1.009), typically resulting in more stable and complete combustion. Furthermore, injecting faster-burning gasoline during high-load periods improved the overall combustion efficiency, helping to reduce the methane slip seen in the pure CNG test.
The trends in non-methane hydrocarbons emissions (measured as C3H8-equivalent) (Figure 13) show an opposite pattern compared to methane. Instantaneous MNHC emissions are generally much lower than CH4 and rarely exceed the 0.010–0.015 g/s threshold, although the peaks in the gasoline mode are clearly higher than in the gaseous modes. Cumulative emissions and normalized average values confirm this difference. In gasoline (G) mode, the average NMHC emission reached 0.167 g/km. Using compressed natural gas, this emission drastically decreased to 0.029 g/km, and in mixed (MIX) mode, to 0.033 g/km. This means that switching to CNG reduced NMHC emissions by 82.7%, and in MIX mode, by 80.2%, compared to gasoline. The higher amount of NMHC during gasoline combustion is associated with the incomplete oxidation of heavier liquid fuel hydrocarbon components, especially during cold engine operation and transient modes (acceleration), when the air–fuel mixture is richer and combustion is less uniform []. Natural gas contains only a small impurity of NMHC (~0.35% by volume), so its emissions are naturally much lower. Summarizing the methane and non-methane hydrocarbon analysis, it is noted that the transition from gasoline to CNG fundamentally changes the structure of unburned hydrocarbon emissions: non-methane emissions decrease significantly, but emissions of the main component—methane—increase by approximately 14-fold.
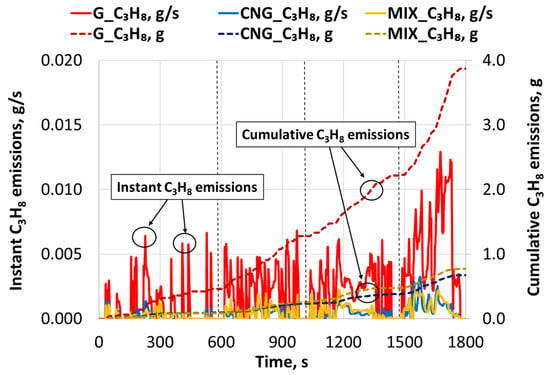
Figure 13.
The instant and cumulative non-methane hydrocarbons (C3H8 equivalent) emissions during the WLTC.
The dynamics of instantaneous CO2 emissions (Figure 14) closely follow the engine load changes throughout the WLTC. The CNG and MIX modes exhibit slightly lower instantaneous CO2 emissions than gasoline, especially in medium-load zones where the engine runs more steadily. In gasoline mode, the average CO2 emission reached 128.6 g/km. The lowest emissions were recorded in the compressed natural gas mode at 93.2 g/km, while the mixed (MIX) mode resulted in 95.1 g/km. This means that using CNG reduced CO2 emissions by 27.5%, and in MIX mode, by 26.1%, compared to gasoline.
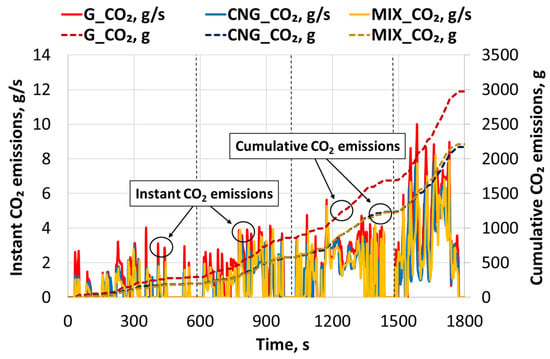
Figure 14.
Comparison of instant and cumulative carbon dioxide (CO2) emissions over the WLTC.
These differences are explained by the chemical composition characteristics of the fuels. Methane, which constitutes the main part of CNG, has a higher hydrogen-to-carbon (H/C) ratio in its molecule, resulting in less CO2 being produced per unit of energy released during combustion []. Furthermore, fuel consumption (kg/100 km) was lower when using CNG, which directly leads to lower CO2 emissions. The intermediate CO2 emission values for the MIX mode indicate that the engine operates on gas for part of the cycle, thus reducing the total carbon flow into the combustion chamber. However, during transient modes and higher loads, when gasoline is supplied according to the strategy, CO2 emissions are higher than in the case of pure CNG.
Although CNG delivered a significant 27.5% reduction in CO2 emissions, this benefit should be evaluated against the sharp rise in methane emissions. Methane is a powerful greenhouse gas, so to understand the full climate impact, we converted its emissions into a carbon dioxide equivalent (CO2-eq). Using a 100-year GWP (GWP-100) factor of 30 from the IPCC AR6 for methane [], we evaluated the total engine-out greenhouse gas emissions. For gasoline, the total CO2-eq was 129.11 g/km, which includes 128.6 g/km of CO2 and 0.51 g/km from CH4. In comparison, the total for CNG was 100.44 g/km, composed of 93.2 g/km of CO2 and a much larger 7.23 g/km from methane. For the MIX mode, the total was 101.91 g/km (95.1 g/km CO2 + 6.84 g/km CH4-eq). These findings show that despite a 14-fold increase in engine-out methane slip, the CO2 benefit outweighed the methane penalty in this case and for these driving conditions. Operation on CNG resulted in a net reduction in engine-out GHG emissions by 22.2% compared to gasoline, while the MIX mode achieved a 21.1% reduction. It is important to note that the climate impact of methane is more pronounced over shorter timescales. Therefore, the emissions were also evaluated using the 20-year GWP (GWP-20) factor, which is approximately 82.5 for fossil methane []. The total CO2-eq for gasoline is 130.0 g/km (128.6 g/km CO2 + 1.4 g/km CH4-eq), and the total for CNG is 113.1 g/km (93.2 g/km CO2 + 19.9 g/km CH4-eq). Across the 20-year horizon, the net engine-out GHG reduction for CNG drops from 22.2% (using GWP-100) to approximately 13.0%. This highlights the critical short-term climate impact of the methane slip and underscores the importance of its aftertreatment. However, this potential benefit is critically dependent on the subsequent effectiveness of the TWC in mitigating the substantial methane slip.
The experimental results show that both CNG and MIX fuels allow for a significant reduction in CO2 emissions compared to gasoline, confirming the potential of gaseous fuels to reduce greenhouse gas levels in hybrid vehicles. The CO2 emission in the gasoline mode during the WLTC (128.6 g/km) is ~10.9% higher than the manufacturer’s officially stated combined carbon dioxide value (116 g/km), which is determined according to the NEDC procedure. This difference, which is similar to that observed in the case of fuel consumption, confirms that the WLTC is more dynamic and better reflects real driving conditions than the NEDC. The use of G fuel (lower energy density), compared to the E5 reference fuel used by the manufacturer during official EU-regulated tests, also contributes slightly to this difference.
4. Conclusions
This study experimentally investigated the energy performance, engine-out emissions, and catalyst temperatures of a Toyota RAV4 hybrid vehicle with a 2AR-FXE engine, operating on gasoline, compressed natural gas, and dual-fuel modes during the WLTC. Based on the results obtained, the following main conclusions can be drawn:
- The mechanical work performed by the engine over the WLTC was nearly identical for all three fuel modes (averaging ~17.8 kWh/100 km), ensuring an objective comparison of the energy and ecological indicators and confirming successful cycle replication under different fuel conditions. Using CNG reduced fuel consumption by 18.7% and CO2 emissions by 27.5% compared to gasoline, and this can be attributed to the higher LHV of CNG and ~4.3% higher BTE for CNG (0.360) in comparison with gasoline (0.345), proving that CNG can have high potential as alternative fuel.
- The engine control logic in CNG mode successfully balanced efficiency and emissions. The system operated on a lean mixture (λ ≈ 1.056), which increased the BTE by reducing pumping losses. To control the NOx emissions typically associated with the lean-burn strategy, significantly retarded ignition timing (avg. 26.5° BTDC) was employed, successfully reducing engine-out NOx by 34.0%. Crucially, the BTE improvement was achieved despite the retarded timing, indicating that the benefits of lean operation outweighed the penalty of non-optimal ignition phasing. The ignition retard strategy also resulted in a 4.5% higher pre-TWC exhaust gas temperature, which is favorable for catalyst operation in a hybrid electric vehicle.
- While CNG reduced engine-out CO (−32.3%) and NMHC (−82.7%) emissions, it drastically increased engine-out CH4 emissions by ~14.1-fold (0.241 g/km vs. 0.017 g/km for gasoline). However, even when factoring in methane’s high global warming potential, the significant CO2 reduction outweighed the methane penalty. This resulted in a net 22.2% reduction in total engine-out greenhouse gas emissions (CO2-eq) for CNG (100.44 g/km CO2-eq) compared to gasoline (129.11 g/km CO2-eq). This confirms that the engine-out climate benefit is positive, but highlights that this benefit is heavily reliant on the TWC’s mitigation of the substantial methane slip.
- The experimentally obtained WLTC gasoline consumption (~5.95 L/100 km) and CO2 emissions (128.6 g/km) were 12.3% and 10.9% higher, respectively, than the manufacturer’s specified NEDC equivalent values, confirming the stringency and higher realism of the WLTC test compared to NEDC, as well as the influence of using G fuel.
Several limitations can be identified in the study, which may include that the results are based on a single vehicle, and the results may vary with other hybrid models or powertrain configurations. Furthermore, this study focused exclusively on engine-out (pre-TWC) emissions to analyze the engine’s control strategy. Therefore, the final tailpipe emissions and the true net climate benefit remain unquantified. The 22.2% (GWP-100) engine-out GHG reduction is dependent on TWC’s ability to mitigate the 14-fold CH4 increase—a challenge, considering the oxygen-rich conditions observed in the CNG mode. The realization of the positive impact of the use of CNG in hybrid vehicles on climate change depends largely on solving the problem of methane emissions.
Future research should focus on measuring tailpipe emissions and developing advanced catalyst optimization strategies designed for methane oxidation under the lean-burn operation. In addition, using biomethane instead of natural gas would offer even greater climate benefits, as both fuels are chemically similar. In order to effectively use renewable fuels while meeting increasingly stringent emissions requirements, it is important to understand the synergy between in-cylinder control (e.g., ignition delay) and the performance of aftertreatment systems.
Author Contributions
Conceptualization, T.V., A.R. and A.P.; methodology, T.V., A.R. and A.P.; software, T.V., A.R. and A.P.; validation, T.V., A.R., S.S. and A.M.; formal analysis, T.V., A.R. and S.S.; investigation, T.V., S.S., A.M. and A.P.; resources, T.V., A.R., A.P. and A.M.; data curation, T.V. and A.R.; writing—original draft preparation, T.V., A.R. and S.S.; writing—review and editing, T.V., A.R. and S.S.; visualization, T.V.; supervision, T.V. and A.R.; project administration, T.V. and A.R. All authors have read and agreed to the published version of the manuscript.
Funding
This research received no external funding.
Institutional Review Board Statement
Not applicable.
Informed Consent Statement
Not applicable.
Data Availability Statement
Data supporting the findings of this study are available from the corresponding author upon request.
Conflicts of Interest
The authors declare no conflicts of interest.
Abbreviations
The following abbreviations are used in this manuscript:
| ABDC | After Bottom Dead Center |
| ATDC | After Top Dead Center |
| BBDC | Before Bottom Dead Center |
| BDC | Bottom Dead Center |
| BMEP | Brake Mean Effective Pressure |
| BSFC | Brake Specific Fuel Consumption |
| BTE | Brake Thermal Efficiency |
| BTDC | Before Top Dead Center |
| Cd | Drag Coefficient |
| CH4 | Methane |
| CNG | Compressed Natural Gas |
| CO | Carbon Monoxide |
| CO2 | Carbon Dioxide |
| CO2-eq | Carbon Dioxide Equivalent |
| C3H8 | Propane |
| DIS | Direct Ignition System |
| DOHC | Double Overhead Camshaft |
| ECM | Electronic Control Module |
| ECU | Electronic Control Unit |
| EHC | Electrically Heated Catalyst |
| ES | Electrochemical Sensor |
| ETCS-i | Electronic Throttle Control System-Intelligent |
| EU | European Union |
| FWD | Front-Wheel Drive |
| G | Gasoline |
| GHG | Greenhouse Gas |
| GVW | Gross Vehicle Weight |
| H/C | Hydrogen-to-Carbon Ratio |
| HC | Hydrocarbons |
| HEV | Hybrid Electric Vehicle |
| HV | High-Voltage |
| ICE | Internal Combustion Engine |
| IT | Ignition Timing |
| JRC | Joint Research Center |
| LHV | Lower Heating Value |
| MG | Motor-Generator |
| MG1/MG2 | Motor-Generator 1/Motor-Generator 2 |
| MIX | Dual-Fuel Mixture (Gasoline/CNG) |
| NDIR | Non-Dispersive Infrared Technology |
| NEDC | New European Driving Cycle |
| NG | Natural Gas |
| Ni-MH | Nickel–Metal Hydride |
| NMHC | Non-Methane Hydrocarbons |
| NOx | Nitrogen Oxides |
| N2 | Nitrogen |
| N2O | Nitrous Oxide |
| OBD-II | On-Board Diagnostics II |
| RPM | Revolutions Per Minute |
| SI | Spark Ignition |
| SOC | State of Charge |
| TESS | Thermal Energy Storage System |
| THS-II | Toyota Hybrid System II |
| TWC | Three-Way Catalyst/Catalytic Converter |
| VVT-i | Variable Valve Timing-Intelligent |
| WLTC | Worldwide Harmonized Light Vehicles Test Cycle |
| WLTP | Worldwide Harmonized Light Vehicles Test Procedure |
| λ | Excess Air Coefficient |
References
- CO2 Emissions in 2023—Analysis, IEA. Available online: https://www.iea.org/reports/co2-emissions-in-2023 (accessed on 9 September 2025).
- Greenhouse Gas Emissions from Transport in Europe. Available online: https://www.eea.europa.eu/en/analysis/indicators/greenhouse-gas-emissions-from-transport (accessed on 9 September 2025).
- Milojevic, S. Sustainable application of natural gas as engine fuel in city buses: Benefit and restrictions. Istraz. Proj. Privredu 2017, 15, 81–88. [Google Scholar] [CrossRef]
- Karagöz, Y.; Balcı, Ö.; Gezer, O.; Köten, H.; Işın, Ö. Performance and emissions of spark-ignition engines fuelled with petrol and methane. Proc. Inst. Civ. Eng.—Energy 2021, 174, 156–169. [Google Scholar] [CrossRef]
- Atkins, P.; Milton, G.; Atkins, A.; Morgan, R. A Local Ecosystem Assessment of the Potential for Net Negative Heavy-Duty Truck Greenhouse Gas Emissions through Biomethane Upcycling. Energies 2021, 14, 806. [Google Scholar] [CrossRef]
- Vipartas, T.; Rimkus, A.; Stravinskas, S.; Pitrėnas, A.; Matulis, A. Spark Ignition (SI) Engine Energy and Ecological Performance Using Natural Gas and Late Intake Valve Close (LIVC). Appl. Sci. 2025, 15, 6185. [Google Scholar] [CrossRef]
- Liang, Y. A Review of the Effect of Compressed Natural Gas (CNG) on Combustion and Emission Performance of Internal Combustion Engines. Trends Renew. Energy 2022, 8, 119–129. [Google Scholar] [CrossRef]
- Jaworski, A.; Kuszewski, H.; Balawender, K.; Woś, P.; Lew, K.; Jaremcio, M. Assessment of CH4 Emissions in a Compressed Natural Gas-Adapted Engine in the Context of Changes in the Equivalence Ratio. Energies 2024, 17, 2095. [Google Scholar] [CrossRef]
- Prati, M.V.; Costagliola, M.A. Real driving emissions of Euro 6 electric/gasoline hybrid and natural gas vehicles. Transp. Res. Part D Transp. Environ. 2022, 113, 103509. [Google Scholar] [CrossRef]
- Niu, Q.; Sun, B.; Zhang, D.; Luo, Q. Research on performance optimization and fuel-saving mechanism of an Atkinson cycle gasoline engine at low speed and part load. Fuel 2020, 265, 117010. [Google Scholar] [CrossRef]
- Kwak, Y.; Kim, G.; Bae, C. Effect of the Late Intake Valve Closing(LIVC) Strategy on In-Cylinder Flow in a Gasoline Direct Injection Engine. KSAE 2025, 33, 337–384. [Google Scholar] [CrossRef]
- Feng, R.; Li, Y.; Yang, J.; Fu, J.; Zhang, D.; Zheng, G. Investigations of Atkinson Cycle Converted from Conventional Otto Cycle Gasoline Engine. In Proceedings of the SAE 2016 World Congress and Exhibition, Detroit, MI, USA, 12–14 April 2016; p. 2016-01-0680. [Google Scholar] [CrossRef]
- DiPierro, G.; Millo, F.; Cubito, C.; Ciuffo, B.; Fontaras, G. Analysis of the Impact of the WLTP Procedure on CO2 Emissions of Passenger Cars. In Proceedings of the Conference on Sustainable Mobility, Graz, Austria, 2–4 October 2019; p. 2019-24-0240. [Google Scholar] [CrossRef]
- Karamangil, M.İ.; Tekin, M. Comparison of fuel consumption and recoverable energy according to NEDC and WLTP cycles of a vehicle. CTF Cienc. Tecnol. Futuro 2022, 12, 31–38. [Google Scholar] [CrossRef]
- Marotta, A.; Pavlovic, J.; Ciuffo, B.; Serra, S.; Fontaras, G. Gaseous Emissions from Light-Duty Vehicles: Moving from NEDC to the New WLTP Test Procedure. Environ. Sci. Technol. 2015, 49, 8315–8322. [Google Scholar] [CrossRef]
- Xian, T.J.; Morris, S.; Wai, C.K. Evaluation of worldwide harmonised light vehicles test procedure for electric vehicles using simulation. IJVP 2021, 7, 364. [Google Scholar] [CrossRef]
- Tsiakmakis, S.; Fontaras, G.; Cubito, C.; Pavlovic, J.; Anagnostopoulos, K.; Ciuffo, B. From NEDC to WLTP: Effect on the Type-Approval CO2 Emissions of Light-Duty Vehicles, JRC Publications Repository. Available online: https://publications.jrc.ec.europa.eu/repository/handle/JRC107662 (accessed on 17 September 2025).
- Pavlovic, J.; Ciuffo, B.; Fontaras, G.; Valverde, V.; Marotta, A. How much difference in type-approval CO2 emissions from passenger cars in Europe can be expected from changing to the new test procedure (NEDC vs. WLTP)? Transp. Res. Part A Policy Pract. 2018, 111, 136–147. [Google Scholar] [CrossRef]
- Zhao, D.; Ran, C.; Chen, C.; Yu, R. From NEDC to WLTP for Vehicles: The Impact on Fuel Efficiency Calculation and Algorithm Optimization. In Proceedings of the 2022 International Conference on Data Analytics, Computing and Artificial Intelligence (ICDACAI), Zakopane, Poland, 15–16 August 2022; IEEE: New York, NY, USA, 2022; pp. 311–315. [Google Scholar] [CrossRef]
- Rimkus, A.; Mejeras, G.; Dittrich, A.; Pukalskas, S.; Barta, D. Effect of the Concentration of Bioethanol Mixed with Gasoline on the Energy and Environmental Performance of a Hybrid Vehicle in the Worldwide Harmonized Light Vehicles Test Cycle (WLTC). Appl. Sci. 2024, 14, 10805. [Google Scholar] [CrossRef]
- Kafle, S.; Kalwar, A.; Valera, H.; Agarwal, A.K. Compressed Natural Gas Utilization in Dual-Fuel Internal Combustion Engines. In Advanced Combustion for Sustainable Transport; Energy, Environment, and Sustainability; Agarwal, A.K., Martínez, A.G., Kalwar, A., Valera, H., Eds.; Springer: Singapore, 2022; pp. 273–296. [Google Scholar] [CrossRef]
- Zhang, F.; Nader, W.B.; Zoughaib, A.; Luo, X. Well-to-Wheel analysis of natural gas for hybrid electric truck application. E3S Web Conf. 2021, 266, 04011. [Google Scholar] [CrossRef]
- Mattson, J.M.S.; Langness, C.; Depcik, C. An Analysis of Dual-Fuel Combustion of Diesel with Compressed Natural Gas in a Single-Cylinder Engine. In Proceedings of the WCX World Congress Experience, Detroit, MI, USA, 10–12 April 2018; p. 2018-01-0248. [Google Scholar] [CrossRef]
- Pan, J.; Li, N.; Wei, H.; Hua, J.; Shu, G. Experimental investigations on combustion acceleration behavior of methane/gasoline under partial load conditions of SI engines. Appl. Therm. Eng. 2018, 139, 432–444. [Google Scholar] [CrossRef]
- Sevik, J.; Pamminger, M.; Wallner, T.; Scarcelli, R.; Wooldridge, S.; Boyer, B.; Miers, S.; Hall, C. Influence of Charge Motion and Compression Ratio on the Performance of a Combustion Concept Employing In-Cylinder Gasoline and Natural Gas Blending. In Volume 1: Large Bore Engines; Fuels; Advanced Combustion; American Society of Mechanical Engineers: Seattle, WA, USA, 2017; p. V001T03A018. [Google Scholar] [CrossRef]
- Da Costa, R.B.R.; Hernández, J.J.; Teixeira, A.F.; Netto, N.A.D.; Valle, R.M.; Roso, V.R.; Coronado, C.J. Combustion, performance and emission analysis of a natural gas-hydrous ethanol dual-fuel spark ignition engine with internal exhaust gas recirculation. Energy Convers. Manag. 2019, 195, 1187–1198. [Google Scholar] [CrossRef]
- Sun, P.; Zhu, H.; Yang, S.; Dong, W.; Yu, X.; Fu, Z. Combustion and emission characteristics of CNG/gasoline DFSI engine with CNG direct injection. Fuel 2024, 359, 130537. [Google Scholar] [CrossRef]
- Hall, C.M.; Sevik, J.; Pamminger, M.; Wallner, T. Hydrocarbon Speciation in Blended Gasoline-Natural Gas Operation on a Spark-Ignition Engine. In Proceedings of the SAE 2016 International Powertrains, Fuels & Lubricants Meeting, Baltimore, MD, USA, 24–26 October 2016; p. 2016-01-2169. [Google Scholar] [CrossRef]
- Zhang, Y.; Wu, X.; Ke, J.; Tong, X.; Jiang, Z.; Yue, Z.; Wen, Y.; Yin, D.; Yang, X.; Wang, Y.; et al. Reducing ultra-high particulate number (PN) emissions from high-mileage vehicles: The effective role of compressed natural gas (CNG). J. Hazard. Mater. 2025, 495, 138814. [Google Scholar] [CrossRef] [PubMed]
- Mandloi, D.; Dhinagar, S.; Das, H. An Optimization-Based Framework for Dynamic Model Development for a Three-Way Catalytic Converter Suitable for Urban Driving Condition. In Proceedings of the 15th International Conference on Engines & Vehicles, Capri, Italy, 12–16 September 2021; p. 2021-24-0078. [Google Scholar] [CrossRef]
- Srivastava, V.; Schaub, J.; Pischinger, S. Advanced model-based closed-loop combustion control strategies with combustion rate shaping. Int. J. Engine Res. 2023, 24, 3688–3706. [Google Scholar] [CrossRef]
- Tan, Y.; Kou, C.; Feng, C.; Han, D. Effect of different exhaust parameters on conversion efficiency enhancement of a Pd–Rh three-way catalytic converter for heavy-duty natural gas engines. Energy 2024, 292, 130483. [Google Scholar] [CrossRef]
- Nandi, S.; Chaillou, C.; Dujardin, C.; Granger, P.; Laigle, E.; Nicolle, A.; Norsic, C.; Richard, M. Evaluating Different Strategies to Minimize cold-start Emissions from Gasoline Engines in steady-state and Transient Regimes. Top. Catal. 2023, 66, 875–885. [Google Scholar] [CrossRef]
- Majumdar, S.S.; Pihl, J.A. Impact of Selected High-Performance Fuel Blends on Three-Way Catalyst Light Off under Synthetic Spark-Ignition Engine-Exhaust Conditions. Energy Fuels 2020, 34, 12900–12910. [Google Scholar] [CrossRef]
- Benegiamo, M.; Valletta, A.; Carlucci, A.; Mulone, V. Impact of Thermal Management of the Three-Way Catalyst on the Energy Efficiency of a P2 Gasoline FHEV. In Proceedings of the CO2 Reduction for Transportation Systems Conference, Turin, Italy, 7–9 June 2020; p. 2020-37-0019. [Google Scholar] [CrossRef]
- Okajima, T.; Sivakumar, S.; Shingyouchi, H.; Yamaguchi, K.; Kusaka, J.; Nagata, M. Modeling on a Three-Way Catalyst Used in Series Hybrid Electric Vehicles Focusing on Its Catalytic Behavior at Cold Start. Ind. Eng. Chem. Res. 2021, 60, 14069–14086. [Google Scholar] [CrossRef]
- Velmurugan, D.V.; McKelvey, T.; Olsson, J.-O. Data-Driven Near-Optimal On-Line Control for an Electrically Heated Catalyst-Equipped Gasoline Engine. SAE Int. J. Engines 2023, 16, 335–346. [Google Scholar] [CrossRef]
- Bohm, M.; Stetina, J.; Svida, D. Exhaust Gas Temperature Pulsations of a Gasoline Engine and Its Stabilization Using Thermal Energy Storage System to Reduce Emissions. Energies 2022, 15, 2365. [Google Scholar] [CrossRef]
- Brinklow, G.; Herreros, J.M.; Zeraati-Rezaei, S.; Tsolakis, A.; Millington, P.; Kolpin, A. Primary and Secondary Emissions Reduction Using Cylinder Deactivation Strategies for Gasoline Direct Injection Engines in Hybrid Vehicles. Automot. Innov. 2025, 8, 508–518. [Google Scholar] [CrossRef] [PubMed]
- Teymoori, M.M.; Chitsaz, I.; Zarei, A. Three-way catalyst modeling and fuel switch optimization of a natural gas bi-fuel-powered vehicle. Fuel 2023, 341, 126979. [Google Scholar] [CrossRef]
- Sahoo, S.; Srivastava, D.K. Effect of injection timing on combustion and IMEP variation of a bi-fuel compressed natural gas SI engine. Environ. Prog. Sustain. Energy 2021, 40, e13694. [Google Scholar] [CrossRef]
- Montanaro, A.; Allocca, L.; De Vita, A.; Ranieri, S.; Duronio, F.; Meccariello, G. Experimental and Numerical Characterization of High-Pressure Methane Jets for Direct Injection in Internal Combustion Engines. In Proceedings of the SAE Powertrains, Fuels & Lubricants Meeting, Kraków, Poland, 22–24 September 2020; p. 2020-01-2124. [Google Scholar] [CrossRef]
- Le, S.V.; Chan, H.H.; Quoc, T.D. A Study on the Effect of Compression Ratio and Bowl-In-Piston Geometry on Knock Limit in Port Injection Natural Gas Converted Engine. In The AUN/SEED-Net Joint Regional Conference in Transportation, Energy, and Mechanical Manufacturing Engineering; Le, A.-T., Pham, V.-S., Le, M.-Q., Pham, H.-L., Eds.; Lecture Notes in Mechanical Engineering; Springer Nature: Singapore, 2022; pp. 56–73. [Google Scholar] [CrossRef]
- Huang, C.; Shan, W.; Lian, Z.; Zhang, Y.; He, H. Recent advances in three-way catalysts of natural gas vehicles. Catal. Sci. Technol. 2020, 10, 6407–6419. [Google Scholar] [CrossRef]
- Lou, D.; Ren, Y.; Zhang, Y.; Sun, X. Study on the Effects of EGR and Spark Timing on the Combustion, Performance, and Emissions of a Stoichiometric Natural Gas Engine. ACS Omega 2020, 5, 26763–26775. [Google Scholar] [CrossRef]
- Kumar, S.; Karthi, R.; Ramakrishnan, M.S. Aggressive Catalyst Heating Strategy Using Advanced Mixture Formation and Combustion Timing Techniques in a GDI Engine. In Proceedings of the Symposium on International Automotive Technology, Pune, India, 29 September–1 October 2021; p. 2021-26-0185. [Google Scholar] [CrossRef]
- Kim, S.; Sim, J.; Cho, Y.; Sung, B.-S.; Park, J. Numerical Study on the Performance and NOx Emission Characteristics of an 800cc MPI Turbocharged SI Engine. Energies 2021, 14, 7419. [Google Scholar] [CrossRef]
- Marques, B.; Kostenidou, E.; Valiente, A.M.; Vansevenant, B.; Sarica, T.; Fine, L.; Temime-Roussel, B.; Tassel, P.; Perret, P.; Liu, Y.; et al. Detailed Speciation of Non-Methane Volatile Organic Compounds in Exhaust Emissions from Diesel and Gasoline Euro 5 Vehicles Using Online and Offline Measurements. Toxics 2022, 10, 184. [Google Scholar] [CrossRef]
- Lou, D.; Ren, Y.; Li, X.; Zhang, Y.; Sun, X. Effect of Operating Conditions and TWC Parameters on Emissions Characteristics of a Stoichiometric Natural Gas Engine. Energies 2020, 13, 4905. [Google Scholar] [CrossRef]
- Nsaif, O.; Kokjohn, S.; Hessel, R.; Dempsey, A. Reducing Methane Emissions from Lean Burn Natural Gas Engines with Prechamber Ignited Mixing-Controlled Combustion. J. Eng. Gas Turbines Power 2024, 146, 061023. [Google Scholar] [CrossRef]
- Zhang, R.; Chen, L.; Wei, H.; Li, J.; Chen, R.; Pan, J. Understanding the difference in combustion and flame propagation characteristics between ammonia and methane using an optical SI engine. Fuel 2022, 324, 124794. [Google Scholar] [CrossRef]
- Yusuf, A.A.; Inambao, F.L. Effect of cold start emissions from gasoline-fueled engines of light-duty vehicles at low and high ambient temperatures: Recent trends. Case Stud. Therm. Eng. 2019, 14, 100417. [Google Scholar] [CrossRef]
- Xu, Y.; Zhang, Y.; Gong, J.; Su, S.; Wei, Z. Combustion behaviours and emission characteristics of a retrofitted NG/gasoline duel-fuel SI engine with various proportions of NG-gasoline blends. Fuel 2020, 266, 116957. [Google Scholar] [CrossRef]
- Intergovernmental Panel on Climate Change (Ipcc). Climate Change 2021—The Physical Science Basis: Working Group I Contribution to the Sixth Assessment Report of the Intergovernmental Panel on Climate Change, 1st ed.; Cambridge University Press: Cambridge, UK, 2023. [Google Scholar] [CrossRef]
Disclaimer/Publisher’s Note: The statements, opinions and data contained in all publications are solely those of the individual author(s) and contributor(s) and not of MDPI and/or the editor(s). MDPI and/or the editor(s) disclaim responsibility for any injury to people or property resulting from any ideas, methods, instructions or products referred to in the content. |
© 2025 by the authors. Licensee MDPI, Basel, Switzerland. This article is an open access article distributed under the terms and conditions of the Creative Commons Attribution (CC BY) license (https://creativecommons.org/licenses/by/4.0/).