Abstract
Gas storage in depleted gas reservoirs has become a core facility for ensuring energy security and a key means of guaranteeing a safe and stable supply of energy. Steep pressure rise and fall cyclic fluctuations caused by strong injection and production are likely to lead to the destabilization of the geological structure of the gas storage reservoir. Among the geological formations, fault activation is a serious threat to the safety of gas storage reservoirs. In this study, faults with different filling types were depicted by real downhole cores. Through a series of shear tests, the effects of normal stress, filling thickness and fault angles on the lithology of rocks on both sides were investigated. (1) A novel testing method was developed for finely engraving faults on downhole cores, allowing for the simulation of real reservoir conditions. (2) An increase in normal stress results in enhanced shear strength, which in turn elevates the critical initiation stress of the fault. (3) Shear strength decreases with an increasing amount of fault mud, indicating that the critical initiation stress in faults filled with minor amounts of fault mud is higher than that in faults filled with significant amounts of fault mud. (4) For equal amounts of fault mud, the shear strength of fault specimens at a 40° angle exceeds that of specimens at a 10° angle. This implies that a greater degree of fault undulation corresponds to a higher critical slip initiation stress, reducing the likelihood of fault slip and enhancing stability. (5) The shear strength of fault specimens composed of sandstone-mudstone combinations is lower than that of specimens containing sandstone-sandstone combinations, suggesting that the critical slip initiation stress for sandstone-mudstone combination faults is comparatively lower.
1. Introduction
Driven by the global energy transformation and the goal of carbon neutrality, the strategic position of natural gas as a low-carbon transformation energy has been continuously improved [,]. However, the seasonal, regional and contingency-induced volatility of natural gas supply and demand poses a serious challenge to the flexibility and security of the energy system [,]. Underground gas storage (UGS) balances the contradiction between supply and demand through the mode of “injection and storage-peak adjustment” and has become the core facility for guaranteeing energy security, which is the key means to guarantee energy security and a stable supply.
The construction of UGS is mostly based on geological bodies such as depleted oil and gas fields, salt caverns or aquifers []. By the end of 2021, there were 667 UGS facilities under operation worldwide, with a total working gas volume of 4.24 × 10¹¹ m3. As of 2021, China has completed or is building 42 UGS facilities, including 34 UGS in depleted gas reservoirs, 7 UGS in salt caverns, and 1 UGS in aquifers []. The total designed gas storage capacity is 1.09 × 10¹¹ m3 and the working gas volume is 5.08 × 10¹⁰ m3. The current peak capacity of China is 1.64 × 10¹⁰ m3/a, which is equivalent to only 4.4% of the national consumption in 2021, which is significantly lower than the rate of 15–20% in Europe and the United States. UGS in depleted gas reservoirs has obvious advantages over other types of UGS because its proven exploration technologies, geologic structure and reservoir engineering are confirmed [,]. An analysis of U.S. gas storage accident statistics prior to 2016 found that gas reservoir-type UGS had the highest probability of accidents and was the most hazardous, with the main types of accidents including ring closure seal failure, which accounted for 32% of the 215 accidents counted. In addition to endangering a reservoir’s static sealing integrity—for instance, by fracturing the caprock through shear slip—faults may also create natural hazard risks related to sporadic variations in injection and production pressures []. As shown in Figure 1, faults are abundant in typical gas-bearing reservoirs. One of the most serious risks is induced seismicity. The periodic operation of gas storage reservoirs can redistribute stress within the reservoir and surrounding strata, possibly causing slip along pre-existing faults and resulting in micro-seismic events or moderate-to-strong earthquakes, according to field observations made both domestically and internationally [,]. Extended extraction can also cause compaction and lower formation pore pressure. Surface infrastructure may be at risk from formation collapse and ground subsidence if the surrounding rock is not strong enough [,]. The reservoir’s faults, fractures, or mud-filled layers may provide preferential routes for the migration of gases or liquids, which may contaminate the soil or groundwater and, in extreme situations, result in secondary hazards like explosions or fires [,]. Therefore, an in-depth study of the impact of faults on gas storage reservoirs is not only a scientific requirement for optimizing the site selection and design of gas storage operation but also a key issue to guarantee strategic energy security.
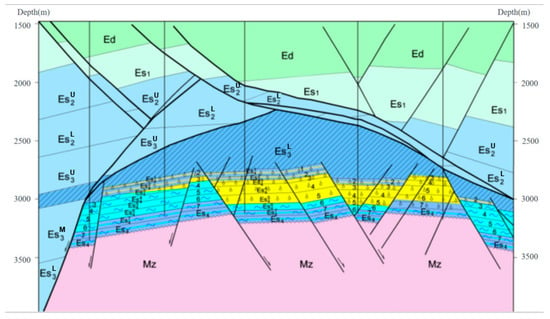
Figure 1.
Typical fault structure in a gas-producing block.
To ensure the safety and tightness of the geological system of underground gas storage and the long-term stable operation of gas storage, many scholars have carried out relative research. Laboratory experiments and numerical simulations are important means to explore the influence mechanism of faults on the tightness of gas storage reservoirs. Yang et al. constructed a multi-mechanism coupling evaluation method based on the Mohr-Coulomb criterion and Amonton’s law and analyzed the instability reasons of four major faults of a gas storage reservoir []. Zhao et al. simulated the stability of a proposed underground gas storage reservoir under multi-cycle injection and production conditions by constructing a two-dimensional hydrodynamic coupled finite element model with a zero-thickness cohesive force cell method []. Chang et al. used a finite element method to investigate the integrated poroelastic response of faults to the fluid injection and extraction []. Fan et al. used the ABAQUS platform to investigate the effects of fault characterization, in situ stress state, injection and production strategies, and formation materials on fault reactivation [,]. Lv et al. developed a pseudo three-dimensional coupled model in TOUGHREACT-FLAC3D focusing on the effects of bias stress, fluid temperature and other factors on fault damage and slip []. Yu et al. developed a reliability analysis framework based on a non-probabilistic convex model for assessing the slip dynamics behavior of faults in gas storage reservoirs []. Other influencing factors, including factors such as the geometry and filling characteristics of the fault and the porosity and permeability of the rock mass, were also investigated [,,].
On the other hand, progress in experimental studies has also been made by scholars. Wang et al. carried out laboratory experiments to investigate the effects of different defect inclinations, rock bridge lengths and rock bridge inclinations on the specimens []. Barton conducted direct shear tests on fault-containing rock samples and found that roughness would affect the shear strength and shear displacement []. Jafari analyzed the effect of shear rate and normal stress on fault shear using similar materials []. Mirzaghorbanali conducted shear tests by means of artificially preparing faults at constant normal stiffness and discussed the influence of shear rate and normal stress on the shear properties of the joints []. Indraratna and Papaliangas, through a series of shear tests on filled clay-type faults, pointed out that the thicker the filling layer, the lower the shear strength of structural facies rocks []. In the above experimental studies, more outcrop rocks were used, and the results obtained deviated somewhat from the real underground geological structure.
In this paper, downhole cores of a potential gas reservoir were collected. Composite specimens containing the fault fillings were prepared based on the downhole cores. A series of direct shear tests were conducted using composite specimens. Particular attention was paid to the effects of normal stress, filling thickness, fault dip angle, and lithology on either side of the fault. From the perspective of shear characteristics and fault plane morphology, the mechanism of different factors is systematically sorted out. The knowledge gained is helpful for the selection of gas storage reservoirs and the protection work in the process of gas injection and production.
2. Experimental Designs
2.1. Sample Preparation
In this study, cubic composite specimens with the fault filling were prepared (Figure 2). The standard dimensions of the single cubic samples are 50 mm × 50 mm × 30 mm, with a shear plane area of 50 mm × 50 mm. One specimen consists of three parts: the upper and lower parts of the rock and the fault filling. To obtain more accurate test results, downhole cores were selected to prepare the shear specimens. The downhole cores used were from sandstone and mudstone at 2820–3040 m in the potentially depleted gas reservoir in Puyang City, Henan Province. The mineral composition of the sandstone is quartz (48.62%), calcite (10.04%), dolomite (1.80%), sodium feldspar (16.51%), microplagioclase feldspar (15.91%), illite (5.18%), and plagioclase (1.94%). The mineral composition of mudstone is quartz (23.91%), calcite (9.52%), dolomite (1.43%), sodium feldspar (10.59%), microplagioclase feldspar (12.03%), illite (35.67%), and plagioclase (6.85%). The corresponding diffractograms of the mineral components are shown in Figure 3.
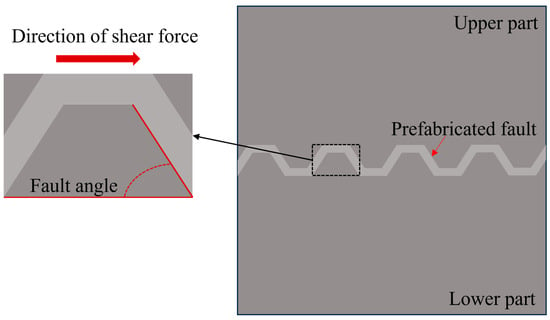
Figure 2.
Schematic diagram of the fault samples.
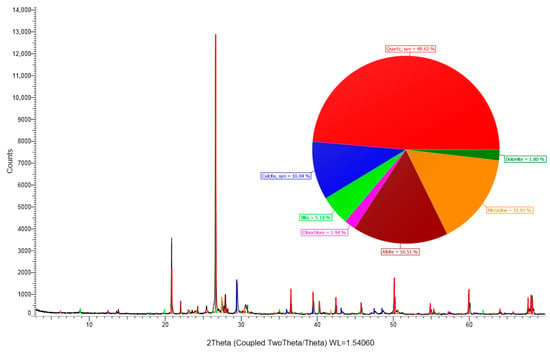
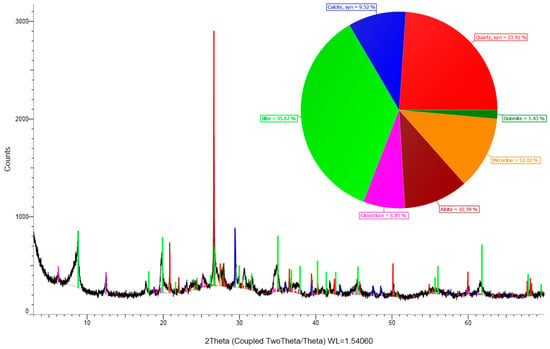
Figure 3.
Diffractograms of mineral fractions of sandstone and mudstone.
To ensure that the property of the fault filling matched the actual stratigraphic conditions, the fault filling was prepared based on the mineral composition of the mudstone. Thus, the fault filling was prepared by quartz (57.48%), illite (42.52%), water (40%) and hydroxypropyl methylcellulose (2%). In addition, the effect of the fault angle is considered, which is defined as the angle between the fault and the direction of shear force.
As shown in Figure 4, the detailed specimen preparation process is as follows:
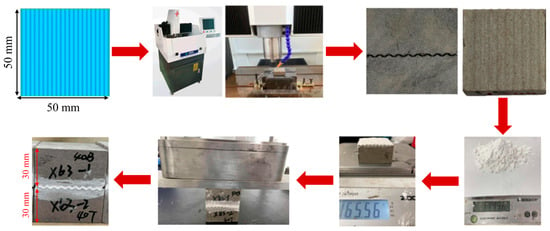
Figure 4.
Process diagram of sample preparation.
- (1)
- Generating the fault plane with specific angle by python.
- (2)
- Carving sandstone (mudstone) according to the fault plane using a high-precision carving machine (Precision: ±0.02/300 mm).
- (3)
- Applying the prepared fault filling evenly to the fault plane.
- (4)
- Putting the upper and lower parts together and maintaining a vertical pressure (4 MPa) on the specimen for 2 days [] for consolidation and maintenance pending the experiment.
2.2. Experimental Factors
In this paper, several factors affecting the shear behavior of faults are considered, such as the angle of fault, thickness of fault filling, normal stress, and lithology on both sides of the fault. The angles of fault were designed to be studied at both low (10°) and high (40°) angles. The thickness of fault filling was characterized by the mass of filling. The mass of filling of 3 g, 6 g and 11 g indicates thin, moderate and thick fault filling, respectively. This study conducted direct shear tests under constant normal stress conditions, without the application of full triaxial confining pressure. The normal stresses were applied at 1 MPa, 2 MPa, and 3 MPa, respectively. In addition, sandstone and mudstone assemblages were investigated in addition to sandstone and sandstone assemblages. Specific experimental design information is shown in Table 1. It should be emphasized that this experiment aims to reveal the underlying mechanisms governing fault behavior rather than to replicate specific field sites. The selection of these proportional values allows for a systematic analysis of how these factors influence fault shear behavior.

Table 1.
Summary of experimental design.
2.3. Test Equipment
In this study, the RMT-150C Rock Mechanics Test System (Figure 5) was selected to complete the direct shear test. This testing system can complete a variety of rock mechanics tests such as compression, tension and shear. Its technical parameters are: the maximum vertical force is 1000.0 kN, the maximum horizontal force is 500.0 kN, the vertical and horizontal piston stroke is 50.0 mm, and the deformation rate is 0.0001~1.0 mm/s. The testing system is equipped with a built-in high-precision strain-gauge force transducer for measuring both axial and transverse loads. Axial displacement is monitored using the system’s integrated linear variable differential transformer (LVDT, ABEK SENSORS, Beijing, China), while transverse displacement is recorded via a circumferential chain extensometer attached at the specimen’s midpoint. All tests are conducted using the RMT-150C digital servo control and data acquisition system provided with the equipment. The software operates under the Windows operating system, enabling closed-loop servo control of both load and displacement. In this test, the shear rate was fixed at 0.01 mm/s.
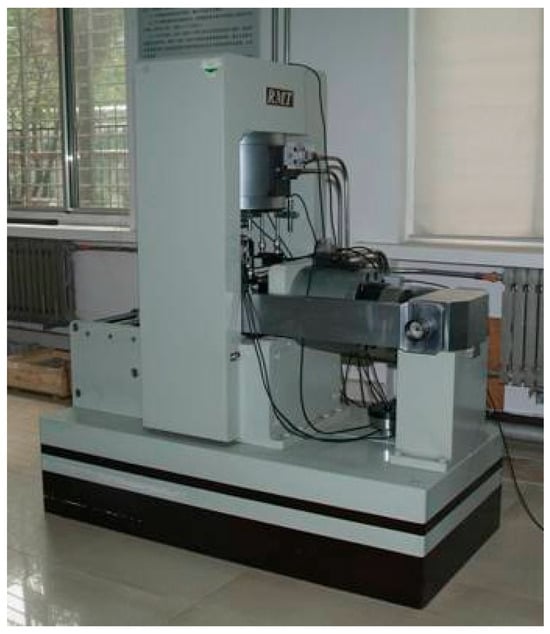
Figure 5.
RMT-150C Rock Mechanics Test System.
3. Results Analysis
3.1. Force-Displacement Curves
Figure 6 illustrates the force-displacement curves for all tested samples, which revealed that the shear force-displacement behaviors of different samples exhibited a consistent trend. Throughout the whole process of shear failure, several alternating reciprocal changing processes were observed. However, these can be broadly divided into three distinct stages: elastic deformation, nonlinear deformation, and post-peak failure.
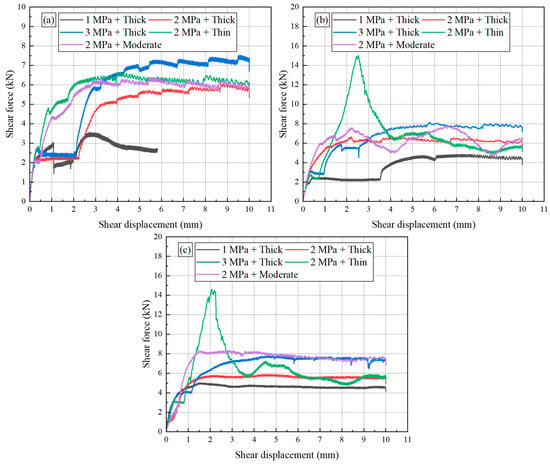
Figure 6.
Force-displacement curves of all samples: (a) Sandstone-Sandstone (10°), (b) Sandstone-Sandstone (40°) and (c) Sandstone-Mudstone (40°).
In the elastic deformation stage, the samples displayed elastic behavior as shear displacement increased, characterized by a linear relationship between shear force and shear displacement. This linearity shows that the material can be restored to its original shape upon unloading, which highlights its capacity to withstand the initial
The transition to the nonlinear deformation stage was marked by a gradual decrease in the slope of the force-displacement curve, indicating the onset of yielding within the material structure. As the shear displacement continued to increase, this slope ultimately reached zero at the peak force, signifying the maximum load-bearing capacity before the onset of failure.
Finally, during the post-peak failure stage, as shear displacement continued to rise, the shear force decreased significantly. The characteristic of this stage is that the materials cannot maintain the peak force previously reached, which leads to gradual stabilization at lower force levels. This behavior emphasizes the material’s progressive damage and eventual failure, showcasing the intricate balance between strength and ductility in the shear response of the samples.
3.2. Mechanical Characteristics
In shear testing, peak shear force and peak shear stress are critical parameters that provide insights into the shear behavior of materials. The peak shear stress is determined from the measured peak shear force using the following formula:
where is peak shear strength, is the peak shear force, A is the cross-sectional area of the shear plane.
Figure 7 details the relationships between these two indicators across different experimental parameters. As demonstrated in Figure 7a, both peak shear force and peak shear stress show a clear upward trend as normal stress is increased. For instance, when examining the sandstone-sandstone combination at a friction angle of 10 degrees, an increase in normal stress from 1 MPa to 3 MPa resulted in notable changes: the peak shear force rose significantly from 3.55 kN to 7.52 kN, while the peak shear stress escalated from 1.46 MPa to 3.66 MPa. These changes correspond to impressive increases of 111.83% for peak shear force and 150.68% for peak shear stress, underscoring the strong influence of normal stress on shear strength.
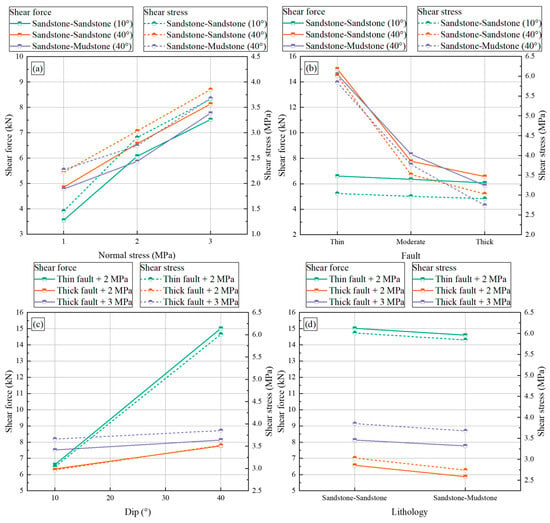
Figure 7.
Mechanical characteristics of all samples: (a) normal stress, (b) fault property, (c) fault dip, and (d) fault lithology.
This increasing trend is consistent with the principle in Mohr’s Coulomb law that shear strength is a function of normal stress, cohesion and angle of internal friction, which are essential for understanding stability and damage mechanisms in geotechnical applications. According to Mohr’s Coulomb law, the cohesion and the angle of internal friction can be obtained:
where σn is normal stress, φ is the angle of internal friction, c is cohesion.
The fitted curves are presented in Figure 8. The results indicate that cohesion values are measured at 0.47 MPa, 1.41 MPa, and 1.49 MPa, while the angles of internal friction are recorded as 47.80°, 39.14°, and 35.08°, respectively.
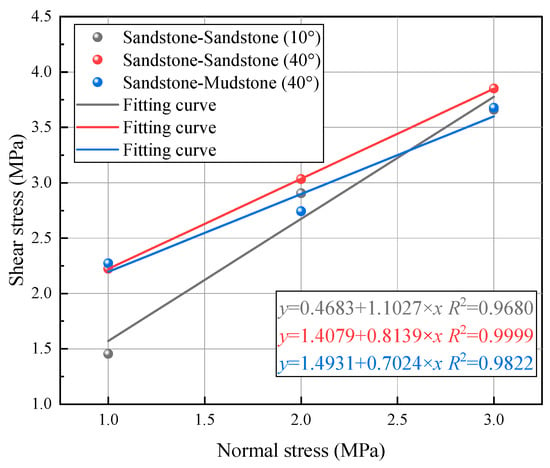
Figure 8.
Fitting curves of samples under different normal stresses.
Under different fault properties (Figure 7b), the peak shear force and shear stress decrease continuously with the increase in fault mud mass. Taking the sandstone-sandstone combination with an angle of 40° as an example, the peak shear force and shear stress decreased from 15.02 kN and 6.01 MPa to 6.57 kN and 3.03 MPa, which were reduced by 128.61% and 98.35%, respectively.
The angle of fault also affects the performance of the fault properties, and the peak shear force and shear stress decrease slowly when the angle of the fault is 10°, while the peak shear force and shear stress decrease rapidly when the angle of the fault is 40°. With the increase in the fault angle, the peak shear force and shear stress keep increasing (Figure 7c). As an example, the angle increases from peak shear and shear stress from 7.52 kN and 3.66 MPa to 8.13 kN and 3.85 MPa, which is an increase of 8.11% and 5.19%, respectively.
Different lithologic combinations will also affect the mechanical properties of the fault, and the peak shear force and shear stress keep decreasing when the sandstone combination is transformed into a sandstone-mudstone combination (Figure 7d). Taking an angle of 40° as an example, the peak shear force and shear stress decrease from 15.02 kN and 6.01 MPa to 6.57 kN and 3.03 MPa, which are reduced by 128.61% and 98.35%, respectively.
3.3. Shear Feature
3.3.1. Shear Morphology
Figure 9 exhibits the shear morphology of several samples following testing. As normal stress increases, the contact between the upper and lower faults becomes more intimate, leading to heightened shear friction and consequently more pronounced wear on the shear surfaces (see Figure 9a–c). In scenarios where the fault was minor, the shearing process primarily involves mutual shearing at the fault angles, which results in significant wear at these angles. However, as the thickness of fault mud increases, the shear process shifts towards mutual friction among the fault muds (Figure 9d). This transition leads to relatively less wear on the shear surface, but it also increases the likelihood of fault mud accumulation. Regarding the fault angle, with the increase in the fault angle, the contact area between the faults increases, and the shear process is mainly the mutual shear between the faults, which leads to more serious wear of the shear surface. Between different lithological combinations, as the strength of mudstone was lower than that of sandstone, mudstone was more prone to damage during shearing, resulting in more severe wear on the shear surface.
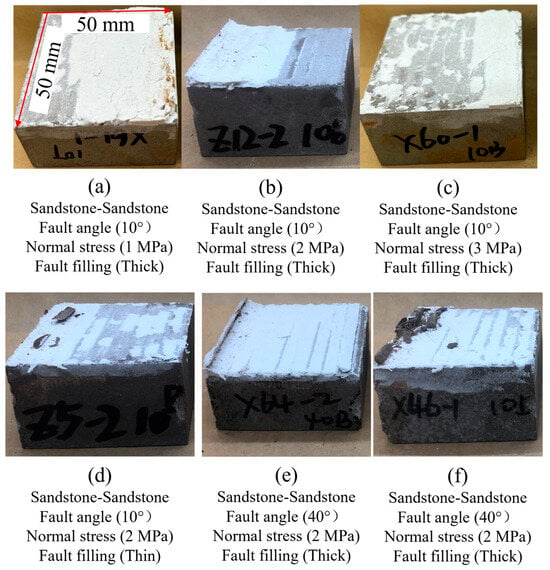
Figure 9.
Shear morphology of the fault surface: (a) sample 1, (b) sample 2, (c) sample 3, (d) sample 4, (e) sample 7, and (f) sample 12.
3.3.2. Roughness and Fractal Dimension
After the testing, the shear surface was analyzed using a high-precision optical scanner (OKIO-5M high-precision 3D topography scanner, SHINNING 3D, Hangzhou, China): The maximum measurement accuracy can reach 0.005 mm). This scanning process allowed for detailed mapping of the undulations on the shear surface (Figure 10). Roughness, which serves as a key indicator for assessing the local curvature of the shear surface, is crucial for gaining insights into fault damage mechanisms. All 3D point cloud coordinates of the shear surface were calculated by root mean square and the resulting 3D color surface map was used to qualitatively depict the roughness. The roughness R is calculated as follows [,]:
where N is total number of coordinated points, Xi is value of each coordinate point, and is the average value.
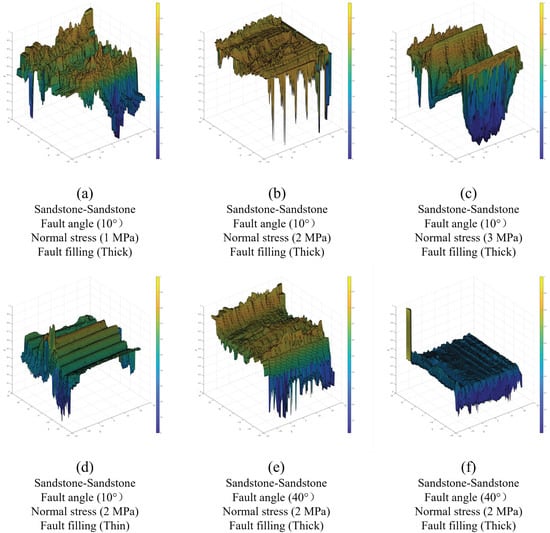
Figure 10.
Scanning results of the fault surface: (a) sample 1, (b) sample 2, (c) sample 3, (d) sample 4, (e) sample 7, and (f) sample 12.
Based on the fractal theory, the complexity and distribution characteristics of irregular geometric surfaces can be described in a quantitative manner. By meshing the raw results of 3D topographic scanning, the fractal dimension of the shear surface is calculated by the counting box dimension method with the formula []:
The fractal dimension fitting curves for some of the samples are plotted in Figure 11. The roughness and fractal dimension calculated for all samples are summarized in Table 2. From Figure 12, the surface roughness and fractal dimension keep increasing with the increase in normal stress. Taking the sandstone-sandstone assemblage and fault angle of 10 as an example, the surface roughness and fractal dimension increase from 0.152 and 2.119 to 0.414 and 2.17 when the normal stress increases from 1 to 3 MPa, which is an increase of 172.37% and 2.41%, respectively. Under different fault filling, the surface roughness and fractal dimension decrease continuously with the increase in fault filling. Taking the sandstone-sandstone assemblage with an angle of 40° as an example, the surface roughness and fractal dimension decrease from 1.331 and 2.284 to 0.726 and 2.201, which is a decrease of 45.45% and 3.63%, respectively. As the fault angle increases, the surface roughness and fractal dimension keep increasing. As an example, the surface roughness and fractal dimension increase from 0.414 and 2.17 to 1.19 and 2.201, respectively, which is an increase of 187.44% and 1.43%, respectively. In terms of different lithologies, the lithological transition increases the surface roughness, while the fractal dimension has less effect.
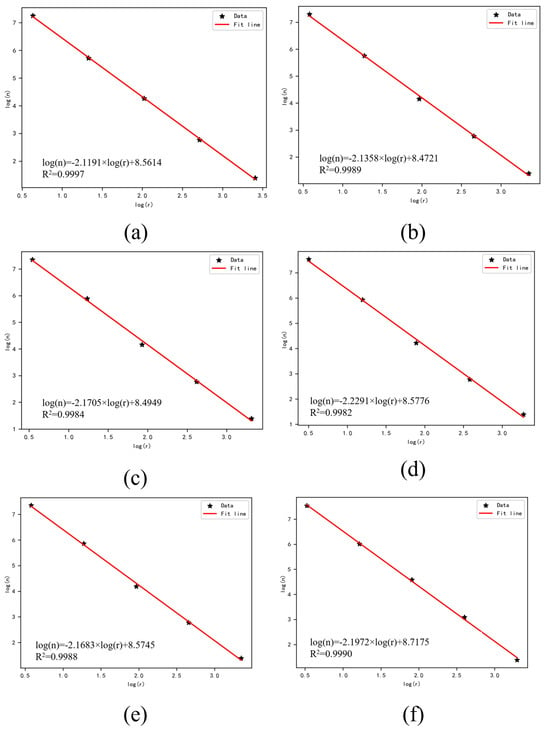
Figure 11.
Fitting results of the fault surface: (a) sample 1, (b) sample 2, (c) sample 3, (d) sample 4, (e) sample 7, and (f) sample 12.

Table 2.
Summary of roughness and fractal dimension.
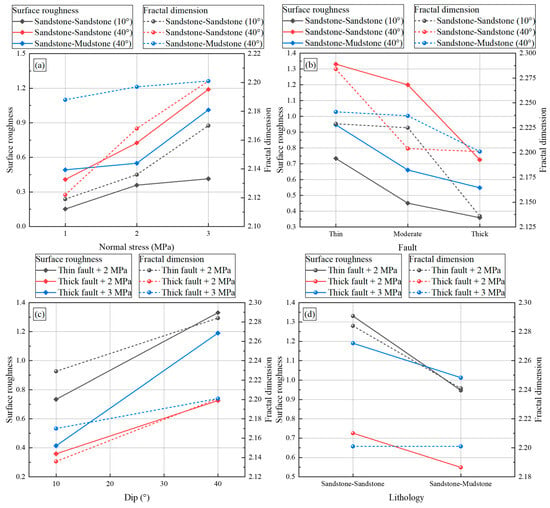
Figure 12.
Surface roughness and fractal dimension of all samples: (a) normal stress, (b) fault property, (c) fault dip, and (d) fault lithology.
4. Discussion
Rock structural features and how faults deform are important factors in determining the stability and safety of underground gas storage sites. Current research shows that a fault’s mechanical behavior and the related risk of leaks in the storage reservoir are significantly affected by normal stress, the thickness of the fault gouge (mudstone), the angle at which the fault dips, and the rock types of the wall rocks on either side of the fault.
Normal stress is a key factor in determining how strong a fault is against sliding and its overall stability. When normal stress increases, the fault rock mass becomes more resistant to shearing. This helps keep the fault stable during the operation of a reservoir, which reduces the chance of the fault slipping []. Conversely, when the shear plane’s surface is notably rough, localized stress concentrations can develop. This, in turn, can promote the formation and advancement of preferred flow paths along the fault, thereby increasing the likelihood of gas escape [,,]. Therefore, in the operational design of underground gas storage facilities, it is necessary to adopt staged injection–production and pressure-regulation strategies. By incorporating controlled pressure-relief measures, these strategies prevent fault stresses from approaching critical thresholds, ensuring an appropriate balance between stability and sealing integrity.
The influence of fault mud fill on fault mechanical behavior exhibits a complex dual nature. On one hand, the presence of weak mudstone markedly reduces the overall shear strength of the structural plane, creating a mechanically weak zone that facilitates fault activation []. On the other hand, its strong plastic deformability enables it to accommodate shear displacement, thereby mitigating abrupt stress drops and suppressing brittle failure at the controlling section []. More importantly, clay-rich fault mud can undergo shear-induced compaction, forming an effective barrier layer with enhanced sealing capacity []. This observation provides a new perspective for evaluating underground gas storage sites: certain mud-filled faults may exhibit inherent self-sealing potential. Such behavior holds important implications for both reservoir siting and long-term operational safety assessment.
The geometric morphology of faults—particularly their dip angle—is a critical structural parameter governing shear behavior. Our results show that high-angle faults (40°) exhibit substantially greater shear strength than low-angle faults (10°), underscoring the role of surface undulations in enhancing slip resistance. However, high-angle faults also generate more complex fracture networks and display greater post-shear surface roughness, indicating a higher propensity to form efficient gas-flow pathways once slip is initiated [,]. Consequently, in the process of reservoir site selection, the orientation of fault strike relative to the present-day maximum principal stress should be considered a key evaluation criterion to avoid configurations that may promote fault reactivation and gas leakage.
The properties of the surrounding rock on both sides of a fault are critical to the long-term stable operation of underground gas storage. The shear strength of sandstone–mudstone composite faults is markedly lower than that of homogeneous sandstone faults [], clearly demonstrating that fault strength is controlled not by the stronger lithology but by the weakest component—mudstone []. During shearing, the mudstone undergoes plastic yielding and failure first, thereby forming the dominant weak plane that governs fault slip []. As a result, the shear resistance of such composite faults is fundamentally dictated by the mudstone’s low cohesion and internal friction angle. This mechanism highlights that, when assessing caprock integrity and lateral sealing capacity, the lithology of both fault blocks—especially the presence, thickness, and continuity of weak interlayers—serves as a primary geological indicator for predicting fault reactivation and gas leakage risk.
In summary, the stability and integrity of fault zones in underground gas storage reservoirs are controlled by a complex interplay among rock mechanical properties, structural features, and external stress conditions. The quantitative mechanisms identified in this study provide an experimental basis for developing multi-factor coupled criteria for fault activation assessment. Looking ahead, integrating numerical modeling with in situ monitoring will enable more rigorous quantification of reservoir mechanical behavior under varying lithologies and fault architectures, thereby offering more reliable guidance for optimizing site selection and operational management.
5. Conclusions
Based on downhole core samples, a series of shear tests were conducted on fault-bearing muds to investigate the effects of various factors on fault activation. The conclusions drawn from this study are as follows:
- (1)
- A novel testing method was developed for finely engraving faults on downhole cores, allowing for the simulation of real reservoir conditions.
- (2)
- Normal stress substantially increases shear strength and the critical stress required for crack initiation by reinforcing frictional constraints along fracture surfaces. However, the accompanying changes in fracture morphology may generate potential seepage pathways, underscoring its dual effect on fault stability.
- (3)
- Increased fault mud filling promotes localized plastic deformation and reduces overall shear strength. Faults with thin mud layers exhibit higher critical crack initiation stresses, whereas those with thicker fillings demonstrate a degree of self-sealing potential.
- (4)
- For equal amounts of fault mud, the shear strength of fault specimens at a 40° angle exceeds that of specimens at a 10° angle. This implies that a greater degree of fault undulation corresponds to a higher critical slip initiation stress, reducing the likelihood of fault slip and enhancing stability.
- (5)
- Compared to sandstone–sandstone combinations, the shear strength of faults in sandstone–mudstone combinations is significantly lower. Mudstone’s weaker mechanical qualities are the main cause of this reduction. It experiences plastic deformation and fails preferentially during shearing, acting as the dominant weak plane controlling fault slip. Therefore, rather than the higher frictional resistance typical of sandstone–sandstone interfaces, the shear strength of these faults is primarily controlled by the mudstone’s intrinsic low cohesion and internal friction angle.
Author Contributions
Methodology, Y.G.; Formal analysis, H.M., G.Q. and Z.B.; Investigation, Y.G. and G.Q.; Resources, H.M.; Data curation, M.X., Y.J. and Z.B.; Writing—original draft, M.X.; Writing—review & editing, Z.B.; Visualization, Y.J. All authors have read and agreed to the published version of the manuscript.
Funding
This work was sponsored by the “National Natural Science Foundation of China” (No. 52304070), (No. 52474085), and the “National Key R&D Program of China’’ (No. 2024YFB4007100).
Institutional Review Board Statement
Not applicable.
Informed Consent Statement
Not applicable.
Data Availability Statement
The original contributions presented in this study are included in the article. Further inquiries can be directed to the corresponding author.
Acknowledgments
We would also like to thank Wei Liu for his assistance in the preparation of this manuscript.
Conflicts of Interest
The authors declare no conflict of interest.
References
- Al-Shafi, M.; Massarweh, O.; Abushaikha, A.S.; Bicer, Y. A Review on Underground Gas Storage Systems: Natural Gas, Hydrogen and Carbon Sequestration. Energy Rep. 2023, 9, 6251–6266. [Google Scholar] [CrossRef]
- Liu, H.; Yang, C.; Liu, J.; Hou, Z.; Xie, Y.; Shi, X. An Overview of Underground Energy Storage in Porous Media and Development in China. Gas Sci. Eng. 2023, 117, 205079. [Google Scholar] [CrossRef]
- Molíková, A.; Vítězová, M.; Vítěz, T.; Buriánková, I.; Huber, H.; Dengler, L.; Hanišáková, N.; Onderka, V.; Urbanová, I. Underground Gas Storage as a Promising Natural Methane Bioreactor and Reservoir? J. Energy Storage 2022, 47, 103631. [Google Scholar] [CrossRef]
- Wang, X.; Economides, M.J. Purposefully Built Underground Natural Gas Storage. J. Nat. Gas Sci. Eng. 2012, 9, 130–137. [Google Scholar] [CrossRef]
- Sambo, C.; Dudun, A.; Samuel, S.A.; Esenenjor, P.; Muhammed, N.S.; Haq, B. A Review on Worldwide Underground Hydrogen Storage Operating and Potential Fields. Int. J. Hydrogen Energy 2022, 47, 22840–22880. [Google Scholar] [CrossRef]
- Du, X.; Liu, M.; Qiu, S.; Wu, J.; Meng, X. Implications of the European Gas Market for the Long-Term Construction of Underground Gas Storage in China. Energy Sci. Eng. 2023, 11, 2137–2155. [Google Scholar] [CrossRef]
- Thiyagarajan, S.R.; Emadi, H.; Hussain, A.; Patange, P.; Watson, M. A Comprehensive Review of the Mechanisms and Efficiency of Underground Hydrogen Storage. J. Energy Storage 2022, 51, 104490. [Google Scholar] [CrossRef]
- Bakhtiari, M.; Shad, S.; Zivar, D.; Razaghi, N. Coupled Hydro-Mechanical Analysis of Underground Gas Storage at Sarajeh Field, Qom Formation, Iran. J. Nat. Gas Sci. Eng. 2021, 92, 103996. [Google Scholar] [CrossRef]
- Zhang, S.; Shi, L.; Jia, D. An Uncertainty Quantitative Model of Wellbore Failure Risk for Underground Gas Storage in Depleted Gas Reservoir During the Construction Process. J. Energy Storage 2023, 57, 106144. [Google Scholar] [CrossRef]
- Liu, C.; Zhang, F.; Wang, Q.; Wang, B.; Zhang, Q.; Xu, B. Evaluation of Fault Stability and Seismic Potential for Hutubi Underground Gas Storage Due to Seasonal Injection and Extraction. Undergr. Space 2023, 13, 74–85. [Google Scholar] [CrossRef]
- Zhao, W.; An, M.; Dal Zilio, L.; Zhao, L.; Zhu, H.; Shen, X.; Gan, Q.; Zhang, F.; Elsworth, D. Coupled Evolution of Seismicity and Permeability in Fault Zones. Commun. Earth Environ. 2025, 6, 918. [Google Scholar] [CrossRef]
- Saffou, E.; Gholami, R.; Raza, A.; Mahmoud, M.; Manzi, M.S.D.; Durrheim, R. A One-Way Coupled Geomechanical Model for CO2 Storage in Faulted Depleted Gas Reservoirs. Gas Sci. Eng. 2023, 120, 205143. [Google Scholar] [CrossRef]
- Yu, J. Surface Subsidence Induced by Salt Cavern Gas Storage and Its Impact on Railway Safety: Numerical Simulation and Fuzzy Evaluation. Results Eng. 2025, 26, 105331. [Google Scholar] [CrossRef]
- Lackey, G.; Mundia-Howe, M.; Pekney, N.J. Underground Natural Gas Storage Facility Operations and Well Leakage Events in the United States. Geoenergy Sci. Eng. 2024, 234, 212630. [Google Scholar] [CrossRef]
- Yang, S.; Hu, S.; Qi, Z.; Li, J.; Yan, W.; Huang, X.; Ao, X.; Yuan, Y. Stability Evaluation of Fault in Hydrocarbon Reservoir-Based Underground Gas Storage: A Case Study of W Gas Storage. Fuel 2024, 357, 129657. [Google Scholar] [CrossRef]
- Zhao, Z.; Cui, J.; Liu, H.; Jia, S.; Liu, C.; Xi, Z.; Wen, C. Geo-Mechanical Evaluation of a Proposed Gas Storage in Aquifer Anticline Trap with Deep Fault. Bull. Eng. Geol. Environ. 2024, 83, 102. [Google Scholar] [CrossRef]
- Chang, K.W.; Segall, P. Injection-Induced Seismicity on Basement Faults Including Poroelastic Stressing. J. Geophys. Res. Solid Earth 2016, 121, 2708–2726. [Google Scholar] [CrossRef]
- Fan, Z.; Eichhubl, P.; Newell, P. Basement Fault Reactivation by Fluid Injection Into Sedimentary Reservoirs: Poroelastic Effects. J. Geophys. Res. Solid Earth 2019, 124, 7354–7369. [Google Scholar] [CrossRef]
- Peter, E.; Fan, Z.; Zhu, C. Basement Fault Reactivation by Fluid Injection into Sedimentary Reservoirs; ADS: Cambridge, MA, USA, 2017; p. 10679. [Google Scholar]
- Lv, Y.; Yuan, C.; Zhu, X.; Gan, Q.; Li, H. THMD Analysis of Fluid Injection-Induced Fault Reactivation and Slip in EGS. Geothermics 2022, 99, 102303. [Google Scholar] [CrossRef]
- Benfu, Y.; Xiangzhen, Y.; Henglin, Y.; Zhiqian, X.; Xiujuan, Y.; Yaorong, F. Non-Probabilistic Reliability Analysis of Dead Fault Slip in Underground Gas Storage Based on Convex Model. Acta Pet. Sin. 2014, 35, 577. [Google Scholar] [CrossRef]
- Ban, S.; Liu, H.; Mao, H.; Shi, X.; Qiu, X.; Liu, M.; Min, Z.; Song, Y.; Wei, X. Numerical Tracking of Natural Gas Migration in Underground Gas Storage with Multilayered Sandstone and Fault-Bearing Caprocks. Energies 2023, 16, 4936. [Google Scholar] [CrossRef]
- Gan, Q.; Lei, Q. Induced Fault Reactivation by Thermal Perturbation in Enhanced Geothermal Systems. Geothermics 2020, 86, 101814. [Google Scholar] [CrossRef]
- Jacquey, A.B.; Cacace, M.; Blöcher, G.; Scheck-Wenderoth, M. Numerical Investigation of Thermoelastic Effects on Fault Slip Tendency during Injection and Production of Geothermal Fluids. Energy Procedia 2015, 76, 311–320. [Google Scholar] [CrossRef]
- Wang, W.; Sun, S.; Le, H.; Shu, Y.; Zhu, F.; Fan, H.; Liu, Y. Experimental and Numerical Study on Failure Modes and Shear Strength Parameters of Rock-Like Specimens Containing Two Infilled Flaws. Int. J. Civ. Eng. 2019, 17, 1895–1908. [Google Scholar] [CrossRef]
- Barton, N.R. A Model Study of Rock-Joint Deformation. Int. J. Rock Mech. Min. Sci. Geomech. Abstr. 1972, 9, 579–582. [Google Scholar] [CrossRef]
- Jafari, M.K.; Amini Hosseini, K.; Pellet, F.; Boulon, M.; Buzzi, O. Evaluation of Shear Strength of Rock Joints Subjected to Cyclic Loading. Soil. Dyn. Earthq. Eng. 2003, 23, 619–630. [Google Scholar] [CrossRef]
- Mirzaghorbanali, A.; Nemcik, J.; Aziz, N. Effects of Shear Rate on Cyclic Loading Shear Behaviour of Rock Joints Under Constant Normal Stiffness Conditions. Rock. Mech. Rock Eng. 2014, 47, 1931–1938. [Google Scholar] [CrossRef]
- Indraratna, B.; Oliveira, D.A.f.; Brown, E.T. A Shear-Displacement Criterion for Soil-Infilled Rock Discontinuities. Géotechnique 2010, 60, 623–633. [Google Scholar] [CrossRef]
- Ding, G.; Liu, H.; Xia, D.; Wang, D.; Huang, F.; Guo, H.; Xie, L.; Guo, Y.; Wu, M.; Mao, H. Experimental Study of the Shear Characteristics of Fault Filled with Different Types of Gouge in Underground Gas Storage. Energies 2023, 16, 3119. [Google Scholar] [CrossRef]
- Yang, H.; Chang, X.; Yang, C.; Guo, W.; Wang, L.; Zhao, G.; Guo, Y. Visualization and Characterization of Experimental Hydraulic Fractures Interacting with Karst Fracture-Cavity Distributions. J. Rock Mech. Geotech. Eng. 2024, 16, 1667–1683. [Google Scholar] [CrossRef]
- Yang, H.; Wang, L.; Yang, C.; Guo, Y.; Guo, W.; Bi, Z.; Zhao, G. Visualization and Quantitative Statistics of Experimental Hydraulic Fracture Network Based on Optical Scanning. J. Nat. Gas Sci. Eng. 2022, 105, 104718. [Google Scholar] [CrossRef]
- Shi, D.; Li, L.; Guo, Y.; Liu, J.; Tang, J.; Chang, X.; Song, R.; Wu, M. Estimation of Rough Fracture Network Permeability Using Fractal and Topology Theories. Gas Sci. Eng. 2023, 116, 205043. [Google Scholar] [CrossRef]
- Zhang, L.; Zhang, C.; Liu, N.; Fang, Z.; Zhou, A.; Xie, Q.; Cui, G. The Normal Stiffness Effect on Fault Slip Mechanical Behaviour Characteristics. Eng. Geol. 2024, 338, 107609. [Google Scholar] [CrossRef]
- Hu, W.; Li, Y.; Gou, H.; Jia, X.; Zhou, L.; Chang, C. Influence of Normal Stress, Shear Velocity and Materials on Steady-State Shear Resistance and Viscosity of Rapid Dry Granular Flows. J. Geophys. Res. Solid Earth 2025, 130, e2025JB031305. [Google Scholar] [CrossRef]
- Gao, G.; Zhang, Y.; Yang, Z.; Duan, B.; Liu, W.; Zhang, X.; Qiu, X.; Liu, M. Sealing Integrity in Faulted Underground Gas Storage: A Case Study of the Nanpu-1 Gas Storage, Eastern China. Energy Rep. 2025, 13, 1004–1013. [Google Scholar] [CrossRef]
- Song, Y.; Liu, H.; Min, Z.; Liu, M.; Qiu, X.; Liu, J.; Yang, C. Mechanism of Fault Slippage in the Underground Gas Storage and Preliminary Application in the Shuang 6 UGS in China. Geoenergy Sci. Eng. 2025, 251, 213881. [Google Scholar] [CrossRef]
- Xu, Z.; Yu, T.; Lin, P.; Li, S. Anomalous Patterns of Clay Minerals in Fault Zones. Eng. Geol. 2023, 325, 107279. [Google Scholar] [CrossRef]
- Ashman, I.R.; Faulkner, D.R. The Effect of Clay Content on the Dilatancy and Frictional Properties of Fault Gouge. J. Geophys. Res. Solid Earth 2023, 128, e2022JB025878. [Google Scholar] [CrossRef]
- Cheng, S.; Ding, G.; Wu, Z.; Qiu, X.; Xu, H.; Liu, B. Influence of Fault Dip Angle and Strength on Fault Slip Characteristics of Gas Storage. Processes 2024, 12, 1869. [Google Scholar] [CrossRef]
- Smith, S.A.F.; Tesei, T.; Scott, J.M.; Collettini, C. Reactivation of Normal Faults as High-Angle Reverse Faults Due to Low Frictional Strength: Experimental Data from the Moonlight Fault Zone, New Zealand. J. Struct. Geol. 2017, 105, 34–43. [Google Scholar] [CrossRef]
- Li, X.; Lei, X.; Li, Q. Fault Nucleation of Tight Sandstone by Investigation of Mechanical, Acoustic, and Hydraulic Responses. Eng. Geol. 2021, 292, 106254. [Google Scholar] [CrossRef]
- Zuo, Q.; Li, X.; Li, P.; Deng, M.; Adoko, A.C. Surrounding Rock Instability Mechanism for Fault-Crossing Tunnels in Water-Rich Soft Rock. Bull. Eng. Geol. Environ. 2024, 83, 252. [Google Scholar] [CrossRef]
- Chen, P.-H.; Chen, Y.-H.; Chen, Y.-C.; Hsu, C.-C. Unraveling Fluid-Rock Coupling in Mudstone Fault Zones: Experimental Perspectives from Southwestern Taiwan. J. Geophys. Res. Solid Earth 2025, 130, e2025JB031935. [Google Scholar] [CrossRef]
Disclaimer/Publisher’s Note: The statements, opinions and data contained in all publications are solely those of the individual author(s) and contributor(s) and not of MDPI and/or the editor(s). MDPI and/or the editor(s) disclaim responsibility for any injury to people or property resulting from any ideas, methods, instructions or products referred to in the content. |
© 2025 by the authors. Licensee MDPI, Basel, Switzerland. This article is an open access article distributed under the terms and conditions of the Creative Commons Attribution (CC BY) license (https://creativecommons.org/licenses/by/4.0/).