You are currently viewing a new version of our website. To view the old version click .
Applied Sciences
  • Article
  • Open Access

19 November 2025

Study of the Particle Breakage Characteristics of Coral Sand Under the Effect of Freezing–Seepage Coupling

,
,
,
,
and
1
Department of Geotechnical Engineering, College of Civil Engineering, Tongji University, Shanghai 200092, China
2
Key Laboratory of Geotechnical and Underground Engineering (Tongji University), Ministry of Education, Shanghai 200092, China
3
School of Civil Engineering and Architecture, Hainan University, Haikou 570228, China
*
Author to whom correspondence should be addressed.
This article belongs to the Section Civil Engineering

Abstract

In the development and construction of the South China Sea (SCS), coral sand is a kind of common natural construction material. Sanya submarine tunnel is the first application of artificial ground freezing (AGF) in the SCS. Since the tunnel is located at an estuary, high-velocity seepage will have a significant influence on the particle characteristics of coral sand under freezing conditions. Therefore, taking coral sand from the SCS as the research object, the one-dimensional soil column unidirectional freezing test, particle sieving test, and scanning electron microscope (SEM, Hitachi High-Tech Corporation, Tokyo, Japan) test were carried out to investigate the particle breakage and temperature variation characteristics of coral sand under the coupling effect of freezing and seepage. The results show that under the coupling effect of freezing and seepage, coral sand particle breakage was significant. Under none-seepage and 0.5 m/d seepage velocity, the proportion of particles in the 0.5–2 mm size range in the frozen and phase transition zones decreased, while the proportion in the 0.125–0.5 mm size range increased. Through SEM analysis, the coupling effect of freezing and seepage caused serious damage to coral sand particles. Intense freezing could cause coral sand particles to break, while strong seepage could increase the roundness of particles. Seepage would affect the freezing rate and the final stabilization of the freezing temperature; when the seepage velocity was small (0–1.2 m/d), the impact of seepage was not obvious, and when seepage rate was larger (3 m/d), the impact throughout the entire freezing process both reduced the freezing rate and increased the final stabilization of the temperature. This study can provide a reference basis for the research on particle characteristics of coral sand under the coupling effect of freezing and seepage and for engineering and construction in the SCS.

1. Introduction

The South China Sea (SCS) is an inseparable part of China’s maritime territory. With the advancement of the “Maritime Power Strategy”, the SCS region has been continuously developed, among which the exploitation of underground space holds particular significance. Sanya submarine tunnel pipe curtain artificial ground freezing (AGF) project, as the first application of AGF in the SCS [1], has promoted the application and development of AGF within this area. The view of the Sanya submarine tunnel pipe curtain AGF project is shown in Figure 1. The project location is at a certain estuary in Sanya, Hainan Province, China. Coral sand, as a typical kind of building material in the SCS, exhibits the characteristics of low particle strength, large internal pores, diverse particle shapes, and loose structure [2,3,4]. Furthermore, as the channel is situated at the estuary, it might be affected by high-velocity seepage flow, which in turn can have an impact on the execution of the artificial freezing. The seepage action can significantly affect the deformation characteristics and particle distribution of coral sand [5,6]. The application of AGF technology in underground construction under seepage conditions in the SCS where coral sand is extensively distributed will be influenced by these factors. Consequently, it will give rise to numerous uncertainties.
Figure 1. View of the Sanya submarine tunnel pipe curtain AGF project.
The proneness to particle breakage is a crucial property of coral sand. At the macroscopic scale, numerous scholars have carried out relevant experimental and numerical simulation studies regarding the particle breakage of coral sand. Li et al. [7] found that coral sand with less fine particles in a loose state is more prone to breakage. Liu et al. [8] developed a representative volume element for coral sand particle breakage and a dual-porosity model of coral sand by virtue of the discrete element method and the finite element method. It was discovered that particle breakage attenuates the mechanical properties of coral sand. Peng et al. [9] showed through DEM (discrete element method) simulations that particles with high angularity can increase particle breakage within the relatively narrow shear bands in coral sand samples. Additionally, they deduced the relationship between particle breakage pattern and breakage region surrounding the pile tip. Wan et al. [10] conducted a study on the penetration mechanisms and bearing characteristics of steel pipe piles in coral sand, considering particle breakage. The results indicate that particle breakage can cause the redistribution of coral sand particles around the pile, thereby significantly influencing the bearing characteristics of steel pipe piles. Wang et al. [11] discovered through triaxial compression tests that the particle breakage of coral sand increases as the axial strain grows. Meanwhile, they proposed a model for the evolution path of particle breakage. Lin et al. [12] investigated the fractal behavior of coral sand through impact loading tests. The results showed that under the action of impact loads, coral sand experienced breakage, exhibiting distinct fractal characteristics. Moreover, the fractal dimension increased as the degree of breakage augmented. Coral sand is susceptible to breakage under the influence of multiple factors. Nevertheless, existing research has not considered the particle breakage of coral sand under the coupled action of freezing and seepage.
The particle breakage of coral sand can be macroscopically identified; however, it requires microscopic analysis for a more in-depth interpretation. Guo et al. [13] fabricated cement-based composites with coral sand. Microscopic analysis revealed that the composites had a rough surface and a reduced number of pores, thus resulting in better mechanical properties. Zhang et al. [14] employed the low-field nuclear magnetic resonance (LF-NMR) technique to ascertain the optimal sand-to-cement ratio of coral mortar. The findings indicated that the compressive strength of coral mortar was inferior to that of silica mortar. Zhang et al. [15] used ultrasonic pulses to explore the compressive behavior of coral aggregates. Through SEM analysis, it was discovered that coral aggregates enhanced the compressive of the structure. Yang et al. [16] used three-dimensional X-ray micro-computed tomography to perform three-dimensional reconstruction of coral sand. They investigated the particle variations in coral sand before and after impact loading, and unveiled the evolutionary laws governing the liquefaction process of coral sand. Deng et al. [17] conducted an SEM test on coral sand cement-based composites with varying basalt fiber contents. It was found that basalt fibers induced the formation of hydration products in diverse shapes within the composites, and a robust three-dimensional skeleton network structure was established. Although existing studies on the microstructure of coral sand are rather extensive, research considering the microstructure of coral sand under the coupling action of freezing and seepage remains scarce.
Therefore, based on the one-dimensional soil column unidirectional freezing test, particle sieving test, and SEM test, the study focuses on coral sand from the SCS, exploring the particle breakage characteristics of coral sand after the freezing–seepage coupling process and the temperature variations which occur during the coupling process. The research findings will offer a reference for the study of the particle characteristics of coral sand under the freezing–seepage coupling effect and provide technical support for the construction of projects in the SCS.

2. Test Materials and Methods

2.1. Test Materials

In the study, the coral sand sample used was coral calcareous sand from an island reef in the SCS. The principal component of the sand is calcium carbonate. The macro- and micro-figures and the particle distribution of coral sand are shown in Figure 2 and Figure 3, while the basic physical property indices determined by a geotechnical engineering investigation report of a certain island in Hainan, are shown in Table 1. To regulate the particle size of coral sand used in the tests, in accordance with the Chinese standard for geotechnical testing method (GB/T 50123-2019) [18], a 2 mm particle size standard sieve was used to ensure the particle size of the coral sand for the tests was restricted to within 2 mm.
Figure 2. Macro- and micro-figures of coral sand used in the test. (a) Picture of coral sand. (b) SEM figure of coral sand.
Figure 3. Particle size distribution of coral sand used in the test.
Table 1. Basic physical properties of coral sand.

2.2. Test Instruments and Methods

2.2.1. One-Dimensional Soil Column Unidirectional Freezing Test

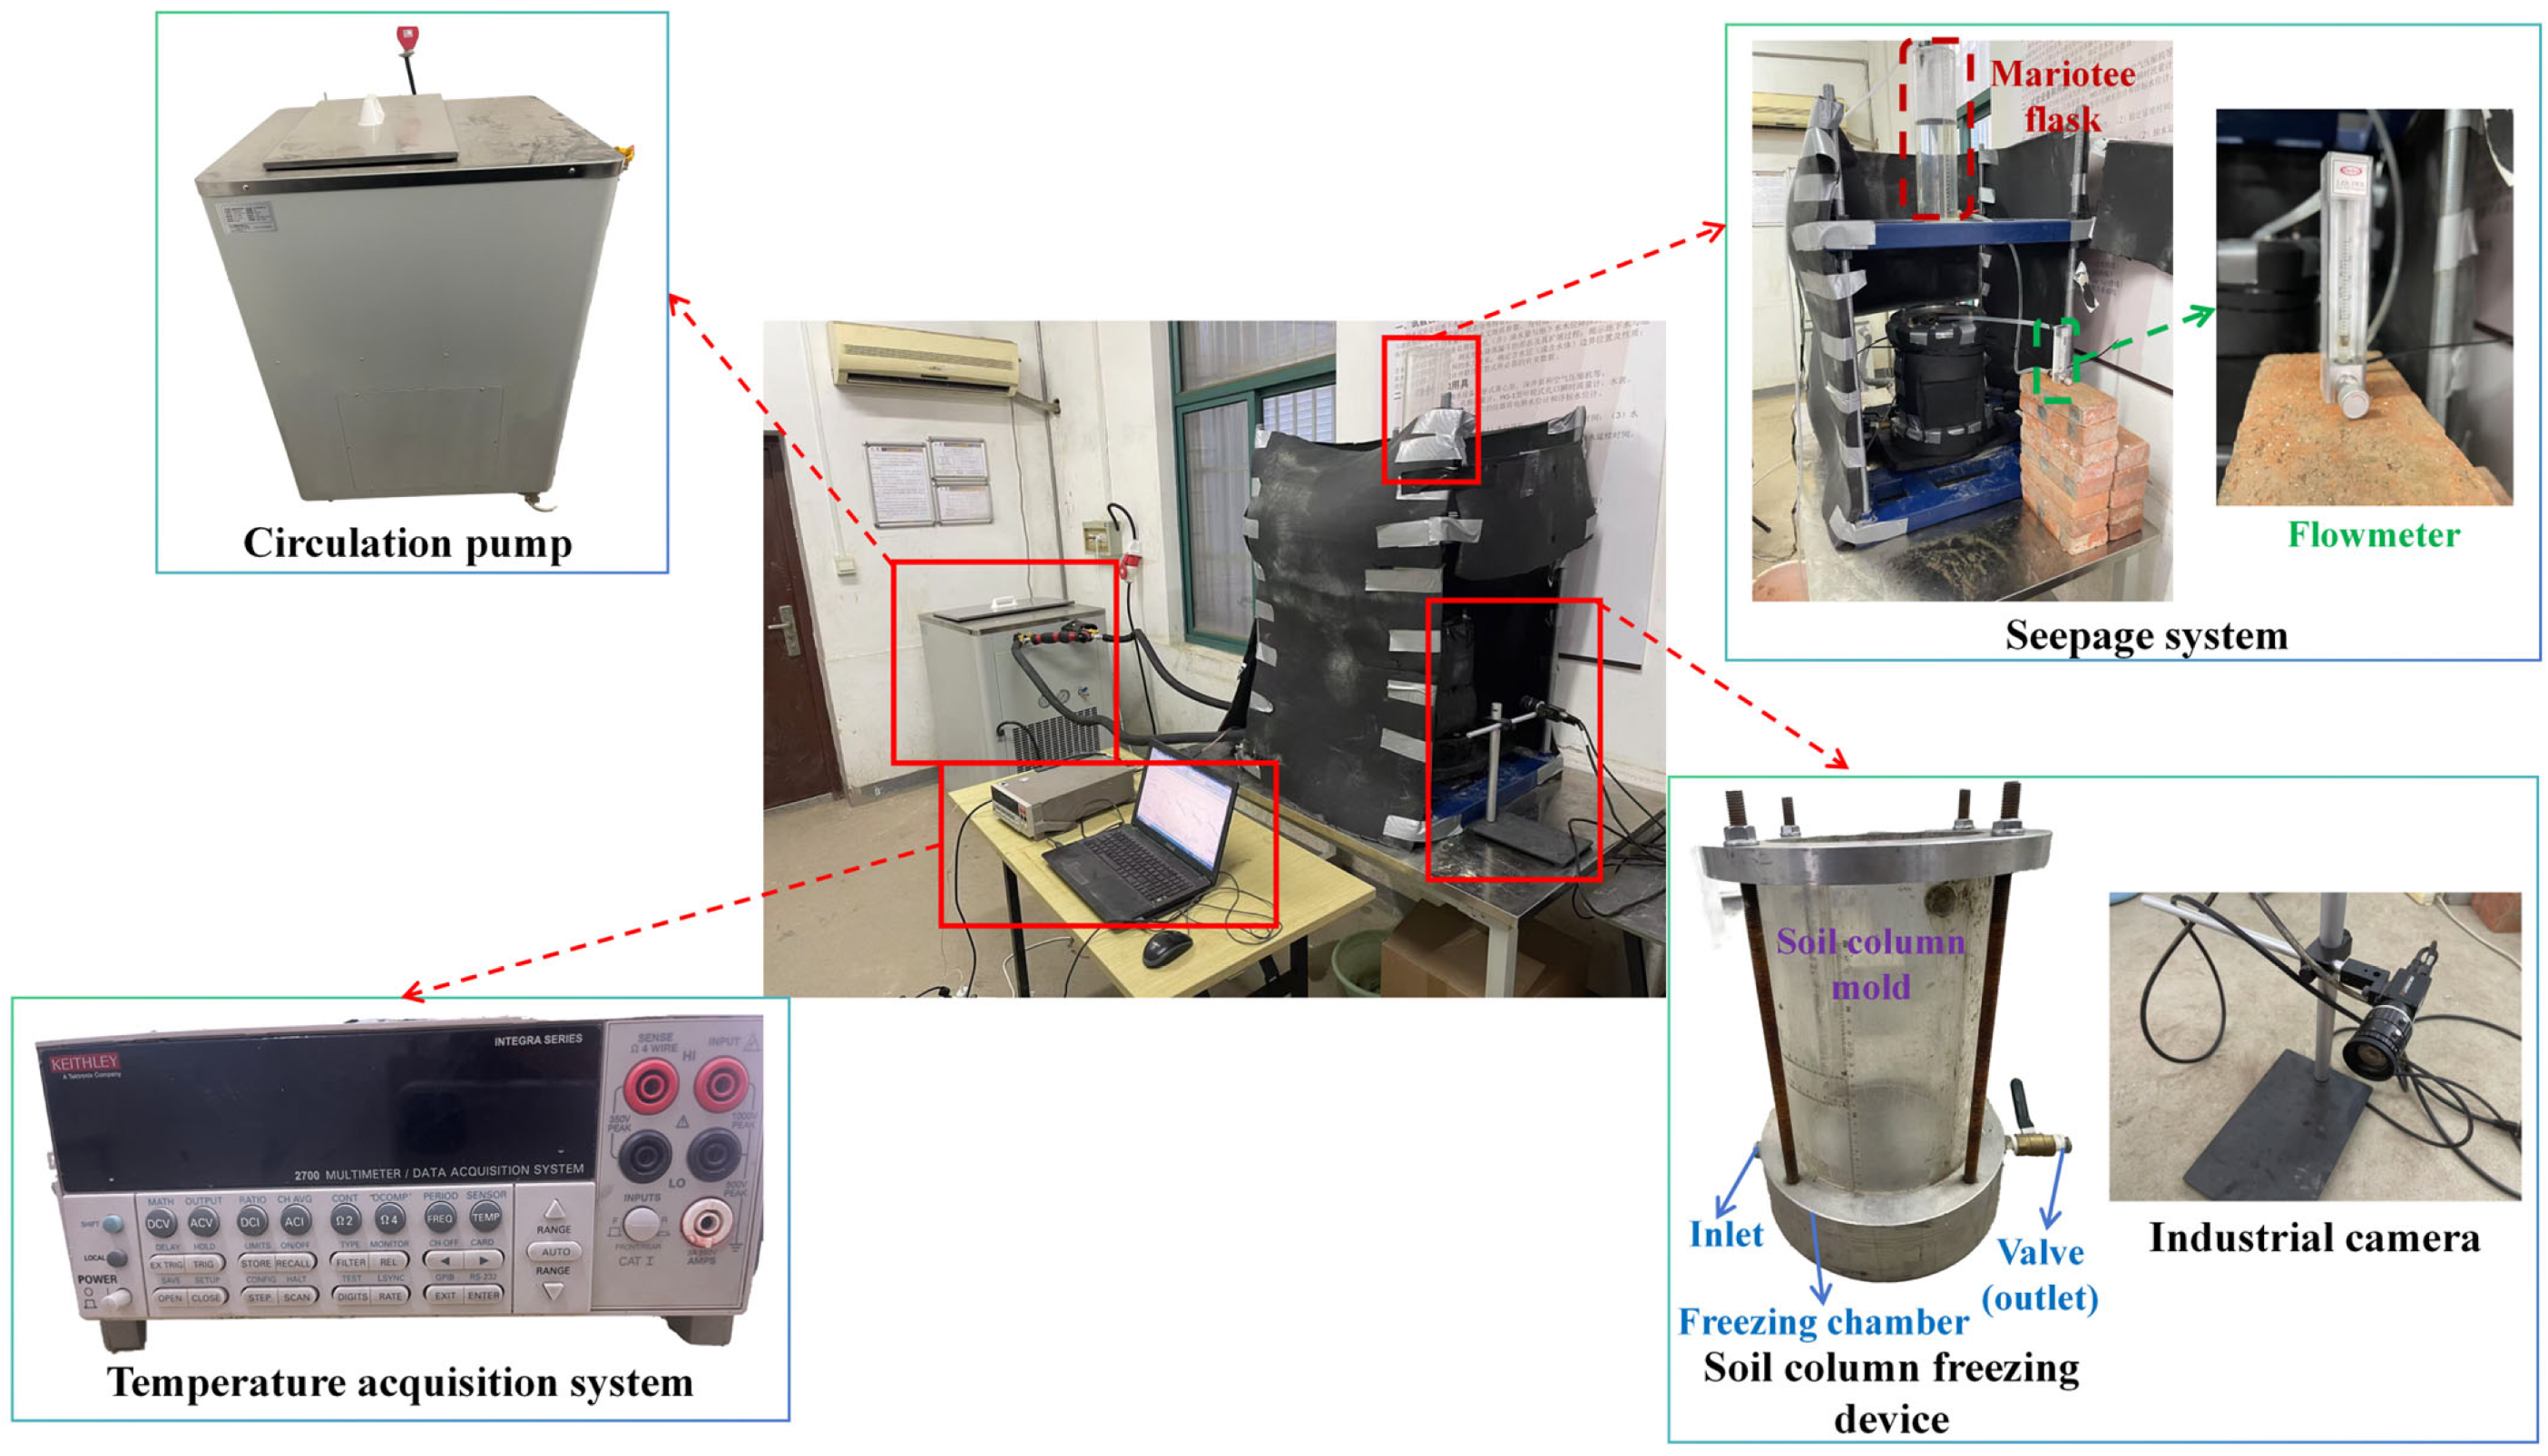
The one-dimensional soil column unidirectional freezing test system is shown in Figure 4. The test system includes a low-temperature cold liquid circulation pump (TMS8039-R40, Tomos Technology, Hangzhou, Zhejiang, China), a temperature acquisition system (Keithley 2700-7700; Keithley Instruments, Inc., Cleveland, OH, USA), a self-made one-dimensional soil column unidirectional freezing device, a seepage system, and an industrial camera. The self-made one-dimensional soil column freezing device mainly consists of a freezing chamber with perfect thermal conductivity at the bottom and a soil column mold at the top. The freezing chamber includes a circulating liquid inlet and outlet as well as valves, where the inlet and outlet are connected to the circulating liquid outlet and inlet of the circulation pump. The soil column mold is composed of two semi-circular organic glass, with a seepage inlet at the top and a seepage outlet at the bottom. Multiple thermocouple insertion holes are provided on the side of the mold, enabling the monitoring of temperature at different heights of the soil during the artificial freezing test. Furthermore, the circulation pump can supply a stable cold source at the bottom of the soil column. The circulating medium within the pump is ethylene glycol. Thermocouples are capable of capturing real-time temperature signals, which through the temperature acquisition system are converted into temperature data and logged onto a computer. The seepage system is designed to provide various seepage velocities, and the industrial camera is used to capture images of the coral sand freezing conditions during the test.
Figure 4. One-dimensional soil column unidirectional freezing test system.
The aim of the study is to explore the particle breakage characteristics of coral sand after the freezing–seepage coupling process under different seepage conditions and temperature variations during the coupling process. To meet the research target, in the artificial freezing test the temperature of circulation pump was set at −30 °C to ensure a stable cold source. The variable to be controlled in the test was seepage velocity. According to the Chinese specification of the technical code for the cross-passage freezing method [19], when seepage velocity exceeds 2 m/d, special treatments are necessary for construction using the AGF method. Consequently, a total of four groups of the test with four different seepage velocities were designed [20,21]. In order to reveal the core physical process of the variations in the characteristic of coral sand particles under the coupling effect of freezing and seepage and to provide a clear reference baseline for subsequent investigations under more complex salt-containing conditions, the study used fresh water as the seepage fluid. Other conditions in the test should be kept as consistent as possible to minimize the interference of other factors. The one-dimensional soil column unidirectional freezing test scheme is shown in Table 2. Owing to the limitations of the test conditions, only one test was carried out for each seepage condition covered in the study.
Table 2. One-dimensional soil column unidirectional freezing test scheme.
For the one-dimensional soil column unidirectional freezing test, the test steps are as follows:
  • Sample preparation
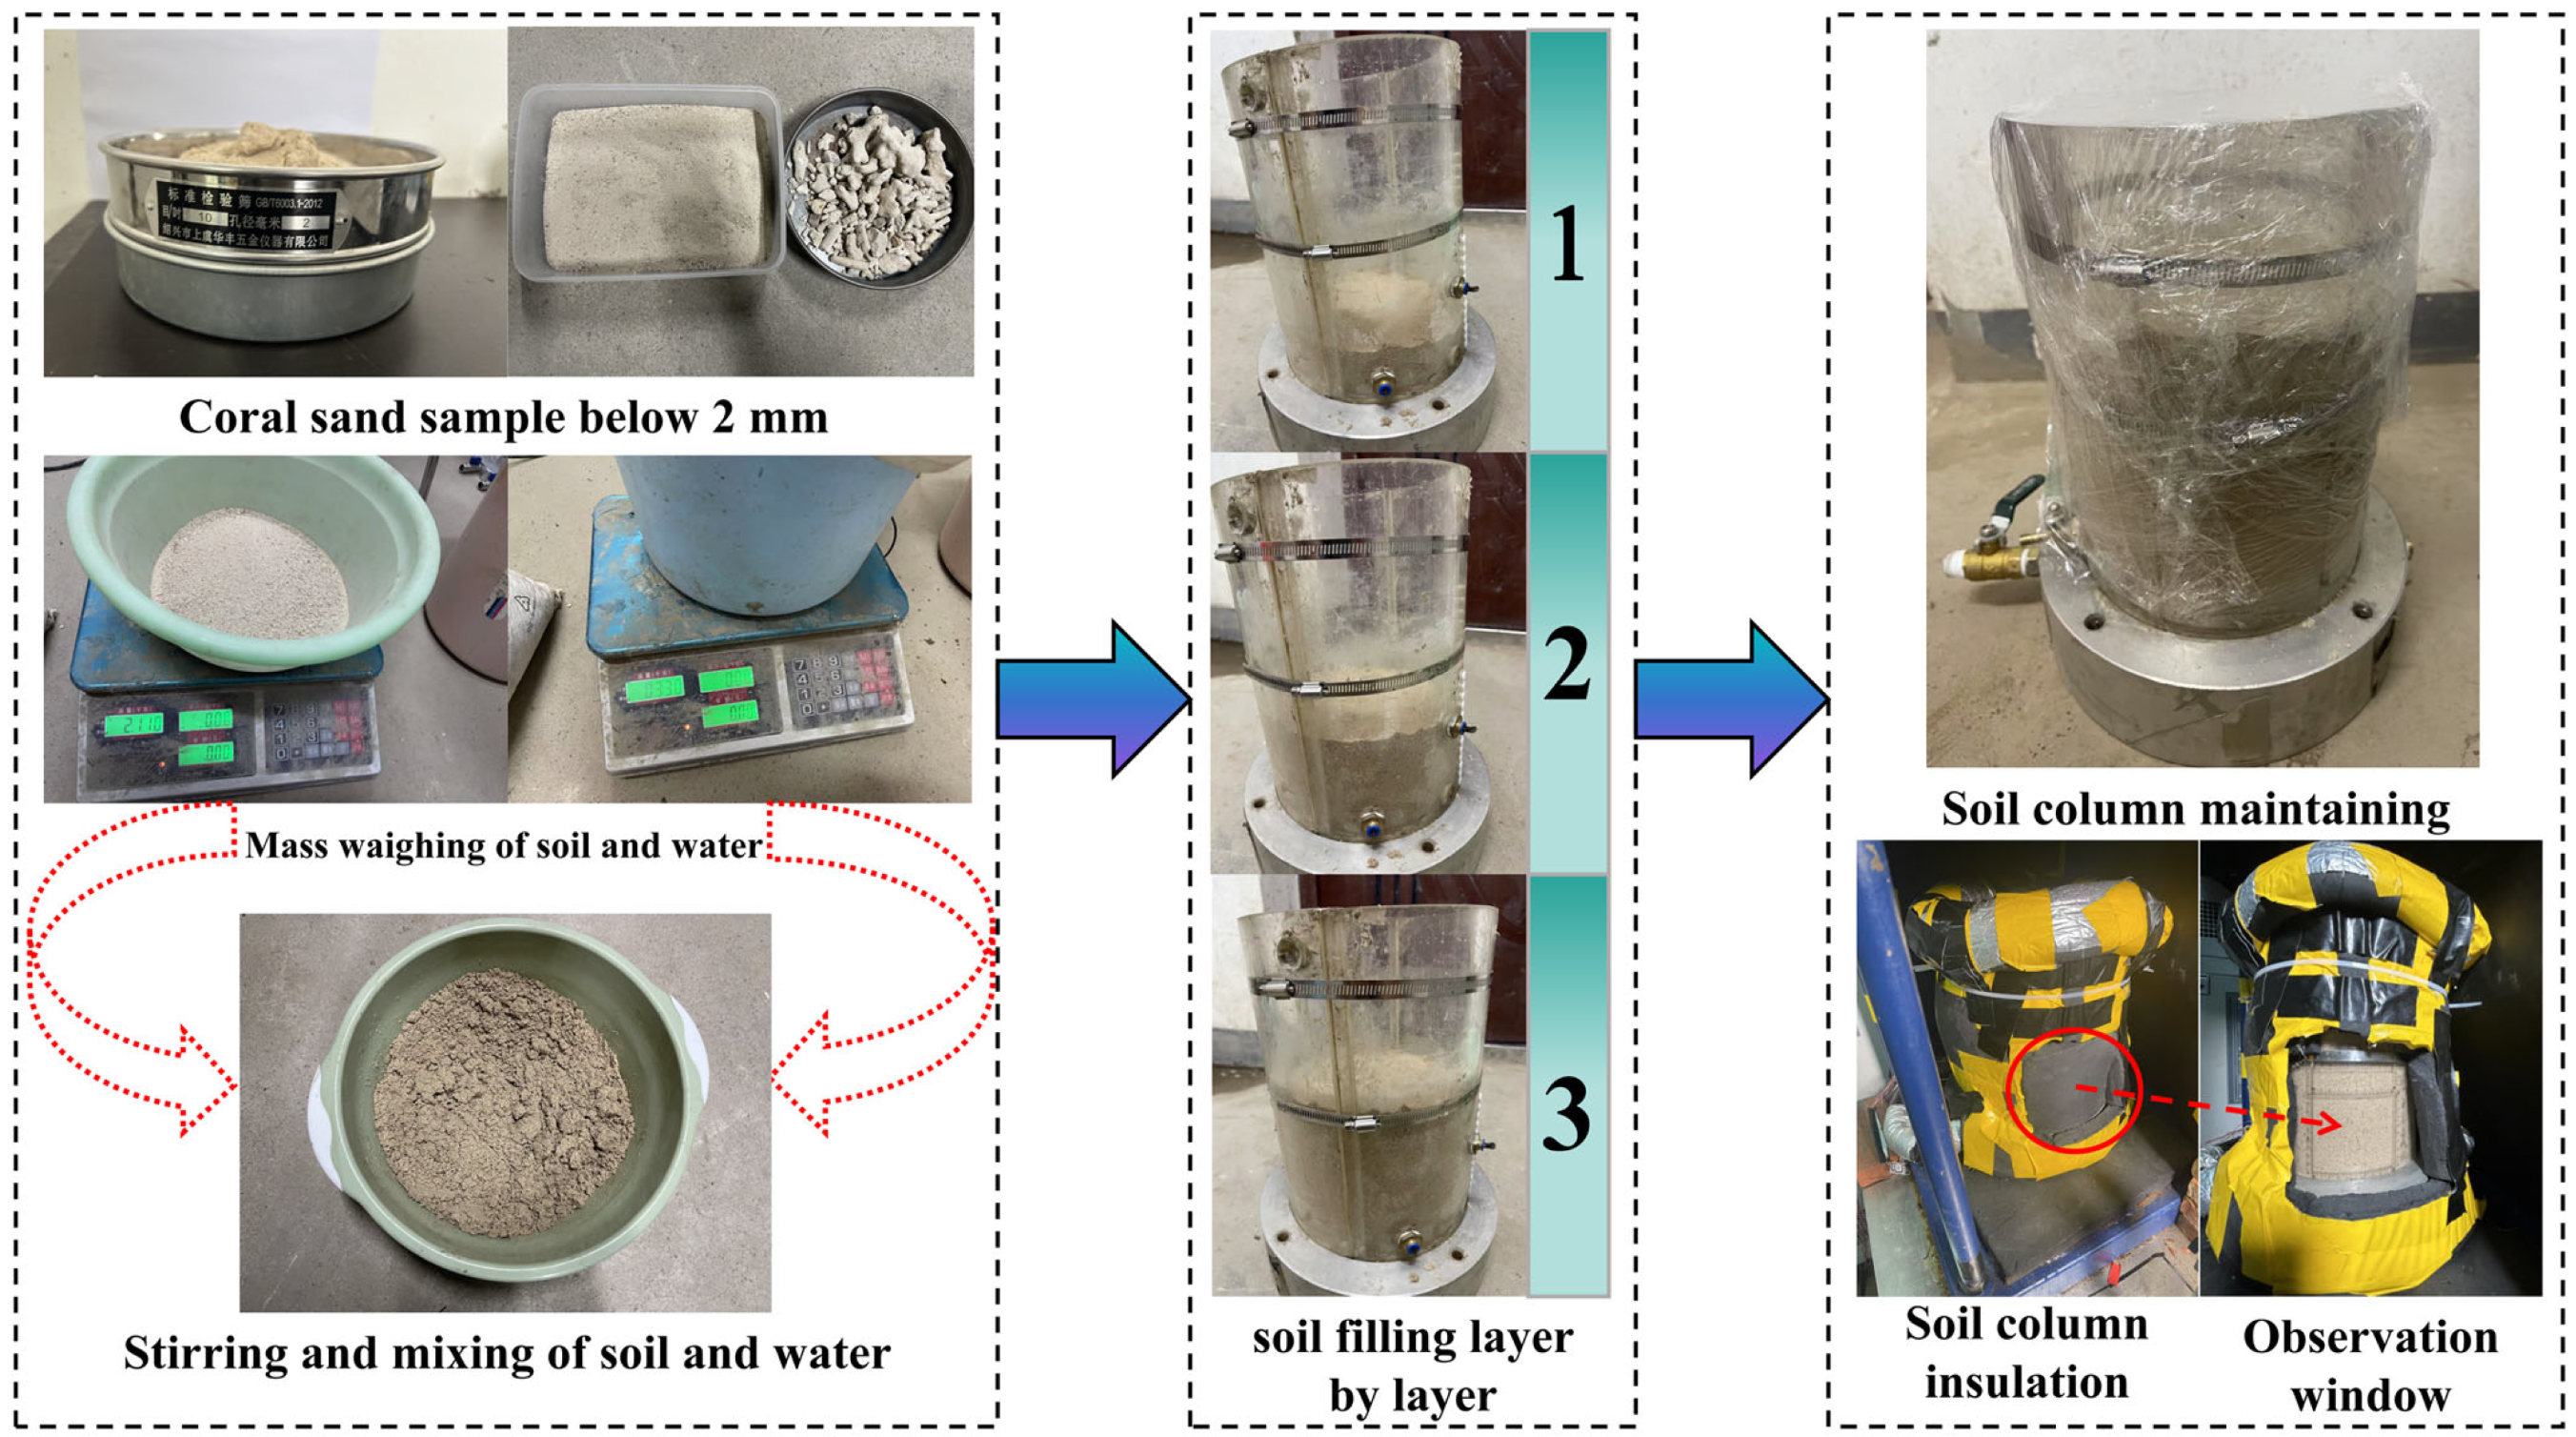
Coral sand samples with particle sizes less than 2 mm, obtained through sieving, are used. Based on the dry density of coral sand (1.8 g/cm3), the optimal moisture content is (15.6%) [22], the dimension of the soil column is (diameter of 18 cm), and the filling height is (15 cm). According to the Chinese standard for geotechnical testing method (GB/T 50123-2019) [18], the filling was carried out in three layers using the layered compaction method. Specifically, the filling height of each layer was strictly controlled at 5 cm. It was calculated that the mass of coral sand samples required for each layer was 2.11 kg, and the mass of water is 0.33 kg. The weighed coral sand and water were thoroughly stirred and mixed, and filling was conducted layer by layer. After the completion of filling, the surface of the soil column was wrapped with cling film, maintaining the soil column. Subsequently, it was placed on the reaction frame to continue the subsequent preparations of the artificial freezing test. The sample preparation process is shown in Figure 5.
2.
Thermal insulation of soil column
During the one-dimensional soil column unidirectional freezing test, minimizing the heat exchange between soil column and external experiment is a crucial aspect that requires particular attention. Thus, it is essential to employ thermal insulation cotton to comprehensively insulate the prepared soil column. The approach aims to reduce the loss of cold energy to the greatest extent possible, thereby ensuring the consistency of test variable control. During the process of insulating the soil column, an observation window should be left in the middle-lower part of one side of the soil column for observing the coral sand during the test. On the other side, thermocouples were inserted at different heights to acquire temperature data throughout the entire freezing process.
3.
Equipment debugging, connection, and test description
The freezing chamber of the soil column was connected to the circulation pump, which maintained the circulating fluid at a constant temperature of −30 °C with an accuracy of ±0.1 °C. The seepage system was mounted atop the reaction frame. The whole freezing process of coral sand was captured and monitored using an industrial camera under a calibrated light source. The test started by turning off the internal-circulation function of the circulation pump once the target temperature was stabilized. The temperature of different heights of coral sand during the freezing process was recorded by thermocouples. The freezing of coral sand began when the temperature at the bottom of the soil column dropped below 0 °C, and completion was confirmed when the temperature across all measurement points reached a steady state, upon which the test was terminated for the thawing phase.
Figure 5. Diagram of one-dimensional soil column unidirectional freezing test process.
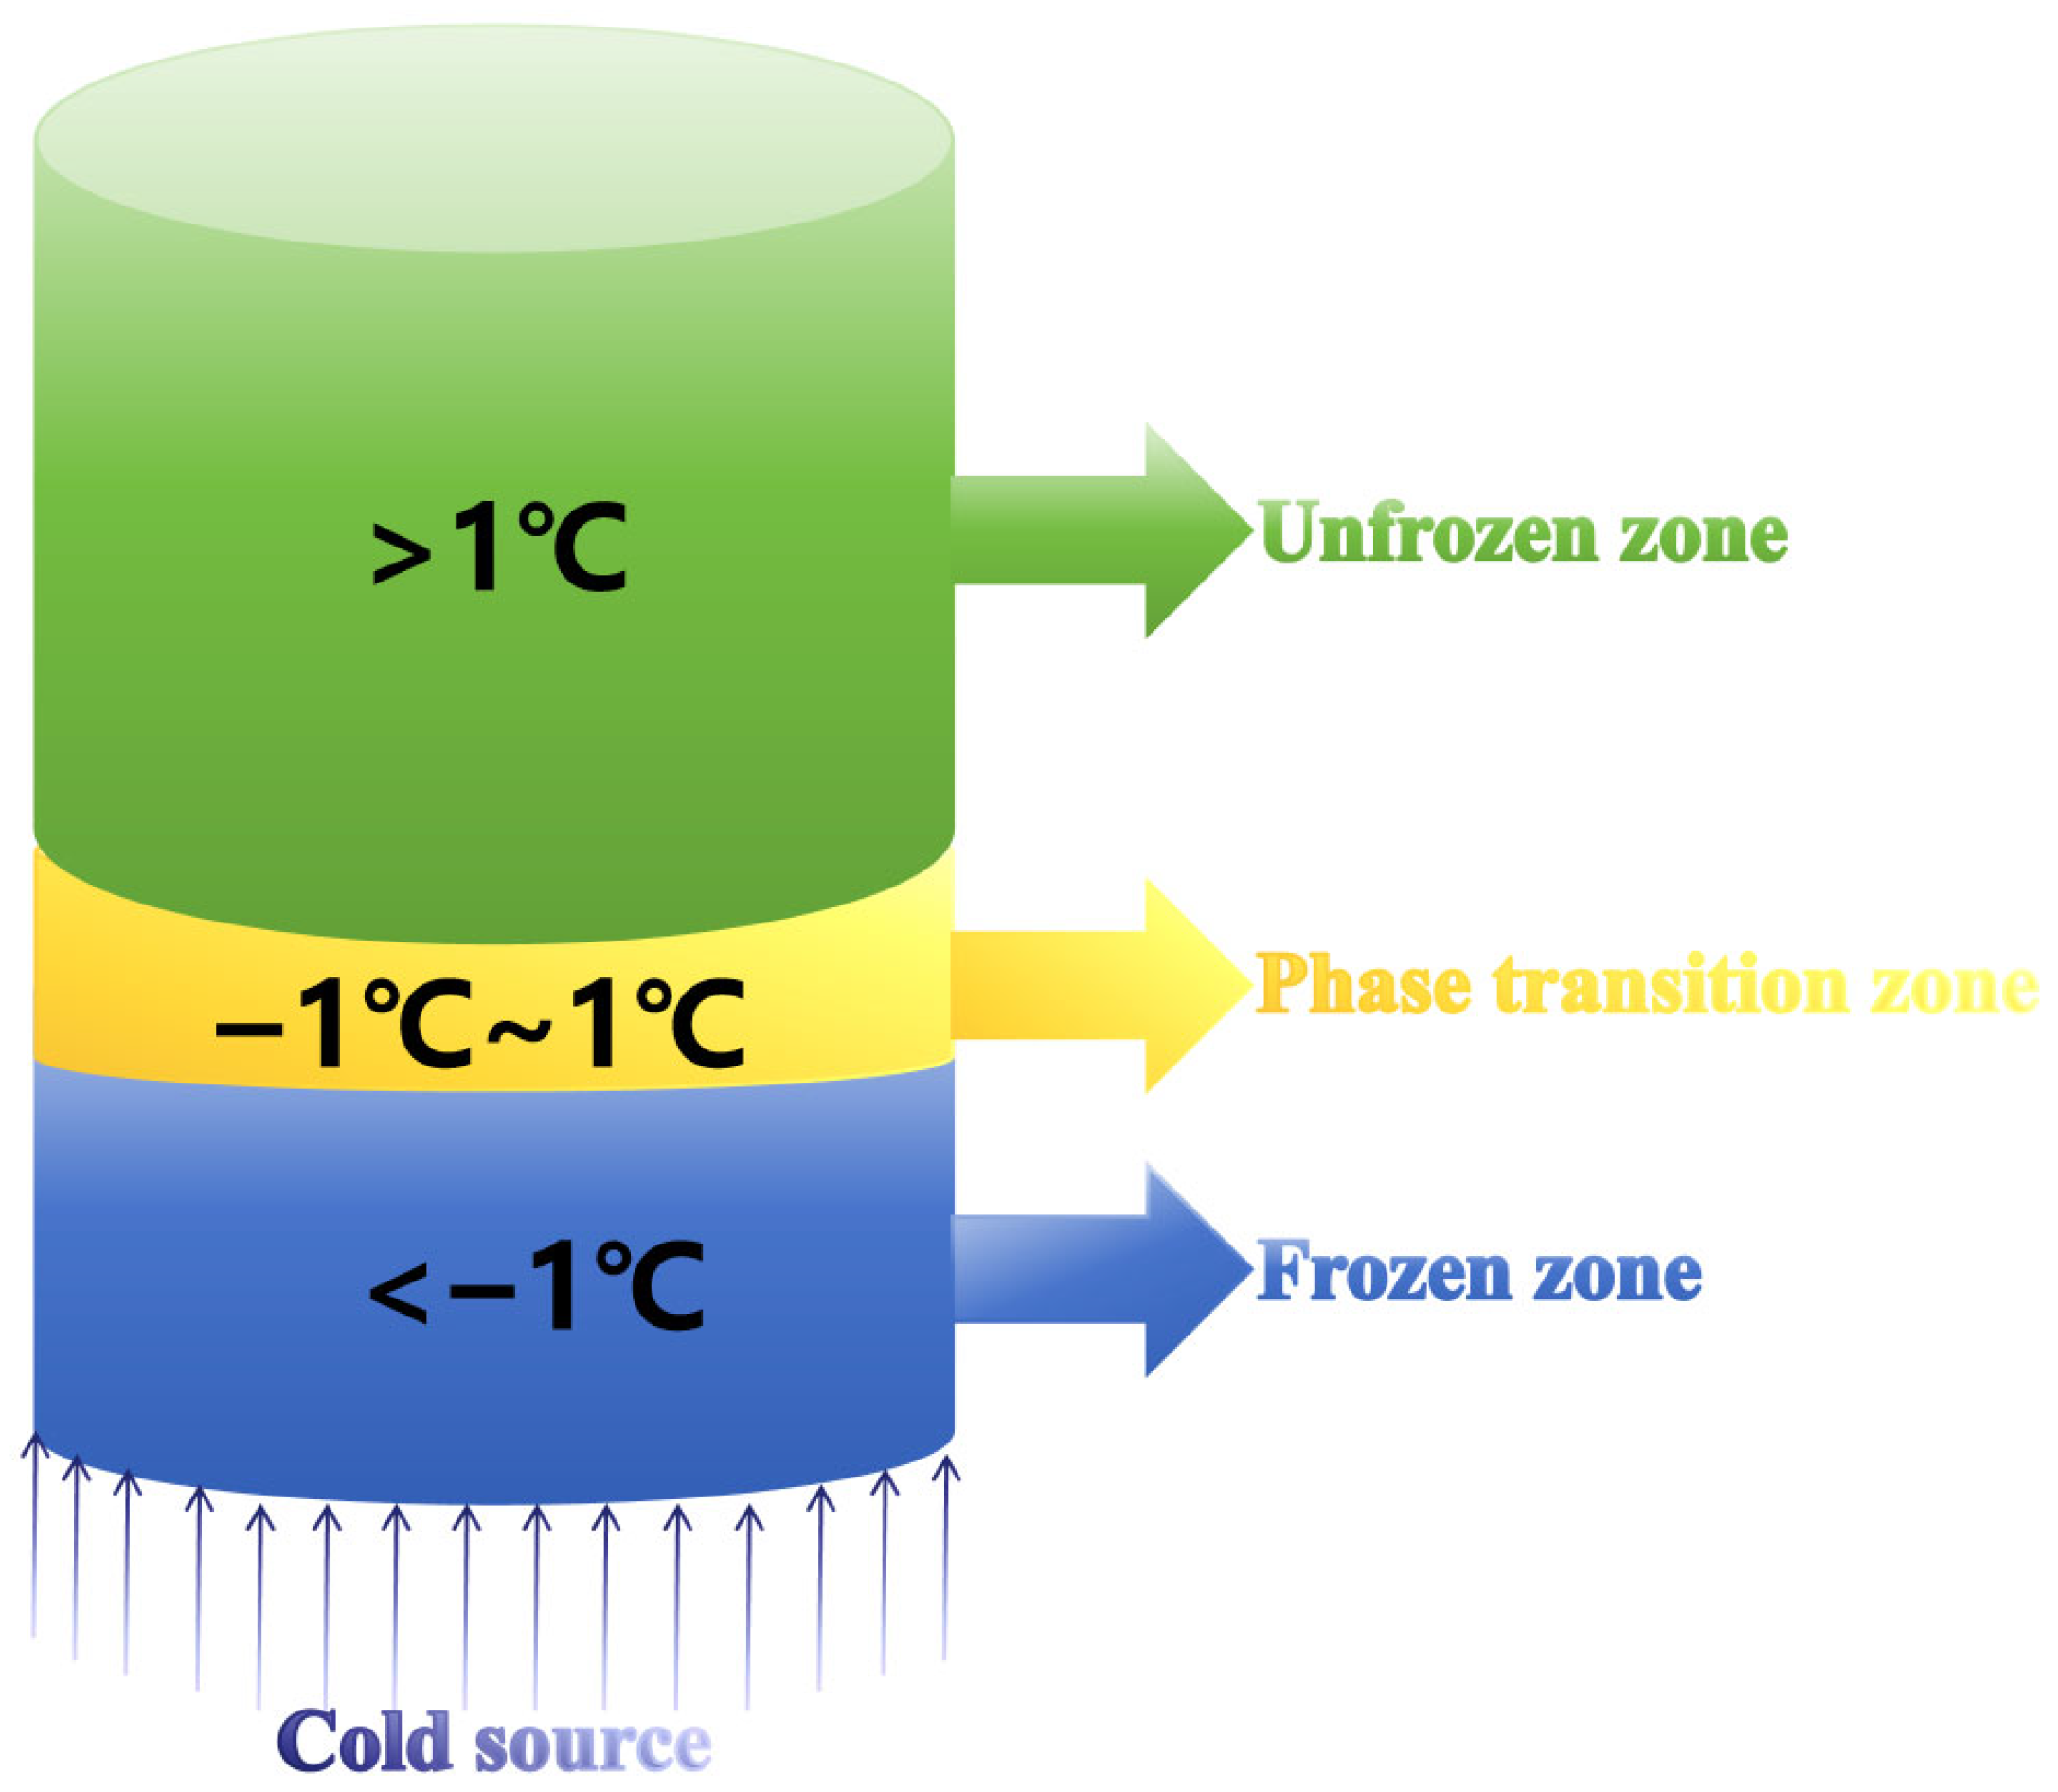
Once the thawing of the coral sand was substantially complete, the distribution of distinct zones (frozen zone, phase transition zone, and unfrozen zone) along the height of the soil column was determined based on the acquired temperature data. Adequate samples from each zone were collected, air-dried under natural environment conditions, and properly stored for the subsequent particle sieving test and scanning electron microscope (SEM, Hitachi High-Tech Corporation, Tokyo, Japan) test. The schematic diagram of the division of different zones is shown in Figure 6.
Figure 6. Schematic diagram of the division of each zone in one-dimensional soil column unidirectional freezing test.

2.2.2. Particle Sieving Test

In order to investigate the particle breakage of coral sand after the freezing–seepage coupling process, the particle sieving test was carried out. During particle sieving test, standard sieves with various particle sizes (2 mm, 1 mm, 0.9 mm, 0.5 mm, 0.25 mm, 0.2 mm, 0.15 mm, 0.125 mm, 0.1 mm, 0.075 mm, 0.063 mm, and 0.054 mm) were primarily used. Moreover, a balance was used to measure the mass of the coral sand samples before and after sieving to ensure the accuracy of the test results. In this test, the coral sand samples collected from different zones were placed into a series of standard sieves arranged from large to small particle sizes. A vibrating sieve shaker was used to conduct vibratory sieving of the particles. The step was crucial to ensure that particles of each size were thoroughly separated.

2.2.3. Scanning Electron Microscope Test

In order to explore the variations in the microstructure of coral sand after the freezing–seepage coupling process, scanning electron microscope (SEM) tests were carried out. The tests used a tungsten filament scanning electron microscope (SU1510; Hitachi High-Tech Corporation, Tokyo, Japan) from the Key Laboratory of Geotechnical and Underground Engineering of Ministry of Education in Tongji University. With regard to the SEM test, the dried samples collected from three different zones were fixed onto the sample stage using a strong conductive adhesive. After that, the sample stage was placed in the gold-plating container to complete gold plating, aiming to enhance the electrical conductivity of the sample surface. Then the sample was placed in the sample chamber of the scanning electron microscope for evacuation. Finally, the tungsten filament was activated, and the voltage was adjusted to 5 kV. Once the image on the computer was clear, photographs could be taken, captured, and saved.

3. Test Results

3.1. Temperature Variation During Freezing–Seepage Coupling Process

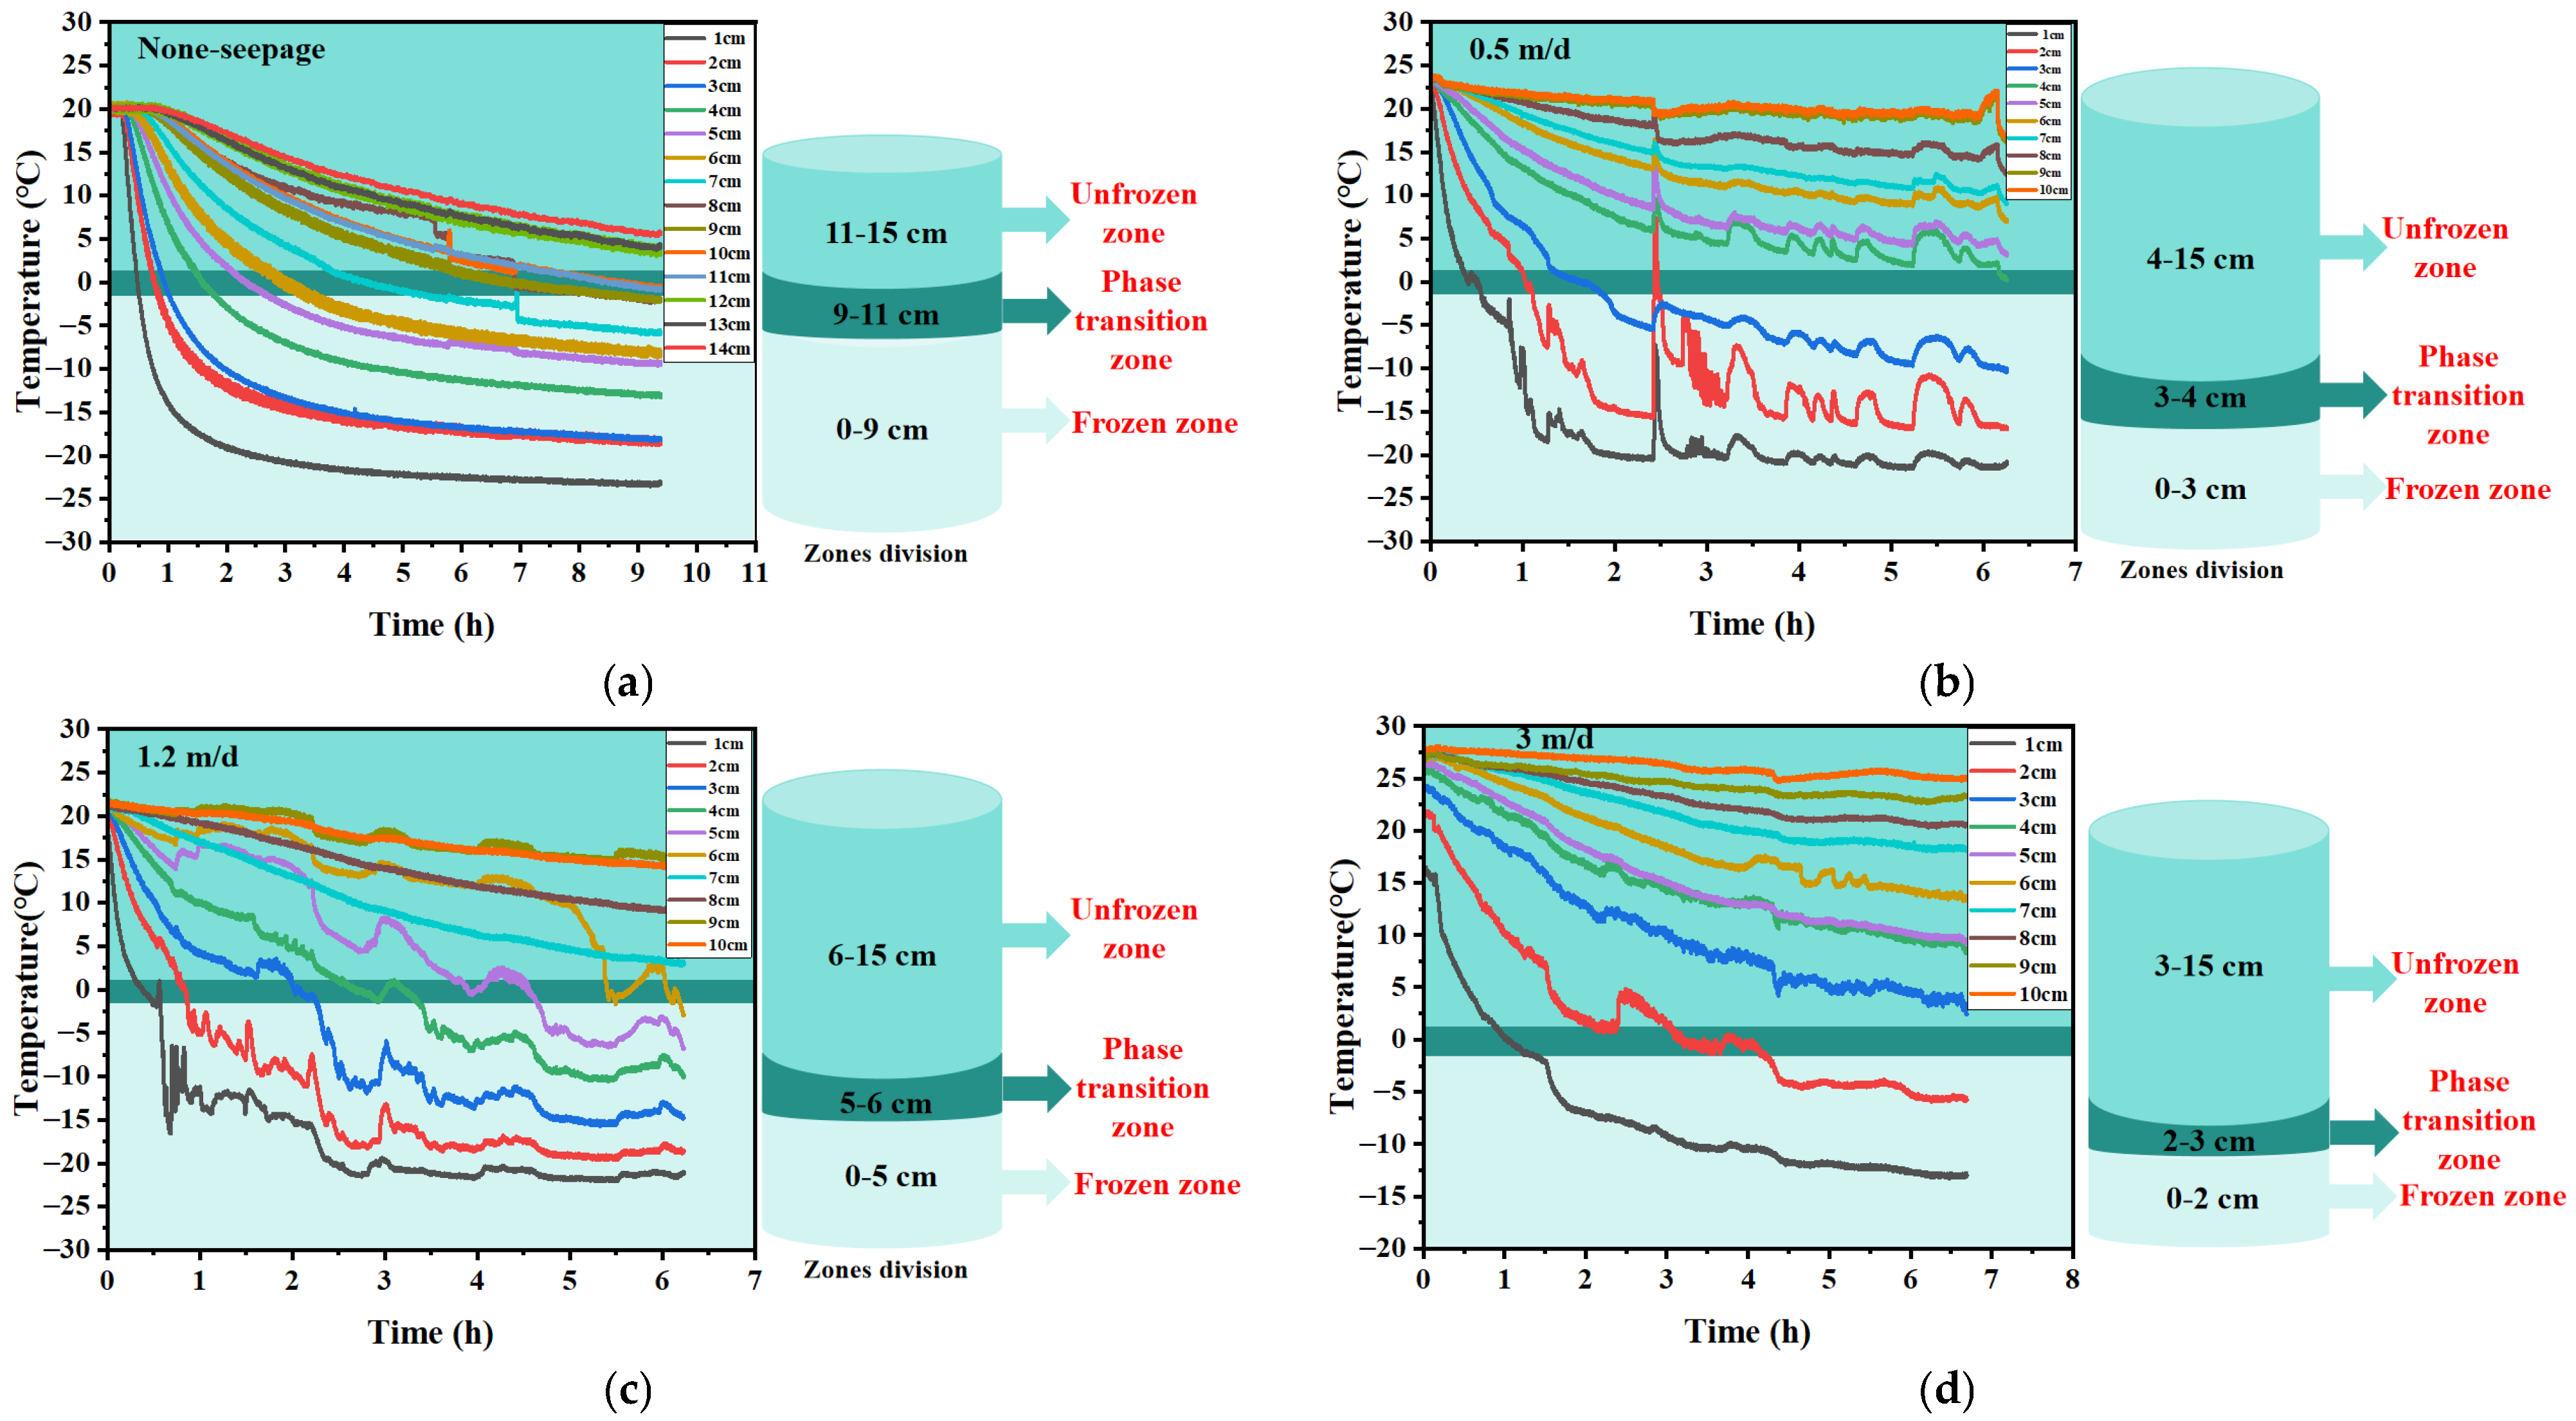
Throughout the one-dimensional soil column unidirectional freezing test, temperature is a crucial reference. After the freezing test, the division of each zone (frozen zone, phase transition zone, and unfrozen zone) was determined based on temperature. By comparing the temperature variation curves under different seepage conditions, the variation in freezing rate could be compared, thereby clarifying differences in freezing behavior under different seepage conditions. The variations in freezing temperature of coral sand under different seepage conditions are shown in Figure 7.
Figure 7. Variations in freezing temperature of coral sand under different seepage conditions. (a) Temperature variations in different heights under none-seepage condition. (b) Temperature variations in different heights under 0.5 m/d seepage condition. (c) Temperature variations in different heights under 1.2 m/d seepage condition. (d) Temperature variations in different heights under 3 m/d seepage condition.
From Figure 7, seepage had a significant impact on the advancement height of the frozen front. Under none-seepage condition, the height of the frozen zone could reach up to 9 cm. In contrast, under seepage conditions with velocities ranging from 0.5 m/d to 1.2 m/d, the height of the frozen zone was merely 3–5 cm, and under the seepage velocity of 3 m/d, it was only 2 cm. Moreover, seepage significantly influenced both freezing rate and final stable freezing temperature. With the increase in seepage velocity, the lowest achievable stable temperature rose and the time required to reach this temperature became longer. This phenomenon is fundamentally consistent with the temporal variation in soil temperature under different seepage velocities reported in Liu et al. (2023) [23]. The reason is that during the freezing process the transfer of cold energy occurs through heat conduction, moving from the bottom to the top of the soil column. However, the existence of seepage gives rise to a strong convective heat transfer effect. Acting as a medium for heat transfer, seepage exchanges heat with the cold source at the bottom of the soil column together with the pore water inside the coral sand. This leads to a notable decrease in the heat exchange between the pore water and cold source. Consequently, the formation of ice lenses is delayed, and the cooling rate is further diminished. It should be noted that with an increase in seepage velocity the heat exchange effect of seepage becomes more significant, thereby exerting an intense inhibitory effect on the freezing process.
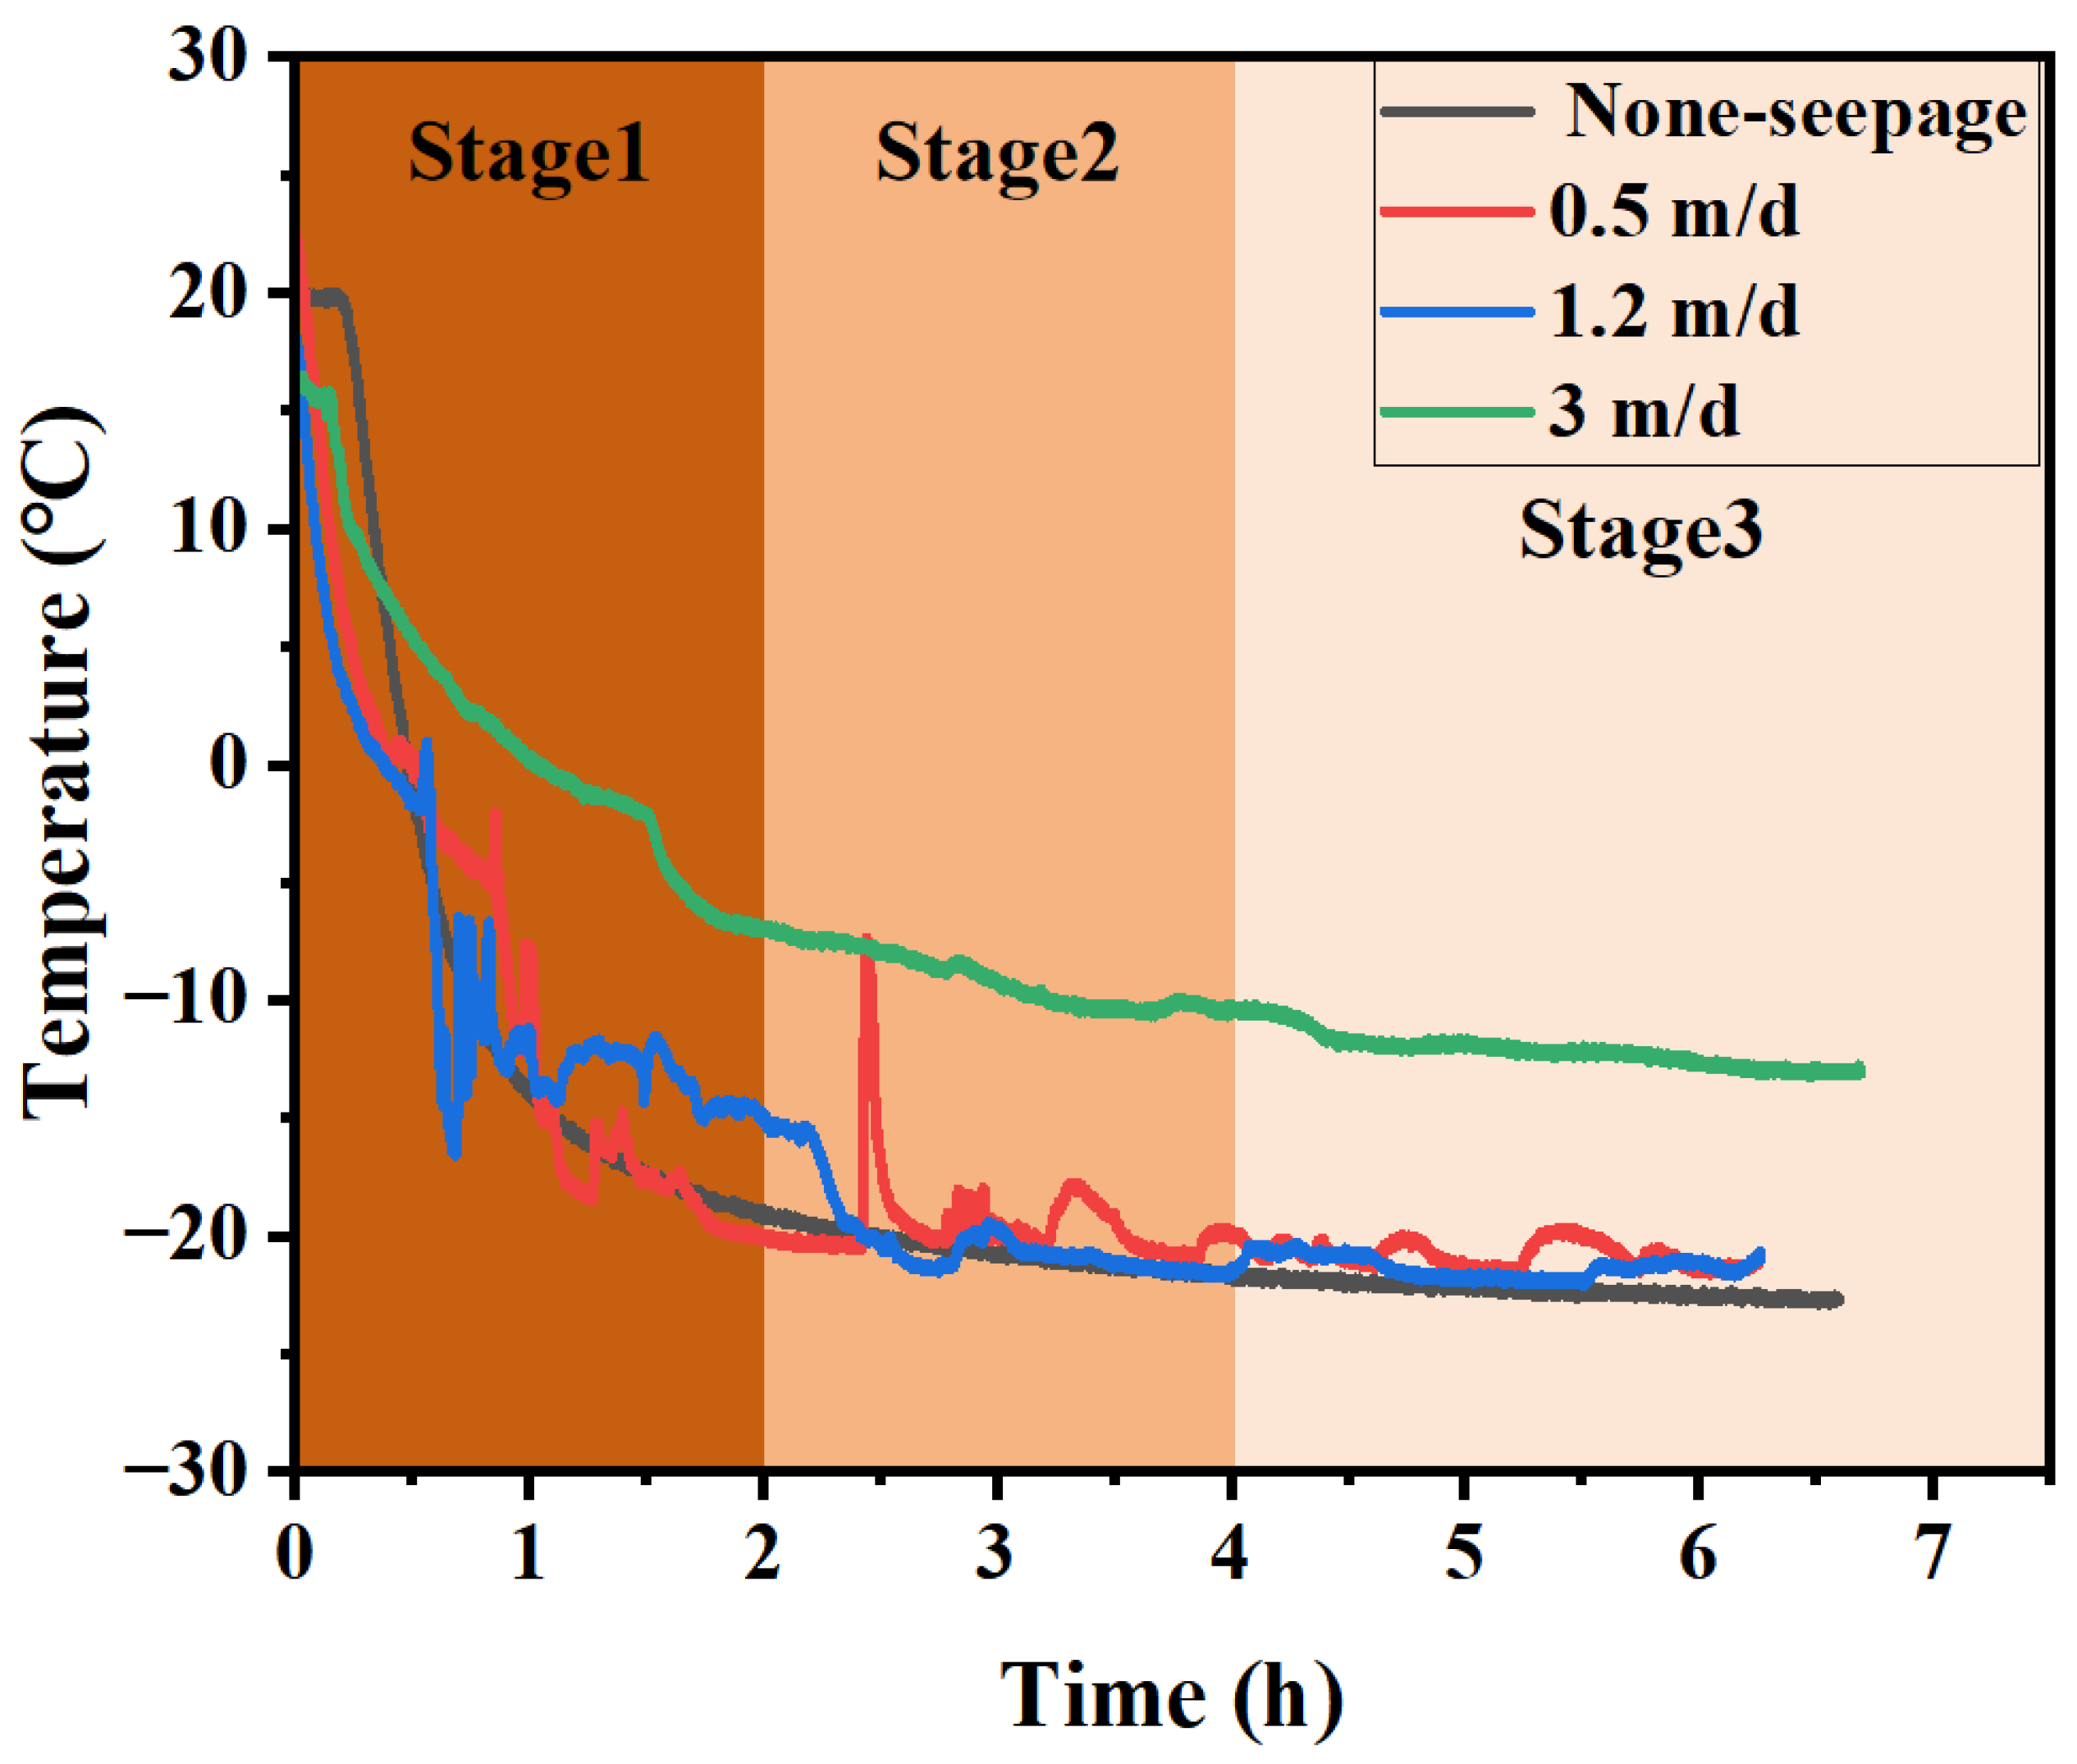
To conduct a more in-depth analysis of the influence of different seepage conditions on the freezing temperature of coral sand, the temperature variations at a height of 1 cm over time under different seepage conditions are shown in Figure 8. In this figure, according to the downward trend of the temperature–time variation curves, the entire process of temperature variation is divided into three stages. Stage 1 to Stage 3 represent the initial freezing stage, the mid-freezing stage, and the final freezing stage. Taking the none-seepage condition as an example, in the initial freezing stage (Stage 1) the temperature of coral sand drops rapidly. This is because the circulating fluid has been cooled to the preset temperature (−30 °C) before the test begins. A significant temperature gradient exists between coral sand and cold source, resulting in an intense heat transfer. Consequently, the temperature drops at a rapid pace. As the freezing process continues, the temperature gradient between coral sand and cold source gradually decreases, and the heat exchange effect weakens. Therefore, the temperature of coral sand drops slowly (Stage 2). In the final freezing stage (Stage 3), the heat exchange between coral sand and cold source basically reaches equilibrium, and the temperature eventually stabilizes [24]. It should be noted that due to inevitable heat dissipation losses, the temperature of coral sand cannot reach the designated freezing temperature.
Figure 8. Freezing temperature curves of coral sand at 1 cm under different seepage conditions.
Comparing temperature variations in different seepage conditions, one could see that when seepage velocity was low (0–1.2 m/d) the trends of freezing temperature were essentially identical, indicating that under low-seepage conditions the influence of seepage on freezing temperature was not significant. However, when the seepage velocity was high (3 m/d), the impact of seepage on the entire freezing process was continuous. In Stage 1, it significantly reduced the initial freezing rate, and in Stage 3, it significantly increased the final stable freezing temperature.

3.2. Particle Breakage of Coral Sand Under Freezing–Seepage Coupling Effect

3.2.1. Particle Size Distribution Analysis of Coral Sand

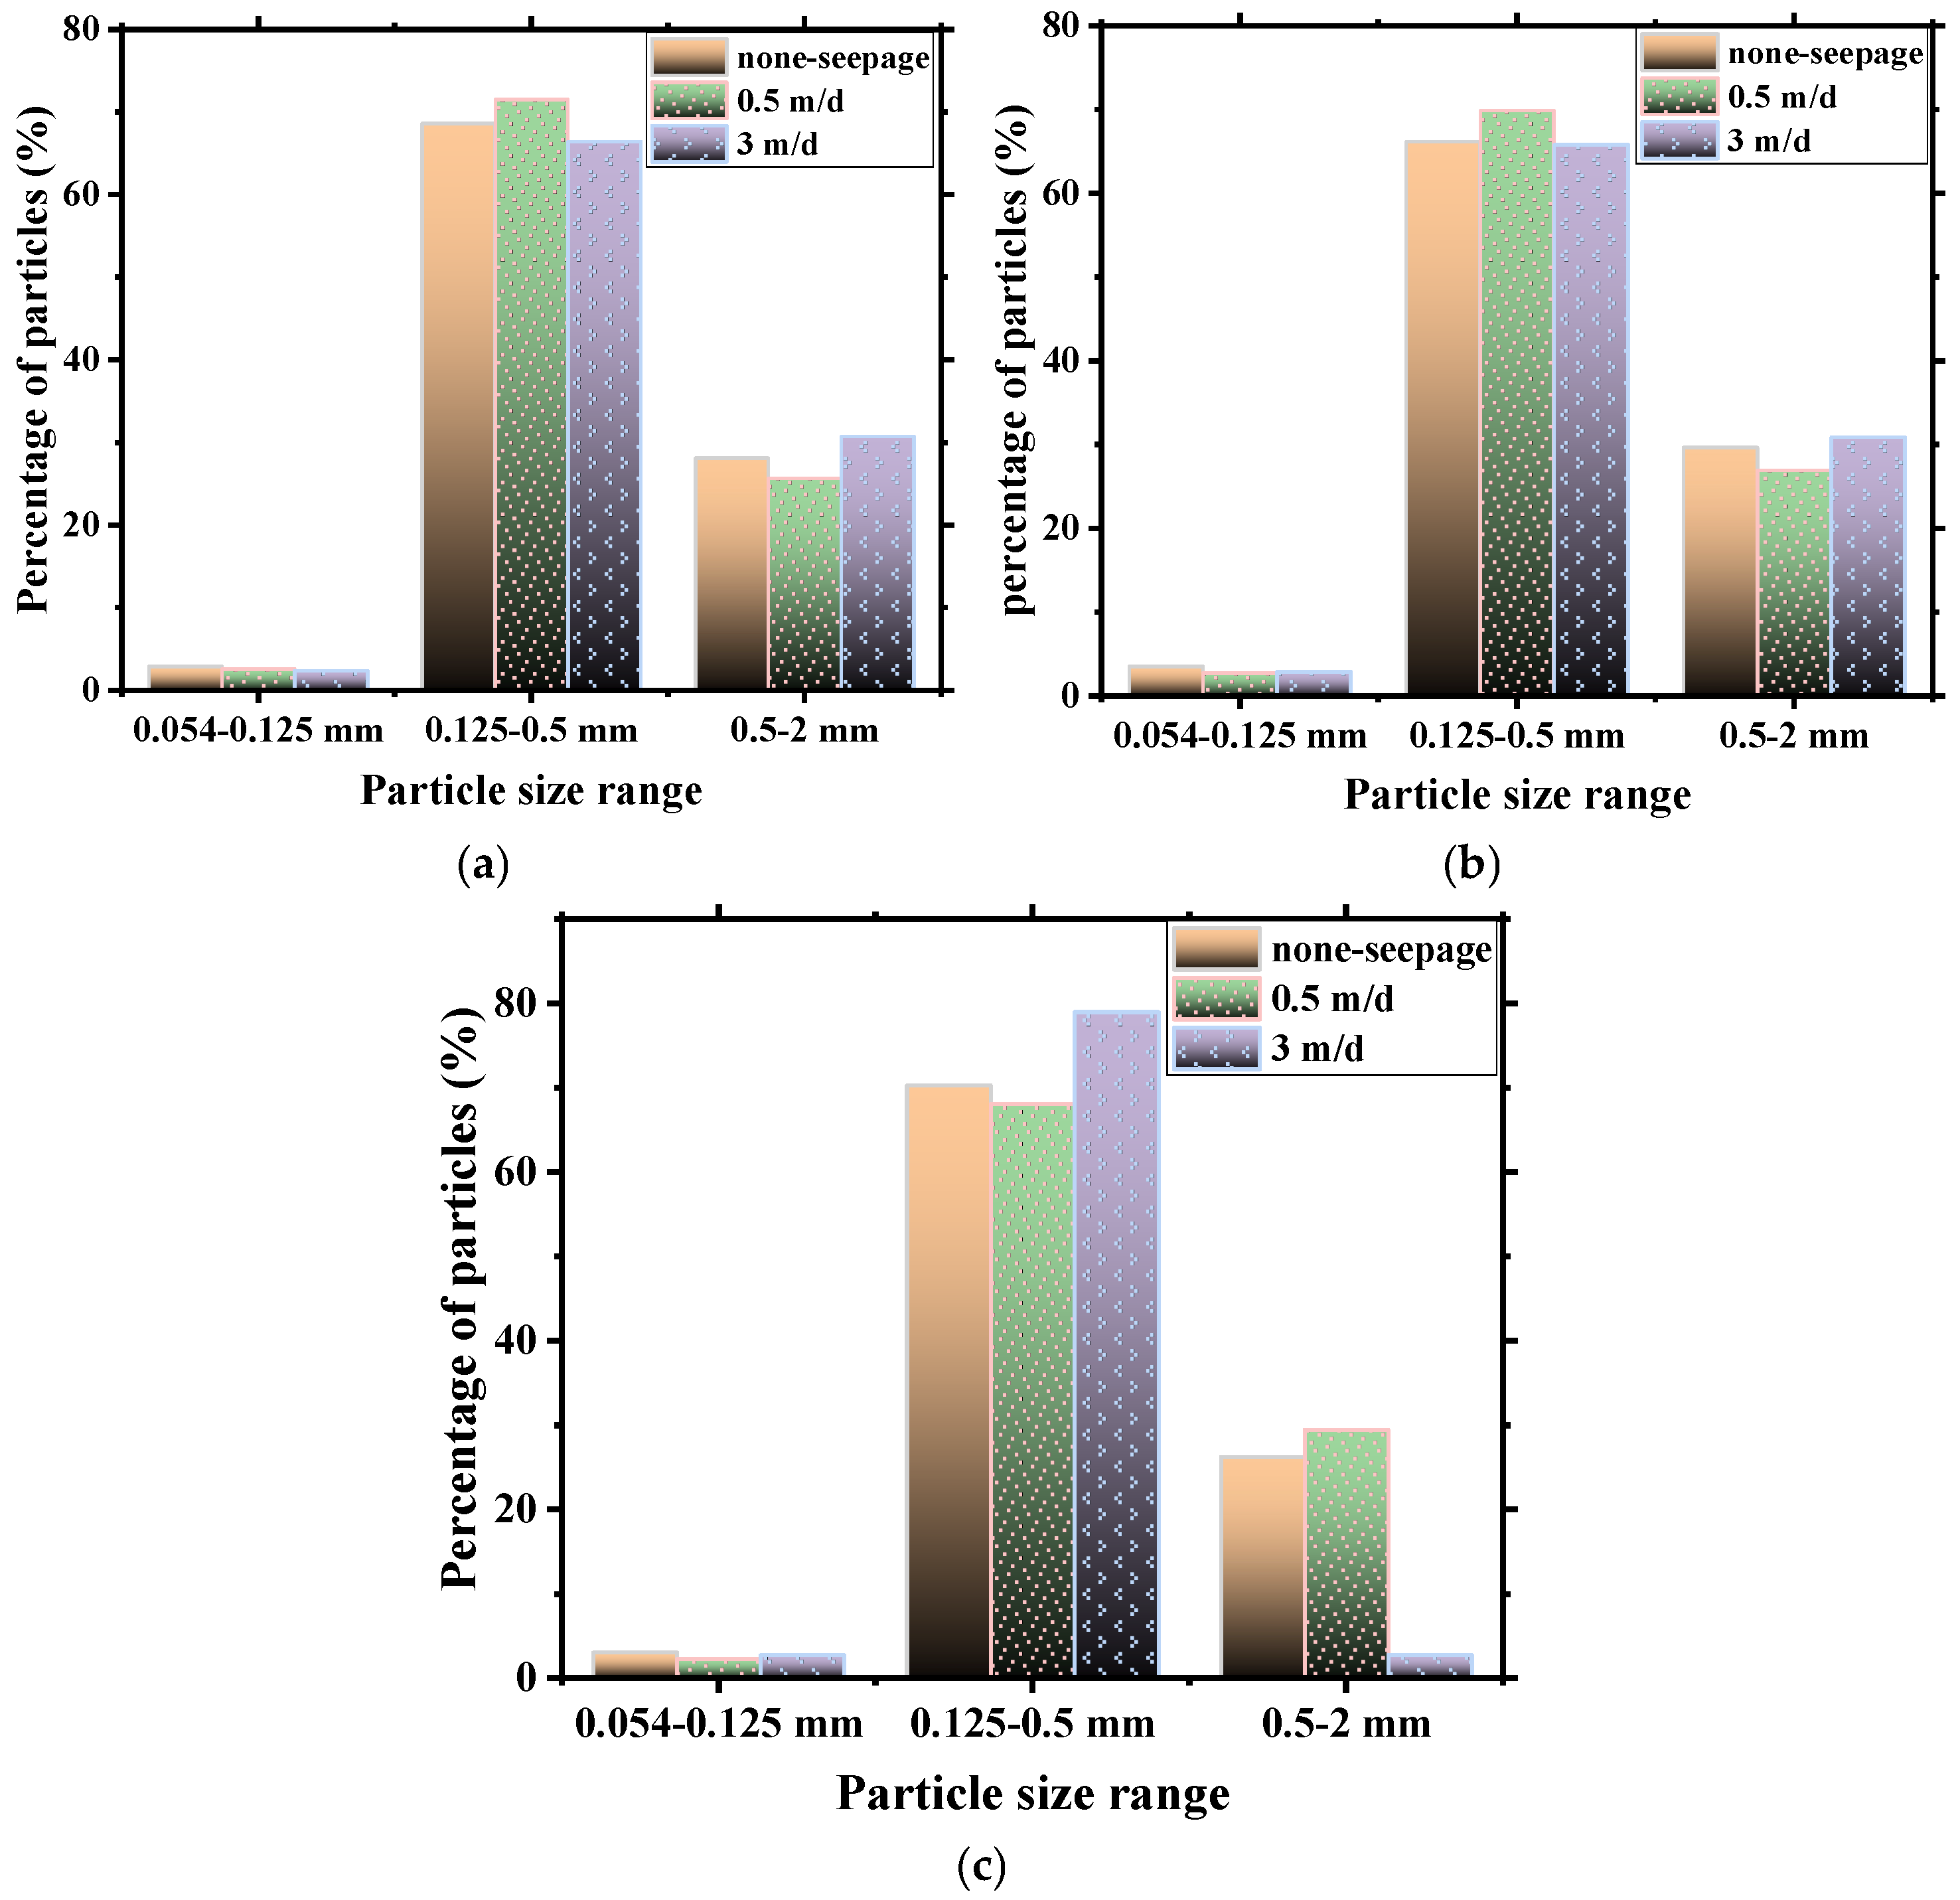
To investigate the particle breakage characteristics of coral sand under the action of freezing and seepage coupling, the particle sieving test was conducted after the freezing test using coral sand samples from three different zones. Three seepage conditions (none-seepage, 0.5 m/d, and 3 m/d) were selected for comparison. The mass percentage of particles within three different particle size ranges (0.054–0.125 mm, 0.125–0.5 mm, and 0.5–2 mm) in different zones under various seepage conditions are shown in Figure 9.
Figure 9. Mass percentage of coral sand particles under different freezing–seepage coupling effects. (a) Frozen zone. (b) Phase transition zone. (c) Unfrozen zone.
For the large particle size range (0.5–2 mm) under none-seepage and 0.5 m/d seepage conditions, the proportion of particles in the frozen zone and phase transition zone of coral sand was lower compared to that in unfrozen zone. In contrast, in the medium particle size range (0.125–0.5 mm), the proportion increased. The phenomenon indicated that particle breakage occurred in coral sand under the freezing–seepage coupling effect, and the mass proportion of large-particle-size-range particles decreased. The seepage velocity of 0.5 m/d exacerbated the destruction of particles, leading to a more significant increase in the mass proportion of particles in the medium particle size range. In comparison, the variation of the mass proportion of particles in the unfrozen zone was minimal. The reason is that the unfrozen zone was not influenced by freezing, and 0.5 m/d seepage velocity was relatively low, resulting in a less-severe destructive effect on the particles.
For 3 m/d seepage velocity, compared with none-seepage and 0.5 m/d seepage velocity conditions, the particle proportion of the frozen zone and phase transition zone were the highest within the large particle size range, while that of the unfrozen zone was the lowest. The probably most reasonable explanation for this phenomenon is the formation of ice lenses. According to the hypothesis, the growth of ice lenses might have displaced and reconfigured the surrounding coarse particle framework, thereby causing the gradation to shift towards the coarse-grained side. Furthermore, the particles in the unfrozen zone experienced strong seepage forces, which might transport smaller particles away, causing particle redistribution and increasing the proportion of medium size particles. In the small size particle range (0.054–0.125 mm) the differences in particle proportion among the three zones under different seepage conditions were not obvious, since during the freezing–seepage coupling process particle breakages mainly occurred in the larger particle size range. Particles in the small particle size range were too fine to be easily broken, resulting in minimal variation within this particle size range. This phenomenon of the fine particles hardly being broken is similar to the research results of Xu et al. (2024) [25].
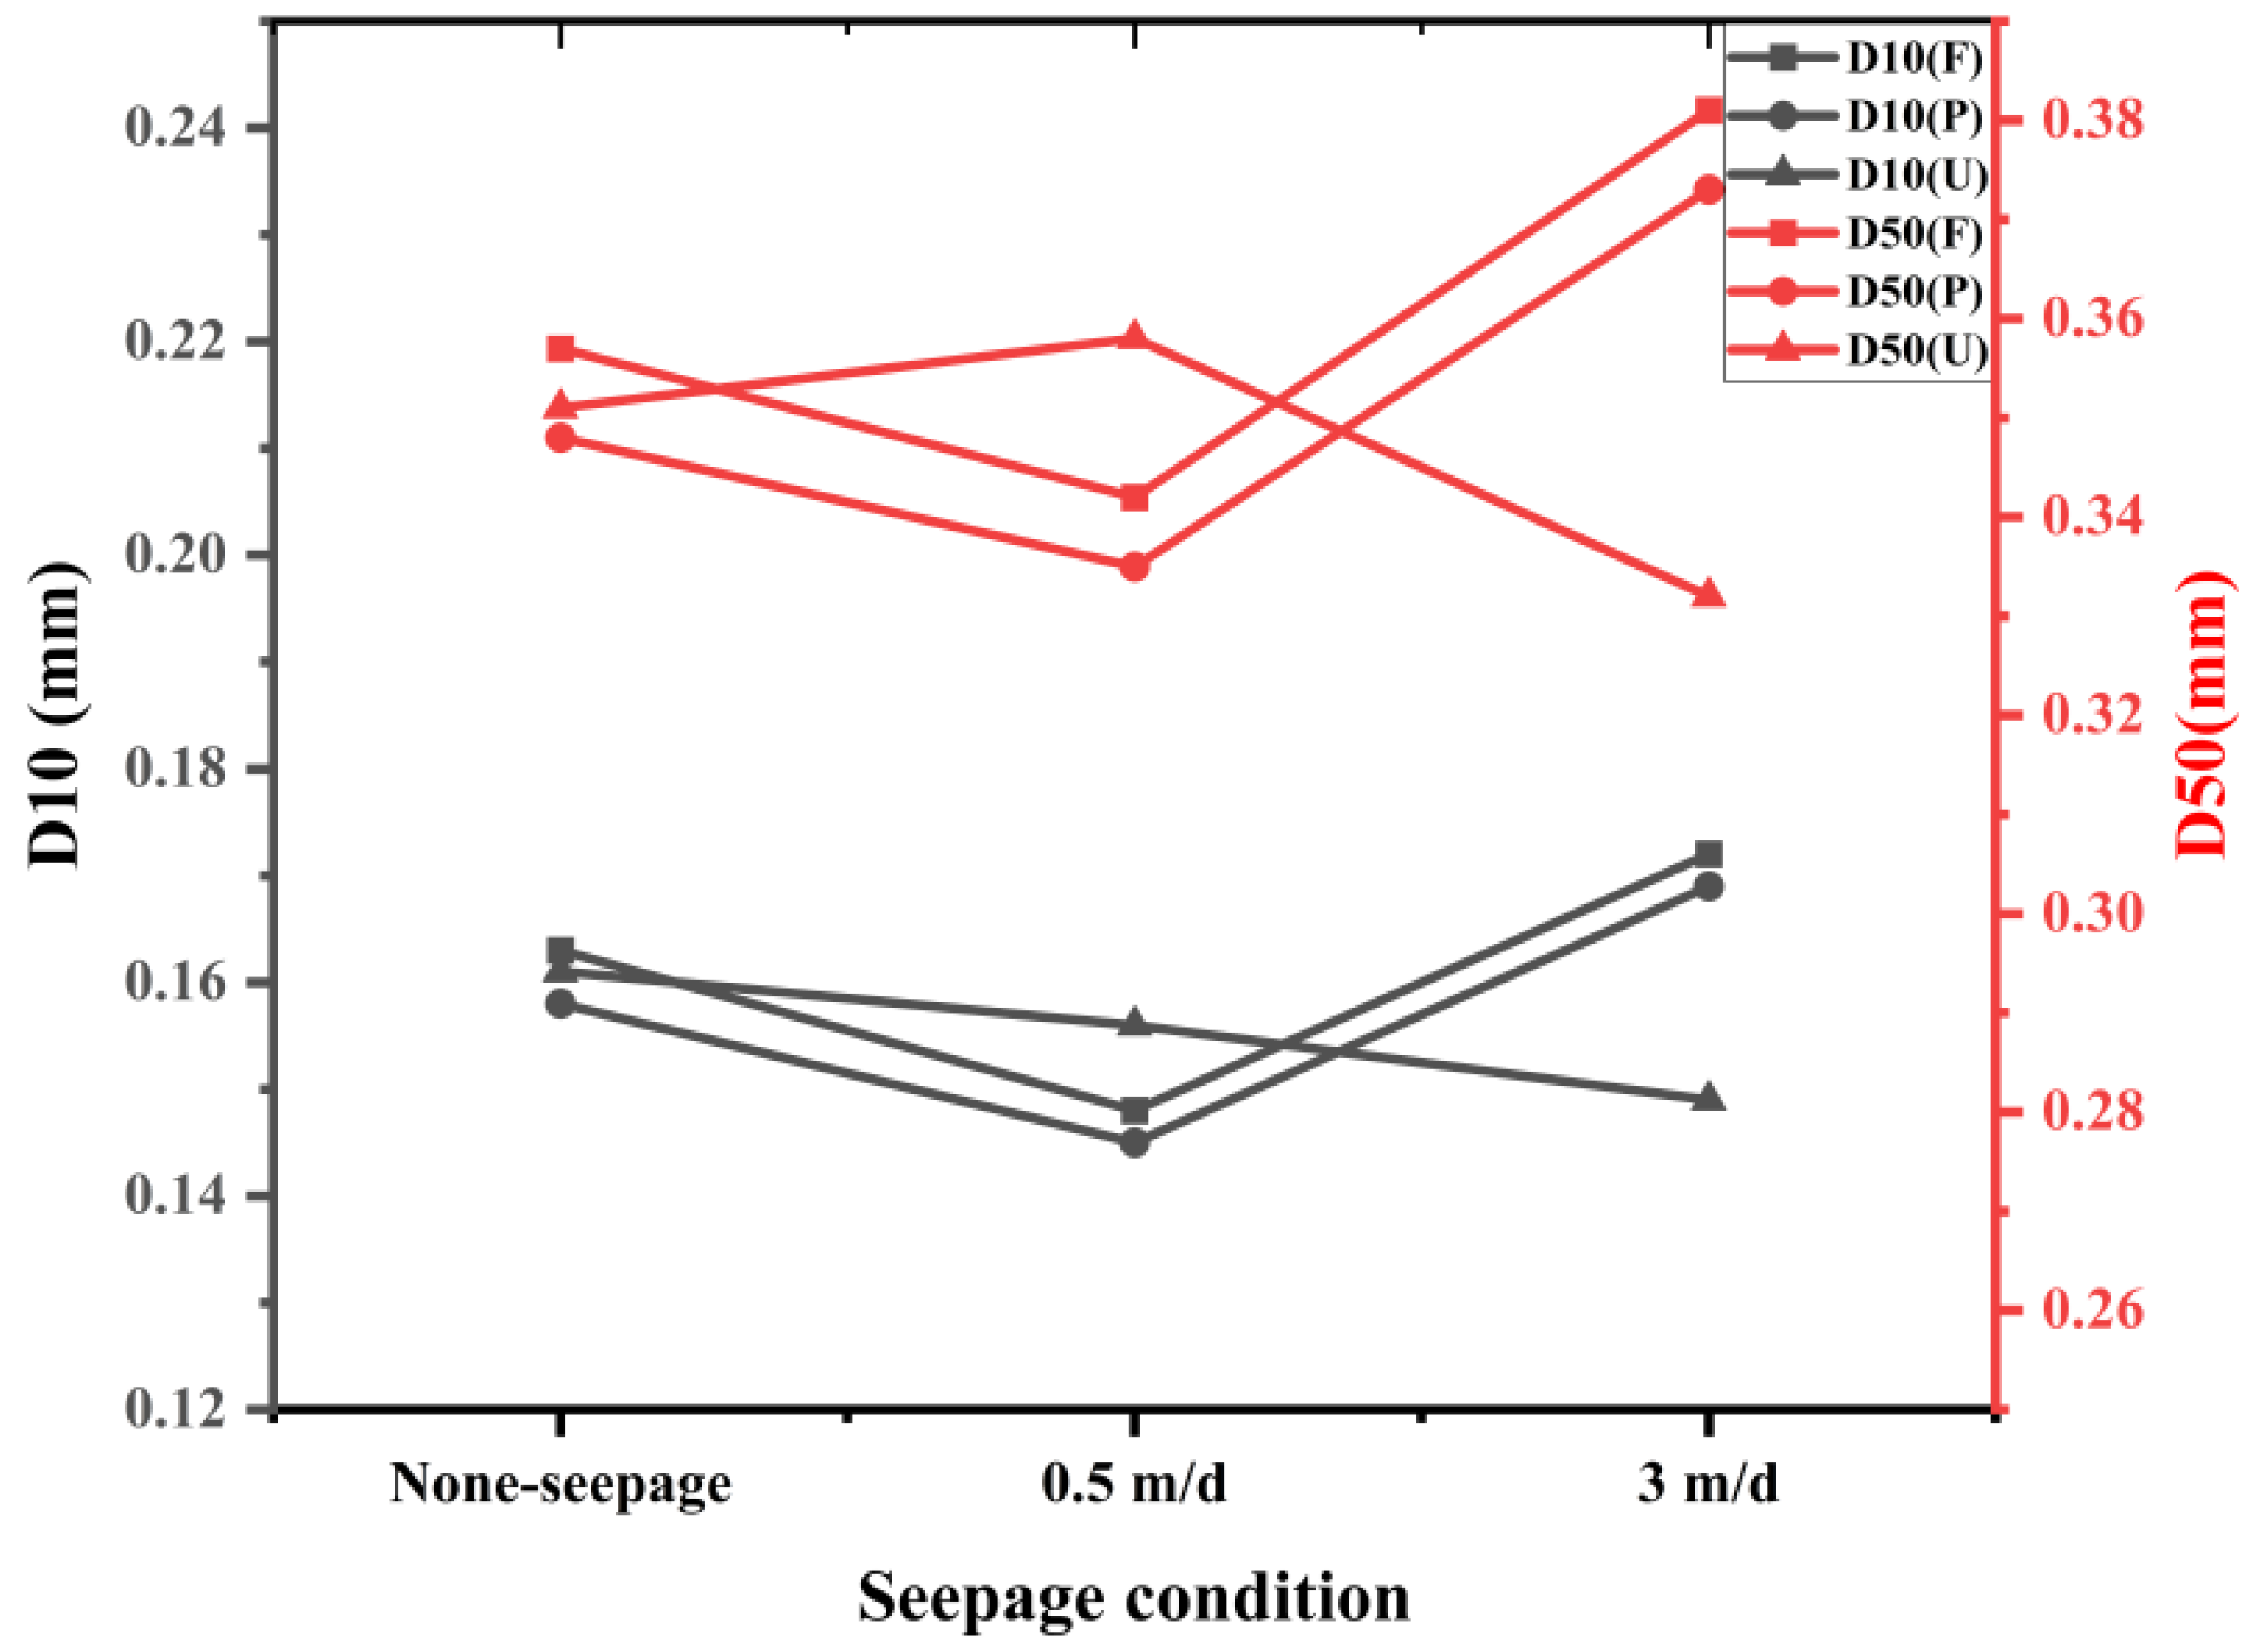
To further quantitatively analyze the particle size variations under different seepage conditions, the mass percentage of different particle sizes in each zone are shown in Table 3, Table 4 and Table 5. And the characteristic particle size diameters D10 and D50 in each zone under different seepage conditions were calculated, as shown in Figure 10. It can be observed that D10 and D50 values under 0.5 m/d seepage velocity are generally lower compared to those under the none-seepage condition. The trend is specifically reflected in the particle size distribution data as follows: the mass percentage of 1 mm particles in the frozen zone decreased from 9.606% to 8.819%, while the mass percentage of 0.15 mm increased from 15.400% to 17.728%. This indicates that 0.5 m/d seepage velocity exacerbates the breakage of large particles, thereby causing a general refinement of particle size distribution. In the frozen zone and phase transition zone, the D10 and D50 values under the 3 m/d seepage condition are higher than those under the none-seepage and 0.5 m/d seepage conditions. Based on previous analysis, the ice lenses formed under the intense freezing–seepage coupling effect promote the reconstruction of particle framework, thereby partially obscuring the particle breakage. In the unfrozen zone, the variations in particle size distribution are mainly controlled by seepage. Under 3 m/d seepage velocity, both D10 and D50 values reach their lowest. Additionally, the mass percentage of 0.5 mm decreased by 5.592%, which further demonstrates the scouring and migration effects of strong seepage on fine particles, resulting in a relative enrichment of fine particles in this zone.
Table 3. Mass percentage of coral sand particles of different sizes in frozen zone under different seepage conditions.
Table 4. Mass percentage of coral sand particles of different sizes in phase transition zone under different seepage conditions.
Table 5. Mass percentage of coral sand particles of different sizes in unfrozen zone under different seepage conditions.
Figure 10. Particle size distribution parameters D10 and D50 of each zone under different seepage conditions.

3.2.2. Particle Microstructure Analysis of Coral Sand

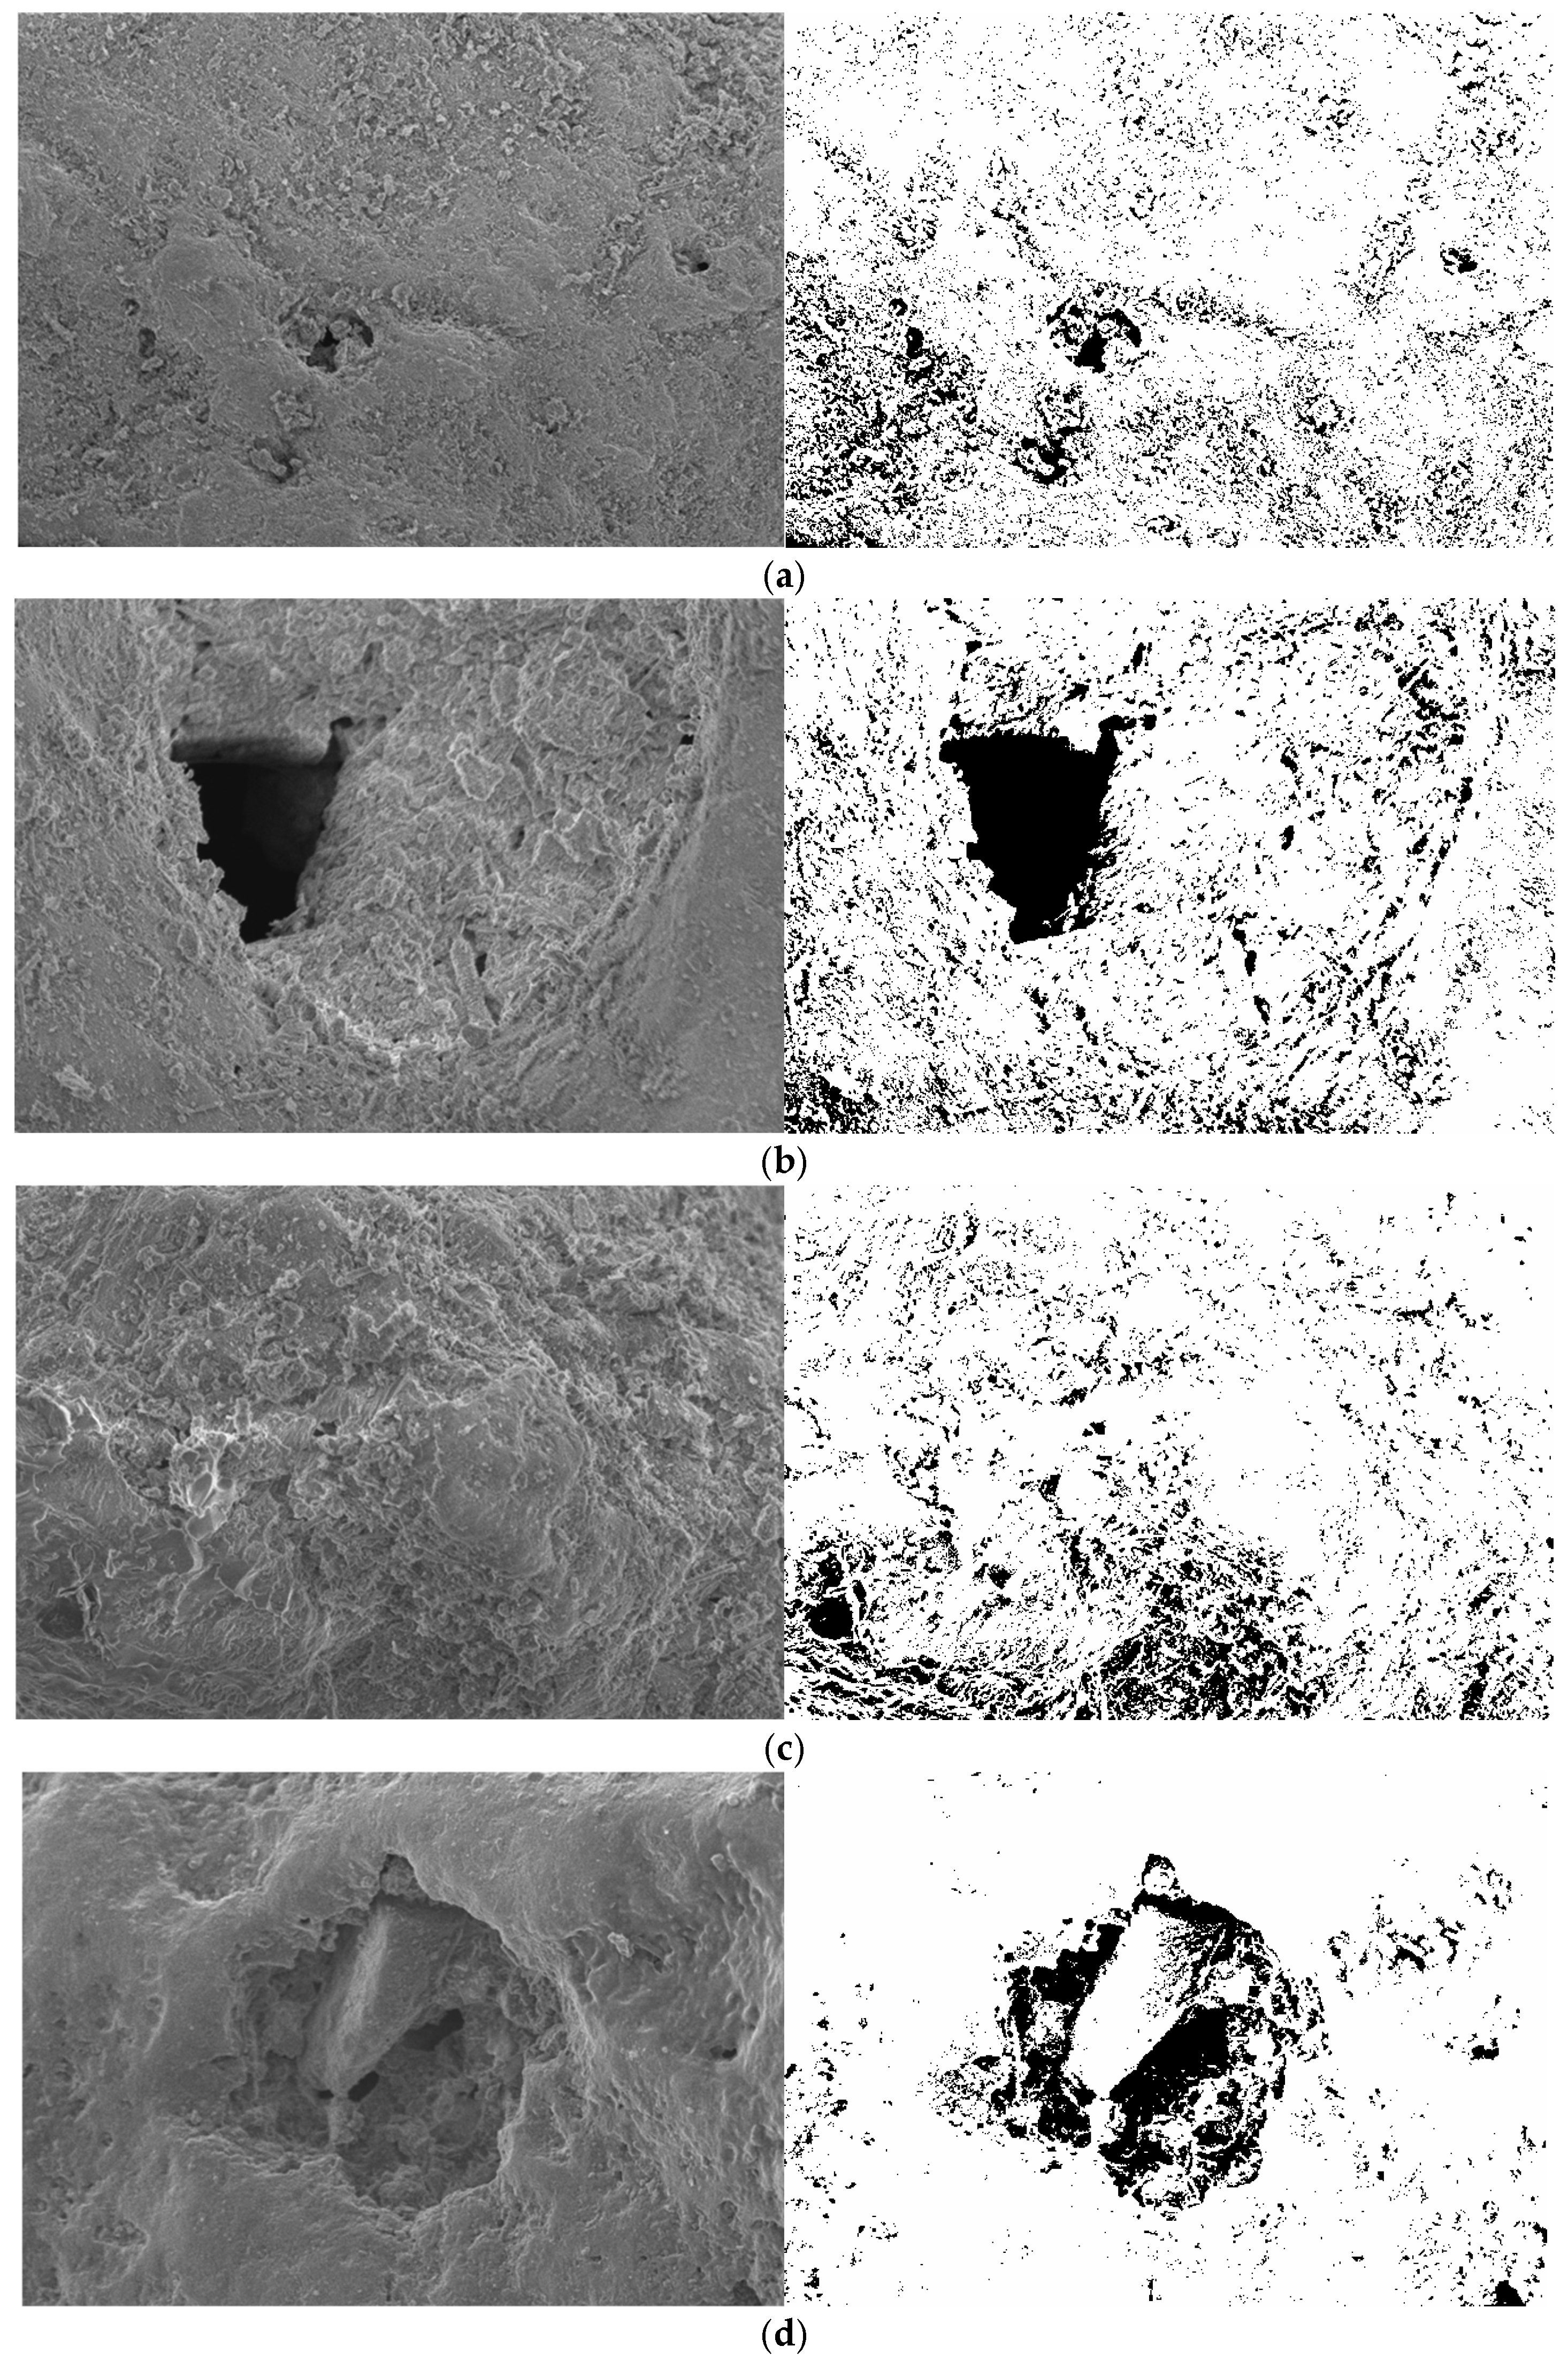
The previous section analyzed particle breakage by examining the variations in particle sizes in different zones under different freezing–seepage coupling conditions. To comprehensively understand the influence of the freezing–seepage coupling effect on particle breakage in coral sand, scanning electron microscope (SEM) tests were carried out using the same coral sand samples as those used in particle sieving test. The SEM images of coral sand particles in different zones under various freezing–seepage coupling conditions are shown in Figure 11.
Figure 11. Images of coral sand particles in different zones magnified 100× under different freezing–seepage coupling effects. (a) Frozen zone (none-seepage). (b) Frozen zone (0.5 m/d). (c) Frozen zone (3 m/d). (d) Phase transition zone (none-seepage). (e) Phase transition zone (0.5 m/d). (f) Phase transition zone (3 m/d). (g) Unfrozen zone (none-seepage). (h) Unfrozen zone (0.5 m/d). (i) Unfrozen zone (3 m/d).
As can be seen from the figures, a considerable number of pores are observable on the surface of coral sand particles. Those pores served as favorable channels for seepage. Similarly to the research results of Ma et al. (2020) on the morphology of coral sand particles [26], in the original state coral sand particles exhibited irregular angular morphology. After the freezing–seepage coupling effect, the particles in the frozen zone under each seepage condition showed a more obvious breakage. Specifically, the angularity of the particles decreased while the roundness increased, rendering coral sand particles smoother. The outcome aligns with the previously presented results of particle size analysis. In contrast, in the phase transition zone and unfrozen zone under each seepage condition some obvious angular features still remained, indicating that these coral sand particles had not experienced breakages. Under the action of seepage, the particles under 0.5 m/d and 3 m/d seepage velocities became smoother on the surface due to seepage erosion. With the influence of seepage, the roundness of particles gradually increased.
In addition, as can be seen from the figures, larger particles have a greater number of surface pores, better connectivity with the interior, and more distinct pore characteristics. This makes larger particles more susceptible to breakage. In contrast, smaller particles possess fewer surface pores and poorer connectivity with the interior, leading to a more compact internal structure, and thus are less likely to experience breakage.
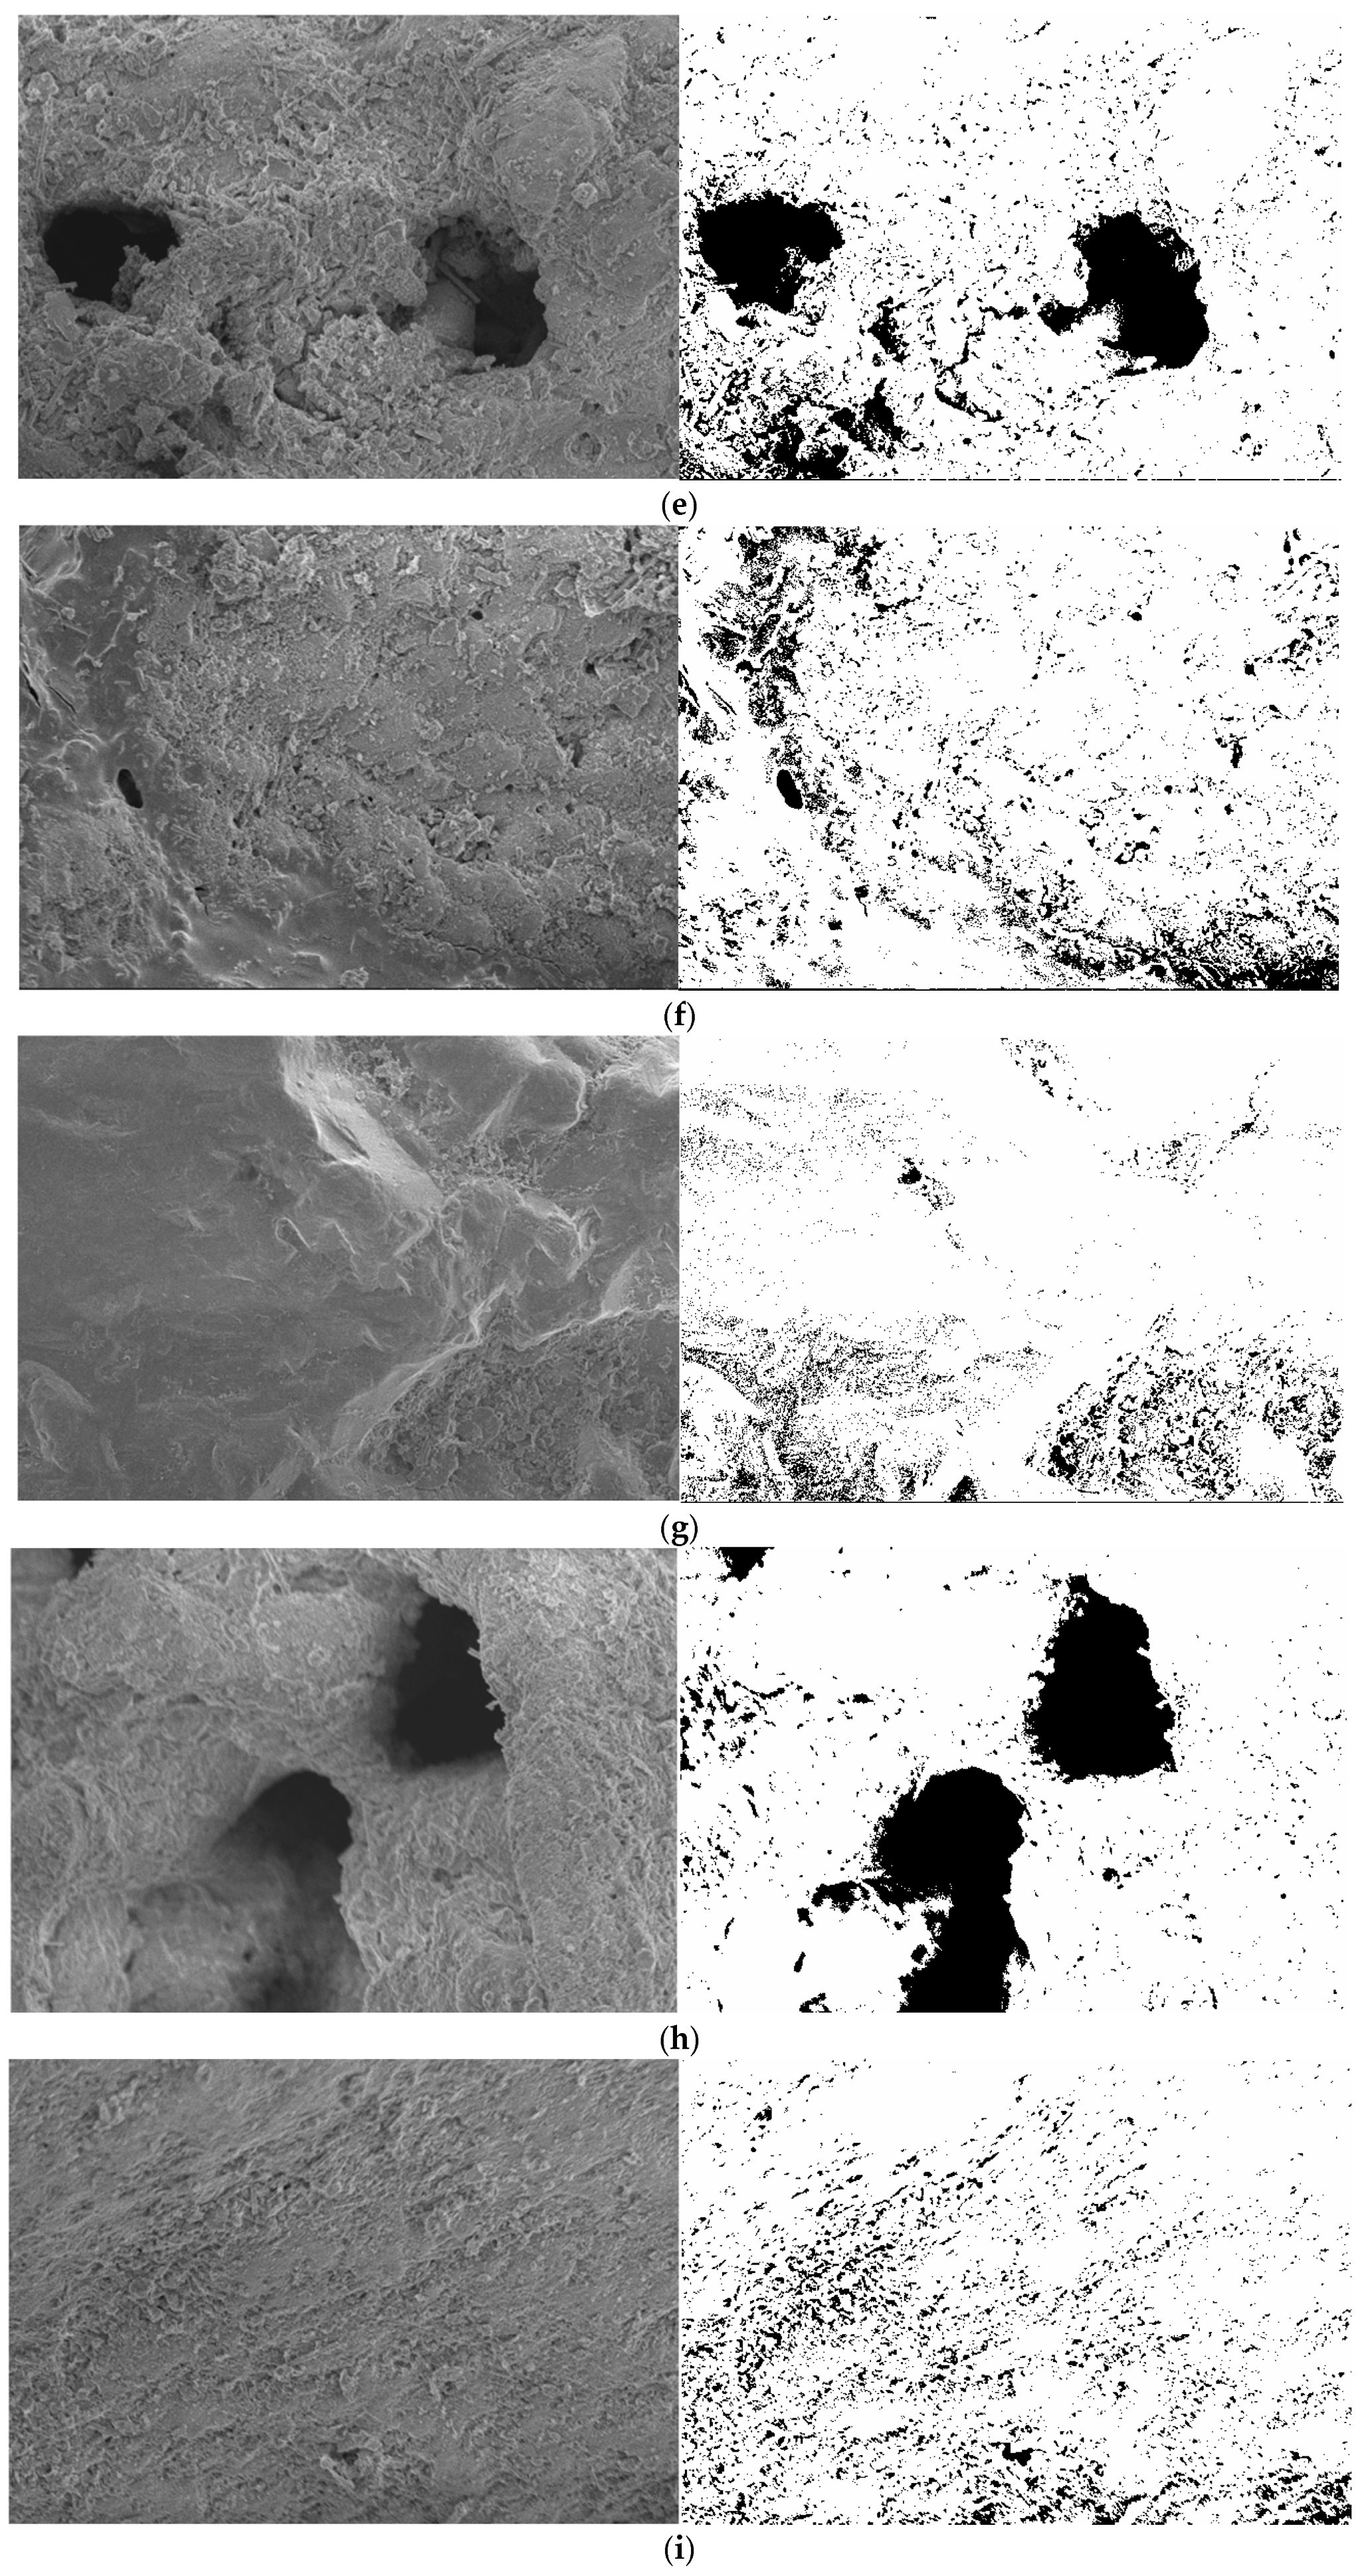
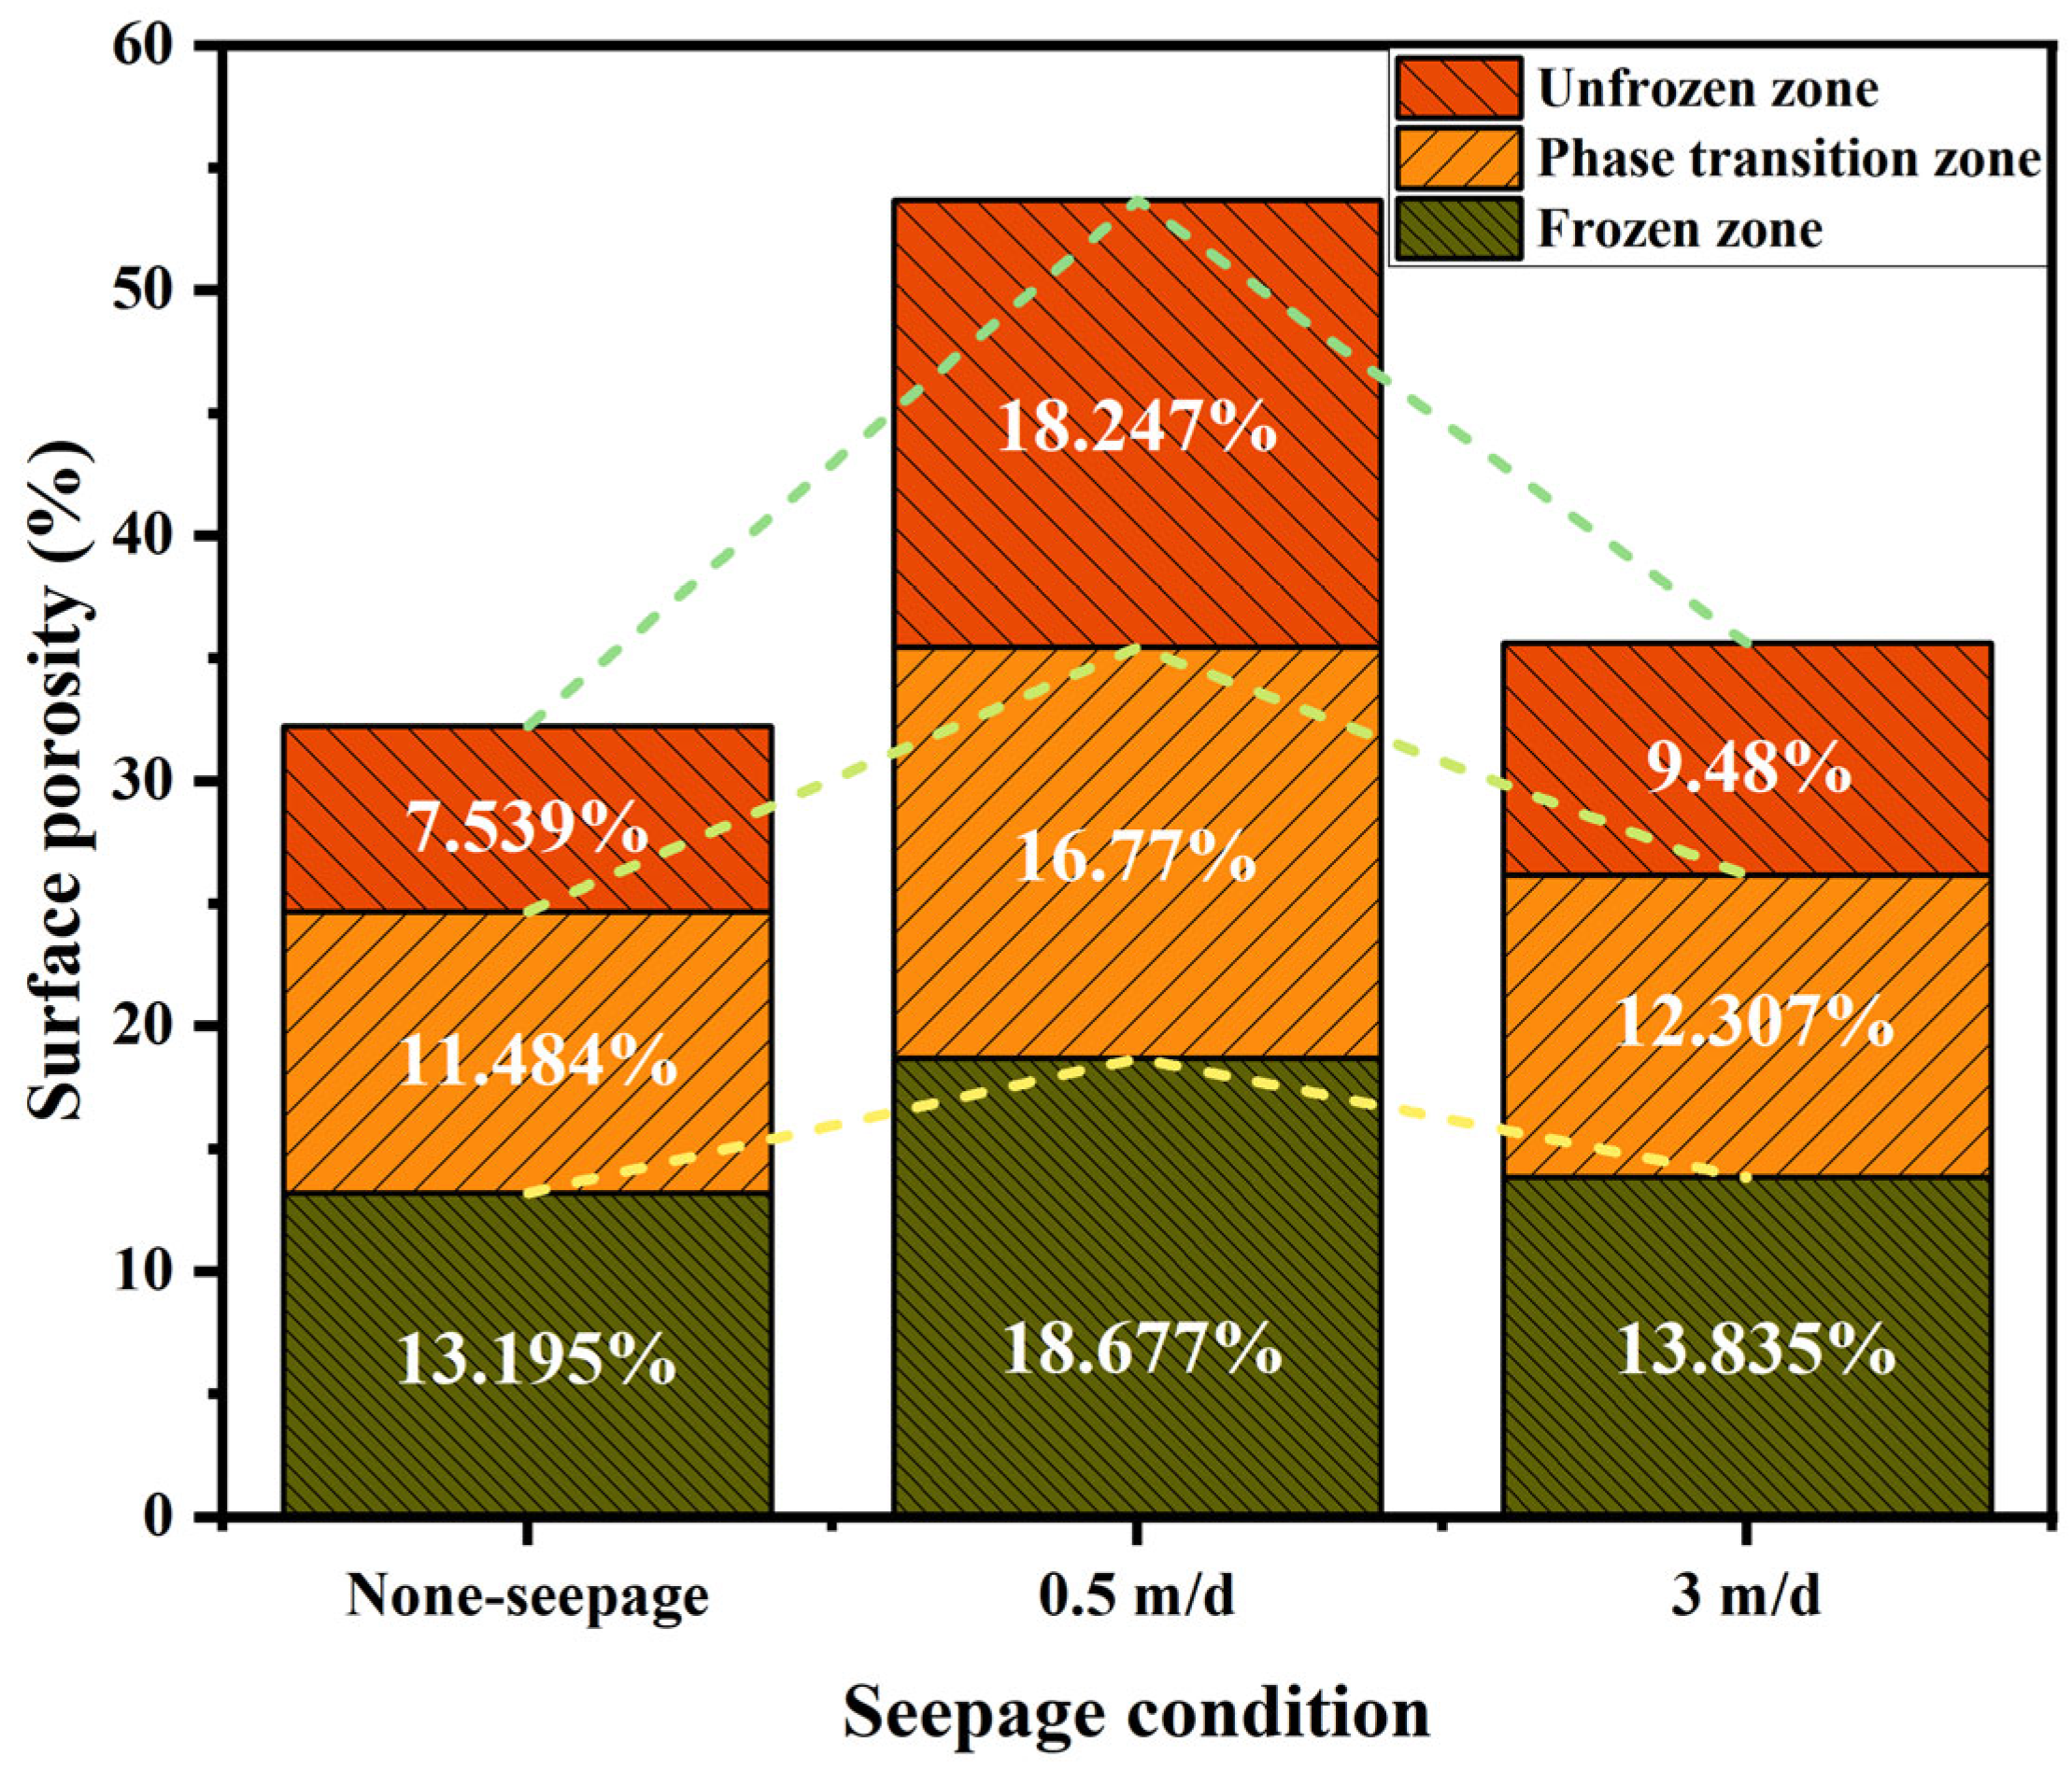
In order to further analyze the variations in the microstructure of coral sand particles under the freezing–seepage coupling process, images of particles in each zone under different seepage conditions were magnified 1000 times and the images were binarized using the threshold segmentation method, as shown in Figure 12. Subsequently, the surface porosity of each particle was calculated using the binarized images, as shown in Figure 13. It could be found that under the same seepage conditions, the surface porosity of particles in the frozen zone is generally higher than that in the phase transition zone and unfrozen zone. It is likely because the frost heave generated during the freezing process caused the original cracks inside the particles to expand and connect, exposing the internal pores to the surface. Consequently, a higher surface porosity is shown in the images. In addition, when the seepage velocity increases from 0 to 0.5 m/d, the surface porosity in all zones shows an upward trend. This may be attributed to the fact that seepage further promotes the growth of ice lenses, thereby magnifying the frost heave damage effect. However, when the seepage velocity increases to 3 m/d, the intense seepage exerts a significant scouring effect on the particle. Meanwhile, the strong convective heat transfer effect brought by higher seepage velocity inhibits the freezing effect, leading to a decrease in the surface porosity of particles in each zone.
Figure 12. Images of particles in each zone magnified 1000× and binary images under different seepage conditions. (a) Frozen zone (none-seepage). (b) Frozen zone (0.5 m/d). (c) Frozen zone (3 m/d). (d) Phase transition zone (none-seepage). (e) Phase transition zone (0.5 m/d). (f) Phase transition zone (3 m/d). (g) Unfrozen zone (none-seepage). (h) Unfrozen zone (0.5 m/d). (i) Unfrozen zone (3 m/d).
Figure 13. Surface porosity of coral sand particle in different seepage conditions in each zone.

4. Discussion

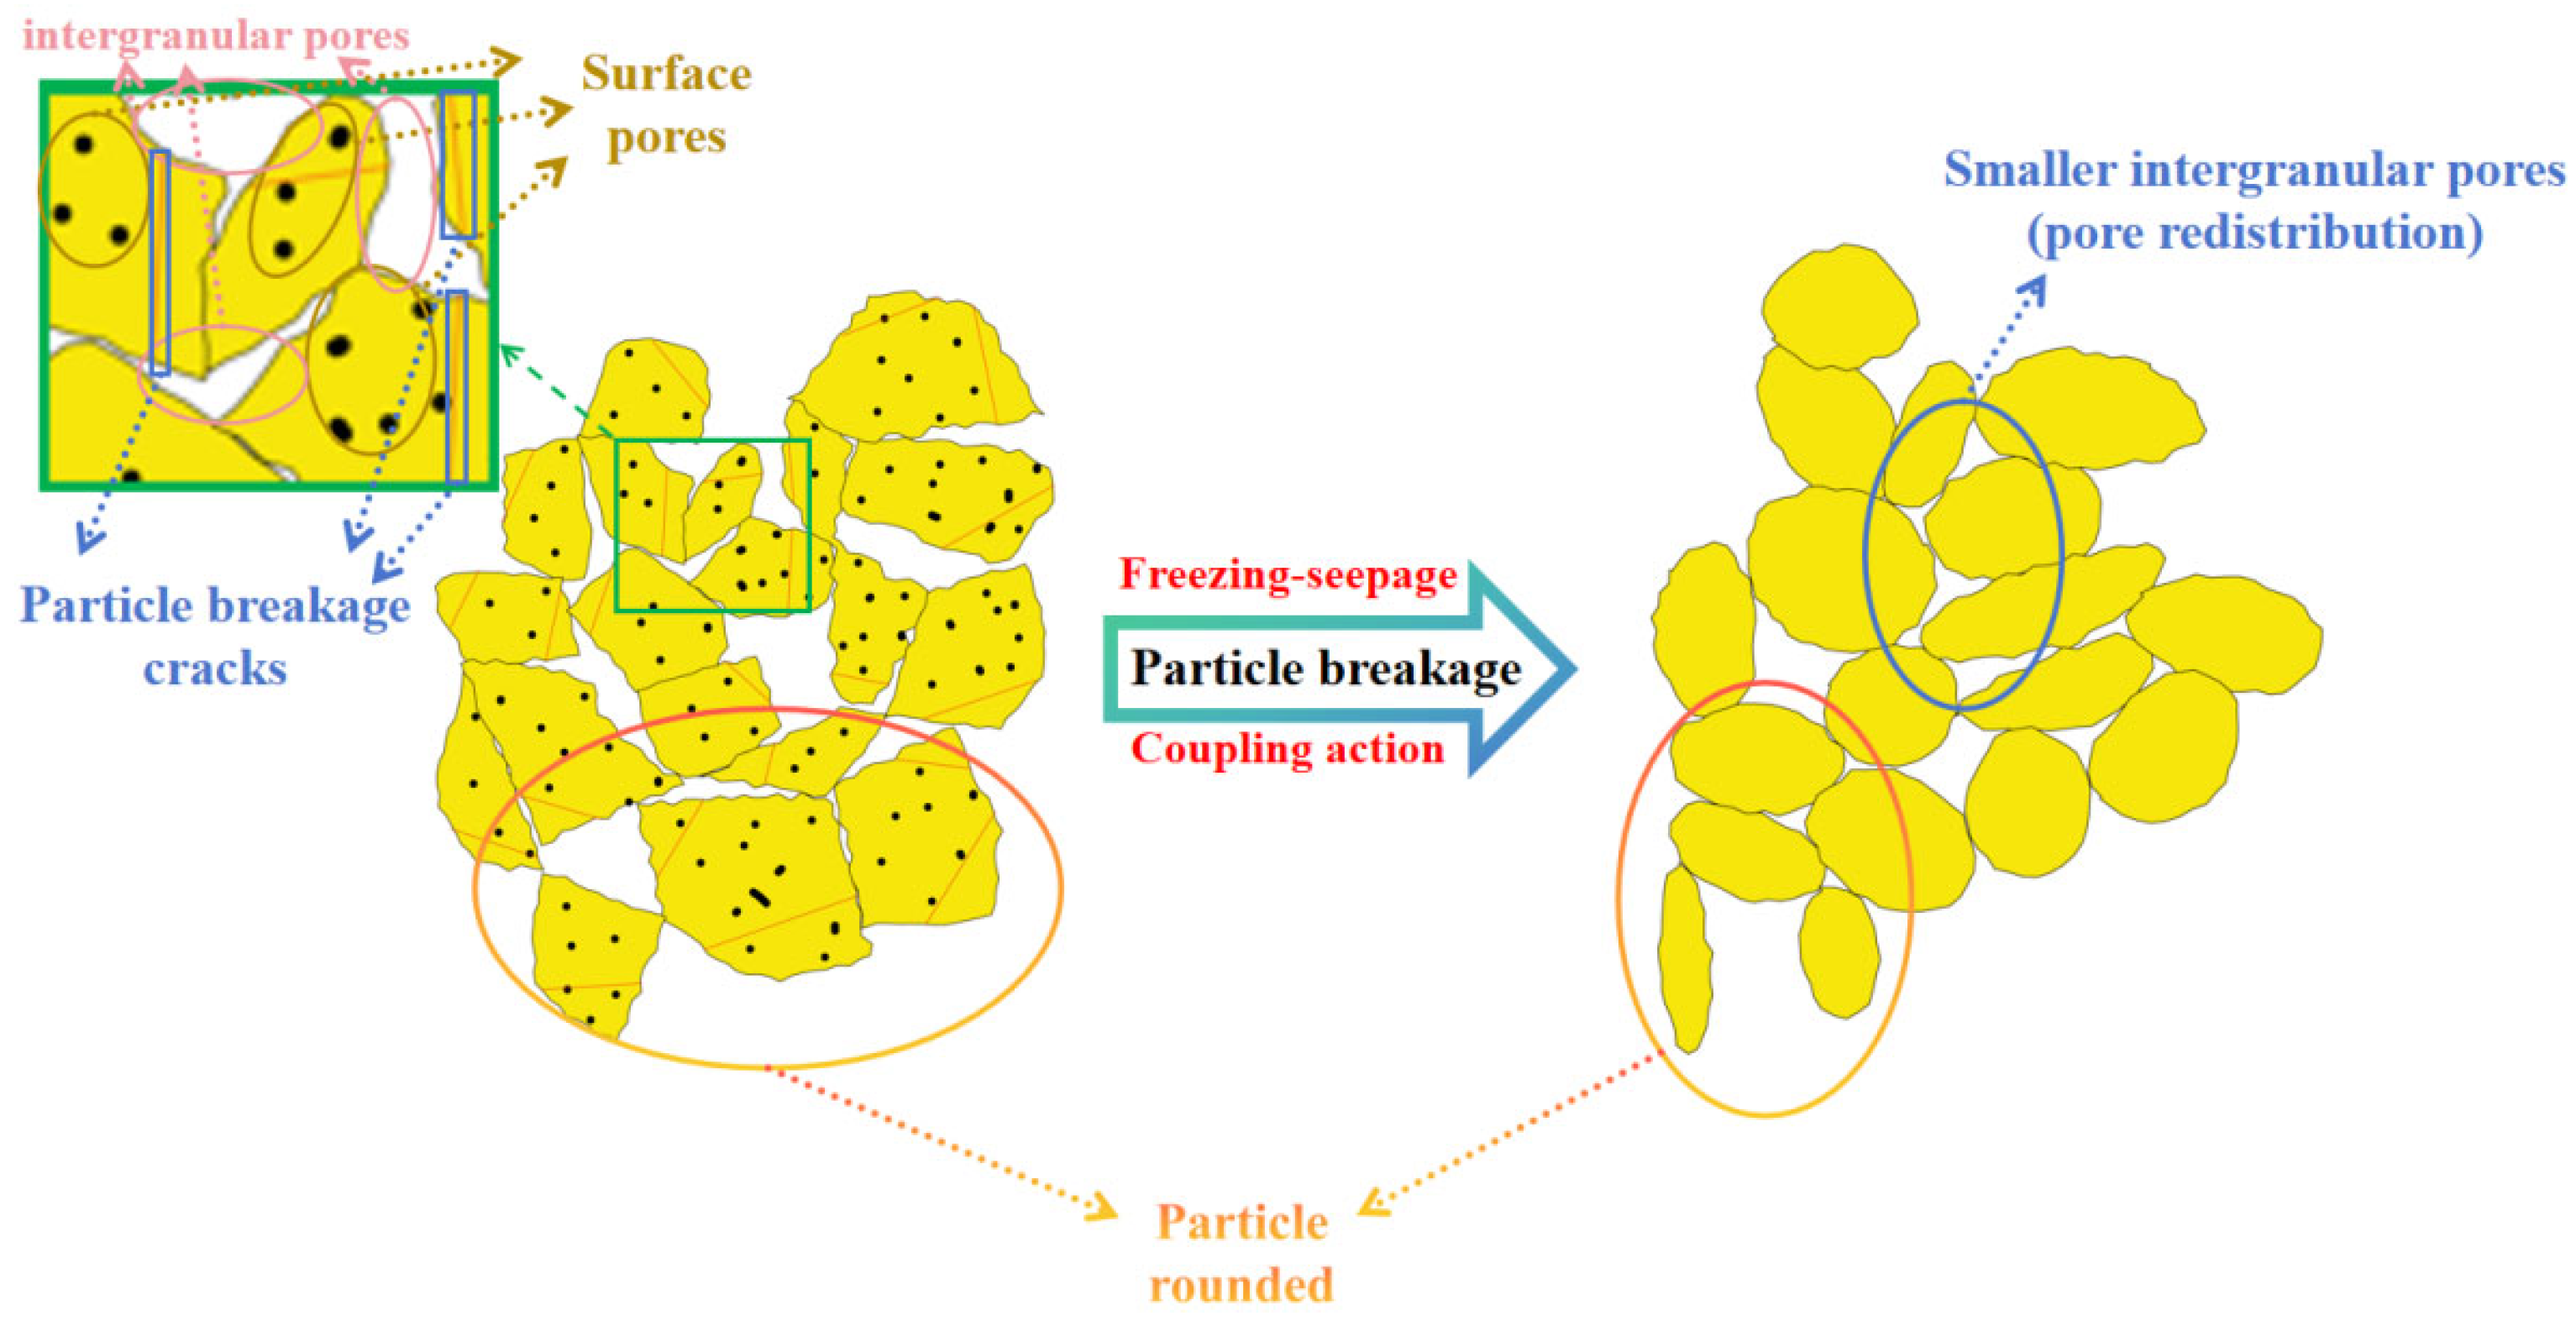
The schematic diagram of coral sand particle breakage under the coupling effect of freezing and seepage is shown in Figure 14. Based on the previous analysis, under the freezing–seepage coupling effect significant particle breakage of coral sand has occurred. The secondary particles produced by particle breakage filled the original larger intergranular pores, significantly reducing the pore connectivity. In addition, the internal pore structure of larger particles were damaged, leading to a decline in internal connectivity. The above processes led to the blockage of seepage preferential channels, forming a permeability barrier. For small seepage velocity (0–1.2 m/d), during the initial freezing stage the coral sand particle skeleton maintained relative stability. The intergranular pore structure and the internal pore structure did not change, and the pore distribution was relatively uniform. From the research results of Chai et al. (2023) [27], the thermal conditions during the freezing process were strictly controlled by the interaction of heat conduction and convective heat transfer. Our results showed that seepage velocity is a crucial factor determining the balance. At low seepage velocity (0–1.2 m/d), the impact of advective heat transfer is minimal. Heat transfer is dominated by conduction, enabling the development of a stable thermal gradient, which in turn promotes the rapid formation of a solid freezing curtain. This finding is consistent with the research results on AGF in sandy soil under weak seepage conditions, namely, a closed freezing curtain can effectively block seepage and stabilize the temperature field [28].
Figure 14. Schematic diagram of coral sand particle breakage under coupling effect of freezing and seepage.
In contrast, a high seepage velocity (3 m/d) introduces a dominant convective heat transfer component. The continuous seepage flow serves as a heat carrier, efficiently transporting thermal energy from the unfrozen zone to the frozen front. This process markedly delays the initial freezing rate by dissipating cold energy and increases the final stable temperature. The energy control equation incorporating phase transition can be conceptually expressed as follows [29]:
( ρ c ) m T t + ρ w c w u T = λ m 2 T + ρ i L i w ι i t
where ρ w c w u T represents the heat flux, which becomes significant at high seepage velocities. This continuous heat inflow explains the widespread influence of high-velocity seepage throughout the freezing process, preventing the freezing curtain from attaining the low temperature and high strength required for engineering stability.
Therefore, from an engineering standpoint, the application of AGF within coral sand strata proves to be feasible under low-velocity seepage conditions, as a stable and robust frozen curtain can be established. However, under high-velocity seepage conditions, this technique faces significant challenges. The failure to promptly form a frozen curtain, along with the higher stable temperature, weaken the strength and stability of curtain. As a result, it makes the AGF method for construction inadvisable without prior seepage control measures.
This study openly acknowledges several limitations. The freezing test was carried out in a freshwater medium and under unconfined conditions. The selected particle size range of coral sand was limited to less than 2 mm, which differs from the real marine environment and in situ stress states. Moreover, the microscopic evidence mainly relies on SEM images. Some of the mechanism explanations, such as the formation of ice lenses, remain hypothetical, and the statistical reproducibility is insufficient. These factors might affect the quantitative extrapolation of the research findings to field conditions. Therefore, the conclusions regarding the feasibility of AGF in this paper should be interpreted with caution. They are primarily applicable to explaining the basic mechanism of the freezing–seepage coupling effect. Further research will incorporate saltwater environments, confining pressure conditions, a wider particle size range, and advanced in situ monitoring technologies. This will enable the provision of more comprehensive and direct evidence and the construction of theoretical models that better approximate engineering practice.

5. Conclusions

In this research, coral sand from the SCS was used as the test material. The one-dimensional soil column unidirectional freezing test was carried out by setting four different seepage velocities. After the freezing test, adequate coral sand samples were obtained from different zones (frozen zone, phase transition zone, and unfrozen zone) for the particle sieving test and SEM test in sequence. Based on the results of each test, the particle breakage characteristics of coral sand after the freezing–seepage coupling process under different seepage velocities and temperature variation characteristics during the coupling process were explored. The conclusion are as follows:
  • Seepage could significantly reduce the advancing height of the frozen front of coral sand. Meanwhile, it influenced the freezing rate and final stable freezing temperature. Under conditions of low-velocity seepage (0–1.2 m/d), the impact of seepage on freezing temperature of coral sand was not obvious. However, under high-velocity seepage conditions (3 m/d), seepage exerted a continuous influence on the entire freezing process of coral sand. It not only significantly decreased the freezing rate in the early freezing stage but also remarkably increased the final stable freezing temperature. Consequently, it is feasible to use the AGF method for construction in coral sand strata under low-velocity seepage conditions. In contrast, when the seepage velocity is high, the AGF method is not feasible.
  • Under the coupling effect of freezing and seepage, obvious particle breakage of coral sand was observed. Regarding particle size distribution, under the conditions of none-seepage and 0.5 m/d seepage the freezing–seepage coupling process caused a decrease in the proportion of particles in the 0.5–2 mm size range in both the frozen zone and phase transition zone. In contrast, the proportion of particles in the 0.125–0.5 mm size range increased. Moreover, seepage exacerbated the damage to particles. In the size range of 0.054–0.125 mm, there were no significant differences in the mass proportion of coral sand under different seepage conditions, indicating that particle breakage was not obvious.
  • Based on SEM images, under different seepage conditions the coral sand particles in the frozen zone decreased in angularity and showed a significant breakage after the freezing–seepage coupling effect. In the phase transition zone and unfrozen zone, since the influence of freezing was less than that in the frozen zone the particle breakage was less obvious. Under the influence of seepage, the coral sand particles became more rounded due to the erosion effect of seepage, thereby enhancing the degree of roundness.

Author Contributions

Conceptualization, J.Z.; Methodology, J.Z. and H.Z.; Investigation, X.K. and H.Z.; Resources, J.Z. and J.H.; Data curation, J.Z. and X.K.; Writing—original draft, X.K.; Writing—review & editing, J.Z., H.Z., C.B. and C.L.; Funding acquisition, J.Z. All authors have read and agreed to the published version of the manuscript.

Funding

The research was supported by the National Natural Science Foundation of China, (No. 42477182), the 2022 Changjiang Young Scholars Program by the Ministry of Education of China (No. Q2022101), and the National Key R&D program of China (No. 2023YFC3008300 & No. 2023YFC3008305).

Institutional Review Board Statement

Not applicable.

Data Availability Statement

The original contributions presented in this study are included in the article. Further inquiries can be directed to the corresponding author.

Acknowledgments

We sincerely appreciate the support of test equipment provided by Key Laboratory of Geotechnical and Underground Engineering, Ministry of Education, Tongji University for this research. We are deeply appreciate to the technicians and colleagues who offered invaluable assistance during the test and data processing. We are also grateful to the reviewers and the editor for their valuable comments.

Conflicts of Interest

The authors declare no conflict of interest.

References

  1. Hu, J.; Gan, H.; Zhang, S.; Ye, T.; Liu, B.; Wei, K. Temperature field study of forced thawing by pipe curtain freezing method in Sanya submarine tunnel. Mar. Georesour. Geotechnol. 2024, 43, 1523–1539. [Google Scholar] [CrossRef]
  2. Zhang, Z.; Chen, S.; Li, X.; Wang, Y.; Long, H. Study on dynamic properties of saturated coral gravelly sand based on dynamic centrifuge tests. Ocean Eng. 2024, 312, 119325. [Google Scholar] [CrossRef]
  3. Zhang, X.; Meng, L.; Li, D.; Ye, Y.; Wei, K. Investigating correlations between microstructural characteristics and mechanical properties of coral sand mortar with different silica fume contents. Constr. Build. Mater. 2024, 438, 137180. [Google Scholar] [CrossRef]
  4. Gao, R.; Ye, J. Mechanical behaviors of coral sand and relationship between particle breakage and plastic work. Eng. Geol. 2023, 316, 107063. [Google Scholar] [CrossRef]
  5. Wang, Z.; Sheng, J.; Wang, Q.; Wu, X.; Liang, Z.; Xu, S.; Yao, Z. Experimental study on vertical seepage of coarse-grained calcareous sand. Soil Dynam. Earthq. Eng. 2024, 181, 108661. [Google Scholar] [CrossRef]
  6. Ding, H.; Wang, X.; Wen, D.; Huang, P. Seepage deformation characteristic of gap-graded coral sand in the South China Sea. Appl. Ocean Res. 2024, 143, 103865. [Google Scholar] [CrossRef]
  7. Li, X.; Zhou, W.-H.; Liu, J.; Wang, C. Elastic-plastic response and particle breakage in marine coral sand: Roles of fines and density state. Ocean Eng. 2025, 323, 120499. [Google Scholar] [CrossRef]
  8. Liu, F.; Tang, H.; Shahin, M.A.; Zhao, H.; Karrech, A.; Zhu, F.; Zhou, H. Multiscale simulation study for mechanical characteristics of coral sand influenced by particle breakage. Power Technol. 2025, 449, 120387. [Google Scholar] [CrossRef]
  9. Peng, Y.; Ding, X.; Yin, Z.-Y.; Wang, P. Micromechanical analysis of the particle corner breakage effect on pile penetration resistance dna formation of breakage zones in coral sand. Ocean Eng. 2022, 259, 111859. [Google Scholar] [CrossRef]
  10. Wan, Z.; Liu, Y.; Jin, J.; Hu, T.; Zhou, F.; Dai, G. Penetration behavior and particle breakage in coral calcareous sand for offshore pile foundations: Experimental and numerical analysis. Ocean Eng. 2025, 340, 122268. [Google Scholar] [CrossRef]
  11. Wang, G.; Wang, Z.; Ye, Q.; Zha, J. Particle breakage evolution of coral sand using triaxial compression tests. J. Rock Mech. Geotech. Eng. 2021, 13, 321–334. [Google Scholar] [CrossRef]
  12. Lin, L.; Li, S.; Huo, L.; Liu, X. Study on the relationship between fractal dimension and particle fragmentation for marine coral sand under impact load. Ocean Eng. 2023, 286, 115442. [Google Scholar] [CrossRef]
  13. Guo, L.; Fei, X.; Wu, J.; Zhao, L.; Lyu, B. High ductility cementitious composites incorporating seawater and coral sand (SCS-HDCC) for offshore engineering: Microstructure, mechanical performance and sustainability. Cem. Concr. Compos. 2024, 147, 105414. [Google Scholar]
  14. Zhang, X.; Wei, K.; Li, D.; Zhou, Y.; Liang, W. Characterization of mechanical properties and microstructure of silica mortar and coral sand mortar based on nuclear magnetic resonance technology. Mater. Today Commun. 2022, 33, 104909. [Google Scholar] [CrossRef]
  15. Zhang, X.; Zuo, J.; Wang, Z.; Cai, Y.; Zhou, Y. The evolution of the microstructure and mechanical properties of coral aggregate mortar under uniaxial compression using ultrasonic analysis. Constru. Build. Mater. 2021, 300, 124000. [Google Scholar] [CrossRef]
  16. Yang, Z.; Cao, S.; Chang, Z.; Wang, Y. Microstructure evolution of coral sand during impact liquefaction process. Soil Dynam. Earthq. Eng. 2025, 198, 109615. [Google Scholar] [CrossRef]
  17. Deng, G.; Guo, R.; Ma, L.; Long, Z.; Xu, F.; Yin, C.; Xu, X. Study on dynamic mechanical properties and microstructure of basalt fiber reinforced coral sand cement composite. Constr. Build. Mater. 2024, 425, 136024. [Google Scholar] [CrossRef]
  18. GB/T 50123-2019; Standard for Geotechnical Testing Method. Ministry of Water Resources of the People’s Republic of China: Beijing, China; China Planning Press: Beijing, China, 2019.
  19. DG/TJ 08-092-2016; Technical Code for Crosspassage Freezing Method. Shanghai Shentong Rail Transit Research and Consulting Company: Shanghai, China, 2016.
  20. Zhou, J.; Li, Z.; Wan, P.; Tang, Y.; Zhao, W. Effects of seepage in clay-sand composite strata on artificial ground freezing and surrounding engineering environment. Chin. J. Geotech. Eng. 2021, 43, 471–480. (In Chinese) [Google Scholar]
  21. Gao, G.; Guo, W.; Zhu, X. Degree of artificial freezing analyses under high seepage condition. Int. J. Heat Mass Tran. 2025, 236, 126352. [Google Scholar] [CrossRef]
  22. Liu, Z.; Guo, C.; Cao, D.; Rui, H. Compression characteristics of coral calcareous sand in the South China Sea. Sci. Technol. Eng. 2022, 22, 2401–2408. (In Chinese) [Google Scholar]
  23. Liu, X.; Nowamooz, H.; Shen, Y.; Liu, Y.; Han, Y.; An, Y. Heat transfer analysis in artificial ground freezing for subway cross passage under seepage flow. Tunn. Undergr. Sp. Technol. 2023, 133, 104943. [Google Scholar] [CrossRef]
  24. Zhou, J.; Zhou, H.; Wang, C.; Guo, Z.; Pei, W. Analysis of moisture migration, temperature, and pore structure characteristics of the muddy clay column to artificial ground freezing based on LF NMR. Tunn. Undergr. Sp. Technol. 2023, 133, 104948. [Google Scholar] [CrossRef]
  25. Xu, D.-S.; Shen, G.; Liu, Q.-M.; Du, W.-B. Dynamic mechanical response and particle breakage characteristics of calcareous sand. Soil Dynam. Earthq. Eng. 2024, 181, 108653. [Google Scholar] [CrossRef]
  26. Ma, W.; Chen, G.; Wu, Q. Experimental study on liquefaction resistance of coral sand under complex loading conditions. Rock Soil Mech. 2020, 41, 535–542. (In Chinese) [Google Scholar]
  27. Chai, M.; Luo, Y.; Gao, Y.; Ma, W.; Mu, Y. Seepage influence of supra-permafrost groundwater on thermal field of embankment on Qinghai-Tibet Plateau, China. Res. Cold Arid. Reg. 2023, 15, 132–140. [Google Scholar] [CrossRef]
  28. Hou, S.; Yang, Y.; Cai, C.; Chen, Y.; Li, F.; Lei, D. Modeling heat and mass transfer during artificial ground freezing considering the influence of water seepage. Int. J. Heat Mass Transf. 2022, 194, 123053. [Google Scholar] [CrossRef]
  29. Li, X.K.; Li, X.; Liu, S.; Qi, J.L. Thermal-seepage coupled numerical simulation methodology for the artificial ground freezing process. Comput. Geotech. 2023, 156, 105246. [Google Scholar] [CrossRef]
Disclaimer/Publisher’s Note: The statements, opinions and data contained in all publications are solely those of the individual author(s) and contributor(s) and not of MDPI and/or the editor(s). MDPI and/or the editor(s) disclaim responsibility for any injury to people or property resulting from any ideas, methods, instructions or products referred to in the content.

Article Metrics

Citations

Article Access Statistics

Multiple requests from the same IP address are counted as one view.