Article

Assessing Short-Term Temporal Variability of CO2 Emission and Soil O2 Influx in Tropical Pastures and Regenerating Forests

by
Wanderson Benerval De Lucena
1,*,
Kleve Freddy Ferreira Canteral
1,
Maria Elisa Vicentini
1,
Daniele Fernanda Zulian
2,
Renato Paiva De Lima
3,
Mario Luiz Teixeira De Moraes
2,
Maurício Roberto Cherubin
4,5,
Carlos Eduardo Pellegrino Cerri
4,5,
Alan Rodrigo Panosso
1 and
Newton La Scala Jr.
1
1
Department of Engineering and Exacts Sciences, Faculty of Agricultural and Veterinary Sciences (FCAV), São Paulo State University (Unesp), Jaboticabal 14884-900, São Paulo, Brazil
2
Department of Phytotechnics and Food Technology and Socioeconomics, School of Engineering (FEIS), São Paulo State University (Unesp), Ilha Solteira 15385-007, São Paulo, Brazil
3
Agricultural Engineering College (FEAGRI), University of Campinas, Campinas 13083-876, São Paulo, Brazil
4
Department of Soil Science, “Luiz de Queiroz” College of Agriculture (Esalq), University of São Paulo (USP), Piracicaba 13418-900, São Paulo, Brazil
5
Center for Carbon Research in Tropical Agriculture (CCARBON), University of São Paulo (USP), Piracicaba 13418-900, São Paulo, Brazil
*
Author to whom correspondence should be addressed.
Appl. Sci. 2025, 15(22), 12302; https://doi.org/10.3390/app152212302
Submission received: 12 October 2025 / Revised: 27 October 2025 / Accepted: 28 October 2025 / Published: 20 November 2025

Abstract

Soil respiration, the exchange of gases between soil and the atmosphere (O2 consumption and CO2 production), plays a key role in ecosystem functioning and climate regulation. This study investigated the short-term temporal variability of soil CO2 emissions and O2 influx and their relationship with tropical climate conditions and soil attributes in the Cerrado region, Selvíria, MS, Brazil. Soil CO2 emissions were measured using the LI-8100 portable system, while soil O2 influx was estimated by linear interpolation of O2 variation inside the chamber using a UV Flux 25% (ultraviolet light) sensor. Soil temperature and moisture were measured simultaneously in three land use types: pasture (~11 years) and reforested areas with native species and eucalyptus (~35 years). Soils were classified as Oxisoils according to Soil Taxonomy. Significant short-term temporal variability was observed in CO2 emissions (mean 3.2 ± 0.5 µmol m−2 s−1), O2 influx (mean 1.8 ± 0.3 mg O2 m−2 s−1), soil temperature and moisture across the land use types. Pasture areas exhibited the lowest CO2 emission rates, associated with improved soil attributes (soil organic matter, sum of bases and pH) due to management practices, while reforested areas showed overlapping soil respiration patterns and higher temporal variability. Principal component analysis revealed strong coupling between O2 influx and CO2 emission in reforested soils. These findings highlight the influence of land use on short-term soil respiration dynamics and underscore the importance of sustainable pasture management and reforestation in the Brazilian Cerrado. The results also support public policies aimed at restoring degraded pastures, reducing deforestation and burning, and enhancing soil carbon sequestration to mitigate climate change.

1. Introduction

The Intergovernmental Panel on Climate Change (IPCC) already points to a global warming of the planet’s average temperature of the order of 1.1 °C above 1850–1900, with greater increases on the Earth’s surface (1.34 to 1.83 °C) than in its oceans (0.68 to 1.01 °C) [1]. Global warming is driven by anthropogenic actions, such as emissions from fossil fuels, and land use changes, which drive some changes in planetary biogeochemical cycles, especially that of carbon [1,2,3]. Globally, it is estimated that approximately 12% of soil carbon is condensed in agricultural areas [4]. In Brazil, CO2 emissions associated with land use and soil cover between 1990 and 2021 were in the order of 40.5 Gt CO2 equivalent year−1. This represents a fraction of 57% of the CO2 equivalent emissions of Brazil for the same period [5,6]. This reinforces the importance of studies that analyze agroecosystems with different land uses.
Therefore, developing strategies to reduce greenhouse gas emissions and/or remove atmospheric CO2 is imperative to mitigate climate change (UN-SDG-13) in the next decades. This mitigation can happen when part of the carbon emitted is incorporated into the soil ecosystem, and such a process is highly favored by photosynthesis [7]. In this way, agriculture that prioritizes the conservation of carbon in the soil is an ally for mitigating climate change [8]. This demonstrates the need for studies that advance the topic of soil respiration and the understanding of this process, as reinforced by ref. [1].
Respiration can be understood as the consumption of oxygen and the production of carbon dioxide arising from the cellular respiration of microorganisms, plant roots, microbiological decomposition and soil fauna [7]. This phenomenon is known as soil metabolism. Changes in CO2 emissions over time are closely related to soil moisture and temperature, as well as climatic conditions that directly influence these variables [9,10]. There is little research on soil oxygen influx with this perspective on soil metabolism [11], but some studies carried out in tropical soils demonstrate the importance of O2 in soil respiratory dynamics, especially concerning the global carbon cycle [12,13,14]. Therefore, a better understanding of temporal changes in O2 and CO2 fluxes is fundamental to understand which agricultural and management systems are more promising for the low-impact agricultural agenda.
Considering only the terrestrial ecosystem, soil is the largest global carbon reservoir [15]. Therefore, implications for soil management and vegetation cover, as well as changes in land use, impose different dynamics of gas exchange in the soil–atmosphere system [16,17]. These gas exchanges are the subject of this manuscript and mainly involve the relationship between oxygen consumption and carbon dioxide production. According to the synthesis of the sixth assessment report of the Intergovernmental Panel on Climate Change [1], reforestations with high maturity, at their climax, have a lower potential for carbon storage (less than 1 Gt CO2 year−1) compared to systems involving agricultural crops and/or livestock, which have a higher potential (more than 3 Gt CO2 year−1 ) [1].
Given this context, Brazilian pastures, when well managed, provide a series of benefits to the soil, increasing the degree of sustainability of this agroecosystem [18]. These benefits range from socio-environmental, economic and productive, as they can favor the accumulation of organic matter in tropical soils. Thus, the presence of vegetation cover is associated with a reduction in the impact of rain droplets on the soil, reducing the erosion process, which contributes to lower losses of soil carbon [19]. On the other hand, there are around 159 million hectares of degraded pastures in Brazil [20,21], reinforcing the need for studies focusing on the adoption of transition and management strategies for sustainable soils in these agroecosystems.
Pasture cultivation is a good agricultural strategy as it presents a good response to management and climatic conditions favorable to vegetative growth. This development requires good conditions in soil fertility and root activation for the transport of water and nutrients from the soil to the plant [22]. The activation of these roots requires a high demand for oxygen for root respiration [23]; on the other hand, forests that have reached climax maintain a stable growth range, with no high demands for water, nutrients or oxygen from the soil as it develops mechanisms for recycling soil organic matter and a strong interrelationship with soil microbiota.
Changes in CO2 emissions and O2 influx over time are not constant; they exhibit short-term temporal variability influenced by soil moisture, temperature and climatic fluctuations, as well as long-term seasonal dynamics. Understanding these temporal patterns is crucial, as short-term measurements can capture rapid responses to environmental changes, while long-term observations reveal the cumulative effects of land use and management on carbon cycling [22]. Despite their importance, few studies have investigated high-frequency temporal changes in both CO2 and O2 fluxes, especially in tropical soils, which limits our ability to predict how different agroecosystems respond to climate variability and management practices.
The hypothesis tested concerns whether soil respiration (CO2 emission and soil O2 influx) is an indicator of the amount of carbon fixation in the soil. Over time, high CO2 emission rates have been associated with carbon loss in the soil. In contrast, soil oxygen influx, although something new, may allow us to better understand the dynamics of emissions in different tropical agrosystems. To test this hypothesis, a field study was conducted, aiming to investigate the short-term temporal variability of soil respiration, i.e., CO2 emission and soil O2 influx, with soil moisture and temperature and relate it to soil attributes under different land uses, such as pasture, eucalyptus and reforested native species of the Brazilian Savanna (Cerrado biome), in tropical climate conditions.

2. Materials and Methods

2.1. Study Area and Land Uses

The study areas are located in Selvíria, Mato Grosso do Sul, Brazil. Selvíria is a municipality located on the right bank of the Paraná River under geographic coordinates 20°20′58″ South latitude and 51°23’45″ West longitude with an altitude of 331 m (Figure 1). The soil of the study region was classified taking into account the Brazilian Soil Classification System, and the soil in the region was classified as a Latossolo Vermelho Distrófico Típico (Brazilian Soil Classification System [24]) with a moderate A horizon [24]. Featuring a slope of 0.25%, the relief was characterized as moderately flat and wavy [24]. The soil was equivalent to Clayey Oxisol according to Soil Taxonomy [25].
The eucalyptus (Eucalyptus camaldulensis) and reforestation with native species (RNS) areas belong to the Teaching, Research and Extension Farm of the Faculty of Engineering of Ilha Solteira Campus. Meanwhile, the adjacent area, a brachiaria (Urochloa decumbens) pasture, is a private area that was provided for the experiment. These sites were selected for evaluation because they are on the same toposequence, in addition to representing typical uses in the region [26].
The local climate was classified as C1dAa’ by Thorrnthwaite’s classification system [27]. This classification was adopted as it is more sensitive to the amounts of rainfall, temperature and relief of the region [28], indicating a region that is dry and sub-humid, without water surpluses and with an average annual temperature of around 24 °C [28]. The average annual precipitation is 1300 mm, with a rainy period occurring between the months of November to April and the most dry period from May to October [29].
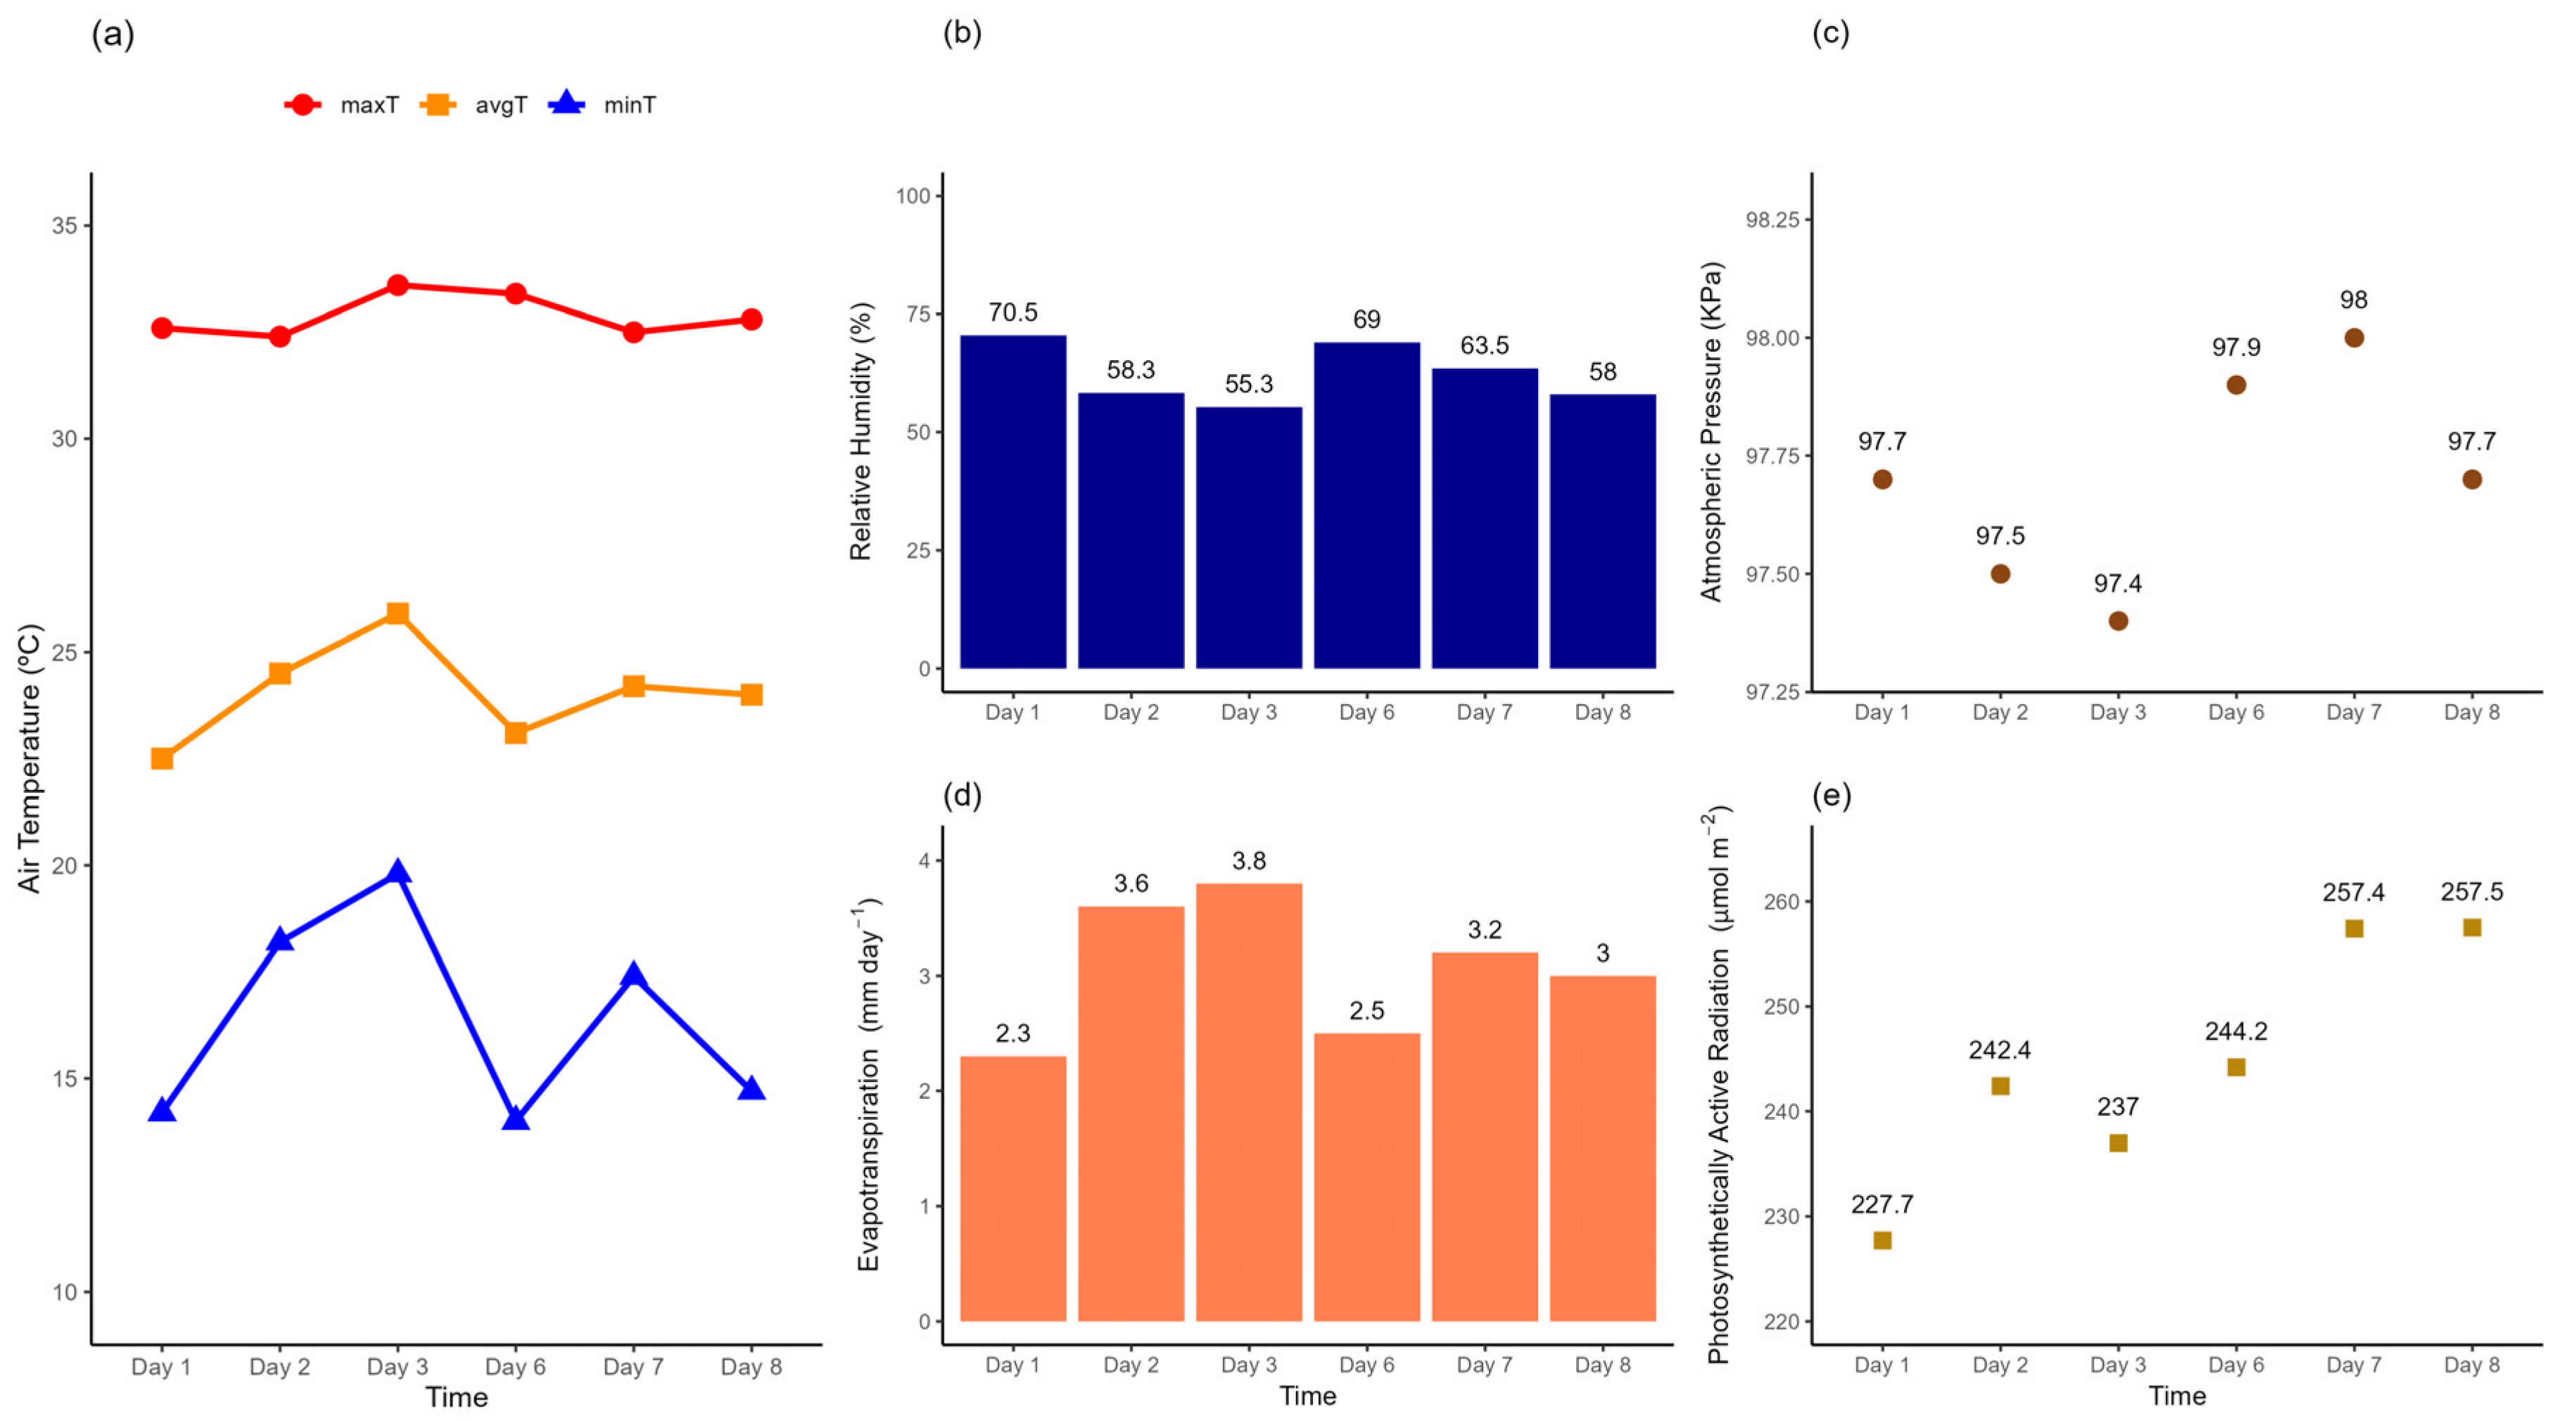
The climatic data during the experiment were obtained from the Unesp Agrometereological Station, Ilha Solteira unit, São Paulo, Brazil, at an altitude of 337 m. In Figure 2, we present the average, maximum and minimum air temperatures (avgT, maxT and minT, respectively) in °C (Figure 2a), as well as the evapotranspiration (ETo), calculated by applying the Penman–Monteith method proposed by the FAO [30] (Figure 2d). The figure also presents the average relative humidity (in %) (Figure 2b), the photosynthetically active radiation (PAR), expressed in µmol m−2 (Figure 2e), and the atmospheric pressure (AtmP) in kilopascals (KPa) (Figure 2c) for the period of the experiment.
In this study, three land uses were evaluated, as follows:
(1) The pasture area was degraded and was renovated in 2007 using disk plowing plus harrowing for leveling. This area was brachiaria (U. decumbens) pasture before and was renovated by placing brachiaria (U. decumbens ) again, which continues to grow to this day. In terms of fertilization, fertilizers containing nitrogen (N), phosphorus (P) and potassium (K) were applied annually (about 200 kg of formulation 08-18-16) and liming took place every four years according to soil analysis.
Based on the pasture classification by [21], which is available in the Atlas das Pastagens (https://atlasdaspastagens.ufg.br/map, accessed on 19 July 2022), the pasture area used in this study was classified as managed pasture. The classification proposed by [21] is based on Landsat satellite images and supported by machine learning methods using the Google Earth Engine platform [20].
(2) Reforestation with eucalyptus (Eucalyptus): the term reforestation (or reforested areas) was adopted following the recommendation of [31], which suggested the use of this term to designate previously deforested areas in which forest settlement (forest planting) of native or exotic species (such as eucalyptus) was used to restore the landscape. Therefore, these sites were selected for evaluation as they are in the same toposequence, in addition to representing typical uses for the region.
The areas of reforestation were covered by their native vegetation until 1970; however, in 1978, they were deforested and replaced by the planting of annual crops, such as corn (Zea mays), soybeans (Glycine max), cotton (Gossypium hirsutum) and green manure until the year 1986 [32,33]. However, in 1986, the land was converted to different uses. Use with eucalyptus reforestation was implemented in April 1986, and the land is now composed of a population of E. camaldulensis (45,500 m2), with a spacing of 4 × 4 m.
(3) Reforestation with native species (RNS): this land is composed of species native to the Cerrado region and was installed in March 1986, adopting a spacing of 3 × 2 m. The species are distributed in a random manner. The species used in reforestation with native species have already been described by [14].
Thus, for the experimental design, 18 sampling points were established in each land use type (pasture, eucalyptus reforestation and reforestation with native species) following a stratified-random layout along the toposequence to capture spatial variability. Soil CO2 emissions and O2 influx were measured daily for eight consecutive days, while soil temperature and moisture were recorded simultaneously at each point. This short-term monitoring allowed the investigation of temporal variability of soil respiration and its relationship with soil attributes and climatic conditions under different land uses.

2.2. Soil CO2 Emission, Soil Moisture and Temperature

The CO2 emission readings (FCO2) were recorded on 13, 14, 15, 18, 19 and 20 July 2022. For teaching purposes, they were assigned from the first (13 July 2022) to the eighth (20 July 2022) study day that corresponds to the assessment days. Six random points were distributed in the areas, and at each point, three PVC collars measuring 0.05 m in height and 0.1 m in diameter were allocated. Throughout the area, 18 collars were allocated. The CO2 emission measurements were carried out using a portable LI-8100 system called the Automated Soil CO2 Flow System, manufactured by LI-COR Biosciences®, Lincoln, NE, USA. The Li-8100 system was coupled to a model 8100-102 camera that provided measurements on the soil CO2 emissions (Supplementary Materials Figure S1).
This chamber has an internal volume of 854.2 cm3 with a circular contact area of 83.7 cm2. This system verifies changes in CO2 concentrations using the IRGA sensor (Infrared Gas Analyzer) through optical absorption spectroscopy in the near-infrared spectral region. The chamber was placed on PVC collars previously inserted into the soil (24 h before) at each sampling point at a depth of 0.03 m. To determine CO2 emission from the soil, the reading standard adopted was 90 s with a dead band of 20 s. The result of the variation in carbon dioxide over time inside the chamber was given in µmol m−2 s −1.
Soil moisture was determined using TDR (Time Domain Reflectometry) equipment, a portable soil moisture sensor model HidroSense II (HS2) manufactured by Campbell Scientific® (Logan, UT, USA) that evaluates available soil moisture in a percentage (volume/volume) using a double 0.12 m rod. The soil temperature was obtained using an infrared thermometer model GM320 positioned under the soil at the location of the PVC collar that was previously installed. The soil temperature obtained was presented in degrees Celsius.

2.3. Soil O2 Influx

The determination of the soil O2 influx (iO2) was carried out using a PVC camera coupled to a Smart Oxygen Sensor UV Flux 25% model CM-42951 manufactured by CO2 METER® (Ormond Beach, FL, USA). This system consists of a portable sensor that measures the variation in oxygen inside the camera using the principle of fluorescence with ultraviolet light. This system provides low bias and cross sensitivity. Thus, the camera with the sensor was coupled to a portable computer by a USB port and connected using the GasLab® software (Ormond Beach, FL, USA) to record data in real time.
The soil O2 influx (iO2) was determined by measuring the change in oxygen concentration over time inside the chamber. To estimate the O2 flux, linear interpolation was applied to the oxygen concentration data recorded every second during the 300 s (5 min) sampling period. This approach assumes that the change in O2 concentration between consecutive measurements follows a straight line, allowing a precise estimation of the O2 decay rate over the sampling interval. The interpolated slope (dO2/dt) was then used in Equation (1), together with atmospheric pressure, absolute temperature and chamber volume, to calculate the soil O2 influx in mg O2 m−2 s−1 [34].
i O 2 = d O 2 P M d t R T H
where dO2/dt is the amount of O2 (ppm) measured as a function of time t (s); P is atmospheric pressure (Pa); M is the molar mass of O2 (g m−3); R is the universal gas constant (8.314462 J mol−1 K−1); T is the absolute temperature (K); and H = V/A for volume (V) = 6.6 × 10⁻⁶ m3 and collar area (A) = 0.008 m2 above the ground [12,35,36,37].

2.4. Characterization of Soil Attributes in Agroecosystems

Eighteen points (N = 18) were collected throughout the area to carry out analyses to characterize the soil’s fertility and physical attributes for the 0–0.40 m layer. The deformed samples were sent to the soil fertility laboratory at Unesp-Ilha Solteira to carry out routine analyses following the procedures proposed by [38]. Meanwhile, to determine the physical attributes of the soil, undisturbed samples were sent to Esalq/USP, where the recommendations proposed in the Soil Analysis Methods Manual were followed [39]. These data were subjected to analysis of variance and Tukey’s mean comparison test at 5% probability [40,41].

2.5. Data Analysis

2.5.1. Temporal Variability of Soil CO2 Emission, Soil O2 Influx, Soil Moisture and Soil Temperature

Temporal variability was determined using analysis of variance for experiments with repeated measures over time. This means that different land uses were monitored and evaluated over time [42,43]; thus, global and daily averages for CO2 emission, O2 influx, soil moisture and temperature were calculated for each land use.
To carry out the analysis of variance, the following assumptions were applied: the model residuals were normally distributed and were tested using the Shapiro–Wilk normality test (p > 0.05) [44] and the homocesdacity hypothesis, which was tested using the Bartlett test (p > 0.05) [45]. The null hypothesis of both tests were met, that is, there was normality of residuals and homogeneity in variances.
This analysis allows multiple comparisons between different land uses by determining variability over time, so the results represent reliable information on the comparison between different uses [46]. To facilitate the understanding and visualization of these comparisons, the data was presented in graphical form. The mean comparison test used was Tukey’s test (p < 0.05).

2.5.2. Analysis of Soil Attributes Under Different Uses

Statistical differences between soil attributes under different agroecosystems were verified for the 0.0 to 0.40 m layer. These data were subjected to Tukey’s multiple comparison test [41]. This is the method of comparing means that is considered the most rigorous, as it consists of the minimum significant difference comparing means two by two [43,47].
The soil fertility variables selected for this analysis were soil organic matter (SOM), hydrogen potential (pH) and sum of bases (SB), while the physical variables selected were soil density (BD) and soil macro- and microporosity. These variables were selected because they are frequently related to soil respiration dynamics [8,48,49].

2.5.3. Principal Component Analysis with Clusters

Principal component analysis (PCA) with clusters is a multivariate analysis technique that allows you to verify similarities and connections by observing the behavior of variables and factors. This method’s principle is to reduce complexity by explaining the variance and covariance structure of a random vector through linear combinations of the original variables. Thus, PCA through graphs can help identify patterns, which can contribute to explaining the connections established by the data [50].
Therefore, the variables selected to carry out the analysis were the following: soil CO2 emission (FCO2), soil O2 influx (iO2), soil moisture (SM), soil temperature (ST), soil organic matter (SOM), hydrogen potential (pH), sum of bases (SB), soil macroporosity (Macro), soil microporosity (Micro), soil bulk density (BD), average air temperature (Temp), average relative humidity (RH), photosynthetically active radiation (PAR), atmospheric pressure (AtmP) and reference evapotranspiration (ETo). These results comply with the criteria defined by [51] for eigenvectors. Meanwhile, in our discussions, variables that have explanatory power (eigenvalue) in modulus equal to or greater than 0.50 were considered.
All statistical analyses were performed in the R language [52] with the help of the following packages: ExpDes.pt [53]; factoextra [54]; readxl [55]; tidyverse [56]; rstatix [57]; patchwork [58]; nortest [59]; lawstat [36]; agricolae [40] and ggplot2 [60].

3. Results

3.1. Temporal Variability of Soil CO2 Emission, Soil O2 Influx, Soil Moisture and Temperature

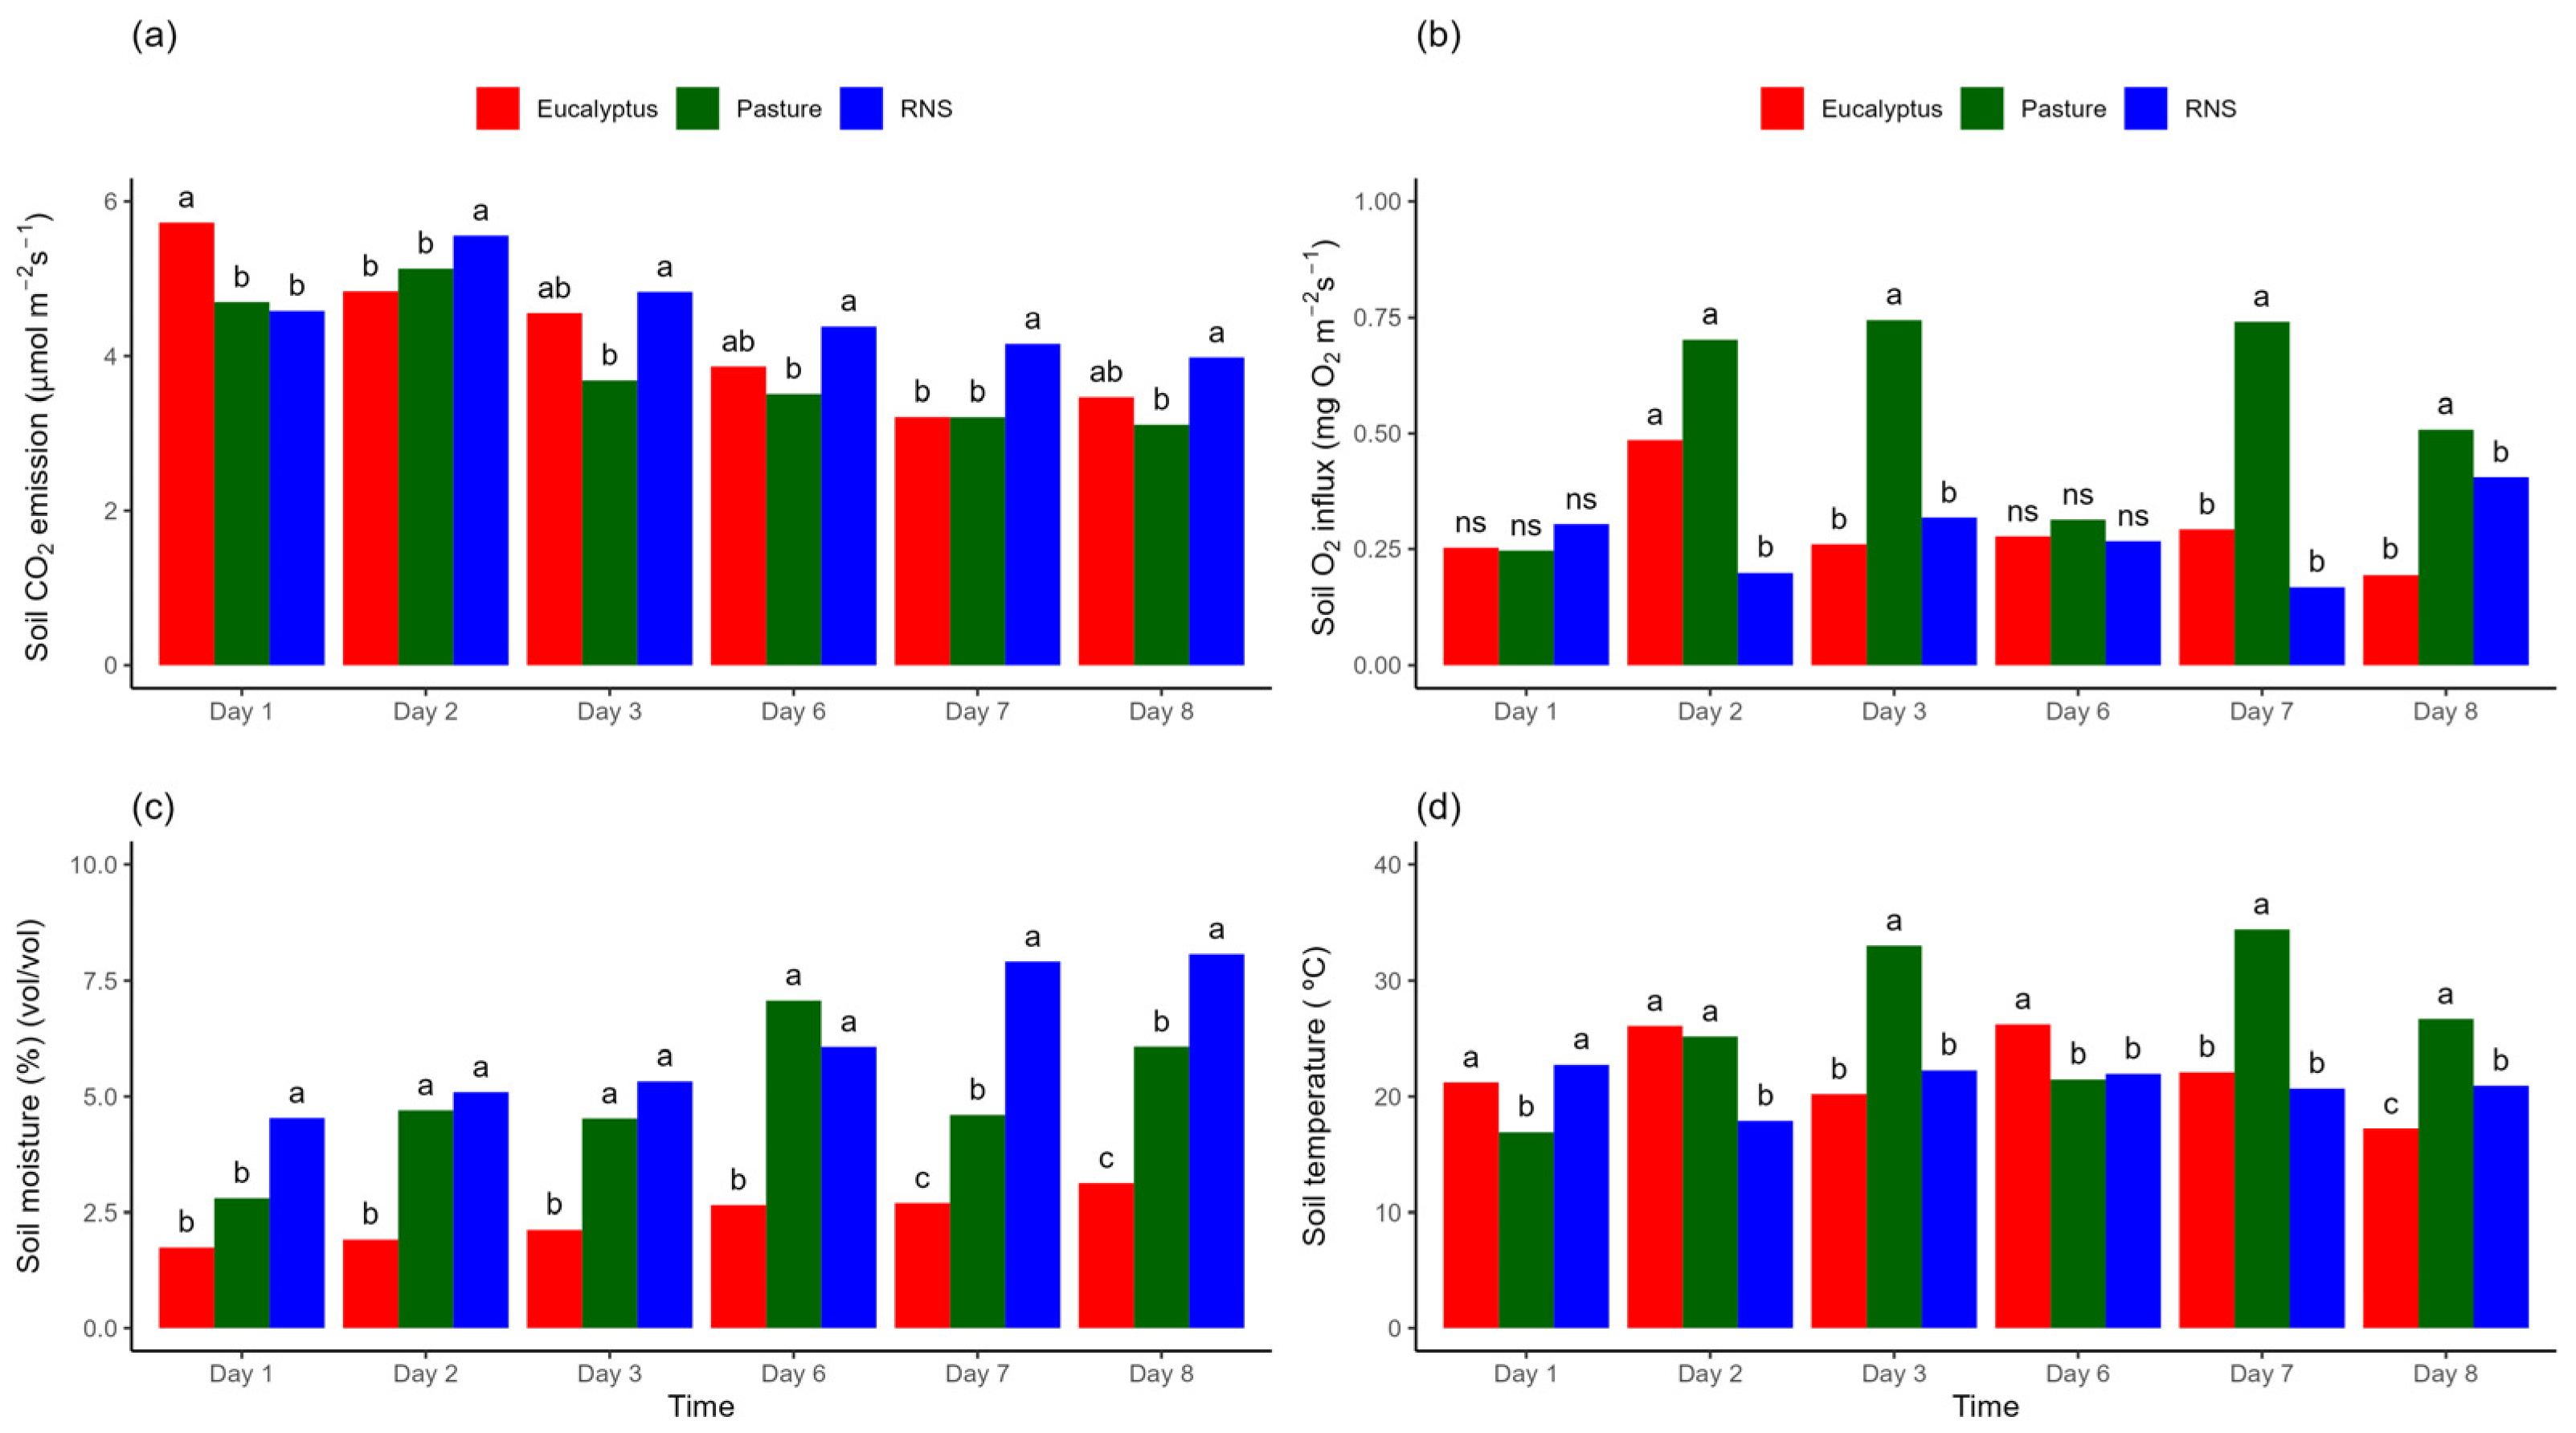
The analysis of variance of repeated measures over time for CO2 emission (FCO2) showed significance (F test = 2.1379; p < 0.0001) for the interaction between types of land use (pasture, eucalyptus and RNS) and time (evaluation days). Therefore, there is short-term temporal variability in CO2 emission rates in the different land uses analyzed (Figure 3a). In relation to the average data, the RNS area presented a higher average CO2 emission (3.95 µmol m−2 s−1) when compared to the pasture area (3.36 µmol m−2 s−1) (Figure 3a). Meanwhile, CO2 emissions in the eucalyptus area (3.69 µmol m−2 s−1) did not differ statistically from the pasture and RNS areas for Tukey’s test (p > 0.05).
On the first day of evaluation, the eucalyptus area was the one that emitted the most CO2 from the soil (5.02 µmol m−2 s−1), followed by CO2 emissions from pastures (4.13 µmol m−2 s- 1) and RNS (4.05 µmol m−2 s−1). These last two did not differ from each other, but showed differences when compared with the eucalyptus emission on the first day for Tukey’s test (p < 0.05) (Figure 4a). As for the second day of evaluation, the RNS area had higher CO2 emissions, which were significant when compared to the other land uses (4.98 µmol m−2 s−1) (p < 0.05) and increased by approximately 23 % when compared with the first day in this area. However, there were no significant differences in CO2 emissions between pasture (4.43 µmol m−2 s−1) and eucalyptus (4.28 µmol m−2 s−1) on the second day (p > 0.05) (Figure 4a).
Over time, the RNS land use case’s CO2 emissions decreased, but they remained higher and significant when compared to pasture for Tukey’s test (p < 0.05). However, on the third, sixth and eighth day, the emission from the eucalyptus area did not differ statistically when comparing the pasture and RNS areas. In contrast, on the seventh day of evaluation, emission from the eucalyptus area was statistically similar to the pasture and differed statistically from the RNS area (p < 0.05).
The soil oxygen influx (iO2) showed short-term temporal variability (F test = 6.8724; p < 0.001) (Figure 3b and Figure 4b) for the repeated measures model over time, considering the interaction between areas (different land uses) and assessment days (time factor). In relation to the influx of O2 in the areas, pasture had the highest influx of O2 and differed statistically from the RNS and eucalyptus areas (p < 0.05), whereas between eucalyptus and RNS, no significant differences were observed in Tukey’s test (p > 0.05) (Figure 3b).
On the first and sixth day of the evaluations, no statistical differences were recorded in soil oxygen influx rates between the studied areas (p < 0.05) (Figure 4b). On the second day, the influx of O2 from the soil in the pasture (0.7 mg O2 m−2 s−1) and eucalyptus (0.5 mg O2 m−2 s−1) areas did not differ from each other, but showed significant differences when compared to the RNS area (0.2 mg O2 m−2 s−1). On the third, seventh and eighth days, the influx of O2 into the pasture (0.7, 0.7 and 0.5 mg O2 m−2 s−1, respectively) was higher when compared to the RNS and eucalyptus areas on the aforementioned days (Figure 4b).
The analysis of variance for repeated measures over time indicated significant differences in the interaction of the study areas on the days evaluated for soil moisture (SM); therefore, there is short-term temporal variability for this variable (F test = 1.913; p < 0.05). In relation to the average soil moisture values (Figure 3c), the areas in this study present different soil moisture conditions and are significant in themselves for Tukey’s test at 5% probability. The RNS area had the highest average soil moisture with 6.2% (v/v), followed by the pasture area with 4.5% (v/v), and eucalyptus was the area that recorded the lowest soil moisture, with only 2.4% (v/v) (Figure 3c).
On the first day, the highest soil moisture content was recorded in the RNS area, which differed from the eucalyptus and pasture areas. On the second, third and sixth day, soil moisture in the pasture remained statistically similar to the RNS area and both differed from the eucalyptus area (Figure 4c). During all the days evaluated, the area with eucalyptus recorded the lowest soil moisture levels.
On the seventh and eighth day, the soil moisture content in the areas showed statistical differences (p < 0.05). RNS registered 7.9 and 8.1% (v/v), respectively. In contrast, pasture recorded 4.6 and 6.1% (v/v), respectively. On the other hand, the lowest soil moisture for days seven and eight occurred in eucalyptus, which presented the following values: 2.7 and 3.1% (v/v), respectively (Figure 4c).
Soil temperature data (ST) were also subjected to analysis of variance with a model of repeated measures over time. The results indicate the existence of temporal variability (F test = 44.976; p < 0.001). In Figure 3d, comparisons are presented for the unfolding of this interaction over time: between land uses and average values per area, all comparisons are for Tukey’s test at 5% probability.
The pasture area had the highest average temperature (26.5 °C) when compared to the other areas (p < 0.05). The eucalyptus and RNS areas are statistically similar to each other (p > 0.05), respectively, 22.0 and 21.1 °C. On the first day, RNS and eucalyptus showed similar averages, respectively, 22.8 and 21.2 °C (p > 0.05), in terms of soil temperature and differed from pasture (16.9 °C) (p < 0.05) (Figure 3d).
On the second day, eucalyptus and pasture recorded the highest soil temperatures (26.1 and 25.1 °C, respectively). These did not differ from each other, but were different from the ST in RNS (17.9 °C) (Figure 4d). On the third and seventh day, the pasture had the highest soil temperatures (33.0 and 34.4 °C, respectively), and showed significant differences from RNS and eucalyptus. However, on the sixth day, a higher soil temperature was observed in the eucalyptus soil (26.2 °C), statistically differing from the RNS soil (22.0 °C) and the pasture soil (21.5 °C). On the last day of reading (day 8), soil temperatures differed between the areas studied, where they were, in descending order, pasture (26.7 °C), RNS (20.9 °C) and eucalyptus (17.2 °C) (p < 0.05) (Figure 4d).

3.2. Soil Attributes in the Agroecosystems

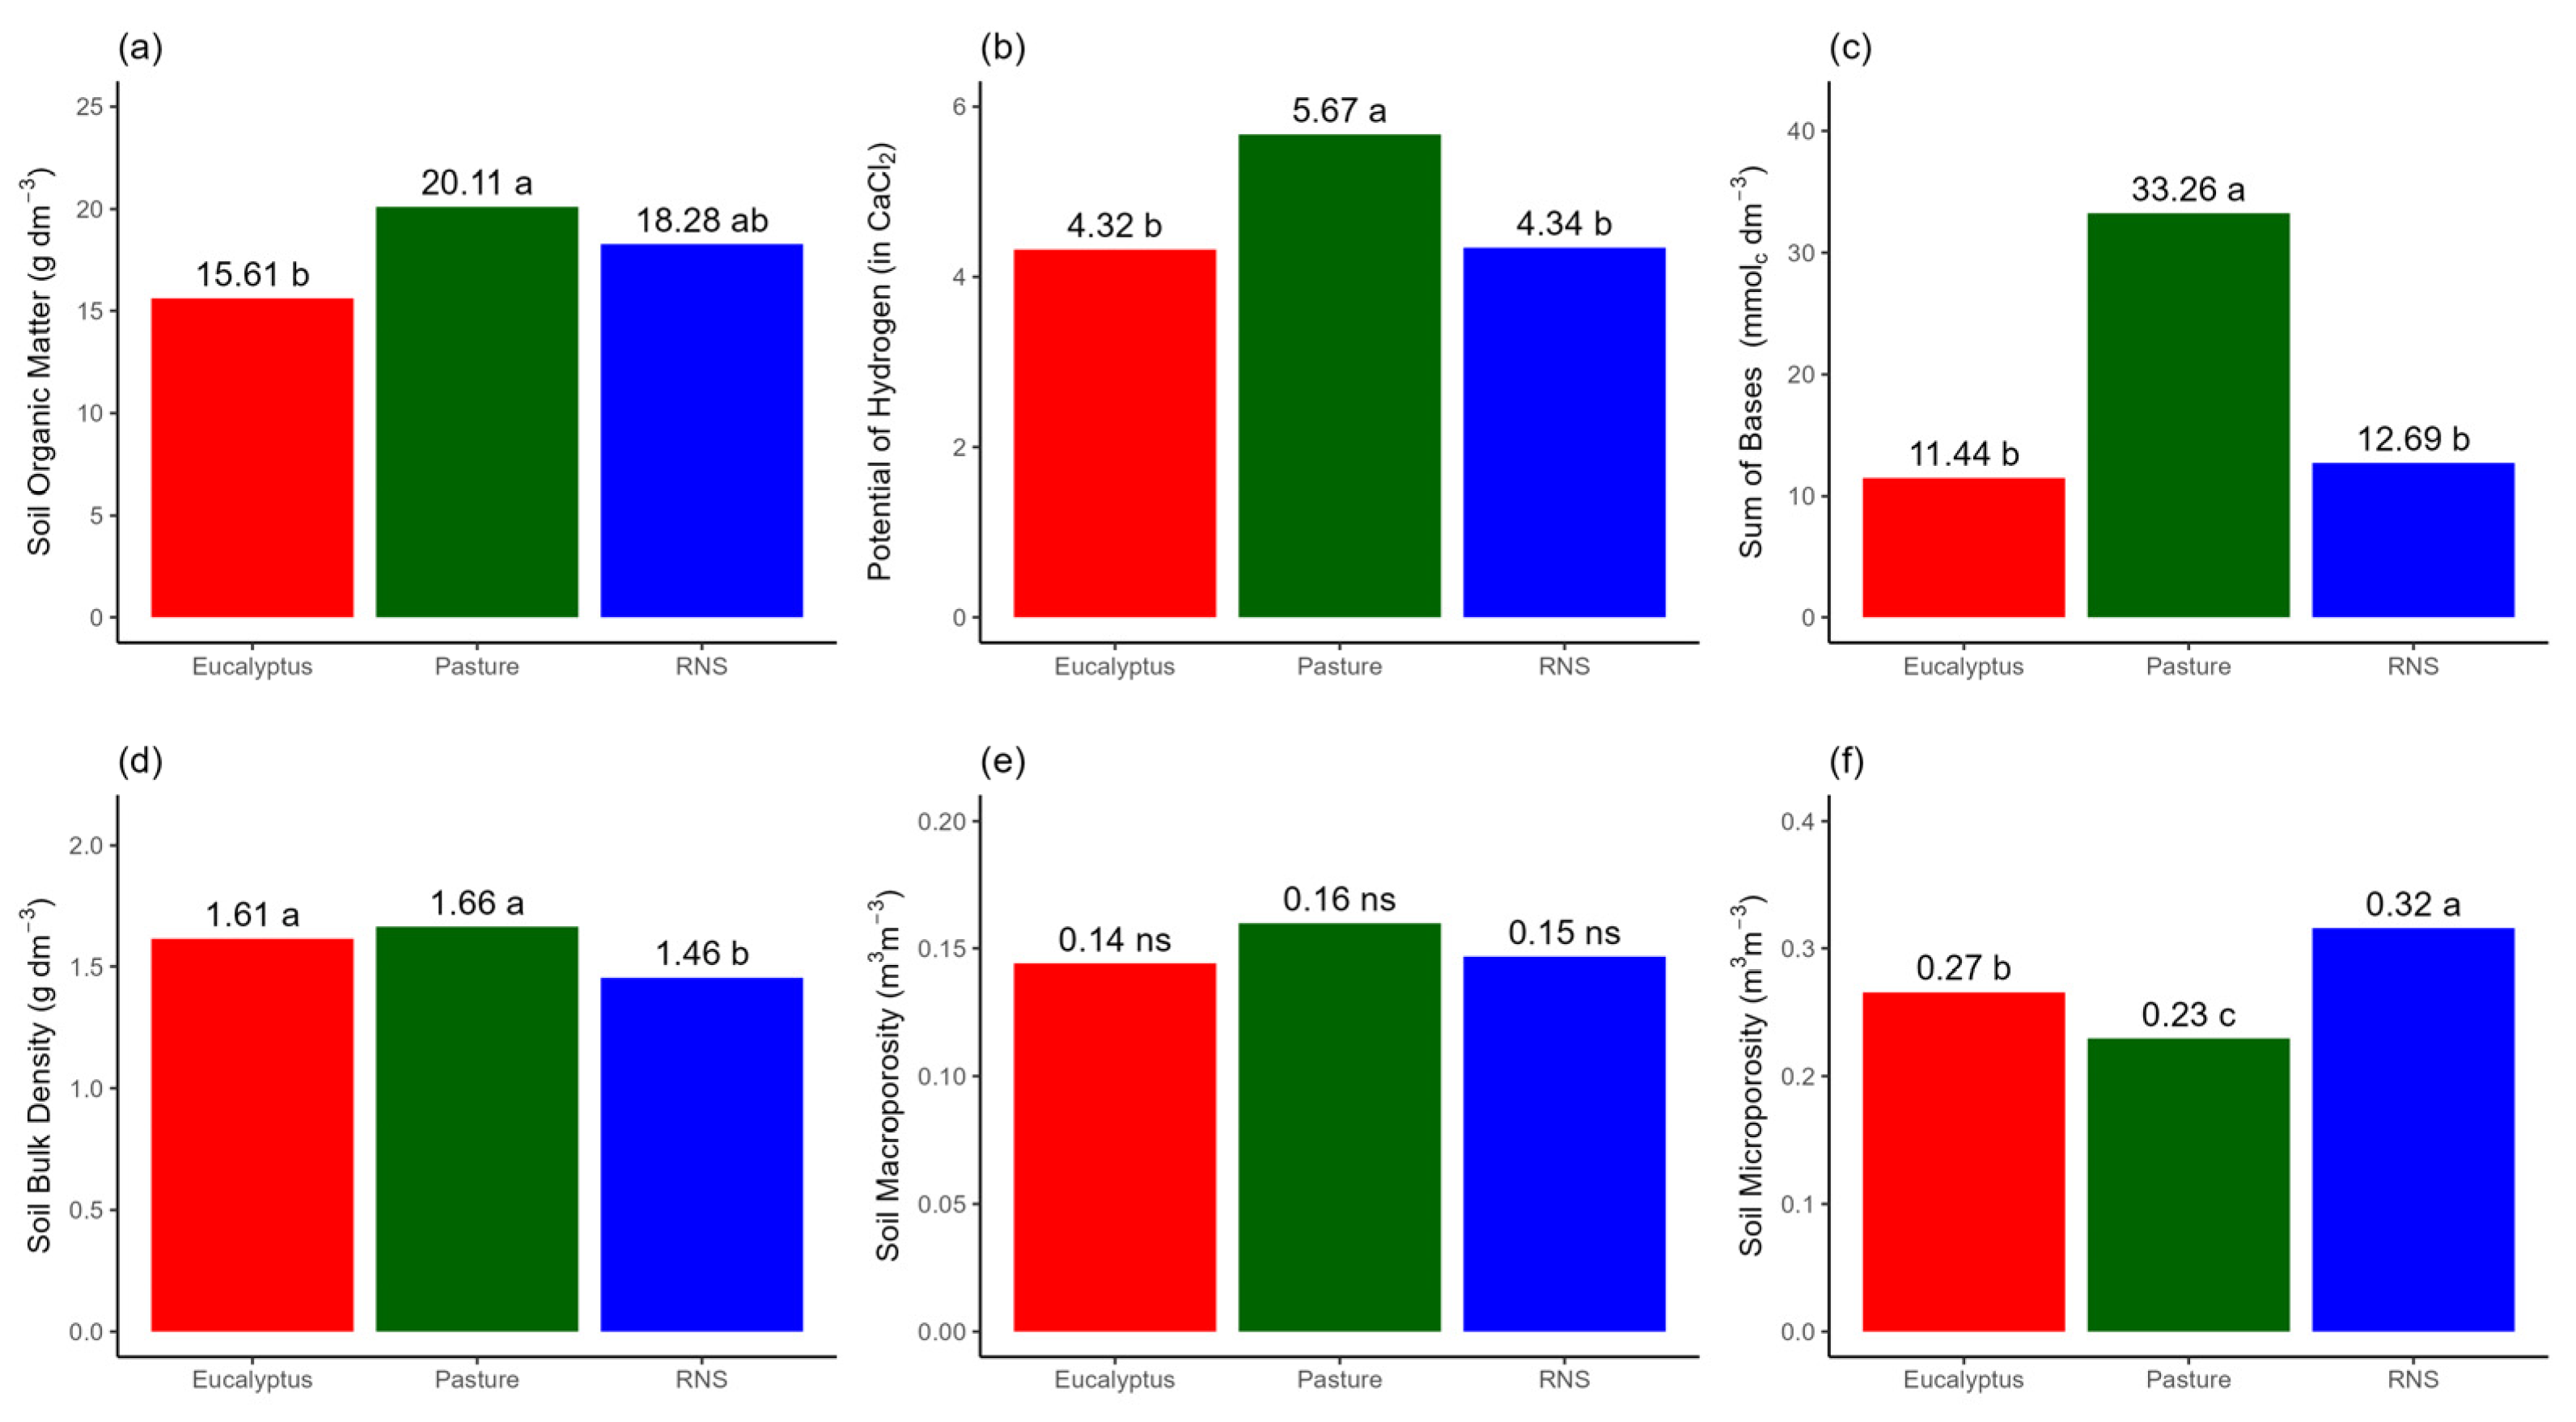
The pasture presented a higher content and significance of soil organic matter (SOM) for the 0.0 to 0.4 m layer (20.11 g dm−3) when comparing with the eucalyptus area (15.61 g dm−3) (p < 0.05). The RNS (18.28 g dm−3) maintained an intermediate behavior and did not differ from the other areas (Figure 5a). The pasture also presented the highest hydrogen potential (pH) (5.67) and differed statistically from the areas of RNS (4.34) and eucalyptus (4.32) (p < 0.05), and the areas of RNS and eucalyptus did not differ from each other (p > 0.05) (Figure 5b). The pasture area also recorded higher and significant levels of base sum (SB) (33.26 mmolc dm−3) and differed from the areas of RNS (12.69 mmolc dm−3) and eucalyptus (11. 44 mmolc dm−3) (p < 0.05), but no difference was observed between RNS and eucalyptus for SB (p > 0.05) (Figure 5c).
Pasture (1.66 g cm−3) and eucalyptus (1.61 g cm−3) presented the highest and most significant values of soil bulk density (BD) and differed from the RNS area, which presented the lowest soil bulk density content (1.46 g cm−3) (p < 0.05) (Figure 5d). Soil macroporosity (Macro) did not differ statistically between the studied areas (p > 0.05) (Figure 5e). On the other hand, soil microporosity (Micro) differed for each of the studied areas (Figure 5f). The highest microporosity was observed in the RNS area (0.32 m3 m−3), while the pasture recorded the lowest microporosity (0.23 m3 m−3). These areas differed from each other and also differed from the microporosity of the soil under the eucalyptus (0.27 m3 m−3) (p < 0.05).

3.3. Principal Component Analysis for Different Land Uses

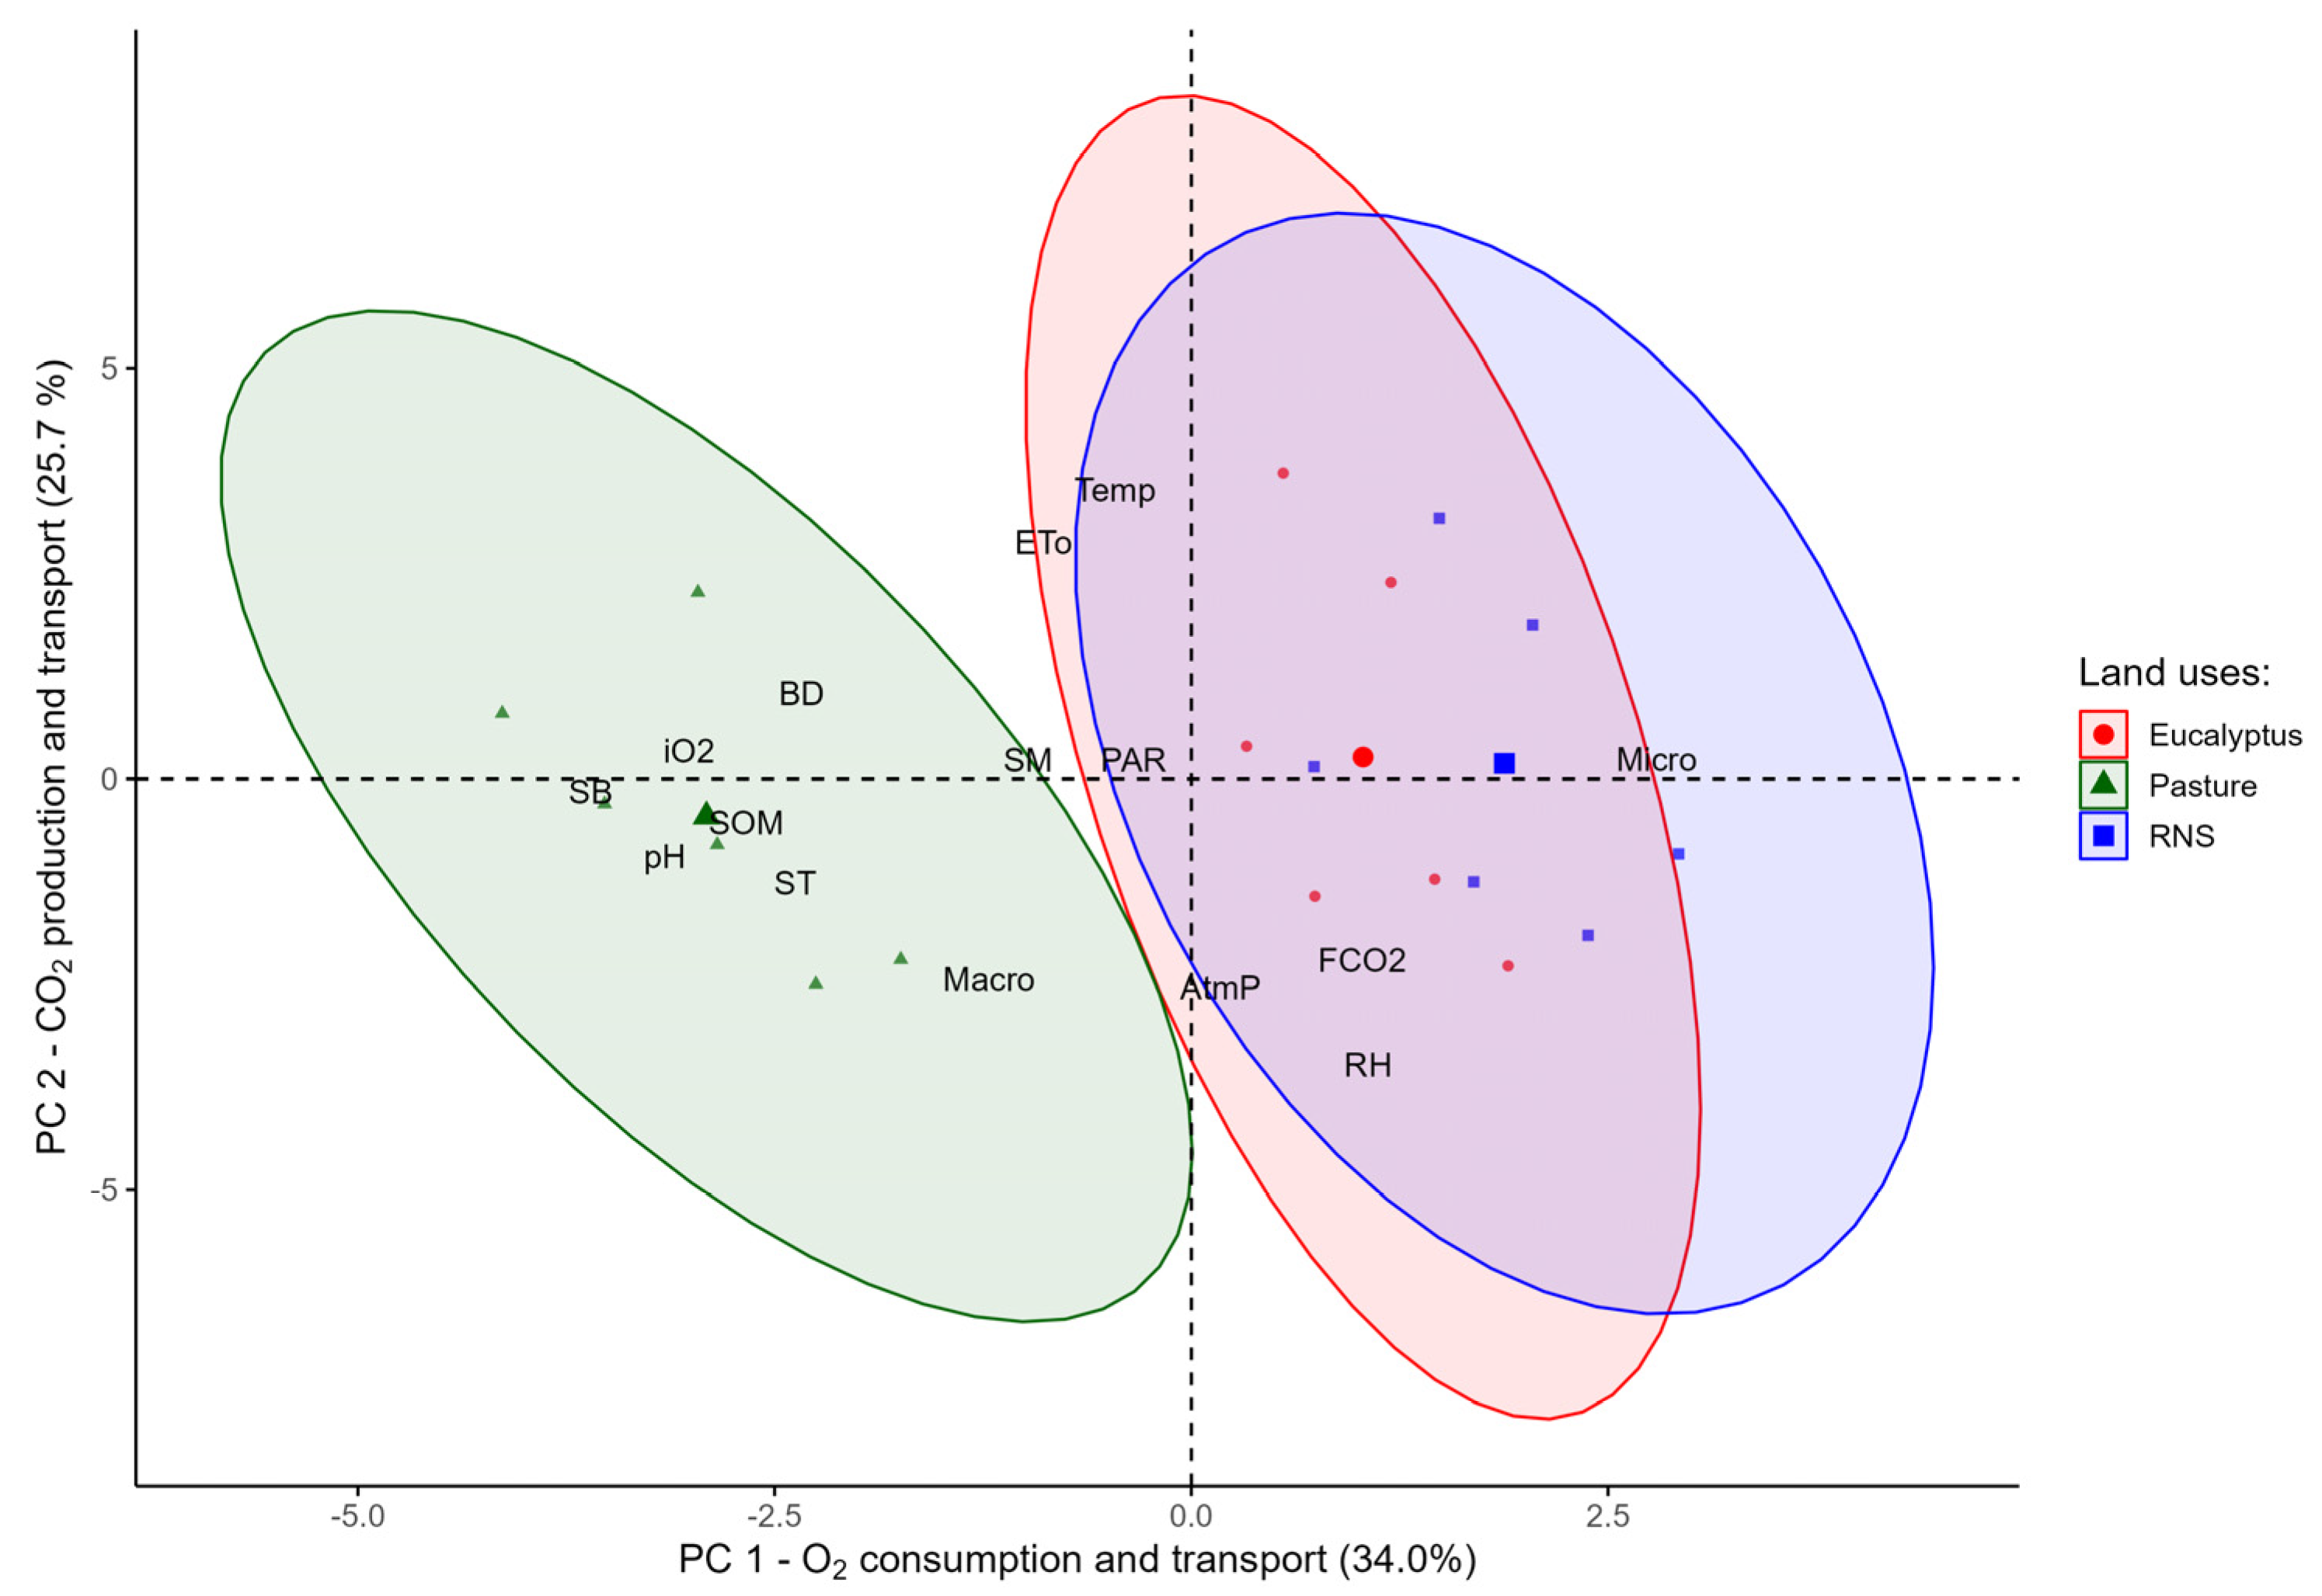
Using a biplot graph (Figure 6), it is possible to identify the grouping formed by the different land uses. A group formed by RNS can be observed together with eucalyptus, driven by the emission of CO2 from the soil. It is possible to highlight an FCO2 association in these areas with RH; however, Temp and PAR also contribute to the formation of this group (Figure 6). On the other hand, microporosity is more associated with the RNS area; however, this behavior can already be observed in Figure 5f, while eucalyptus was associated with ETo and AtmP.
The pasture presents a group distinct from the group formed by RNS and eucalyptus. Pasture was associated with the influx of O2 from the soil and was grouped with SOM, pH, SB, ST, DS, Macro and SM. This last variable, although grouped with pasture, is what puts pressure on RNS; however, the grouping of RNS with pasture was not evident. Pasture was not grouped with eucalyptus, although climatic variables, such as atmospheric pressure and photosynthetically active radiation, push for this direction.
In Table 1, the eigenvalues of each variable are presented. Principal components 1 and 2 are those with the largest eigenvectors, thus offering greater explanatory power; therefore, they are targets of our evaluations. PC1 and PC2, together, explain 59.7% of the variance found in the data.
In PC1, with an explanation of 34.0%, soil O2 influx (−0.78), soil temperature (−0.72), soil organic matter (−0.73), pH (−0.93), the sum of bases (−0.95), soil bulk density (−0.71) and microporosity (0.83) are as noted above, and the latter is a variable strongly associated with RNS. The variables with the greatest discriminating power in PC1 indicate that this component is an index associated with transport phenomena, that is, the O2 dynamics in the soil.
The amount of total variation retained in PC2 is 25.7%, and it is possible to verify the formation of the group of factors that drive the production and transport of CO2 in the soil by highlighting the emission of CO2 (−0,53) as directly associated with relative humidity (−0.88), atmospheric pressure (−0.79) and macroporosity (−0.59) and hampered by average air temperature (0.90) and evapotranspiration (0.89).

4. Discussion

4.1. Temporal Variability of FCO2, iO2, SM and ST

Several authors have reported high rates of CO2 emissions in areas with native species when compared to pasture areas or areas with integrated systems of crops, livestock and forests in tropical and subtropical areas [29,61,62,63,64]. Thus, the higher average CO2 emission observed in the RNS area may be a reflection of native vegetation and its interactions with high biodiversity and biological activity [35,42,65]. This dynamic occurs due to the greater entry of carbon into the soil surface, which promotes a diversity of microorganisms that act in the decomposition of organic material [29,66,67].
This observation is reported due to the decrease in biodiversity associated with the cultivation of a single species [65,68]. However, soil CO2 emissions, which are higher in eucalyptus, as seen on the first day (Figure 4a), can be explained because, unlike pasture, in eucalyptus, there is an accumulation of litter, and the degradation of this material on the soil surface can intensify CO2 emissions from the soil for this use [29,69].
Over time, it is possible that the soil fauna was favored by the microclimate conditions in the RNS, which contributed to lower soils temperatures [70,71], in addition to increased soil moisture (Figure 4c). This behavior of CO2 transport from the soil to the atmosphere over time is explained by its dependence on soil moisture and temperature conditions [9,10,72]. Therefore, this observed phenomenon reinforces the idea suggested by [69,73] that environmental restrictions can alter the biological response to CO2 emissions. Given that these organisms depend on favorable conditions and are very sensitive to fluctuations in soil moisture and temperature, environmental restrictions justify a reduction in CO2 emissions, with a trend in the RNS areas in the long term.
This study advances the explanation of the influx of O2 into the soil (iO2) when comparing pasture areas with reforested areas. However, refs. [14,74], when analyzing the influx of O2 from the soil in reforested areas in the Cerrado, found no differences between them, and similar behavior was observed in this study when comparing RNS and eucalyptus. This effect may be linked to the assumption by [75] that there is an adequate supply of O2 in the soil, as well as water and nutrients that ensure bio-physiological processes in forest metabolism. This assumption is reinforced by the fact that forest species have a respiratory system with similar demands, but this demand is compensated in the form of heterotrophic respiration by decomposers (aerobic respiration) of litter and soil organic matter [68,76].
Based on the advances obtained in this study and considering the contributions of [14,29], who carried out studies in similar locations, and based on the idea of [75], we can suggest that there is a range of adequate supply of O2 in the soil. This maintains a stable growth range, not being highly demanding of water, nutrients or oxygen from the soil as it develops mechanisms for recycling soil organic matter and a strong interrelationship with soil microbiota [42,77].
However, in the pastures, there was a high consumption of O2 over time, which shows that there is a greater increase in oxygen in the soil in these soils. Ref. [11] also found greater capture of O2 in soils vegetated with grass (Paspalum notatum) when compared to bare soils or soils covered with straw. This observation was verified due to the need to increase root respiration linked to vegetative growth, increasing the respiratory demands of the roots. This greater development of the roots also serves to alleviate the effect of stress in the drier period [78].
Pastures constitute a set of plants that are adapted to intense solar radiation with an increase in the efficiency of respiration for root and aerial growth, as there is a more efficient metabolism in incorporating carbon into biomass (dry matter) [19]. Because of this metabolism, plants of the genus Urochloa (brachiaria) are more adapted to tropical soil and climate conditions [79] and thus require a high demand for oxygen for root respiration, which justifies a greater influx of O2 into pastures when compared to other areas [23,80].
It is worth highlighting that the pasture and eucalyptus areas are in the same toposequence (Figure 1), but the soil moisture was different between them, with SM being higher in the pasture, which may be a reflection of the high water demand of eucalyptus when compared to pastures. This occurs because eucalyptus is a fast-growing species, and thus, it has a greater demand for water to maintain its high levels of wood [13,69].
In this sense, it is necessary to put aside the idea that eucalyptus dries out soils because the water demand of eucalyptus is greater when compared to pasture, which justifies the lower soil humidity found in areas with eucalyptus when compared to pastures [81,82], especially when pastures are adapted to tropical conditions [79]. In relation to the RNS area, it has a lower toposequence located close to the right bank of the Paraná River, which may favor greater soil humidity [83].
The temporal variability of soil temperature is associated with climatic conditions [5,48,84]. The higher soil temperature in the pasture area demonstrates the more direct influence of the environment on pastures [19,73]. However, the species U. decumbens has a high tolerance to soil temperature as it is considered a perennial summer forage, being more adapted to tropical regions, has high resistance to drought and offers high protection to the soil [79].
The effects of solar radiation on bare soil can further increase soil temperature, as reported by [11,48]. Thus, the Tsolo values in forest areas, such as RNS and eucalyptus, are similar to those observed in this study (Figure 3d). This behavior was also observed in studies by [5,14,74,84], which demonstrates the importance of the canopy of forest species, which acts in the interception of solar radiation, the importance of helping to close the canopy, which acts to reduce the temperature of the air and soil below the canopy, that is, conditioning a microclimate that regulates the environment [70,81], and the importance of the accumulation of litter, which provides a cover that acts to maintain soil temperature and humidity in forests [13,70].

4.2. Effect of Different Agroecosystems on Soil Attributes

The pasture area had the highest and most significant SOM content (20.11 g dm−3) (Figure 5a), which suggests a more managed pasture area [21]. A study carried out by Embrapa Agrobiologia in the Cerrado region shows that the decrease in SOM content in tropical soils with pastures may be linked to the process of pasture degradation [85]. Thus, given the important role that SOM plays in tropical soils, higher levels are normally associated with a greater agricultural potential of the soil [77,86].
The RNS area can be considered a reference area for SOM and soil nutrient levels. Even though it is an open system [24,87], the dynamics within the agroecosystem that simulates a forest act for permanent recycling of nutrients, leaving SOM levels higher due to associated biodiversity and less invasive management [16,88]. However, there is a contradiction regarding reforested environments with a single species that can reduce the associated biodiversity [31], thus reducing the set of mechanisms that maintain the dynamic balance of nutrient cycling [77,89], and this may justify the lower SOM content observed in the eucalyptus area (15.61 g dm−3).
Although the pasture had a higher pH value (5.67), this could be an effect of the soil management used, namely the liming technique, which explains this condition. In contrast, land uses with RNS and eucalyptus presented lower pH values, but even so, these values were within the expected range (ranging from 4.0 to 5.5) for Oxisols in the Brazilian Cerrado [90]. It can be observed that SB was favored by fertilization management in the pasture, being higher when compared to the RNS and eucalyptus areas (Figure 5c). This happens because, during the expansion of agricultural activity in the Brazilian Cerrado, there was also the incorporation of soils with low natural fertility [91].
Soil macro- and microporosity are frequently used in studies on gas dynamics in the soil as these factors can influence soil structure, an important property for gas dynamics [92], and thus are associated with soil aeration capacity [89,93]. The different soil microporosity between areas (Figure 5f) was higher in the RNS area (0.32 m−3 m3), while the lower microporosity in the pasture may be a reflection of the high soil bulk density (1.66 g cm−3) recorded in this area (Figure 5d). However, pastures are often associated with high soil densities due to animal trampling conditions in these agroecosystems [19,79].
Although there were no differences between the macroporosity values for the studied areas (Figure 5e), the results demonstrate that these values are above the critical limit (0.10 m−3 m3) established by [94]. Macroporosity values below the critical limit can result in poor drainage, low aeration capacity, increased resistance to root penetration into the soil, which results in environmental degradation [89,93], and consequently, a limited metabolism of the soil.

4.3. Analysis of Principal Components and Clusters

The grouping between reforestation with native species and reforestation with eucalyptus was also observed by [14,63] in reforested areas in the Brazilian Cerrado. In our analyses, it was found that pasture was associated with soil fertility attributes, such as the sum of bases, pH and organic matter (Figure 6). This behavior was observed by [62,95] when highlighting the grouping of pasture, in general, with factors related to soil management. Since soil fertility is directly influenced by fertilizer management, this results in a rapid response of the pasture to increase productive capacity driven by root activation [86,96].
Thus, in managed pasture, soil fertility plays an important role in microbial decomposition, which can result in a regulatory factor in soil biological activity [97,98]. Thus, it is possible to state that our results demonstrate that this biological activity in the soil requires oxygen and is directly influenced by the organic matter content, pH, soil moisture and temperature, in addition to the conditions favored by the availability of nutrients (sum of bases) and soil bulk density (Figure 6) [88,99]. This statement is supported by [62] in a study conducted on pastures in the Brazilian Cerrado.
Additionally, forests are often associated with carbon storage via photosynthesis [100]. As these systems consolidate over time in nature, the rate of carbon dioxide capture via photosynthesis may not compensate for the metabolic rate of soil respiration, including root respiration [101]. In pastures, due to the need for plant revitalization, photosynthesis is always maintained in the active range, which contributes to greater carbon dioxide fixation in plant biomass [95,102].
Although the present study successfully captured short-term temporal patterns of soil CO2 emission and O2 influx, it has several limitations. First, the monitoring period was limited to eight days, preventing assessment of seasonal and interannual variability. Second, microtopographic variation and small-scale heterogeneity in soil properties may have influenced gas fluxes and were not fully accounted for. Third, although 18 sampling points per land use type allowed detection of short-term trends, they may not represent the entire landscape variability [22].
Future studies should include longer-term monitoring across dry and wet seasons, incorporate finer-scale spatial sampling to capture microtopographic effects, and investigate the relative contributions of root and microbial respiration to soil gas fluxes. Addressing these points will improve the understanding of soil–plant–atmosphere interactions and enhance the predictive capacity of short-term measurements for tropical agroecosystem management.

5. Conclusions

Land use significantly influences the short-term temporal variability of soil respiration, affecting both CO2 emission and soil O2 influx dynamics. Among the evaluated systems, pastures exhibited the lowest soil CO2 emission rates, which were associated with improvements in the soil’s physical and chemical attributes resulting from proper management practices when compared to the other land uses.
The soil O2 influx showed greater sensitivity to soil temperature fluctuations in the pasture areas. In contrast, the tropical forest and eucalyptus systems, where the canopy microclimate maintains more stable thermal conditions, exhibited no significant variation in O2 influx.
Understanding these soil–plant–atmosphere interactions is essential for developing sustainable management strategies for tropical agroecosystems. These findings reinforce that restoring degraded pastures through managed grazing systems can substantially reduce soil CO2 emissions while improving soil quality.
At the policy level, these results support the formulation of climate adaptation measures aligned with Sustainable Development Goal 13 (Climate Action). In addition to conserving native Cerrado forests, large-scale recovery of degraded pastures into well-managed systems combined with the elimination of deforestation and burning represents a key strategy for enhancing carbon sequestration in soils and contributing to the decarbonization of the atmosphere in Brazil.

Supplementary Materials

The following supporting information can be downloaded at: https://www.mdpi.com/article/10.3390/app152212302/s1, Figure S1. Equipment in: (a) portable soil CO2 analysis system - model Li-8100, (b) oxygen smart sensor with camera attached to the laptop, (c) portable soil moisture sensor model HydroSenseII.

Author Contributions

Conceptualization, N.L.S.J., W.B.D.L. and K.F.F.C.; methodology, W.B.D.L., K.F.F.C., M.E.V., R.P.D.L. and D.F.Z.; software, W.B.D.L.; validation, W.B.D.L., K.F.F.C., M.E.V., R.P.D.L. and D.F.Z.; formal analysis, W.B.D.L., K.F.F.C., M.E.V. and R.P.D.L.; investigation, W.B.D.L., K.F.F.C. and M.E.V.; resources, W.B.D.L.; data curation, W.B.D.L. and M.E.V.; writing—original draft preparation, W.B.D.L.; writing—review and editing, N.L.S.J., A.R.P., M.R.C., C.E.P.C., M.L.T.D.M. and W.B.D.L.; visualization, W.B.D.L.; supervision, N.L.S.J., A.R.P., M.R.C., C.E.P.C. and M.L.T.D.M.; project administration, N.L.S.J., M.R.C. and C.E.P.C.; funding acquisition, N.L.S.J., M.R.C., and C.E.P.C. All authors have read and agreed to the published version of the manuscript.

Funding

We gratefully acknowledge support of the RCGI – Research Centre for Greenhouse Gas Innovation, hosted by the University of São Paulo (USP) and sponsored by FAPESP – São Paulo Research Foundation (2014/50279-4 and 2020/15230-5) and Shell Brazil, and the strategic importance of the support given by ANP (Brazil’s National Oil, Natural Gas and Biofuels Agency) through the R&D levy regulation. We thank the Center for Carbon Research in Tropical Agriculture (CCARBON) (FAPESP grant number 2021/10573–4). We also thank the Coordination for the Improvement of Higher Education Personnel – CAPES, Brazil (Finance code 0001).

Data Availability Statement

The data that support the findings of this study are available from the corresponding author (De Lucena, W.B.) upon reasonable request.

Conflicts of Interest

The authors declare no conflict of interest.

References

  1. Intergovernmental Panel on Climate Change—IPCC. Synthesis Report; Sixth Assessment Report; Cambridge University Press: Cambridge, UK; New York, NY, USA, 2023; 85p. [Google Scholar]
  2. Moss, R.; Edmonds, J.; Hibbard, K.; Manning, M.R.; Rose, S.K.; Van Vuuren, D.P.; Carter, T.R.; Emori, S.; Kainuma, M.; Kram, T. The next generation of scenarios for climate change research and assessment. Nature 2010, 463, 747–756. [Google Scholar] [CrossRef] [PubMed]
  3. Richardson, K.; Steffen, W.; Lucht, W.; Bendtsen, J.; Cornell, S.E.; Donges, J.F.; Drüke, M.; Fetzer, I.; Bala, G.; von Bloh, W.; et al. Earth beyond six of nine planetary boundaries. Sci. Adv. 2023, 9, eadh2458. [Google Scholar] [CrossRef] [PubMed]
  4. Cerri, C.E.P.; Abbruzzini, T.F.; Carvalho, J.L.N.; Cherubin, M.R.; Frazão, L.A.; Maia, S.M.F.; Oliveira, D.M.S. Matéria orgânica do solo e o equilíbrio global de carbono. In Entendendo a Matéria Orgânica do Solo em Ambientes Tropical e Subtropical; Bettiol, W., Silva, C.A., Cerri, C.E.P., Martin-Neto, L., Andrade, C.A., Orgs.; Embrapa: Brasília, Brazil, 2023; pp. 211–254. [Google Scholar]
  5. Canteral, K.F.F.; Vicentini, M.E.; De Lucena, W.B.; Moraes, M.L.T.; Montanari, R.; Ferraudo, A.S.; Peruzzi, N.J.; La Scala, N., Jr.; Panosso, A.R. Machine learning for prediction of soil CO2 emission in tropical forests in the Brazilian Cerrado. Environ. Sci. Pollut. Res. 2023, 30, 61052–61071. [Google Scholar] [CrossRef]
  6. SEEG—Sistema de Estimativas de Emissões de Gases de Efeito Estufa. 2022. Available online: https://plataforma.seeg.eco.br/total_emission (accessed on 16 September 2023).
  7. Luo, Y.; Zhou, X. Soil Respiration and the Environment; Academic Press: San Diego, CA, USA, 2006; 316p. [Google Scholar]
  8. Moitinho, M.R.; Padovan, M.P.; Panosso, A.R.; La Scala, N., Jr. Efeito do preparo do solo e resíduo da colheita de cana-de-açúcar sobre a emissão de CO2. Rev. Bras. De Cienc. Do Solo 2013, 37, 1720–1728. [Google Scholar] [CrossRef]
  9. Lal, R. Challenges and opportunities in soil organic matter research. Eur. J. Soil Sci. 2009, 60, 158–169. [Google Scholar] [CrossRef]
  10. Lal, R. Reducing carbon footprints of agriculture and food systems. Carbon Footpr. 2022, 1, 3. [Google Scholar] [CrossRef]
  11. De Lucena, W.B.; Vicentini, M.E.; Santos, G.A.A.D.; Silva, B.O.; Costa, D.V.M.; Canteral, K.F.F.; Neira Román, J.A.; Rolim, G.S.; Panosso, A.R.; La Scala, N., Jr. Temporal variability of the CO2 emission and the O2 influx in a tropical soil in contrasting coverage conditions. J. South Am. Earth Sci. 2023, 121, 104120. [Google Scholar] [CrossRef]
  12. Almeida, R.F.; Teixeira, D.B.; Montanari, R.; Bolonhezi, A.C.; Teixeira, E.B.; Moitinho, M.R.; Panosso, A.R.; Spokas, K.A.; La Scala, N., Jr. Ratio of CO2 and O2 as index for categorising soil biological activity in sugarcane areas under contrasting straw management regimes. Soil Res. 2018, 56, 373–381. [Google Scholar] [CrossRef]
  13. Almeida, R.F.; Spokas, K.A.; Teixeira, D.B.; La Scala, N., Jr. Biochar insights from laboratory incubations monitoring O2 consumption and CO2 production. Biochar 2019, 1, 249–258. [Google Scholar] [CrossRef]
  14. Vicentini, M.E.; Pinotti, C.R.; Hirai, W.Y.; de Moraes, M.L.T.; Montanari, R.; Teixeira Filho, M.C.M.; Milori, D.M.B.P.; La Scala, N., Jr.; Panosso, A.R. CO2 emission and its relation to soil temperature, moisture, and O2 absorption in the reforested areas of Cerrado biome, Central Brazil. Plant Soil 2019, 444, 193–211. [Google Scholar] [CrossRef]
  15. Jensen, J.L.; Schjønning, P.; Watts, C.W.; Christensen, B.T.; Peltre, C.; Munkholm, L.J. Relating soil C and organic matter fractions to soil structural stability. Geoderma 2019, 337, 834–843. [Google Scholar] [CrossRef]
  16. De Lucena, W.B.; Tavares, M.A.; Carmo, P.H.O.; Perônico, B.W.C.; Santos, J.M.; Ferreira, G.B. Agricultura sustentável e atributos biológicos do solo: Uma breve revisão sobre os indicadores da qualidade agrícola-ambiental. In Ensaios nas Ciências Agrárias e Ambientais, 1st ed.; Oliveira, A.C., Ed.; Ponta Grossa: Atena, Greece, 2018; pp. 45–52. [Google Scholar] [CrossRef]
  17. Lisboa, B.B.; Vargas, L.K.; Silveira, A.O.D.; Martins, A.F.; Selbach, P.A. Indicadores microbianos de qualidade do solo em diferentes sistemas de manejo. Rev. Bras. De Cienc. Do Solo 2012, 36, 33–44. [Google Scholar] [CrossRef]
  18. Dias-Filho, M.B. Degradação de Pastagens: O que é e Como Evitar; Embrapa: Brasília, Brazil, 2017; 19p. [Google Scholar]
  19. Guarda, V.D.A.; Campos, L.J.M. Bases Ecofisiológicas da Assimilação de Carbono e Suas Implicações na Produção de Forragem; Embrapa Pesca e Aquicultura: Palmas, Spain, 2014; 48p. [Google Scholar]
  20. Campos, M.O.; Cerri, C.E.P.; La Scala, N., Jr. Atmospheric CO2, soil carbon stock and control variables in managed and degraded pastures in central Brazil. Remote Sens. Appl. Soc. Environ. 2022, 28, 100848. [Google Scholar] [CrossRef]
  21. Parente, L.; Mesquita, V.V.; Miziara, F.; Baumann, L.R.F.; Ferreira, L. Assessing the pasturelands and livestock dynamics in Brazil, from 1985 to 2017: A novel approach based on high spatial resolution imagery and Google Earth Engine cloud computing. Remote Sens. Environ. 2019, 232, 111301. [Google Scholar] [CrossRef]
  22. Moitinho, M.R.; Ferraudo, A.S.; Panosso, A.R.; Bicalho, E.d.S.; Teixeira, D.D.B.; Barbosa, M.d.A.; Tsai, S.M.; Borges, B.M.F.; Cannavan, F.S.; de Souza, J.A.M.; et al. Effects of burned and unburned sugarcane harvesting systems on soil CO2 emission and soil physical, chemical, and microbiological attributes. Catena 2021, 196, 104903. [Google Scholar] [CrossRef]
  23. Huang, C.-H.; Ouyang, Y.; Zhang, J.-E. Effects of a compact layer on soil O2. Geoderma 2006, 135, 224–232. [Google Scholar] [CrossRef]
  24. Santos, H.G.; Jacomine, P.K.T.; Anjos, L.H.C.; Oliveira, V.A.; Lumbreras, J.F.; Coelho, M.R.; Almeida, J.Á.; Araujo Filho, J.C.; Oliveira, J.B.; Cunha, T.J.F. Sistema Brasileiro de Classificação de Solos, 5th ed; Embrapa: Brasília, Brazil, 2018; 356p. [Google Scholar]
  25. Soil Survey Staff. Soil Taxonomy: A Basic System of Soil Classification for Making and Interpreting Soil Surveys, 12th ed; Natural Resources Conservation Service. U.S. Department of Agriculture Handbook 436; U.S. Department of Agriculture: Washington, DC, USA, 2014. [Google Scholar]
  26. Andrade, G.C. Eucalipto. Embrapa Florestas. 2021. Available online: https://www.embrapa.br/en/agencia-de-informacao-tecnologica/cultivos/eucalipto/pre-producao/aspectos-ambientais/agua#:~:text=Dados%20referentes%20a%20taxas%20de,2%20litros%20de%20%C3%A1gua%2F%C3%A1rvore (accessed on 29 September 2023).
  27. Thornthwaite, C.W. An approach toward a Rational Classification of Climate. Geogr. Rev. 1948, 38, 55–94. Available online: https://www.jstor.org/stable/210739 (accessed on 29 September 2023). [CrossRef]
  28. Rolim, G.S.; Camargo, M.B.P.; Lania, D.G.; Moraes, J.F.L. Classificação climática de Köppen e de Thornthwaite e sua aplicabilidade na determinação de zonas agroclimáticas para o Estado de São Paulo. Bragantia 2007, 66, 711–720. [Google Scholar] [CrossRef]
  29. Ramos, J.C.A. Emissão de CO2, Quantidade e Qualidade do Carbono do Solo em Sistemas Agrícolas na Região do Cerrado do Mato Grosso do Sul. Master’s Thesis, Faculdade de Engenharia (Fies), Universidade Estadual Paulista, Ilha Solteira, São Paulo, Brazil, 2018; 83p. [Google Scholar]
  30. Allen, R.G.; Pereira, L.S.; Raes, D.; Smith, M. Crop Evapotranspiration Guidelines for Computing Crop Water Requirements; FAO-Irrigation and Drainage Paper 56; Food and Agriculture Organization: Rome, Italy, 1998. [Google Scholar]
  31. Lima, E.F.; Silva Filho, J.P.; Araújo, A.F.S. Dicionário dos Termos Usados em Ecologia; EMATER: Parnaíba, Brazil, 2016; 180p. [Google Scholar]
  32. Cavenage, A.; Moraes, M.L.T.; Alves, M.C.; Carvalho, M.A.C.; Freitas, M.L.M.; Buzetti, S. Alterações nas propriedades físicas de um Latossolo Vermelho-Escuro sob diferentes culturas. Rev. Bras. De Cienc. Do Solo 1999, 23, 997–1003. [Google Scholar] [CrossRef]
  33. Souza, Z.M.; Alves, M.C. Propriedades químicas de um latossolo vermelho distrófico de cerrado sob diferentes usos e manejos. Rev. Bras. De Cienc. Do Solo 2003, 27, 133–139. [Google Scholar] [CrossRef]
  34. Wolińska, A.; Stepniewska, Z.; Szafranek-Nakonieczna, A. Effect of selected physical parameters on respiration activities in common Polish mineral soils. Pol. J. Environ. Stud. 2011, 20, 1075–1082. [Google Scholar]
  35. Angert, A.; Yakir, D.; Rodeghiero, M.; Preisler, Y.; Davidson, E.A.; Weiner, T. Using O2 to study the relationships between soil CO2 efflux and soil respiration. Biogeosciences 2015, 12, 2089–2099. [Google Scholar] [CrossRef]
  36. Gastwirth, J.; Gel, Y.; Hui, W.; Lyubchich, V.; Miao, W.; Noguchi, K. lawstat: Tools for Biostatistics, Public Policy and Law. R Package Version 3.4. 2020. Available online: https://CRAN.R-project.org/package=lawstat (accessed on 10 October 2022).
  37. Jassal, R.S.; Black, T.A.; Nesic, Z.; Gaumont-Guay, D. Using automated non-steady-state chamber systems for making continuous long-term measurements of soil CO2 efflux in forest ecosystems. Agric. For. Meteorol. 2012, 161, 57–65. [Google Scholar] [CrossRef]
  38. Raij, B.V.; Andrade, J.C.; Cantarella, H.; Quaggio, J.A. Análise Química Para Avaliação da Fertilidade de Solos Tropicais; Instituto Agronômico: Campinas, Brazil, 2001; 285p. [Google Scholar]
  39. Teixeira, P.C.; Donagemma, G.K.; Fontana, A.; Teixeira, W.G. Manual de Métodos de Análise de Solo, 3rd ed.; Embrapa: Brasília, Brazil, 2017; 574p. [Google Scholar]
  40. Mendiburu, F. agricolae: Statistical Procedures for Agricultural Research. R Package Version 1.3-5. 2021. Available online: https://CRAN.R-project.org/package=agricolae (accessed on 10 October 2022).
  41. Tukey, J.W. Comparing Individual Means in the Analysis of Variance. Biometrics 1949, 5, 99–114. [Google Scholar] [CrossRef] [PubMed]
  42. Littell, R.C.; Henry, P.R.; Ammerman, C.B. Statistical analysis of repeated measures using SAS procedures. J. Anim. Sci. 1998, 76, 1216–1231. [Google Scholar] [CrossRef]
  43. Venables, W.N.; Ripley, B.D. Modern Applied Statistics with S, 4th ed; Springer: New York, NY, USA, 2002. [Google Scholar]
  44. Shapiro, S.S.; Wilk, M.B. An analysis of variance test for normality (complete samples). Biometrika 1965, 52, 591–611. [Google Scholar] [CrossRef]
  45. Bartlett, M.S. Properties of Sufficiency and Statistical Tests. Proc. R. Soc. Lond. Ser. A Math. Phys. Sci. 1937, 160, 268–282. Available online: http://www.jstor.org/stable/96803 (accessed on 9 August 2022).
  46. Cecon, P.A.; Silva, F.F.; Ferreira, A.; Ferrão, R.G.; Carneiro, A.P.S.; Detmann, E.; Faria, P.N.; Morais, T.S.S. Análise de medidas repetidas na avaliação de clones de café Conilon. Pesqui. Agropecu. Bras. 2008, 43, 1171–1176. [Google Scholar] [CrossRef]
  47. Canteri, M.G.; Althaus, R.A.; Virgens Filho, J.S.; Giglioti, E.A.; Cláudia, V.; Godoy, C.V. Sistema para análise e separação de médias em experimentos agrícolas pelos métodos Scott-Knott, Tukey e Duncan. Rev. Bras. De Agrocom-Putação 2001, 1, 18–24. [Google Scholar]
  48. La Scala, N., Jr.; Marques, J.; Pereira, G.; Corá, J. Carbon dioxide emission related to chemical properties of a tropical bare soil. Soil Biol. Biochem. 2000, 32, 1469–1473. [Google Scholar] [CrossRef]
  49. Silva, D.A.P.; Campos, M.C.C.; Mantovanelli, B.C.; Santos, L.A.C.; Soares, M.D.R.; Cunha, J.M. Variabilidade espacial da emissão de CO2, temperatura e umidade do solo em área de pastagem na região Amazônica, Brasil. Rev. De Ciências Agroveterinárias 2019, 18, 119–126. [Google Scholar] [CrossRef]
  50. Schneider, V.M. Análise Multivariada Aplicada no Estudo de Dentifrícios Comercializados no Brasil. Master’s Thesis, Centro de Ciências Naturais e Exatas, Federal University of Santa Maria, Santa Maria, Brazil, 2018; 78p. [Google Scholar]
  51. Kaiser, H.F. The varimax criterion for analytic rotation in factor analysis. Psychometrika 1958, 23, 187–200. [Google Scholar] [CrossRef]
  52. R Core Team. R: A Language and Environment for Statistical Computing; R Foundation for Statistical Computing: Vienna, Austria, 2023; Available online: https://www.R-project.org/ (accessed on 10 October 2022).
  53. Ferreira, E.B.; Cavalcanti, P.P.; Nogueira, D.A. ExpDes.pt: Pacote Experimental Designs (Portuguese). R Package Version 1.2.0. 2018. Available online: https://CRAN.Rproject.org/package=ExpDes.pt (accessed on 10 October 2022).
  54. Kassambara, A.; Mundt, F. factoextra: Extract and Visualize the Results of Multivariate Data Analyses. R Package Version 1.0.7. 2020. Available online: https://CRAN.R-project.org/package=factoextra (accessed on 10 October 2022).
  55. Wickham, H.; Bryan, J. readxl: Read Excel Files. R Package Version 1.4.0. 2022. Available online: https://CRAN.R-project.org/package=readxl (accessed on 10 October 2022).
  56. Wickham, H.; Averick, M.; Bryan, J.; Chang, W.; Mcgowan, L.D.; François, R.; Grolemund, G.; Hayes, A.; Henry, L.; Hester, J.; et al. Welcome to the tidyverse. J. Open Source Softw. 2019, 4, 1686. [Google Scholar] [CrossRef]
  57. Kassambara, A. rstatix: Pipe-Friendly Framework for Basic Statistical Tests. R Package Version 0.7.0. 2021. Available online: https://CRAN.R-project.org/package=rstatix (accessed on 10 October 2022).
  58. Pedersen, T.L. patchwork: The Composer of Plots. R Package Version 1.1.1. 2020. Available online: https://CRAN.R-project.org/package=patchwork (accessed on 10 October 2022).
  59. Gross, J.; Ligges, U. Nortest: Tests for Normality. R Package Version 1.0-4. Available online: https://CRAN.R-project.org/package=nortest (accessed on 10 October 2022).
  60. Wickham, H. ggplot2: Elegant Graphics for Data Analysis, 2nd ed; Springer: New York, NY, USA, 2016. [Google Scholar] [CrossRef]
  61. Chen, S.; Zou, J.; Yao, X.; Wang, J.; Hu, Z.; Lu, Y. A biophysical model to simulate seasonal variations of soil respiration in agroecosystems in China. Agric. For. Meteorol. 2023, 338, 109524. [Google Scholar] [CrossRef]
  62. Nogueira, D.C.S. Variabilidade da Emissão de CO2 e Atributos do solo em Pastagem e Sistema Silvipastoril. Doctoral Thesis, Faculdade de Ciências Agrárias e Veterinárias (FCAV), Universidade Estadual Paulista, Jaboticabal, São Paulo, Brazil, 2021; 164p. [Google Scholar]
  63. Silva, B.O. Emissão de CO2, Estoque e Humificação do Carbono do solo em Áreas Convertidas do Bioma Cerrado, Brasil Central. Ph.D. Thesis, Faculdade de Ciências Agrárias e Veterinárias (FCAV), Universidade Estadual Paulista, Jaboticabal, São Paulo, Brazil, 2021; 89p. [Google Scholar]
  64. Zanchi, F.B.; Waterloo, M.J.; Kruijt, B.; Kesselmeier, J.; Luizão, F.J.; Manzi, A.O.; Dolman, A.J. Soil CO2 efflux in Central Amazonia: Environmental and methodological effects. Acta Amaz. 2012, 42, 173–184. [Google Scholar] [CrossRef]
  65. Chen, X.; Liu, M.; Xu, Z.; Wei, H. Influences of temperature and moisture on abiotic and biotic soil CO2 emission from a subtropical forest. Carbon Balance Manag. 2021, 16, 18. [Google Scholar] [CrossRef]
  66. Bhattacharyya, S.S.; Ros, G.H.; Furtak, K.; Iqbal, H.M.N.; Parra-Saldívar, R. Soil carbon sequestration—An interplay between soil microbial community and soil organic matter dynamics. Sci. Total. Environ. 2022, 815, 152928. [Google Scholar] [CrossRef]
  67. Giacomo, G.; Angelo, F.; Fabio, B.; Stefano, B.; Riccardo, M. Measurements of soil carbon dioxide emissions from two maize agroecosystems at harvest under different tillage conditions. Sci. World J. 2014, 2014, 141345. [Google Scholar] [CrossRef]
  68. Brady, N.C.; Weil, R.R. Elements of Nature and Soils Properties (Portuguese Version), 3rd ed.; Bookman: Porto Alegre, Brazil, 2013; 704p. [Google Scholar]
  69. Moreira, F.M.S.; Siqueira, J.O. Microbiologia e Bioquímica do Solo, 2nd ed.; Editora da UFLA: Lavras, Brazil, 2006; 729p. [Google Scholar]
  70. Feng, H.; Guo, J.; Malghani, S.; Han, M.; Cao, P.; Sun, J.; Xu, X.; Xu, X.; Wang, W. Effects of soil moisture and temperature on microbial regulation of methane fluxes in a poplar plantation. Forests 2021, 12, 407. [Google Scholar] [CrossRef]
  71. Liu, J.; Tang, W.; Chen, G.; Lu, Y.; Feng, C.; Tu, X.M. Correlation and agreement: Overview and clarification of competing concepts and measures. Shanghai Arch. Psychiatry 2016, 28, 115–120. [Google Scholar]
  72. Santos, G.A.A.; Moitinho, M.R.; Silva, B.O.; Xavier, C.V.; Teixeira, D.B.; Corá, J.E.; La Scala, N., Jr. Effects of long-term no-tillage systems with different succession cropping strategies on the variation of soil CO2 emission. Sci. Total. Environ. 2019, 686, 413–424. [Google Scholar] [CrossRef] [PubMed]
  73. Davidson, E.; Janssens, I.A. Temperature sensitivity of soil carbon decomposition and feedbacks to climate change. Nature 2006, 440, 165–173. [Google Scholar] [CrossRef] [PubMed]
  74. Neira, J.; Ortiz, M.; Morales, L.; Acevedo, E. Oxygen diffusion in soils: Understanding the factors and processes needed for modeling. Chil. J. Agric. Res. 2015, 75, 35–44. [Google Scholar] [CrossRef]
  75. Dias, J.A. Fluxo de CO2 Proveniente da Respiração do Solo em Áreas de Floresta Nativa da Amazônia. Ph.D. Thesis, Escola Superior de Agricultura Luiz de Queiroz (Esalq), Universidade de São Paulo, Piracicaba, São Paulo, Brazil, 2006; 87p. [Google Scholar]
  76. Holanda, A.C.; Feliciano, A.L.P.; Marangon, L.C.; Freire, F.J.; Holanda, E.M. Decomposição da serapilheira foliar e respiração edáfica em um remanescente de Caatinga na Paraíba. Rev. Arvore 2015, 39, 245–254. [Google Scholar] [CrossRef]
  77. Primavesi, A.M. Cartilha do Solo: Como Reconhecer e Sanar Seus Problemas; Movimento dos Trabalhadores Rurais Sem Terra (MST): São Paulo, Brazil, 2009. [Google Scholar]
  78. Nabinger, C. Eficiência do uso de pastagens: Disponibilidade e perdas de forragem. In Fundamentos do Pastoreio Rotacionado; Peixoto, A.M., Moura, J.C., Faria, V.P., Orgs.; FEALQ: Piracicaba, Brazil, 1997; pp. 213–251. [Google Scholar]
  79. Silveira, M.C.T.; Perez, N.B. Informações Sobre Plantas Forrageiras C4 Para Cultivo em Condições de Deficiência de Drenagem e Tolerância a Frio; Embrapa Pecuária Sul: Bagé, Brazil, 2014; 32p. [Google Scholar]
  80. Zhang, X.; Gregory, A.S.; Whalley, W.E.; Coleman, K.; Neal, A.L.; Bacq-Labreuil, A.; Mooney, S.J.; Crawford, J.W.; Soga, K.; Illangasekare, T.H. Relationship between soil carbon sequestration and the ability of soil aggregates to transport dissolved oxygen. Geoderma 2021, 403, 115370. [Google Scholar] [CrossRef]
  81. Caron, B.O.; Souza, V.Q.; Costa, E.C.; Eloyi, E.; Behling, A.; Trevisan, R. Interceptação da radiação luminosa pelo dossel de espécies florestais e sua relação com o manejo das plantas daninhas. Cienc. Rural. 2012, 42, 75–82. [Google Scholar] [CrossRef]
  82. Vital, M.H.F. Impacto Ambiental de Florestas de Eucalipto. Revista do BNDES. 2007. Available online: https://web.bndes.gov.br/bib/jspui/handle/1408/12554 (accessed on 8 November 2022).
  83. Juhász, C.E.P.; Cursi, P.T.; Cooper, M.; Oliveira, T.C.; Rodrigues, R.R. Dinâmica físico-hídrica de uma toposseqüência de solos sob savana florestada (cerradão) em Assis, SP. Rev. Bras. De Cienc. Do Solo 2006, 30, 401–412. [Google Scholar] [CrossRef]
  84. Vicentini, M.E.; Silva, P.A.; Canteral, K.F.F.; De Lucena, W.B.; Moraes, M.L.T.; Montanari, R.; Teixeira Filho, M.C.M.; Peruzzi, N.J.; La Scala, N., Jr.; Rolim, G.D.S.; et al. Artificial neural networks and adaptive neuro-fuzzy inference systems for prediction of soil respiration in forested areas southern Brazil. Environ. Monit. Assess. 2023, 195, 1074. [Google Scholar] [CrossRef]
  85. Braz, S.P.; Urquiaga, S.; Alves, B.J.R.; Boddey, R.M. Degradação de Pastagens, Matéria Orgânica do solo e a Recuperação do Potencial Produtivo em Sistemas de Baixo “input” Tecnológico na Região dos Cerrados; Embrapa: Seropédica, Brazil, 2004. [Google Scholar]
  86. Briedis, C.; Sá, J.C.M.; Caires, E.F.; Navarro, J.F.; Inagaki, T.M.; Ferreira, A.O. Carbono do solo e atributos de fertilidade em resposta à calagem superficial em plantio direto. Pesqui. Agropecu. Bras. 2012, 47, 1007–1014. [Google Scholar] [CrossRef]
  87. Mendonça, J.F.B. Solo: Substrato da Vida, 2nd ed; Embrapa: Brasília, Brazil, 2010; 129p. [Google Scholar]
  88. Iamaguti, J.L.; Moitinho, M.R.; Teixeira, D.B.; Bicalho, E.d.S.; Panosso, A.R.; Junior, N.L.S. Preparo do solo e emissão de CO2, temperatura e umidade do solo em área canavieira. Rev. Bras. De Eng. Agricola E Ambient. 2015, 19, 497–504. [Google Scholar] [CrossRef]
  89. Carneiro, J.S.S.; Santos, A.C.M.; Fidelis, R.R.; Silva Neto, S.P.; Santos, A.C.; Silva, R.R. Diagnóstico e manejo da variabilidade espacial da fertilidade do solo no Cerrado do Piauí. Rev. De Ciências Agroambientais 2016, 2, 14. [Google Scholar]
  90. Sousa, D.M.G.; Lobato, E. Cerrado: Correção do Solo e Adubação, 2nd ed; Embrapa Informação Tecnológica: Brasília, Brazil, 2004; 416p. [Google Scholar]
  91. Resende, J.M.A.; Marques Júnior, J.; Martins Filho, M.V.; Dantas, J.S.; Siqueira, D.S.; Teixeira, D.B. Variabilidade espacial de atributos de solos coesos do leste maranhense. Rev. Bras. De Cienc. Do Solo 2014, 38, 1077–1090. [Google Scholar] [CrossRef]
  92. Silva, B.O.; Moitinho, M.R.; Santos, G.A.A.; Teixeira, D.B.; Fernandes, C.; La Scala, N., Jr. Soil CO2 emission and short-term soil pore class distribution after tillage operations. Soil Tillage Res. 2019, 186, 224–232. [Google Scholar] [CrossRef]
  93. Stolf, R.; Thurler, A.M.; Bacchi, O.O.S.B.; Reichardt, K. Method to estimate soil macroporosity and microporosity based on sand content and bulk density. Rev. Bras. De Cienc. Do Solo 2011, 35, 447–459. [Google Scholar] [CrossRef]
  94. Hakansson, I.; Lipiec, J. A review of the usefulness of relative bulk density values in studies of soil structure and compaction. Soil Tillage Res. 2000, 53, 71–85. [Google Scholar] [CrossRef]
  95. Singh, J.S.; Gupta, V.K. Soil microbial biomass: A key soil driver in management of ecosystem functioning. Sci. Total. Environ. 2018, 634, 497–500. [Google Scholar] [CrossRef]
  96. Ronquim, C.C. Conceitos de Fertilidade do Solo e Manejo Adequado Para as Regiões Tropicais, 2nd ed.; Embrapa Territorial: Campinas, Brazil, 2020; 34p. [Google Scholar]
  97. Bini, D.; Santos, C.A.; Carmo, K.B.; Kishino, N.; Andrade, G.; Zangaro, W.; Nogueira, M.A. Effects of land use on soil organic carbon and microbial processes associated with soil health in southern Brazil. Eur. J. Soil Biol. 2013, 55, 117–123. [Google Scholar] [CrossRef]
  98. Six, J.; Frey, S.D.; Thies, R.K.; Batten, K.M. Bacterial and fungal contributions to carbon sequestration in agroecosystems. Soil Sci. Soc. Am. J. 2006, 70, 555–569. [Google Scholar] [CrossRef]
  99. Fang, C.; Moncrieff, J. A model for soil CO2 production and transport 1: Model development. Agric. For. Meteorol. 1999, 95, 225–236. [Google Scholar] [CrossRef]
  100. Wink, C. Estoque de Carbono em Plantações de Eucalyptuus sp. Implantados em Campo Nativo. Santa Maria. Master’s Thesis, Centro de Ciências Rurais, Federal University of Santa Maria, Santa Maria, Brazil, 2009; 130p. [Google Scholar]
  101. Oikawa, P.; Sturtevant, C.; Knox, S.; Verfaillie, J.; Huang, Y.; Baldocchi, D. Revisiting the partitioning of net ecosystem exchange of CO2 into photosynthesis and respiration with simultaneous flux measurements of 13CO2 and CO2, soil respiration and a biophysical model, CANVEG. Agric. For. Meteorol. 2017, 234–235, 149–163. [Google Scholar] [CrossRef]
  102. Kuyah, S.; Buleti, S.; Dimobe, K.; Nkurunziza, L.; Moussa, S.; Muthuri, C.; Öborn, I. Farmer-managed natural regeneration in Africa: Evidence for climate change mitigation and adaptation in drylands. In Agroforestry for Sustainable Intensification of Agriculture in Asia and Africa; Dagar, J.C., Gupta, S.R., Sileshi, G.W., Eds.; Sustainability Sciences in Asia and Africa; Springer: Singapore, 2023. [Google Scholar] [CrossRef]
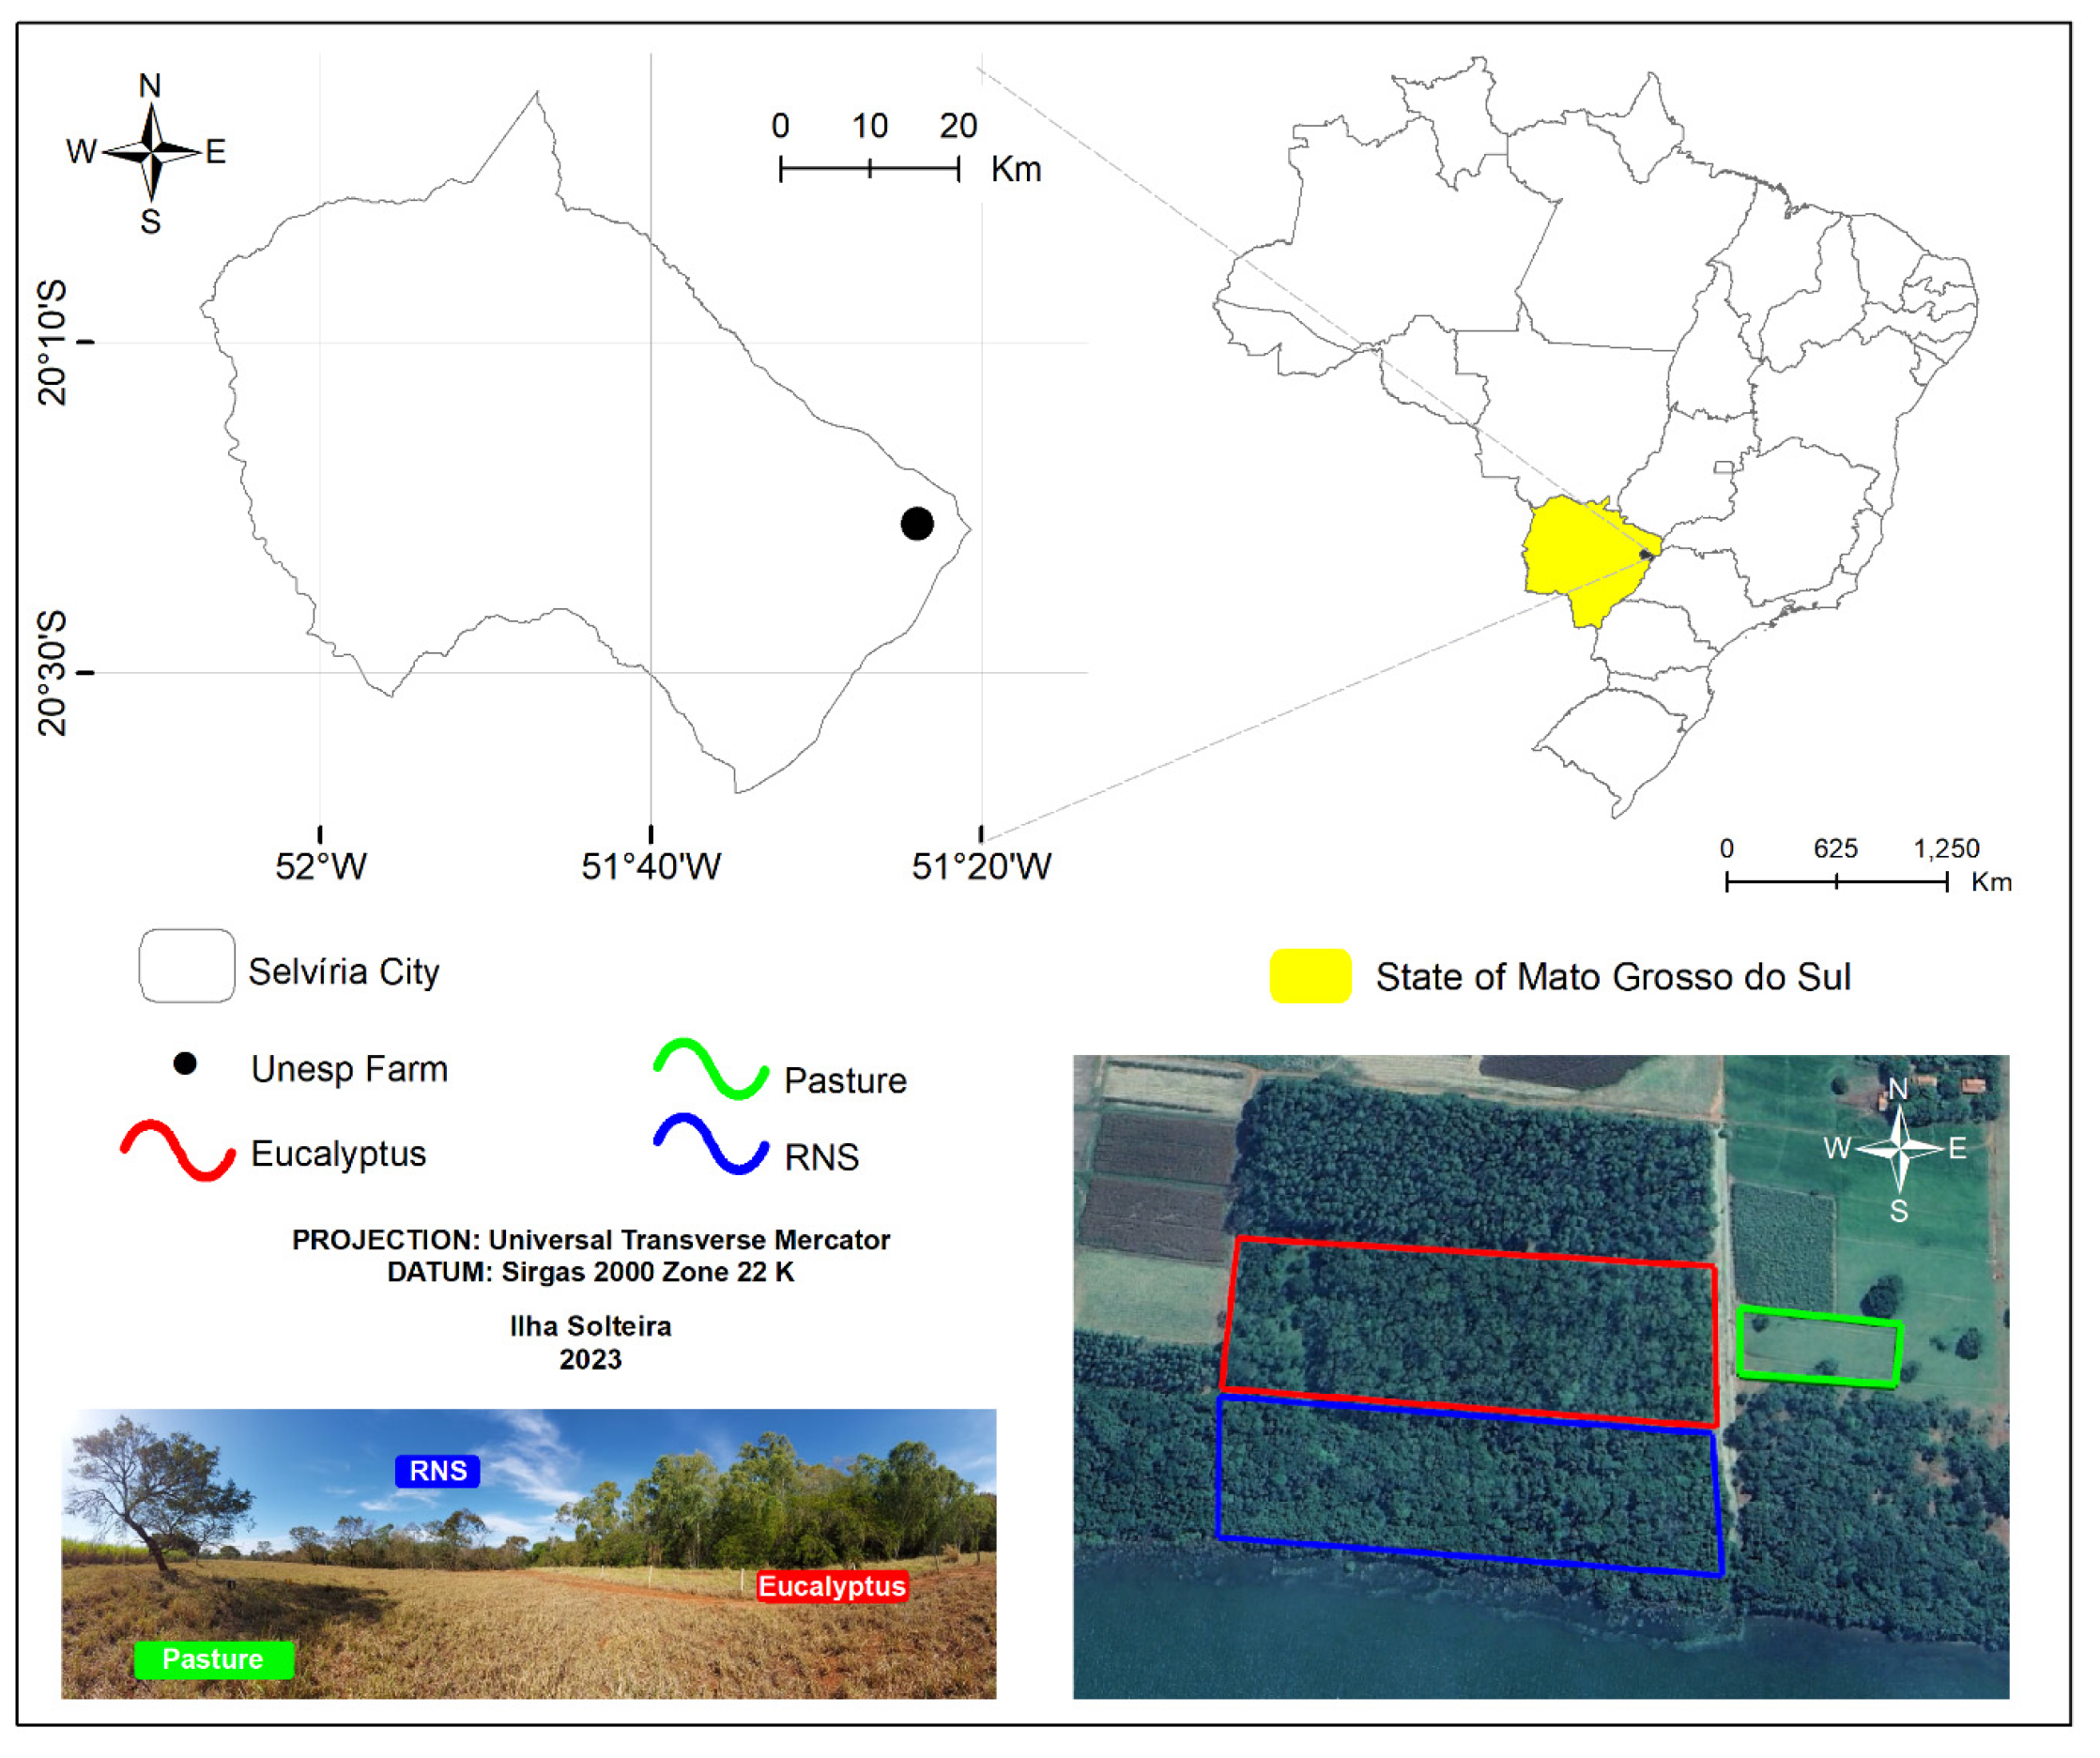
Figure 1. Geographic location of the study areas in the Cerrado region, Brazil. This research was conducted in three land use types: pasture, eucalyptus plantation, and reforested area with native species (RNS = reforested with native species).
Applsci 15 12302 g001
Figure 2. Climatic conditions observed during the experimental period in the Cerrado region, Brazil: (a) air temperature (°C), (b) relative humidity (%), (c) atmospheric pressure (kPa), (d) evapotranspiration estimated using the Penman–Monteith method (mm day−1) and (e) photosynthetically active radiation (µmol m−2 s−1). maxT = maximum air temperature; avgT = average air temperature; and minT = minimum air temperature.
Applsci 15 12302 g002
Figure 3. Mean values of (a) soil CO2 emission (µmol m−2 s−1), (b) soil O2 influx (mg O2 m−2 s−1), (c) soil moisture (%) (volume/volume) and (d) soil temperature (°C) measured under different land use types (pasture, eucalyptus plantation and reforested area with native species). Mean values followed by the same letters do not differ according to Tukey’s test at the 5% probability level. RNS = reforested with native species. N = 108.
Applsci 15 12302 g003
Figure 4. Temporal variability of (a) soil CO2 emission (µmol m−2 s−1), (b) soil O2 influx (mg O2 m−2 s−1), (c) soil moisture (%) (volume/volume) and (d) soil temperature (°C) across the evaluated land use types (pasture, eucalyptus plantation and reforested area with native species). Mean values followed by the same letters do not differ according to Tukey’s test at the 5% probability level. ns = not significant. RNS = reforested with native species. N = 18.
Applsci 15 12302 g004
Figure 5. Soil physical and chemical attributes meansured in the the 0.0–0.40 m layer across eucalyptus, pasture, and reforested areas with native species (RNS) in Selvíria, MS, Brazil: (a) soil organic matter (g dm−3), (b) hydrogen potential (pH) extracted in CaCl2 solution, (c) sum of bases (mmolc dm−3), (d) soil bulk density (g cm−3), (e) soil macroporosity (m3 m−3) and (f) soil microporosity (m3 m−3). Mean values followed by the same letters do not differ according to Tukey’s test at the 5% probability level. ns = not significant. N = 18.
Applsci 15 12302 g005
Figure 6. Biplot of the principal component analysis (PCA) showing the relationships among soil CO2 emission, O2 influx, soil attributes and climatic variables under different land use types. FCO2 is soil CO2 emission; iO2 is soil O2 influx; MS is soil moisture; ST is soil temperature; SOM is soil organic matter; pH is hydrogen potential; SB is sum of bases; DS is soil bulk density; Macro is soil macroporosity; Micro is soil microporosity; Temp is average air temperature; RH is average relative humidity; PAR is photosynthetically active radiation; AtmP is atmospheric pressure and ETo is reference evapotranspiration.
Applsci 15 12302 g006
Table 1. Eigenvalues, eigenvectors and percentage of explained variance for each principal component derived from the PCA, showing the contribution of soil and climatic variables to data variability.
VariablesPC 1PC 2
FCO20.34−0.53 *
iO2−0.78 *0.01
MS−0.33−0.02
MS−0.72 *−0.27
SOM−0.73 *−0.24
pH−0.93 *−0.18
SB−0.95 *−0.13
SbD−0.71 *0.20
Macro−0.28−0.59 *
Micro0.83 *0.15
Temp−0.180.90 *
RH0.24−0.88 *
PAR−0.15−0.02
AtmP0.10−0.79 *
ETo−0.190.89 *
Eigenvectors5.13.9
Explained Variance (%)34.025.7
Cumulative Explained Variance (%)34.059.7
Interpretation of the formed processesO2 consumption and transportCO2 production and transport
FCO2 is soil CO2 emission; iO2 is soil O2 influx; SM is soil moisture; ST is soil temperature; SOM is soil organic matter; pH is hydrogen potential; SB is sum of bases; DS is soil bulk density; Macro is soil macroporosity; Micro is soil microporosity; Temp is average air temperature; RH is average relative humidity; PAR is photosynthetically active radiation; AtmP is atmospheric pressure and ETo is reference evapotranspiration. Asterisks (*) indicate significance for the eigenvalue ≥ 0.50 criterion.
Disclaimer/Publisher’s Note: The statements, opinions and data contained in all publications are solely those of the individual author(s) and contributor(s) and not of MDPI and/or the editor(s). MDPI and/or the editor(s) disclaim responsibility for any injury to people or property resulting from any ideas, methods, instructions or products referred to in the content.