Abstract
This study evaluates low-strength concrete incorporating recycled rubber aggregates from waste tires and polymer fiber for use as “forgiving” safety barriers that enhance road safety while promoting environmental sustainability. Incorporating the rubber and fiber enables recycling the tires close to the source where they were originally used—the road. These barriers are designed to absorb collision energy, reduce vehicle deceleration, and minimize the severity of accidents. The key requirements for such concrete are low strength, low elastic modulus, high ductility, high toughness, and minimal dispersion of large fragments upon failure. The study investigated various concretes containing different percentages of recycled rubber (0–20% by volume) and polymer fibers (0–1.2% by volume). We conducted compression, flexural, and dynamic impact tests to assess the effects of these additions on the properties of the concrete. Dynamic tests were carried out in a cantilever loading scheme with strain rates of 2.5–3 s−1, to emulate barrier loading during car crush. Key findings include indications that recycled rubber decreases concrete strength, while its contribution to energy absorption is limited. In contrast, polymer fibers enhance the concrete’s elongation and toughness, increasing energy absorption. The quantity of fibers present in the fracture area is critical for energy absorption. Notably, energy absorption under dynamic loads is more significant than that under quasi-static loads; however, the difference between these results diminishes as the fiber percentage increases. Furthermore, quasi-static tests on fiber-reinforced concrete can effectively evaluate its response to impact loads. In conclusion, the combined use of recycled rubber and polymer fibers in low-strength concrete offers a sustainable solution for developing safer and more environmentally responsible roadside infrastructure by repurposing waste materials and reducing the ecological footprint of construction. Careful attention should be paid to the distribution of fibers within the concrete, as this significantly influences energy absorption.
1. Introduction
Concrete is frequently used for road safety barriers; however, traditional high-strength concrete often fails to sufficiently slow down vehicles during impact, posing safety risks for occupants [,]. To improve crashworthiness, barriers should be capable of deforming and absorbing energy during collisions—a concept known as a forgiving barrier. This requires concrete with low strength, high ductility, and enhanced flexural energy absorption under dynamic loading.
Incorporating recycled tire rubber into concrete has been shown to reduce compressive strength while increasing flexibility, damping behavior, and sustainability [,]. Additionally, polymer fibers enhance resistance after cracking, prevent brittle fracture, and improve energy dissipation capacity [,]. However, excessive rubber content significantly lowers compressive and flexural strength due to high air entrainment and weak bonding with the cement paste [,,,,,,,,]. Surface pretreatments have been explored to improve rubber adhesion, with mixed results [,,,,,,].
The combined use of rubber and fibers is a promising approach: rubber improves deformability, while fibers help bridge cracks and enhance toughness. The effectiveness of fiber reinforcement depends on fiber shape and pull-out mechanics and is usually measured using the Reinforcement Index (RI) []. Although the mechanical properties of rubberized concrete under static loads are well understood, less attention has been given to its dynamic flexural performance, which is the main failure mode in road barrier impacts []. Most current dynamic studies focus on high-strain-rate compressive loading using the Split Hopkinson Pressure Bar (SHPB) or falling-weight impact setups [,].
To better illustrate the focus of previous research and identify existing gaps, a summary of the dynamic loading methods reported in the literature is provided in Table 1. Only 17% of these studies examined tensile or flexural dynamic behavior [,,,,,,,,,,,,,,,,,,,,,,,,], leaving a significant knowledge gap related to impact-driven deformation behavior relevant to safety barriers.

Table 1.
Modes of dynamic loading in the reviewed literature.
Real vehicle–barrier collisions typically involve low strain rates (10−3–10−4 s−1) [,], which are much lower than those generated in SHPB testing. Therefore, there is a need for experimental evaluation under realistic low-strain-rate dynamic conditions. This study addresses these gaps by examining the quasi-static and low-rate dynamic flexural behavior of low-strength concrete mixtures containing different amounts of recycled crumb rubber and polymer fibers. The primary goal is to evaluate the potential of these mixtures to support the development of forgiving and sustainable road safety barriers that can reduce peak impact deceleration while effectively absorbing energy.
2. Materials and Methods
2.1. Materials and Mix Design
The cement used was CEM II 42.5 N B/LL, according to EN 197 [] by Nesher™, Ramla, Israel. The aggregate properties are given in Table 2. Tyrec™, Menashe, Israel produced the crumb rubber aggregates from used tires. The rubber aggregate water absorption and apparent specific gravity were measured with the addition of an antifoam agent, as has been used in the concrete mixes. Aggregates properties are presented in Table 2. The polymer fibers used were Enduro® 600 by Sika®, Modi’in, Israel. The fiber density is 0.91, length 50 mm, equivalent diameter 0.81 mm, and aspect ratio 64. The rubber and fiber percentages are the volume/mix volume. All mixes had a 0.7 W/C ratio to achieve a relatively low compressive strength. The concrete mixes are presented in Table 3. Aggregates properties.
Table 2.
Aggregate properties.
Table 3.
Concrete mixes (kg/m3 if not otherwise mentioned).
2.2. Specimen Preparation
The mixes were prepared in a horizontal concrete mixer. The mixing procedure is illustrated in Figure 1. Before each mix, the drum was moistened with a wet fabric. The aggregates were inserted with 80% water and the antifoam agent. The materials were mixed for one minute and left to absorb water for 3 min. The cement and the rest of the water were added, and the materials were mixed for 3 min. During this mix, the fibers were added manually in small portions. In the case of fiber aggregation (hedgehog formation), the aggregation was manually broken, and the concrete was remixed to achieve a homogeneous mix.
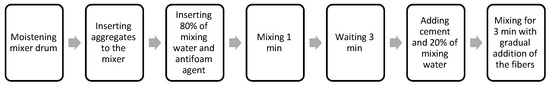
Figure 1.
Concrete mix preparation procedure.
The unit weight of the fresh concrete was measured according to EN 12350-6:2009 []. A slump test was performed according to EN 12350-2:2009 []. The air content was measured using the pressure method, according to EN 12350-7:2009 [].
Every mix was cast by hand into 12 beams sized 10 × 10 × 50 cm3 and three cubes sized 100 × 100 × 100 mm3 (Figure 2). A vibratory table aided the concrete consolidation. The specimens were cured under a polyethylene sheet for 24 h, underwater for 7 days, and in the air for 20 days with no temperature or humidity control.
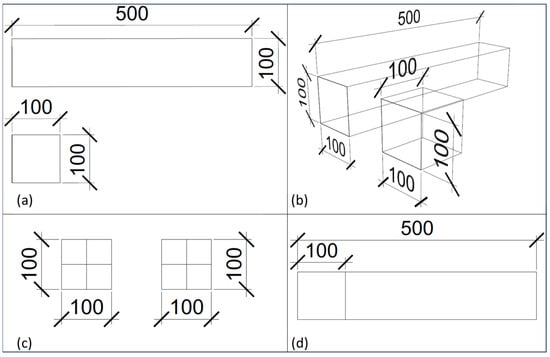
Figure 2.
Specimen dimensions (mm). (a) top view; (b) perspective; (c) front view; (d) right view.
2.3. Quasistatic Mechanical Properties
The compressive strength of the concrete cube specimens was measured on three cubes of every mix at 28 days, according to EN 12390-3:2019 [].
Quasi-static bending strength measurements were performed with a central single force on a 450 mm opening (similar to EN 12390-5:2019 Annex A []), with displacement control, at a 1 mm/min rate on six beams for each mix. The maximum displacement of the measurement was limited to 35 mm by the extensometers.
2.4. Dynamic Flexural Testing Using a Pendulum Hammer
Dynamic measurement was performed under load in a cantilever static scheme on six beams for each mix. The concrete beam was fixed 380 mm from the impact point (Figure 3 and Figure 4). The impact force was applied by a 24.6 kg hammer of a 300 Joule impact testing Machine, Model: JB-300 by Jinan Precision Equipment Co., Ltd., Jinan, China. The absorbed energy is equivalent to the change in the pendulum height at rest before and after impact and is read by a dial on the machine. The reading from the pendulum dial was corrected by subtracting the kinetic energy of the concrete fragments that fell away from the impact point. The fragments were weighed, the distance of the pieces from the impact point was measured, and the horizontal velocity was calculated using a ballistic equation. The kinetic energy was subtracted from the pendulum energy reading. Nevertheless, the kinetic energy of fragments was lower than the standard deviation of the dynamic measurements. A PASCO PS-3202 by Pasco, Roseville, CA, USA force accelerometer was attached to the hammer of the pendulum to measure its acceleration during impact.
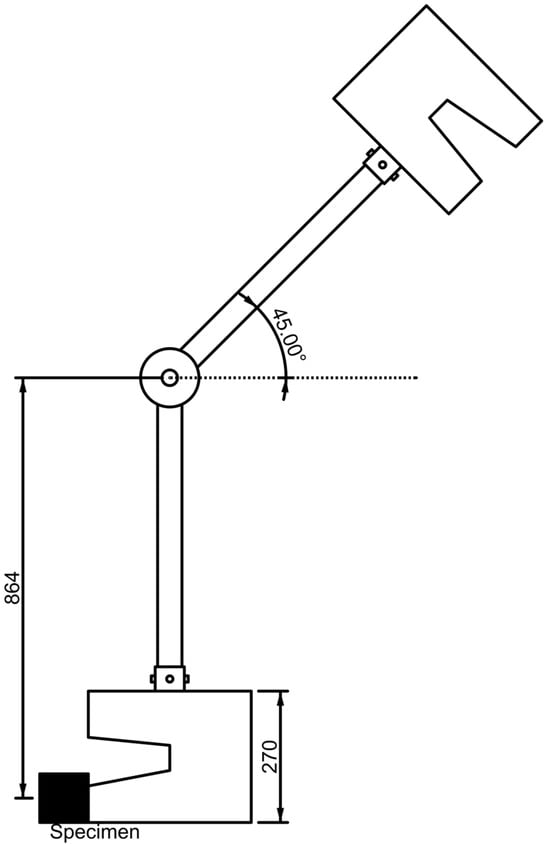
Figure 3.
Schematic of the dynamic loading machine (units in mm).
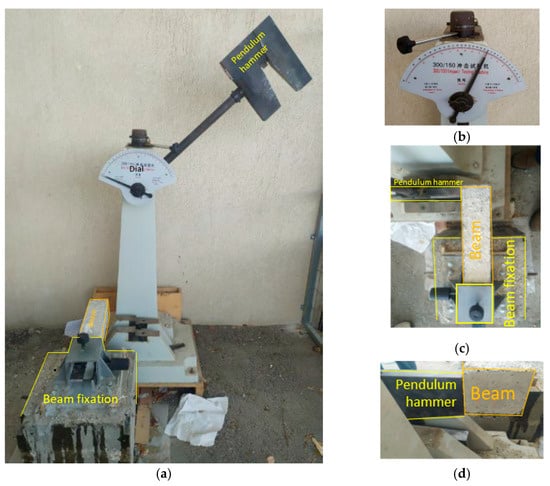
Figure 4.
The experimental system for impact. (a) Overall side view, (b) the dial, and (c) a top view of a beam in the restraining apparatus (lower part of the photo) and the pendulum hammer (touching the beam at the upper part of the photo) (d) side view of the hammer touching the beam.
For comparison, the quasi-static and dynamic loading, equivalent forces, and displacements were calculated according to Equations (4) and (7).
2.5. Testing Conditions and Methodological Justification
The dynamic flexural tests were conducted using a pendulum hammer to simulate realistic low-rate impact conditions relevant to vehicle–barrier interactions. Hammer height and spring compression were controlled to ensure repeatable impact velocity for all specimens. This configuration provides a consistent flexural failure mode, which is the dominant loading condition in safety barrier applications. Although the method does not allow direct measurement of reaction forces or acceleration during impact, it enables reliable comparison of energy absorption across mixtures, which is the primary objective of this study. The falling pendulum approach is therefore suitable for screening the deformation capacity and post-cracking behavior of candidate mixtures. Three identical specimens were tested under each loading condition to ensure repeatability, and variability was reported where relevant.
3. Results
The concretes in this work were low-strength and ranged from 6.8 to 27.2 MPa in compressive strength. The properties of fresh concrete are presented first. Next, their relation to other properties, which are presented in the following subsections, is discussed. The quasi-static results are then presented and discussed, and the section closes with a presentation of the dynamic behavior of the concrete.
3.1. Physical Properties of Concrete
3.1.1. Workability and Fresh Properties
Figure 5 illustrates the variation in air content with increasing percentages of rubber and fiber. The air content increased slightly from approximately 2.0% for the control mix to around 3.0–3.5% at a 20% rubber replacement. Overall, the changes remained within typical limits for a workable concrete mixture. The R value for linear correlation between the air content and rubber content is −0.068, and the p is 0.86, where R is the Pearson correlation coefficient and p is the p-value (i.e., the probability of getting an equal or better R value from an equal population with random values). This finding is inconsistent with existing literature, which reports increased air content with rubber or fiber content. Other authors found a linear increase in air content with the rubber content and higher air content [,,]. For example, Li et al. [] found air content as high as 9.7% for rubber content of 90 kg/m3 (about 8.2% by volume). The added antifoam agent increases the liquid phase surface tension, thus increasing the energy required to create air bubbles. It was effective with up to 10% rubber content. This is similar to the results attained by surface-treated rubber aggregate concrete attained by others []. For rubber content above 10%, there is a clear tendency for increased air content with rubber content (R = 0.74 and p = 0.021). Above 10% rubber, a larger antifoam agent is needed to prevent air entrainment at the rubber-cement paste interface. Overall, the R range is 0.69, and p is 0.004 (Table 4). Since this work did not include microstructure investigation, additional research is needed to determine the mechanism of air entrainment and paste-rubber aggregate adhesion in an antifoam agent-containing concrete.
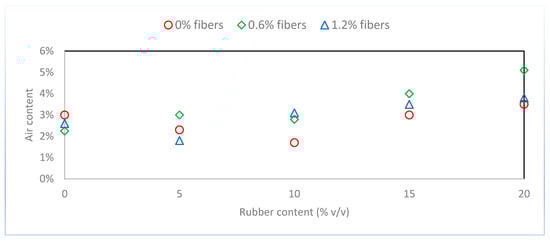
Figure 5.
Air content as a function of rubber and fiber content in the concrete mixes.
Table 4.
Linear regression results (Pearson R, p-value) among measured variables.
Figure 6 presents the unit weight of the fresh concrete mixtures as a function of rubber and fiber contents. The unit weight decreased almost linearly with increasing rubber replacement—from approximately 2400 kg/m3 in the control mixture to about 2100 kg/m3 at 20% rubber. This reduction results directly from the significantly lower density of rubber aggregates (≈approximately 1.1 g/cm3) compared to natural aggregates (≈approximately 2.65 g/cm3). The addition of polypropylene fibers produced only negligible variations in density, confirming that the dominant factor controlling unit weight is the proportion of rubber substitution.
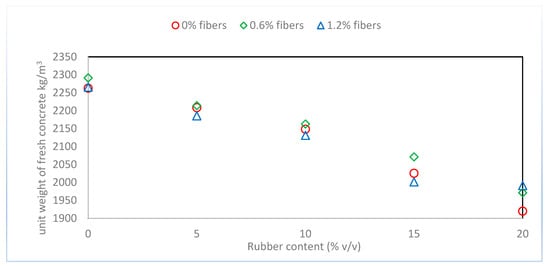
Figure 6.
Unit weight of fresh concrete as a function of rubber and fiber percentages in the concrete mixes.
Figure 7 illustrates the slump results for the tested mixtures. The slump value decreased consistently for any rubber addition above 5%, with the increase in rubber and fiber content, dropping by nearly 50% at a 15–20% rubber replacement. This reduction in workability is primarily due to the irregular shape and low surface energy of the rubber particles, which increase internal friction and decrease the mixture’s flowability. The inclusion of polypropylene fibers further decreased the slump due to the formation of a fiber network that restricts flow, although the difference between 0.6% and 1.2% fiber contents was not significant. These findings are in good agreement with previous studies on rubberized and fiber-reinforced concretes. This result is in agreement with the literature [,,].
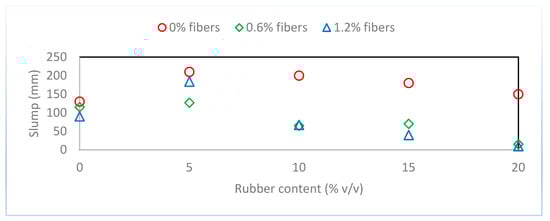
Figure 7.
Slump as a function of rubber and fiber percentages in the concrete mixes.
3.1.2. Mechanical Strength—Compressive and Flexural
Figure 8 presents the compressive strength results of the tested mixtures. The compressive strength decreased almost linearly with increasing rubber content, with a correlation coefficient, R, of approximately −0.9 (Table 4). The control mixture reached approximately 28 MPa, while the mixture with 20% rubber exhibited a reduction to around 12–14 MPa, regardless of the fiber content. Specifically, a decrease of 0.74 MPa for each percentage increase in rubber content corresponds to a decrease of 3.1% of the strength measured without rubber for each percentage of rubber added. This finding is consistent with existing literature [,,,,,,,,,]. Because there is no significant change in air content, the decrease in compressive strength can be attributed to the weaker paste-aggregate interface at the interfacial transition zone (ITZ) or the transformation of stresses from the compressing axes to the perpendicular axes by the compression of the rubber aggregates []. However, these assumptions should be confirmed by electron microscopy imaging and mechanical model analysis.
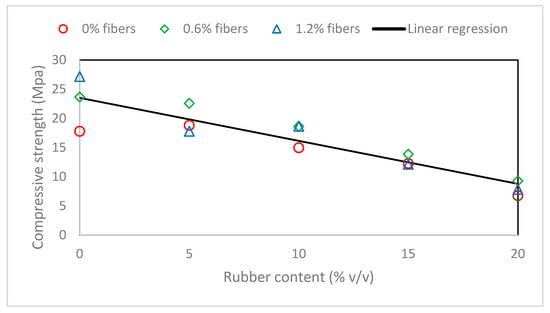
Figure 8.
Compressive strength as a function of rubber and fiber percentages in the concrete mixes.
For the mixes that do not contain rubber, the compressive strength rises with the fiber content, with a 33% increase for 0.6% fibers and a 53% increase for 1.2% fibers. This compressive strength relationship to mixes with increasing fiber content also agrees with the literature [,,]. The increase in compressive strength is attributed to an increase in the shear strength achieved by the fibers, as cubes in compression tend to fail in shear.
Figure 9 shows the flexural strength of the concretes as a function of rubber and fiber content. Rubberized mixtures exhibited lower peak flexural strengths than the control. The flexural strength decreases with the rubber content. This aligns with findings reported in the literature [,,,,,,]. This observation supports the hypothesis that the primary mechanism for the reduction in strength is the weakened interface between the paste and aggregate. Furthermore, the fiber content did not significantly influence the flexural strength; an increase in fiber content from 0.6% to 1.2% resulted in no observable effect. This is because the fiber content is lower than the content needed for a flexural strength increase, so the fibers can contribute to the energy absorption.
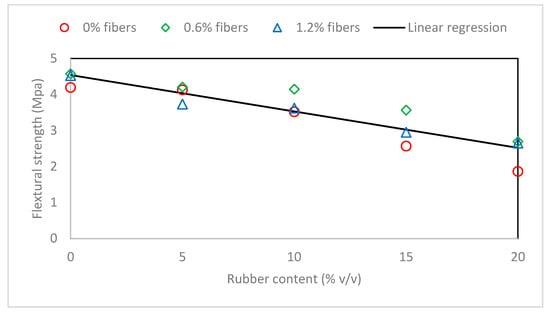
Figure 9.
Flexural strength as a function of rubber and fiber percentages in the concrete mixes.
Figure 10 illustrates the stress-strain curve of the concrete mixes in this investigation. The peak at the left is the flexural strength of the plain concrete, and the peak at the right is the flexural strength that arises from the fiber bridging the fractured concrete. The second peak is lower than the first. This is the reason that the fiber content does not contribute to the flexural strength. The energy absorption capacity (toughness) is calculated as the area under the load–deflection curve. It will be shown in Section 3.2 that the absorbed energy increased markedly with fiber content and moderately with rubber replacement. This trend suggests that fibers play a significant role in enhancing the ductility and toughness of concrete. At a 1.2% fiber content, the total energy absorbed was nearly three times higher than that of the control mix.
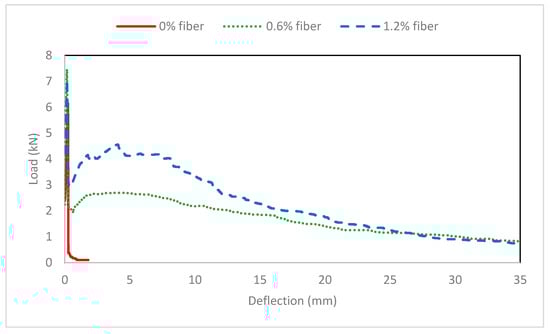
Figure 10.
Typical quasi-static force–deflection curves of plain and fiber-reinforced concrete.
Comparing concrete mixes without rubber, but containing 0.6% and 1.2% fibers, absorbed 62 and 89 times more energy, respectively, than the control mix without fibers. Although increasing the fiber content from 0.6% to 1.2% did not significantly affect the flexural strength, it substantially impacted the energy absorption capacity until failure.
While the fibers contribute to energy absorption, a discernible trend also suggests the role of rubber aggregates in enhancing energy absorption. For mixes with 1.2% fiber content, an increase in rubber content from 0% to 5% is associated with a measurable increase in energy absorption. In contrast, the 0% fiber mixes exhibit a slight increase in energy absorption with rubber content increase, which is negligible compared to the values observed in the fiber-reinforced mixes. Other studies have reported a minimal contribution of rubber aggregates to energy absorption, similar to these results [,]. If the energy absorbance of the mixes with no added fibers were presented as an improvement by percentage relative to the plain concrete, a high contribution could be noted. Such a presentation creates a misleading perception of the limited usefulness of rubber aggregates. Furthermore, because the standard deviations (horizontal bars in Figure 11) are comparable to the observed differences in energy absorption across varying rubber contents, the results do not provide sufficient evidence to draw definitive conclusions.
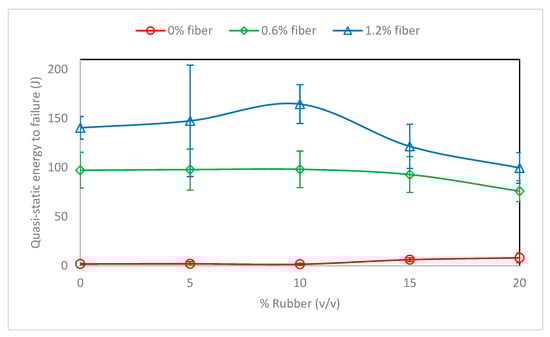
Figure 11.
Quasi-static energy to failure as a function of rubber and fiber percentages in concrete mixes.
3.2. Energy Absorption Capabilities
3.2.1. Energy to Failure Under Quasi-Static Load
Figure 12 presents the beams’ energy to failure (or 35 mm displacement). Including fiber in the concrete significantly enhances energy absorption, consistent with the findings reported in the literature [,]. Notably, the increase in energy to failure is not linear to fiber content; specifically, doubling the fiber content added does not result in doubling the energy. This effect is exceptionally minimal for the mix with 20% rubber.
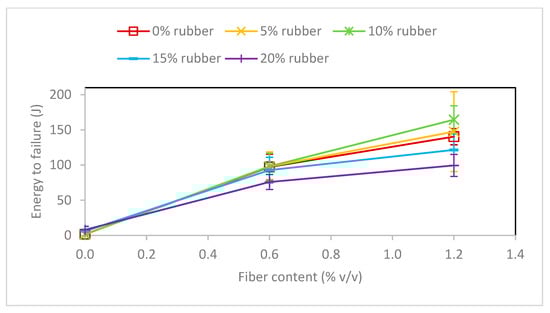
Figure 12.
Energy to failure in quasi-static load as a function of rubber and fiber percentages in concrete mixes.
Including rubber in the mix increased the energy to failure only for the mix without fiber. However, this increment is negligible relative to the energy absorbed by the fibers. Moreover, the increment is in the range of the standard deviation of the repetitions.
The combined effect of fibers and rubber is not clear. The mixes with 1.2% fibers demonstrate some energy increment to failure for 5% and 10% rubber relative to the mix without fibers. The mixes with 0.6% fibers show no clear tendency. The behavior of the 1.2% fibers may be a real phenomenon or a random result due to the high variability of test results. A research program with more data points or lower variation is needed to answer this question.
3.2.2. Energy to Failure Under Dynamic Load
Figure 13 presents the energy to failure for the different mixes under dynamic loading. The differences between the fiber content of 0.6% to 1.2% fibers were minimal, with both fiber contents demonstrating higher energy to failure than the 0% fiber mixes. As the rubber content increased, the energy to failure for the 0% and 1.2% fiber mixes also increased, decreasing for the 0.6% fiber mix. Values for these observations are 0.08, 0.28, and 0.60, respectively (calculated for each fiber content separately), indicating that the rubber content does not significantly affect the dynamic energy absorption, particularly when fibers are included in the concrete mix.
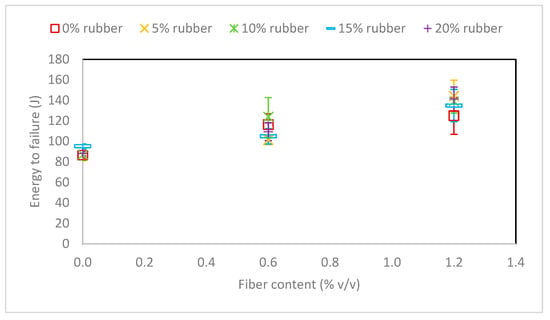
Figure 13.
Energy to failure in a dynamic test as a function of rubber and fiber percentages in concrete mixes.
These results do not align well with the literature, which reports a significant energy absorption enhancement for rubberized concrete [,,,,,,,]. This discrepancy can be settled by considering several factors. First, most experimental procedures measured the concrete under a compression load [,,,] while the present investigation assessed it under a bending load. Furthermore, many studies evaluated energy to failure using repeated impacts [,,,,] or only a quasi-static load [,,]. There is no reason to assume that the overall energy of repeated impacts is correlated with the energy of a single impact. In repeated impact settings, part of the energy is stored and released as elastic energy [,]. So, as the number of impacts increases, the elastic energy of each impact is incorporated into the reported total energy to failure. (3) The energy absorbance of the fiber makes the rubber contribution insignificant. Consequently, as the number of impacts increases, the elastic energy from each impact accumulates, contributing to the perceived total energy to failure. Lastly, the energy absorption capabilities of the fibers may diminish the significance of the rubber’s contribution to energy absorption.
Inspecting the fractured surface of the concrete reveals that most fibers fail by a pull-out mechanism. The pull-out mechanism for polymer fibers is well known in the literature [,]. This will be discussed later in Section 3.2.3.
Counting the number of fibers present on the fractured surfaces of the beams after the impact test revealed a strong correlation (p-value of 0.0051) between the number of fibers and the energy to failure (Figure 14). This correlation was consistent across all specimens, irrespective of fiber content. These findings underscore the critical importance of fiber distribution within the cast for effective energy absorption [,,,,]. In the case of the bending impact load of a cantilever beam, only the distribution along the beam is important. However, the current literature does not offer a solution to reduce the longitudinal distribution. Being cast in the beam mold forces the fibers in the longitudinal direction. Pouring the concrete into the mold in small portions by hand may cause small inconsistencies in the fiber distribution. To overcome this problem, in future studies, it is advised to cast a plate and cut it into specimens. This casting and cutting result in a distribution similar to a real cast. Using larger specimens, preferably as in the intended use size, is another way to reduce variability. The drawback of this solution is an increase in research costs.
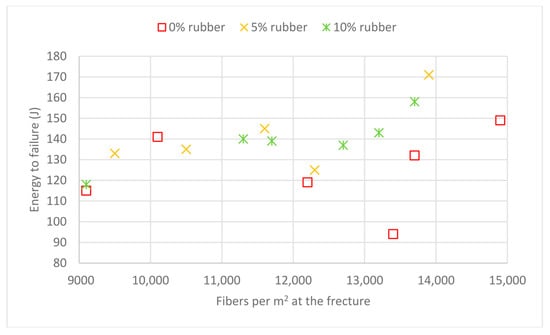
Figure 14.
Energy to failure in dynamic load as a function of rubber and fiber percentages in concrete mixes.
The acceleration measurements were found to be noisy, likely due to the natural frequency of the hammer pendulum mechanism, which closely matches the duration of the impact. For four of the concrete mixes, angular velocity was also recorded. In retrospect, angular velocity proved to be a more reliable measurement than linear acceleration within the given experimental setup. A typical result is shown in Figure 15, where the impact is clearly observable in the angular velocity data.
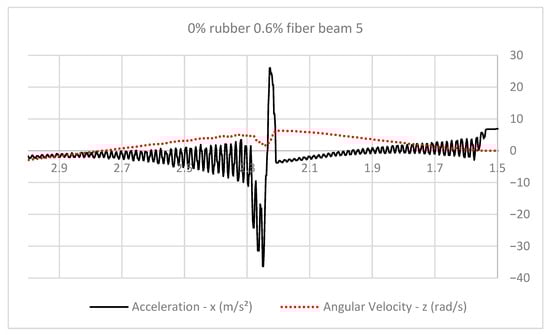
Figure 15.
A typical acceleration and angular velocity measurement from the force accelerometer mounted on the hammer.
By integrating the product of the pendulum radius and angular velocity, the displacement of the cantilever tip during impact was calculated. Assuming a static bending profile for the cantilever beam, the corresponding strain and strain rate were then derived. These values—impact duration, strain, and strain rate—are presented in Table 5.
Table 5.
Impact duration, strain, and strain rate for the mixes with recorded angular velocity.
The results show that impact duration is independent of the concrete mix. Moreover, variations in strain and strain rate among different mixes are comparable to the standard deviation within each group. This suggests that the strain rate is primarily determined by the hammer’s impact velocity, which remains relatively constant across tests.
The measured strain rates, ranging from 2.5 to 3 s−1, are one to two orders of magnitude lower than those typically reported using the Split Hopkinson Pressure Bar (SHPB) method [,,,,,,,,,,,,,], but significantly higher than those achieved with hydraulic presses [].
The measured maximum acceleration on impact does not decrease significantly with the increase in rubber content (Figure 16). The variation in measured acceleration is very high, relative to the differences between averages. Part of the high variation may result from a vibration of the pendulum itself, as is visible from the negative peak in Figure 15, which limits the usage of the acceleration data. However, if the factor of flexural strength increases with the strain rate is independent of rubber content, according to the flexural strength results (Figure 9), the impact acceleration should be reduced with rubber content. For future research, a different method for acceleration measurement must be used to verify the quasi-static results. The lower acceleration is crucial because it is a component of the ASI (acceleration severity index), which is the parameter used to define whether the safety barrier is forgiving. Lower acceleration means milder injuries for vehicle passengers in the case of a crash []. Durability concerns dictate the maximum W/C ratio, and rubber enables a reduction in strength without increasing the W/C ratio.
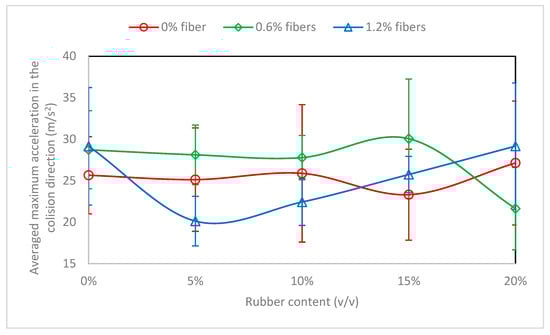
Figure 16.
Maximum acceleration at impact as a function of rubber and fiber percentages in concrete mixes.
3.2.3. Comparison of Quasi-Static and Dynamic Load Response
To compare the results of static and dynamic loads, the force and deflection of the quasi-static load were converted to an equivalent cantilever static scheme having the same stress. Since it is known that the maximum moment in a beam with a central force is: [].
And the maximum moment in a cantilever loaded at its free end is: [].
We may assume that both the beam in bending and in cantilever loads fail at the maximum moment. So:
Hence, the following equation is derived:
For the maximal displacement, Equation (5) is known for a beam with a central force, and Equation (6) for a cantilever loaded at its free end [].
Since the modulus of elasticity and the momentum of inertia are equal, Equation (7) can be used to calculate the expected displacement of a cantilever edge based on the results of a beam bending.
In these equations, is the deflection, and is the applied force. The corrected force–displacement graphs, as shown in Figure 10, were subjected to numerical integration using the trapezoid method. Figure 17 presents the comparison between the quasi-static and dynamic methods. The mixes that lacked fibers exhibited significantly higher energy absorption during the dynamic test, absorbing between 14 and 68 times more energy than in the quasi-static tests. Similarly, the fiber-containing mixes also demonstrated greater energy absorption under dynamic loading; however, as the energy levels increased, their results increasingly resembled those observed in the quasi-static tests.
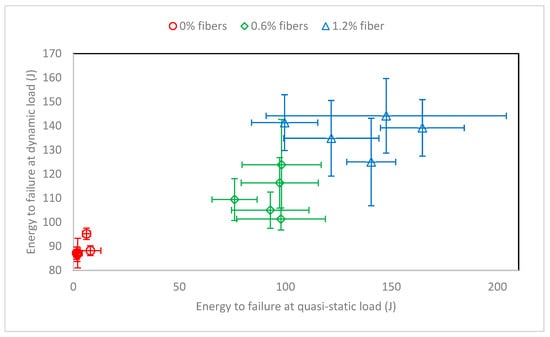
Figure 17.
Comparison of quasi-static and dynamic energy absorption as a function of the percentage of fiber in concrete mixes.
One possible explanation for the increased energy absorption under dynamic loading is the failure mode of fibers. An examination of the fractures of the quasi-static loaded beams found that pull-out was the predominant cause of fiber failure. This fiber-based failure is a typical failure mode for polypropylene fibers [,], characterized by erosion through friction, which leaves holes on the fractured surface []. In contrast, the fibers on the fracture surface of beams that failed under dynamic loading exhibited a higher proportion of fibers that failed by tearing (Figure 18).

Figure 18.
(a) A fractured surface of a beam failed by impact load. Pulled-out fibers are marked with red circles. Torn fibers are marked with green circles. (b) Close-up image of pulled-out fibers. (c) Close-up image of torn fibers.
All beams subjected to quasi-static loading failed at the maximum moment location, specifically in the middle of the opening. No visible parallel fissures were observed at the bottoms of the beams, indicating that the fibers absorbed energy only during the development of the fracture. In contrast, all beams tested under dynamic loading exhibited parallel fissures. Multiple cracks can account for some of the additional energy absorbed. Notably, the beams made with mixes that did not contain fibers failed at two distinct locations; however, this alone cannot fully explain the observed increase in energy to failure for these mixes. A more comprehensive explanation must be derived from the fracture mechanisms under varying strain rates, as documented in numerous studies of compression loading [,,,,,,,,,,].
Since the results from the quasi-static tests can serve as an indicator of energy absorption capacity, it is useful to compare them with values reported in the literature for plain concrete of strength class B-40, which is often used as a reference for fiber-reinforced concrete. For example, an energy absorption of approximately 4.2 J was reported for a cross-sectional area of 0.0255 m2, corresponding to about 165 J/m2. In contrast, the energy to failure of the specimen tested in this study (0.01 m2 cross-section, containing 0.6% fibers by volume) was approximately 90 J, or about 9000 J/m2—more than an order of magnitude higher. Furthermore, the energy to failure of fiber-reinforced concrete under cantilever loading is not directly correlated with compressive strength. Therefore, it can be concluded that any fiber-reinforced concrete mix will perform at least as well as B-40 grade concrete in terms of energy absorption.
The maximum force and the resulting acceleration can be estimated based on the Dynamic Increase Factor (DIF) models available in the literature. Table A1 (in the Appendix A) summarizes the calculated tensile strengths for different rubber contents according to five representative models proposed in recent studies. It is evident that the model proposed by Lan et al. [], with forecasts below 1 MPa, underestimates the tensile strength, whereas that of Huang et al. [], with forecasts above 100 MPa, significantly overestimates it. The models by Ye et al. [] and Elzeadani et al. [] provide intermediate and more realistic estimates.
The maximum tensile strength required for a “forgiving” concrete element still needs to be determined through finite-element modeling. Nevertheless, based on the estimations from the Ye et al. and Elzeadani et al. models, a rubber content of 15–20% appears sufficient to achieve the desired strength reduction, within an approximate range of 3 MPa. These comparisons demonstrate that the predictive capacity of existing DIF models for rubberized concrete remains limited, particularly at low strain rates. However, the present results help narrow the realistic range of dynamic strength for low-strength, rubber- and fiber-modified concretes.
In this context, the present experimental findings provide a valuable quantitative benchmark for refining and validating future DIF models, thereby bridging the gap between empirical formulations and practical design applications.
3.2.4. Quantitative Comparison of Rubber and Fiber Effects
To better interpret the dynamic flexural response, the strain rate during impact was estimated based on the hammer velocity and the specimen height, yielding values of approximately 2.5–3.0 s−1. These strain rates are relevant to low-rate impact conditions typically encountered during vehicle–barrier collisions.
The quantitative comparison of the different mixtures clearly demonstrates that fiber reinforcement is the dominant factor influencing flexural energy absorption. For example, when 0.6% polymer fibers (by volume) were incorporated, the absorbed energy reached approximately 9000 J/m2, compared with about 187 J/m2 typically reported for conventional B-40 grade concrete—an improvement of more than one order of magnitude. In contrast, rubber contributed only a modest increase, primarily related to enhanced deformability and damping rather than crack-bridging resistance.
When both rubber and fibers were used together, the rubber effect became secondary, while fibers governed post-cracking behavior through bridging and pull-out mechanisms. Increasing the fiber content beyond 0.6% led to only limited further improvement (<15%), indicating diminishing returns at higher fiber volumes.
Overall, these results show that a combination of 10–20% recycled rubber aggregate with 0.6% polymer fibers provides an effective balance between controlled strength reduction and substantial flexural energy absorption. This data-driven insight forms a strong basis for selecting mix proportions for forgiving and sustainable concrete safety barrier designs, as discussed in Section 4.
4. Conclusions
This study experimentally evaluated the quasi-static and low-rate dynamic flexural behavior of low-strength concrete modified with recycled crumb rubber and polymer fibers, aiming to support the development of forgiving and sustainable road safety barriers.
The incorporation of recycled tire rubber reduced compressive strength as expected but improved deformability and energy dissipation capabilities. While the rubber contribution to flexural energy absorption was relatively small, polymer fibers had a dominant influence. At a fiber dosage of 0.6% by volume, the absorbed energy reached approximately 9000 J/m2, compared with 187 J/m2 reported for conventional B-40 concrete, demonstrating an improvement of over one order of magnitude in flexural toughness. Increasing the fiber content beyond 0.6% led to diminishing returns, indicating that the initial addition of fiber is the most efficient for impact-related performance gains.
Dynamic testing revealed higher energy absorption compared with quasi-static loading (typically 25–35% higher, depending on fiber dosage). As fiber content increased, the difference between static and dynamic responses decreased, suggesting that quasi-static flexural testing can serve as an effective and resource-efficient indicator of impact performance at strain rates around 2.5–3 s−1—relevant to vehicle–barrier interactions.
Due to variability in pendulum hammer tests, no definitive conclusion could be drawn regarding the effect of rubber content on peak deceleration, and further research is needed with direct measurement of acceleration and reaction forces during impact. However, the consistent superiority of mixtures containing ≥0.6% fibers in absorbed energy performance demonstrates that rubber- and fiber-modified low-strength concrete is a feasible candidate for safety barrier implementation even before full quantification of strain-rate effects on acceleration reduction.
In summary, this study provides new insights into the flexural impact response of rubberized and fiber-reinforced concretes at realistic low strain rates, addressing a documented knowledge gap in the literature. Future work should focus on the following:
(1) Advanced instrumentation to directly measure acceleration during barrier impact, (2) microstructural analysis of fiber–matrix and rubber–matrix interactions, and (3) predictive modeling linking dynamic tensile strength to full-scale barrier performance.
These findings provide a quantitative basis for designing concrete safety barriers that are forgiving, energy-absorbing, and sustainable, thereby enhancing road safety while promoting the beneficial reuse of waste rubber materials.
Author Contributions
Conceptualization, A.K.; methodology, A.K. and A.A.; formal analysis, A.K. and A.A.; investigation, A.A.; data curation, A.A.; writing—original draft preparation, A.K.; visualization, A.K. and A.A.; supervision, A.K. and D.T.; project administration, A.K.; funding acquisition, A.K. and D.T. All authors have read and agreed to the published version of the manuscript.
Funding
This research received no external funding.
Institutional Review Board Statement
Not applicable.
Informed Consent Statement
Not applicable.
Data Availability Statement
The data presented in this study are openly available in Research Gate at https://doi.org/10.13140/RG.2.2.10812.35204.
Conflicts of Interest
The authors declare no conflicts of interest.
Abbreviations
The following abbreviations are used in this manuscript:
| DIF | Dynamic Increase Factor |
| Displacement | |
| Modulus of elasticity | |
| Force | |
| Concrete tensile strength | |
| Momentum of inertia | |
| Length | |
| Moment | |
| RI | Reinforcement Index |
| SHPB | Split Hopkinson Pressure Bar |
| v | Volume |
Appendix A
Table A1.
Calculated dynamic strengths according to published papers. Strain rate was taken as 3 s−1.
Table A1.
Calculated dynamic strengths according to published papers. Strain rate was taken as 3 s−1.
| Reference | Rubber (v/v) | 0% | 5% | 10% | 15% | 20% |
|---|---|---|---|---|---|---|
| (MPa) | 4.4 | 4 | 3.75 | 3 | 2.4 | |
| [] | 0.91 | 0.82 | 0.77 | 0.62 | 0.49 | |
| [] | 5.75 | 5.23 | 4.90 | 3.92 | 3.14 | |
| [] | 119.25 | 139.39 | 156.07 | 241.08 | 396.65 | |
| [] | 4.80 | 4.20 1 | ||||
| 4.95 2 | ||||||
| [] | 4.88 | 4.55 | 4.37 | 3.58 | 2.93 |
1 Parameters for 4% rubber were used for the calculation. 2 Parameters for 6% rubber were used for the calculation.
References
- Shojaati, M. Correlation between Injury Risk and Impact Severity Index ASI. In Proceedings of the 3rd Swiss Transport Research Conference, Montrux, Switzerland, 19–21 March 2003. [Google Scholar]
- Sallam, H.E.M.; Sherbini, A.S.; Seleem, M.H.; Balaha, M.M. Impact Resistance of Rubberized Concrete. ERJ. Eng. Res. J. 2008, 31, 265–271. [Google Scholar] [CrossRef]
- Polydorou, T.; Neocleous, K.; Illampas, R.; Kyriakides, N.; Alsaif, A.; Chrysostomou, C.; Pilakoutas, K.; Hadjimitsis, D. Steel Fibre-Reinforced Rubberised Concrete Barriers as Forgiving Infrastructure. In Proceedings of the FIB 2018—Proceedings for the 2018 fib Congress: Better, Smarter, Stronger, Melbourne, Australia, 7–11 October 2019. [Google Scholar]
- Atahan, A.O.; Sevim, U.K. Testing and Comparison of Concrete Barriers Containing Shredded Waste Tire Chips. Mater. Lett. 2008, 62, 3754–3757. [Google Scholar] [CrossRef]
- Pan, L.; Hao, H.; Cui, J.; Pham, T.M. Numerical Study on Impact Resistance of Rubberised Concrete Roadside Barrier. Adv. Struct. Eng. 2023, 26, 17–35. [Google Scholar] [CrossRef]
- Rashad, A.M. A Comprehensive Overview about Recycling Rubber as Fine Aggregate Replacement in Traditional Cementitious Materials. Int. J. Sustain. Built Environ. 2016, 5, 46–82. [Google Scholar] [CrossRef]
- Guo, Y.C.; Zhang, J.H.; Chen, G.; Chen, G.M.; Xie, Z.H. Fracture Behaviors of a New Steel Fiber Reinforced Recycled Aggregate Concrete with Crumb Rubber. Constr. Build. Mater. 2014, 53, 32–39. [Google Scholar] [CrossRef]
- Atahan, A.O.; Yücel, A.Ö. Crumb Rubber in Concrete: Static and Dynamic Evaluation. Constr. Build. Mater. 2012, 36, 617–622. [Google Scholar] [CrossRef]
- Khaloo, A.R.; Dehestani, M.; Rahmatabadi, P. Mechanical Properties of Concrete Containing a High Volume of Tire-Rubber Particles. Waste Manag. 2008, 28, 2472–2482. [Google Scholar] [CrossRef]
- Gillani, S.A.A.; Riaz, M.R.; Hameed, R.; Qamar, A.; Toumi, A.; Turatsinze, A. Fracture Energy of Fiber-Reinforced and Rubberized Cement-Based Composites: A Sustainable Approach towards Recycling of Waste Scrap Tires. Energy Environ. 2022, 34, 1509–1523. [Google Scholar] [CrossRef]
- Chen, A.; Han, X.; Chen, M.; Wang, X.; Wang, Z.; Guo, T. Mechanical and Stress-Strain Behavior of Basalt Fiber Reinforced Rubberized Recycled Coarse Aggregate Concrete. Constr. Build. Mater. 2020, 260, 119888. [Google Scholar] [CrossRef]
- Segre, N.; Joekes, I.; Galves, A.D.; Rodrigues, J.A. Rubber-Mortar Composites: Effect of Composition on Properties. J. Mater. Sci. 2004, 39, 3319–3327. [Google Scholar] [CrossRef]
- Paul, S.C.; Islam, S.; Al Mamun, A.; Islam, N.; Babafemi, A.J.; Kong, S.Y.; Miah, M.J. Treated Waste Tire Using Cement Coating as Coarse Aggregate in the Production of Sustainable Green Concrete. Eng 2023, 4, 1432–1445. [Google Scholar] [CrossRef]
- Assaggaf, R.A.; Maslehuddin, M.; Al-Dulaijan, S.U.; Al-Osta, M.A.; Ali, M.R.; Shameem, M. Cost-Effective Treatment of Crumb Rubber to Improve the Properties of Crumb-Rubber Concrete. Case Stud. Constr. Mater. 2022, 16. [Google Scholar] [CrossRef]
- Shahzad, K.; Zhao, Z. Experimental Study of NaOH Pretreated Crumb Rubber as Substitute of Fine Aggregate in Concrete. Constr. Build. Mater. 2022, 358, 129448. [Google Scholar] [CrossRef]
- Swilam, A.; Tahwia, A.M.; Youssf, O. Effect of Rubber Heat Treatment on Rubberized-Concrete Mechanical Performance. J. Compos. Sci. 2022, 6, 290. [Google Scholar] [CrossRef]
- Kumar, R.; Dev, N. Assessment of Mechanical and Impact Resistance Properties of Rubberized Concrete After Surface Modification of Rubber Crumb. Iran. J. Sci. Technol.-Trans. Civ. Eng. 2022, 46, 2855–2871. [Google Scholar] [CrossRef]
- Noor Azline, M.N.; Nabilah, A.B.; Nor Azizi, S.; Farah Nora Aznieta, A.A. A Comparative Investigation on Mechanical Strength of Blended Concrete with Surface Modified Rubber by Chemical and Non-Chemical Approaches. Case Stud. Constr. Mater. 2022, 17, e01444. [Google Scholar] [CrossRef]
- Kumar, R.; Dev, N. Mechanical and Microstructural Properties of Rubberized Concrete After Surface Modification of Waste Tire Rubber Crumb. Arab. J. Sci. Eng. 2022, 47, 4571–4587. [Google Scholar] [CrossRef]
- Chen, X.; Shi, X.; Zhang, S.; Chen, H.; Zhou, J.; Yu, Z.; Huang, P. Fiber-Reinforced Cemented Paste Backfill: The Effect of Fiber on Strength Properties and Estimation of Strength Using Nonlinear Models. Materials 2020, 13, 718. [Google Scholar] [CrossRef] [PubMed]
- Konrád, P.; Sovják, R. Energy-Based Approach for Studying Fibre-Reinforced Concrete Subjected to Impact Loading. Int. J. Concr. Struct. Mater. 2022, 16, 26. [Google Scholar] [CrossRef]
- Taghipoor, H.; Sadeghian, A. Experimental Investigation of Single and Hybrid-Fiber Reinforced Concrete under Drop Weight Test. Structures 2022, 43, 1073–1083. [Google Scholar] [CrossRef]
- Mohamed, S.; Elemam, H.; Seleem, M.H.; Sallam, H.E.D.M. Effect of Fiber Addition on Strength and Toughness of Rubberized Concretes. Sci. Rep. 2024, 14, 4346. [Google Scholar] [CrossRef]
- Zhang, D.; Tu, H.; Li, Y.; Weng, Y. Effect of Fiber Content and Fiber Length on the Dynamic Compressive Properties of Strain-Hardening Ultra-High Performance Concrete. Constr. Build. Mater. 2022, 328, 127024. [Google Scholar] [CrossRef]
- Xie, J.; Zhao, J.; Wang, J.; Fang, C.; Yuan, B.; Wu, Y. Impact Behaviour of Fly Ash and Slag-Based Geopolymeric Concrete: The Effects of Recycled Aggregate Content, Water-Binder Ratio and Curing Age. Constr. Build. Mater. 2022, 331, 127359. [Google Scholar] [CrossRef]
- Guo, Y.B.; Gao, G.F.; Jing, L.; Shim, V.P.W. Response of High-Strength Concrete to Dynamic Compressive Loading. Int. J. Impact Eng. 2017, 108, 114–135. [Google Scholar] [CrossRef]
- Su, Y.; Li, J.; Wu, C.; Wu, P.; Li, Z.X. Influences of Nano-Particles on Dynamic Strength of Ultra-High Performance Concrete. Compos. B Eng. 2016, 91, 595–609. [Google Scholar] [CrossRef]
- Hao, Y.; Hao, H. Dynamic Compressive Behaviour of Spiral Steel Fibre Reinforced Concrete in Split Hopkinson Pressure Bar Tests. Constr. Build. Mater. 2013, 48, 521–532. [Google Scholar] [CrossRef]
- Su, H.; Xu, J. Dynamic Compressive Behavior of Ceramic Fiber Reinforced Concrete under Impact Load. Constr. Build. Mater. 2013, 45, 306–313. [Google Scholar] [CrossRef]
- Su, Y.; Li, J.; Wu, C.; Wu, P.; Li, Z.X. Effects of Steel Fibres on Dynamic Strength of UHPC. Constr. Build. Mater. 2016, 114, 708–718. [Google Scholar] [CrossRef]
- Yang, R.; Xu, Y.; Chen, P.; Wang, J. Experimental Study on Dynamic Mechanics and Energy Evolution of Rubber Concrete under Cyclic Impact Loading and Dynamic Splitting Tension. Constr. Build. Mater. 2020, 262, 120071. [Google Scholar] [CrossRef]
- Gan, L.; Liu, Y.; Zhang, Z.; Shen, Z.; Li, L.; Zhang, H.; Jin, H.; Xu, W. Experimental Investigation of the Dynamic Mechanical Properties of Concrete under Different Strain Rates and Cyclic Loading. Case Stud. Constr. Mater. 2024, 20, e02750. [Google Scholar] [CrossRef]
- Devi, N.R.; Dhir, P.K.; Sarkar, P. Influence of Strain Rate on the Mechanical Properties of Autoclaved Aerated Concrete. J. Build. Eng. 2022, 57, 104830. [Google Scholar] [CrossRef]
- Lai, D.; Demartino, C.; Xiao, Y. High-Strain Rate Compressive Behavior of Fiber-Reinforced Rubberized Concrete. Constr. Build. Mater. 2022, 319, 125739. [Google Scholar] [CrossRef]
- Feng, W.; Chen, B.; Tang, Y.; Wei, W.; He, W.; Yang, Y. Structural Effects and Real Strain-Rate Effects on Compressive Strength of Sustainable Concrete with Crumb Rubber in Split Hopkinson Pressure Bar Tests. Arch. Civ. Mech. Eng. 2022, 22, 136. [Google Scholar] [CrossRef]
- Gary, G.; Bailly, P. Behaviour of a Quasi-Brittle Material at High Strain Rate. Experiment and Modelling Experiment and Modelling. Eur. J. Mech.-A/Solids 1998, 17, 403–420. [Google Scholar] [CrossRef]
- Cui, D.; Wang, L.; Zhang, C.; Xue, H.; Gao, D.; Chen, F. Dynamic Splitting Performance and Energy Dissipation of Fiber-Reinforced Concrete under Impact Loading. Materials 2024, 17, 421. [Google Scholar] [CrossRef]
- Feng, W.; Liu, F.; Yang, F.; Jing, L.; Li, L.; Li, H.; Chen, L. Compressive Behaviour and Fragment Size Distribution Model for Failure Mode Prediction of Rubber Concrete under Impact Loads. Constr. Build. Mater. 2021, 273, 121767. [Google Scholar] [CrossRef]
- Huang, J.K.; Jiang, P.W.; Qian, Y.D.; Cheng, P.; Lou, R.; Luo, X. Research on Mechanical Property and Impact Performance of Composite Rubber Hybrid Fiber Concrete. Arab. J. Sci. Eng. 2023, 48, 4339–4355. [Google Scholar] [CrossRef]
- Zhang, A.; Liu, K.; Li, J.; Song, R.; Guo, T. Static and Dynamic Tensile Properties of Ultra-High Performance Concrete (UHPC) Reinforced with Hybrid Sisal Fibers. Constr. Build. Mater. 2024, 411, 134492. [Google Scholar] [CrossRef]
- Chen, T.; Wang, Z.; Wang, A.; Bai, E.; Zhu, X. Comparative Study on the Static and Dynamic Mechanical Properties and Micro-Mechanism of Carbon Fiber and Carbon Nanofiber Reinforced Concrete. Case Stud. Constr. Mater. 2023, 18, e01827. [Google Scholar] [CrossRef]
- Liu, F.; Chen, G.; Li, L.; Guo, Y. Study of Impact Performance of Rubber Reinforced Concrete. Constr. Build. Mater. 2012, 36, 604–616. [Google Scholar] [CrossRef]
- Feng, S.; Zhou, Y.; Li, Q.M. Damage Behavior and Energy Absorption Characteristics of Foamed Concrete under Dynamic Load. Constr. Build. Mater. 2022, 357, 129340. [Google Scholar] [CrossRef]
- Zheng, L.; Huo, X.S.; Yuan, Y. Experimental Investigation on Dynamic Properties of Rubberized Concrete. Constr. Build. Mater. 2008, 22, 939–947. [Google Scholar] [CrossRef]
- Najim, K.B.; Hall, M.R. Mechanical and Dynamic Properties of Self-Compacting Crumb Rubber Modified Concrete. Constr. Build. Mater. 2012, 27, 521–530. [Google Scholar] [CrossRef]
- Mu, Y.; Xia, H.; Yan, Y.; Wang, Z.; Guo, R. Fracture Behavior of Basalt Fiber-Reinforced Airport Pavement Concrete at Different Strain Rates. Materials 2022, 15, 7379. [Google Scholar] [CrossRef]
- Pham, T.M.; Zhang, X.; Elchalakani, M.; Karrech, A.; Hao, H.; Ryan, A. Dynamic Response of Rubberized Concrete Columns with and without FRP Confinement Subjected to Lateral Impact. Constr. Build. Mater. 2018, 186, 207–218. [Google Scholar] [CrossRef]
- Li, Y.F.; Ramanathan, G.K.; Syu, J.Y.; Huang, C.H.; Tsai, Y.K. Mechanical Behavior of Different Fiber Lengths Mix-Proportions Carbon Fiber Reinforced Concrete Subjected to Static, Impact, and Blast Loading. Int. J. Prot. Struct. 2024, 15, 43–64. [Google Scholar] [CrossRef]
- Yan, S.; Dong, Q.; Chen, X.; Li, J.; Wang, X.; Shi, B. An Experimental and Numerical Study on the Hybrid Effect of Basalt Fiber and Polypropylene Fiber on the Impact Toughness of Fiber Reinforced Concrete. Constr. Build. Mater. 2024, 411, 134270. [Google Scholar] [CrossRef]
- Hentz, S.; Donzé, F.V.; Daudeville, L. Discrete Element Modelling of Concrete Submitted to Dynamic Loading at High Strain Rates. Comput. Struct. 2004, 82, 2509–2524. [Google Scholar] [CrossRef]
- Shkolnikov, M.B. Strain Rates in Crashworthiness. In Proceedings of the 8th International LS-Dyna Users Conference, Troy, MI, USA, 2–4 May 2004. [Google Scholar]
- EN 197-1:2011; Cement—Part 1: Composition, Specifications and Conformity Criteria for Common Cements. British Standard Institute: London, UK, 2011.
- EN 12350-6:2009; Testing Fresh Concrete—Part 6: Density. British Standard Institute: London, UK, 2009.
- EN 12350-2:2009; Testing Fresh Concrete—Part 2: Slump-Test. British Standard Institute: London, UK, 2009.
- EN 12350-7:2009; Testing Fresh Concrete—Part 7: Air Content—Pressure Methods. British Standard Institute: London, UK, 2009.
- EN 12390-3:2019; Testing Hardened Concrete—Part 3: Compressive Strength of Test Specimens. British Standard Institute: London, UK, 2019.
- EN 12390-5:2019; Testing Hardened Concrete—Part 5: Flexural Strength of Test Specimens. British Standard Institute: London, UK, 2019.
- Li, N.; Long, G.; Ma, C.; Fu, Q.; Zeng, X.; Ma, K.; Xie, Y.; Luo, B. Properties of Self-Compacting Concrete (SCC) with Recycled Tire Rubber Aggregate: A Comprehensive Study. J. Clean. Prod. 2019, 236, 117707. [Google Scholar] [CrossRef]
- Taha, M.M.R.; El-Dieb, A.S.; El-Wahab, M.A.A.; Abdel-Hameed, M.E. Mechanical, Fracture, and Microstructural Investigations of Rubber Concrete. J. Mater. Civ. Eng. 2008, 20, 640–649. [Google Scholar] [CrossRef]
- Marie, I. Zones of Weakness of Rubberized Concrete Behavior Using the UPV. J. Clean. Prod. 2016, 116, 217–222. [Google Scholar] [CrossRef]
- Li, Y.; Zhang, X.; Wang, R.; Lei, Y. Performance Enhancement of Rubberised Concrete via Surface Modification of Rubber: A Review. Constr. Build. Mater. 2019, 227, 116691. [Google Scholar] [CrossRef]
- Raffoul, S.; Garcia, R.; Pilakoutas, K.; Guadagnini, M.; Medina, N.F. Optimisation of Rubberised Concrete with High Rubber Content: An Experimental Investigation. Constr. Build. Mater. 2016, 124, 391–404. [Google Scholar] [CrossRef]
- Ganjian, E.; Khorami, M.; Maghsoudi, A.A. Scrap-Tyre-Rubber Replacement for Aggregate and Filler in Concrete. Constr. Build. Mater. 2009, 23, 1828–1836. [Google Scholar] [CrossRef]
- Liu, F.; Zheng, W.; Li, L.; Feng, W.; Ning, G. Mechanical and Fatigue Performance of Rubber Concrete. Constr. Build. Mater. 2013, 47, 711–719. [Google Scholar] [CrossRef]
- Aliabdo, A.A.; Abd Elmoaty, A.E.M.; Abdelbaset, M.M. Utilization of Waste Rubber in Non-Structural Applications. Constr. Build. Mater. 2015, 91, 195–207. [Google Scholar] [CrossRef]
- Girskas, G.; Nagrockienė, D. Crushed Rubber Waste Impact of Concrete Basic Properties. Constr. Build. Mater. 2017, 140, 36–42. [Google Scholar] [CrossRef]
- Lavagna, L.; Nisticò, R.; Sarasso, M.; Pavese, M. An Analytical Mini-Review on the Compression Strength of Rubberized Concrete as a Function of the Amount of Recycled Tires Crumb Rubber. Materials 2020, 13, 1234. [Google Scholar] [CrossRef] [PubMed]
- Hu, Y.; Sun, X.; Ma, A.; Gao, P. An Experimental Study on the Basic Mechanical Properties and Compression Size Effect of Rubber Concrete with Different Substitution Rates. Adv. Civ. Eng. 2020, 2020, 8851187. [Google Scholar] [CrossRef]
- Hsie, M.; Tu, C.; Song, P.S. Mechanical Properties of Polypropylene Hybrid Fiber-Reinforced Concrete. Mater. Sci. Eng. A 2008, 494, 153–157. [Google Scholar] [CrossRef]
- Shi, X.; Park, P.; Rew, Y.; Huang, K.; Sim, C. Constitutive Behaviors of Steel Fiber Reinforced Concrete under Uniaxial Compression and Tension. Constr. Build. Mater. 2020, 233, 117316. [Google Scholar] [CrossRef]
- Löfgren, I. Fibre-Reinforced Concrete for Industrial Construction-a Fracture Mechanics Approach to Material Testing and Structural Analysis. Ph.D. Thesis, Chalmers University of Technology, Göteborg, Sweden, 2005. [Google Scholar]
- Toutanji, H.A. The Use of Rubber Tire Particles in Concrete to Replace Mineral Aggregates. Cem. Concr. Compos. 1996, 18, 135–139. [Google Scholar] [CrossRef]
- Su, H.; Yang, J.; Ling, T.C.; Ghataora, G.S.; Dirar, S. Properties of Concrete Prepared with Waste Tyre Rubber Particles of Uniform and Varying Sizes. J. Clean. Prod. 2015, 91, 288–296. [Google Scholar] [CrossRef]
- Thomas, B.S.; Gupta, R.C.; John Panicker, V. Experimental and Modelling Studies on High Strength Concrete Containing Waste Tire Rubber. Sustain. Cities Soc. 2015, 19, 68–73. [Google Scholar] [CrossRef]
- Thomas, B.S.; Gupta, R.C. Long Term Behaviour of Cement Concrete Containing Discarded Tire Rubber. J. Clean. Prod. 2015, 102, 78–87. [Google Scholar] [CrossRef]
- Al-Tayeb, M.M.; Abu Bakar, B.H.; Ismail, H.; Md Akil, H. Effect of Partial Replacement of Sand by Fine Crumb Rubber on Impact Load Behavior of Concrete Beam: Experiment and Nonlinear Dynamic Analysis. Mater. Struct./Mater. Constr. 2013, 46, 1299–1307. [Google Scholar] [CrossRef]
- Al-Tayeb, M.M.; Abu Bakar, B.H.; Ismail, H.; Akil, H.M. Effect of Partial Replacement of Sand by Recycled Fine Crumb Rubber on the Performance of Hybrid Rubberized-Normal Concrete under Impact Load: Experiment and Simulation. J. Clean. Prod. 2013, 59, 284–289. [Google Scholar] [CrossRef]
- Liu, G.; Li, D. Analysis of Synergistic Effect of Bending Energy Absorption Capacity of Fiber Reinforced Concrete Based on Fiber Distribution Characteristic. Constr. Build. Mater. 2024, 447, 138098. [Google Scholar] [CrossRef]
- Aiello, M.A.; Leuzzi, F. Waste Tyre Rubberized Concrete: Properties at Fresh and Hardened State. Waste Manag. 2010, 30, 1696–1704. [Google Scholar] [CrossRef]
- Najim, K.B.; Hall, M.R. A Review of the Fresh/Hardened Properties and Applications for Plain- (PRC) and Self-Compacting Rubberised Concrete (SCRC). Constr. Build. Mater. 2010, 24, 2043–2051. [Google Scholar] [CrossRef]
- Beiram, A.A.H.; Al-Mutairee, H.M.K. The Effect of Chip Rubber on the Properties of Concrete. Mater. Today Proc. 2022, 60, 1981–1988. [Google Scholar] [CrossRef]
- Topçu, I.B.; Avcular, N. Collision Behaviours of Rubberized Concrete. Cem. Concr. Res. 1997, 27, 1893–1898. [Google Scholar] [CrossRef]
- Thakur, A.; Senthil, K.; Singh, A.P. Evaluation of Concrete Bricks with Crumb Rubber and Polypropylene Fibres under Impact Loading. Constr. Build. Mater. 2022, 315, 125752. [Google Scholar] [CrossRef]
- Hossain, F.M.Z.; Shahjalal, M.; Islam, K.; Tiznobaik, M.; Alam, M.S. Mechanical Properties of Recycled Aggregate Concrete Containing Crumb Rubber and Polypropylene Fiber. Constr. Build. Mater. 2019, 225, 983–996. [Google Scholar] [CrossRef]
- Wang, G.; Zhuang, Y.; Song, L.; He, Z.; Zhang, J.; Zhou, H. Mechanical Properties and Failure Mechanism of Fiber-Reinforced Concrete Materials: Effects of Fiber Type and Content. Constr. Build. Mater. 2025, 465, 140190. [Google Scholar] [CrossRef]
- Ahmad, J.; Burduhos-Nergis, D.D.; Arbili, M.M.; Alogla, S.M.; Majdi, A.; Deifalla, A.F. A Review on Failure Modes and Cracking Behaviors of Polypropylene Fibers Reinforced Concrete. Buildings 2022, 12, 1951. [Google Scholar] [CrossRef]
- Kobaka, J. A Statistical Model of Fibre Distribution in a Steel Fibre Reinforced Concrete. Materials 2021, 14, 7297. [Google Scholar] [CrossRef]
- Zhao, M.; Li, J.; Xie, Y.M. Effect of Vibration Time on Steel Fibre Distribution and Flexural Behaviours of Steel Fibre Reinforced Concrete with Different Flowability. Case Stud. Constr. Mater. 2022, 16, e01114. [Google Scholar] [CrossRef]
- Mohana Kumar, L.; Zeng, C.; Foster, S.J. A Stereological Approach to Estimation of Fibre Distribution in Concrete. Constr. Build. Mater. 2022, 324, 126547. [Google Scholar] [CrossRef]
- Zhao, Y.; Bi, J.; Zhou, J.; Liu, X.; Li, X.; Geng, W. The Effect of Fiber Volume Fraction on Fiber Distribution in Steel Fiber Reinforced Self-Compacting Concrete. Buildings 2023, 13, 1125. [Google Scholar] [CrossRef]
- Alberti, M.G.; Enfedaque, A.; Gálvez, J.C. A Review on the Assessment and Prediction of the Orientation and Distribution of Fibres for Concrete. Compos. Part B Eng. 2018, 151, 274–290. [Google Scholar] [CrossRef]
- Guo, H.; Du, C.; Chen, Y.; Li, D.; Hu, W.; Lv, X. Study on Protective Performance of Impact-Resistant Polyurea and Its Coated Concrete under Impact Loading. Constr. Build. Mater. 2022, 340, 127749. [Google Scholar] [CrossRef]
- Hibbeler, R.C. Structural Analysis, 5th international ed.; Prentice Hall: Saddle River, NJ, USA, 2002. [Google Scholar]
- Geng, Y.; Leung, C.K.Y. A Microstructural Study of Fibre/Mortar Interfaces during Fibre Debonding and Pull-Out. J. Mater. Sci. 1996, 31, 1285–1294. [Google Scholar] [CrossRef]
- Xiao, J.; Li, L.; Shen, L.; Poon, C.S. Compressive Behaviour of Recycled Aggregate Concrete under Impact Loading. Cem. Concr. Res. 2015, 71, 46–55. [Google Scholar] [CrossRef]
- Li, W.; Luo, Z.; Long, C.; Wu, C.; Duan, W.H.; Shah, S.P. Effects of Nanoparticle on the Dynamic Behaviors of Recycled Aggregate Concrete under Impact Loading. Mater. Des. 2016, 112, 58–66. [Google Scholar] [CrossRef]
- Lan, S.; Liu, F.; Yang, F.; Li, H.; Chen, D.; Xu, K.; Zhang, H.; Kuang, J.; Fang, Z.; Feng, W. Dynamic Compressive and Splitting Tensile Characteristics of Rubber-Modified Non-Autoclaved Concrete Pipe Piles. J. Build. Eng. 2023, 69, 106292. [Google Scholar] [CrossRef]
- Huang, Z.; Pan, W.; Du, S.; Zhou, Y.; Ye, J. Dynamic Splitting Behavior of Ultra-Lightweight Cement Composite with Rubber and Polyethylene Fiber. Constr. Build. Mater. 2023, 399, 132577. [Google Scholar] [CrossRef]
- Ye, H.; Pan, J.; Zhu, B.; Lin, Y.; Cai, J. Dynamic Splitting Tensile Properties of Crumb Rubber Modified Ultra-High Performance Engineered Cementitious Composites (UHP-ECC). Constr. Build. Mater. 2024, 455, 139183. [Google Scholar] [CrossRef]
- Elzeadani, M.; Bompa, D.V.; Elghazouli, A.Y. Compressive and Splitting Tensile Impact Properties of Rubberised One-Part Alkali-Activated Concrete. J. Build. Eng. 2023, 71, 106596. [Google Scholar] [CrossRef]
- Feng, L.; Chen, X.; Zhang, J.; Chen, C. Experimental and Mesoscopic Investigation of Self-Compacting Rubberized Concrete under Dynamic Splitting Tension. J. Build. Eng. 2022, 57, 104942. [Google Scholar] [CrossRef]
Disclaimer/Publisher’s Note: The statements, opinions and data contained in all publications are solely those of the individual author(s) and contributor(s) and not of MDPI and/or the editor(s). MDPI and/or the editor(s) disclaim responsibility for any injury to people or property resulting from any ideas, methods, instructions or products referred to in the content. |
© 2025 by the authors. Licensee MDPI, Basel, Switzerland. This article is an open access article distributed under the terms and conditions of the Creative Commons Attribution (CC BY) license (https://creativecommons.org/licenses/by/4.0/).