1. Introduction
Composite materials, with their outstanding specific strength, corrosion resistance and designability, have become core materials for high-end equipment such as aerospace, rail transit and wind turbine blades. Take high-speed rail as an example. The composite material components applied in modern EMU bodies are gradually changing from non-load-bearing parts to secondary load-bearing parts and then to main load-bearing parts, such as from skirt plates, seats and interiors to equipment compartments and front-end hoods and then to bogies and bodies [
1]. This technological breakthrough has significantly improved the weight reduction effect of the body, while also enhancing the fatigue resistance and aerodynamic characteristics of the corresponding structures. Compared with metal material detection technology, the internal structure of composite materials is complex. It has the characteristics of acoustic anisotropy, a high acoustic attenuation coefficient and a strong frequency dispersion coefficient, and the defects are mostly microscopic [
2,
3]. Different types, sizes and depths of defects cause different failure forms and strength and stiffness losses in the components and have different effects on the mechanical properties of materials, which also affect the life calculation of the components. Identifying the type, size and depth of defects is of great significance for determination of material failure and life calculation and provides necessary information for formulating appropriate maintenance and repair plans [
4,
5]. During manufacturing processes such as pre-impregnation and curing, due to the influence of processing parameter fluctuations and fiber-resin interface compatibility, defects such as voids, delamination and fiber orientation deviation are easily generated inside the composite materials, among which, voids are the most common and the most difficult to detect. Studies have shown that when the void ratio increases by 1–3%, the mechanical properties of composite materials, such as tensile strength, compressive strength and shear strength in the structure, can decrease by up to 20% [
6,
7]. Therefore, accurately measuring the void defects in composite materials is crucial for ensuring material quality and avoiding future structural damage, and non-destructive testing is the most effective technology in composite material testing.
At present, the commonly used non-destructive testing methods in the field of composite materials include ultrasonic testing (UT), infrared thermography (IRT), laser ultrasonic testing (LUT), computed tomography (CT) and X-ray testing, etc. During ultrasonic testing, the equipment emits ultrasonic waves that change after passing through the material. The sensor responsible for receiving the signal collects the signal and processes it to obtain an ultrasonic image of the material’s interior and analyze the defects within it. Oguma et al. [
8] used the ultrasonic pulse velocity method to test for and locate large-scale defects and visualize them. Karabutov and Podymova [
9] obtained defect analysis results by considering the attenuation of ultrasonic energy. Infrared thermography (IRT), as a non-contact method, can quickly identify near-surface delamination and debonding defects, but its detection depth is limited and it is easily affected by the environmental temperature. Active thermography, an important branch of IRT, applies controllable thermal perturbations to the material’s surface through external heat sources such as pulsed lasers, halogen lamps or ultrasonic excitation. By leveraging the differences in heat conduction between defective areas and normal areas (for example, defects impede heat flow, leading to local temperature anomalies), it enables the imaging of internal defects such as delamination, porosity and inclusions. Ranjit Shrestha et al. [
10] employed active thermography for non-destructive evaluation of defects in glass fiber-reinforced plastic (GFRP) composites and significantly improved the signal-to-noise ratio (SNR) through data fusion techniques. The study utilized two pixel-level image fusion methods, namely principal component analysis (PCA) and discrete wavelet transform (DWT), to integrate the amplitude and phase images, thereby enhancing the accuracy and reliability of defect detection. Crane et al. [
11] used thermal imaging to detect different types of defects such as debonding, fiber breakage and penetration based on the different thermal wave responses and temperature changes of various damages. Mulaveesala et al. from India [
12] studied infrared vision and industrial imaging and used frequency-modulated thermal wave imaging technology to detect composite materials, achieving good results through post-processing. Marani et al. [
13] proposed a new method for automatically classifying subsurface defects in composite materials using pulsed thermal imaging, which achieved an accuracy and recall rate of 89.87% and 73.67%, respectively, for defect classification. Meanwhile, laser ultrasonic testing technology has been applied in many fields due to its high resolution, non-contact measurement capability and the possibility of automated detection. Aguado et al. [
14] measured the longitudinal waves of laser ultrasonic waves in the leading edge of composite material wings at the Spanish Advanced Aeronautical Technology Center, verifying the effectiveness of this method in detecting the porosity of composite materials. Kou et al. [
15] developed a fully non-contact non-destructive testing method based on laser ultrasonic testing for detecting closed surface cracks. This method demonstrated all the advantages of laser ultrasonic waves, such as fully non-contact detection, high spatial resolution and easy adaptation to surfaces with complex geometries or high temperatures. The strong penetration ability of X-rays enables them to perform tomography on objects, accurately measure the three-dimensional data of the internal structure of the object and thus accurately and intuitively observe the defects inside the structure (such as delamination, pores, inclusions, etc.) [
16]. Nikishkov et al. [
17] first proposed a method to quantify the porosity and pore size in composite materials using X-ray CT and minimize the error in pore detection. Scott et al. [
18] directly analyzed the pores in composite materials in 3D using detection images from multi-scale CT technology. Weck et al. [
19] used in-situ X-ray CT testing to observe the defect damage inside metal matrix composites.
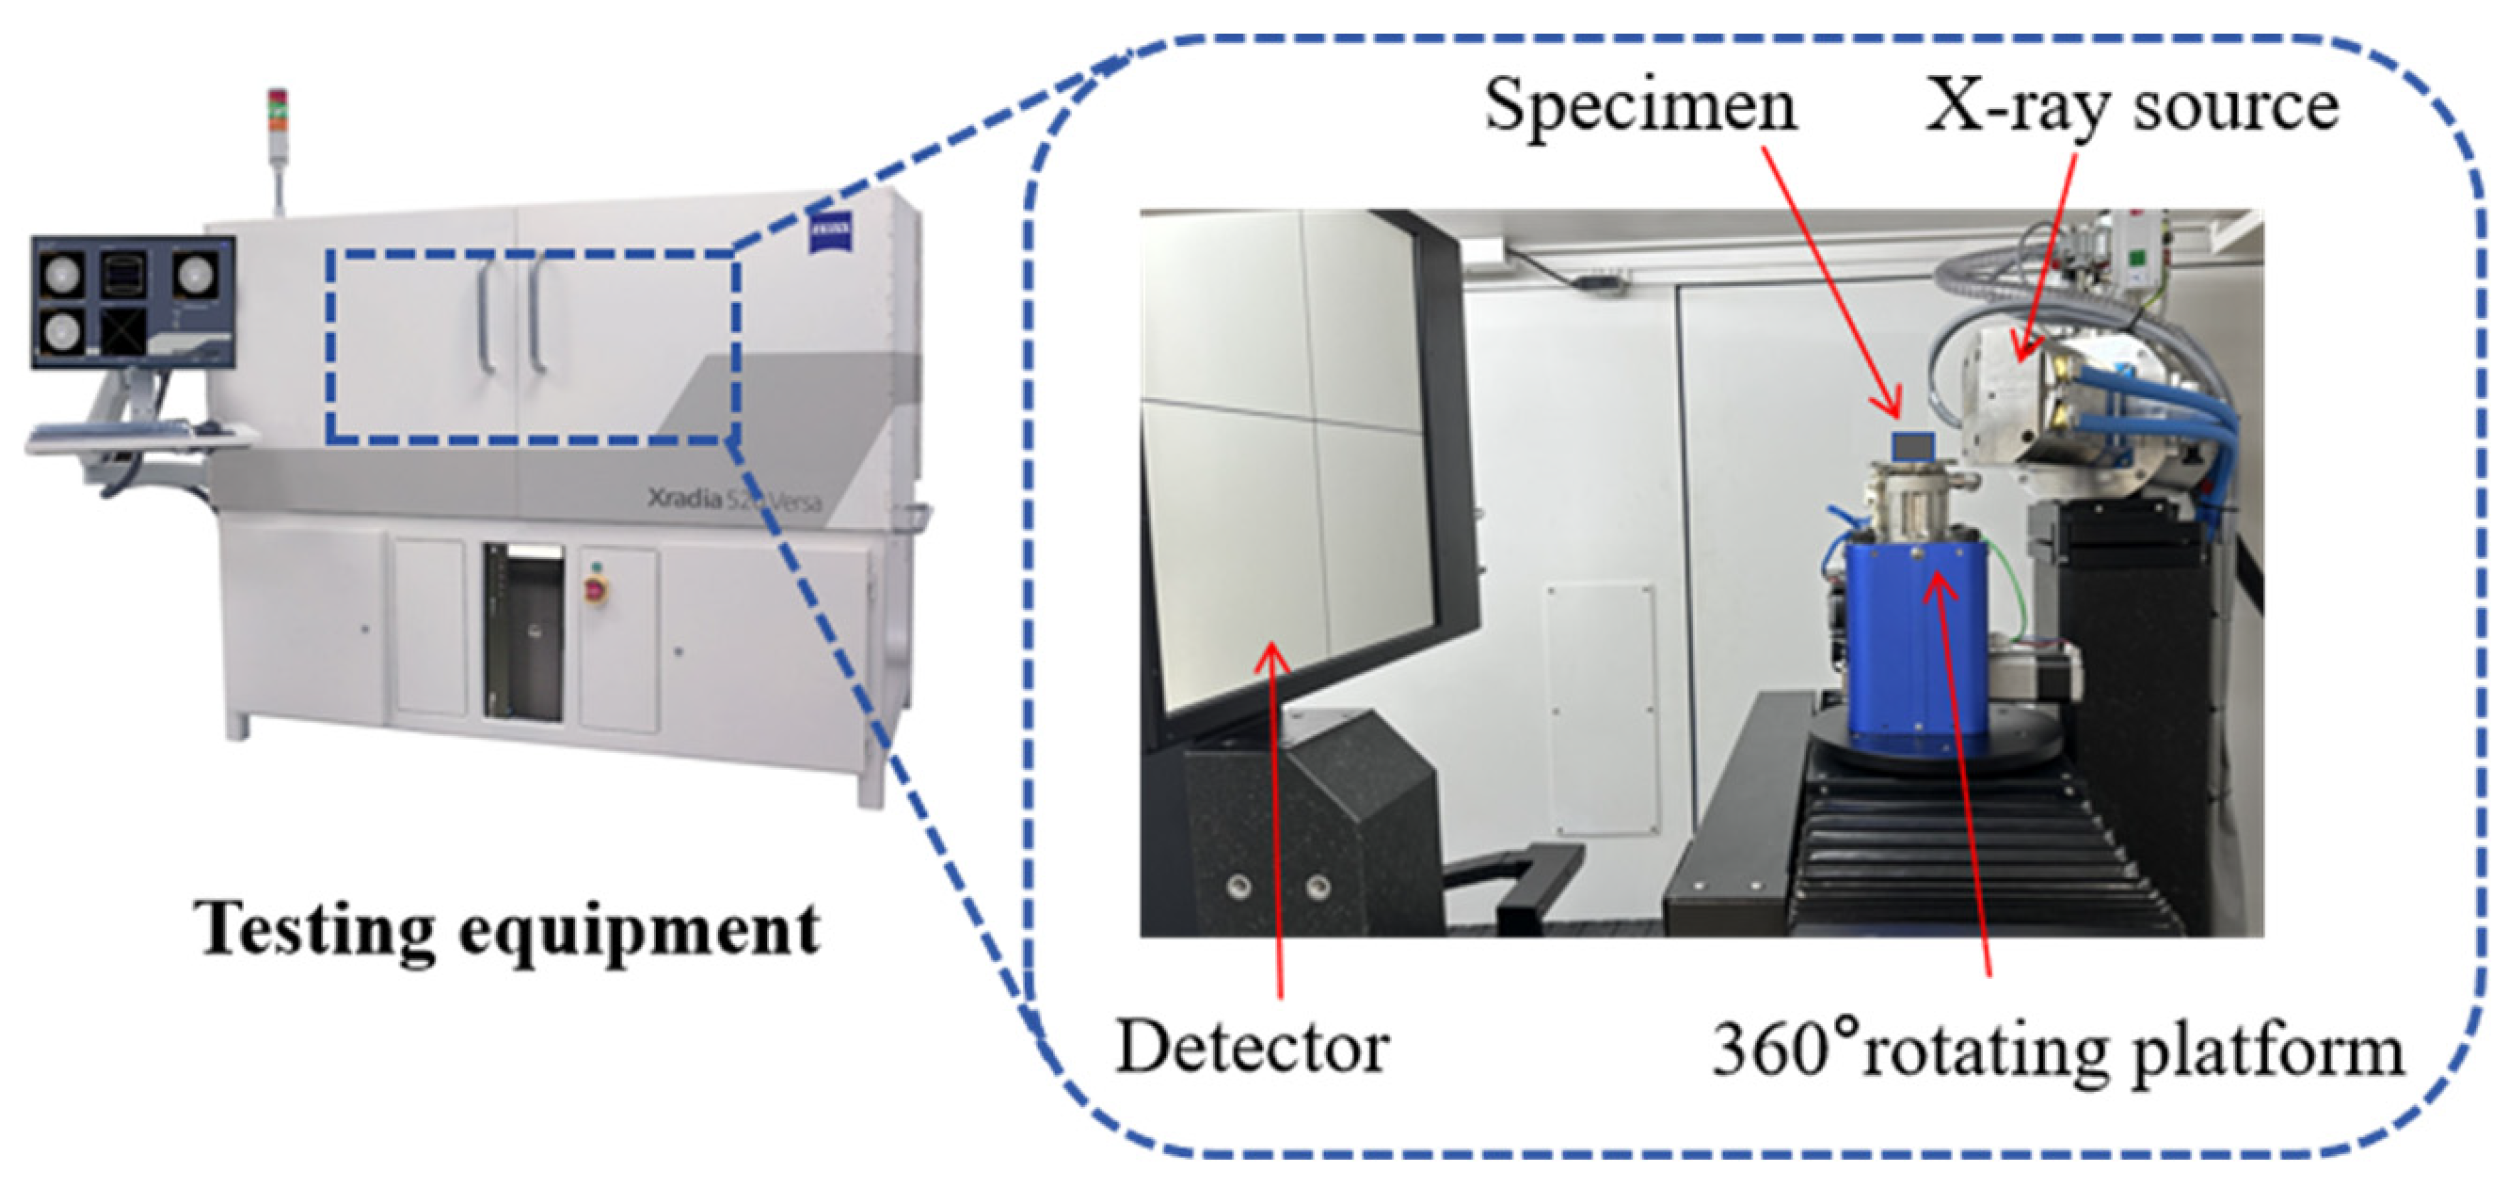
These methods often require comprehensive selection based on the detection requirements, cost budget and on-site conditions in practical applications. Multiple technologies are combined to leverage their respective advantages. This study adopted X-ray micro-computed tomography (Micro-CT) non-destructive testing technology, which combines X-ray microscopy and computed tomography. It can achieve three-dimensional visualization and quantitative analysis of the internal structure of materials without damaging the specimens. Compared with traditional methods such as ultrasonic testing or optical microscopy, Micro-CT can not only clearly present the morphology and spatial distribution of defects, but also accurately calculate the volume and quantity of defects, providing important basis for the quality control and research of composite materials [
20,
21,
22,
23]. Although CT technology has significant advantages such as high resolution and three-dimensional imaging in the field of non-destructive testing, it still faces many technical challenges in practical applications. High-density materials such as metal matrix composites are prone to severe stripe-like artifacts during the detection process due to the difference in X-ray absorption rates, including beam hardening and scattering artifacts, which often mask the characteristics of micro-defects and significantly affect the detection accuracy [
24]. At the same time, the low-dose scanning scheme adopted to reduce radiation hazards leads to a decrease in the signal-to-noise ratio of the projection data, resulting in obvious noise interference in the reconstructed images [
25]. To address these technical bottlenecks, deep learning technology shows great potential for improvement. By collecting a large amount of labeled data for data fitting and extracting the intrinsic features of the data, this process enables deep learning models to achieve effective generalization on other similar datasets, demonstrating significant performance improvement and wide applicability. Among them, algorithms such as convolutional neural networks (CNNs) and generative adversarial networks (GANs) perform outstandingly in artifact suppression. End-to-end models such as U-Net and ResNet can effectively learn the mapping relationship between artifacts and real structures, while the CycleGAN framework can achieve artifact correction without paired data. In image enhancement, super-resolution reconstruction techniques such as ESRGAN and RCAN can significantly improve the resolution of low-resolution CT images, and the self-supervised learning algorithm can effectively denoise by training only with noisy images. Experimental data show that the integration of deep learning and traditional CT technology not only increases the defect detection sensitivity by more than 30% but also significantly speeds up the image reconstruction process. With the development of lightweight models and edge computing technology, this intelligent CT detection system is expected to achieve more efficient real-time detection, bringing revolutionary progress to the field of industrial non-destructive testing [
26,
27,
28].
Although the combination of micro-CT and deep learning has been explored in the field of pore analysis of fiber-reinforced composites, the multi-dimensional characterization research of defects in multiple systems of carbon fiber, glass fiber and carbon/glass hybrid laminates remains limited. Most existing studies focus on the measurement of the porosity or defect size of a single material. Moreover, due to problems such as the overlapping grayscale of carbon fiber and pores and the close grayscale of glass fiber and resin, traditional threshold segmentation is prone to false detection and missed detection of micro-pores. In contrast, this paper innovatively proposes a technical solution of “Micro-CT + U-Net++”. For the first time, it covers CFRP, GFRP and carbon/glass hybrid laminates under a unified framework, incorporates two typical engineering ply angles of 0/90° and ±45° and constructs a multi-dimensional analysis system of “material type–ply angle–pore morphology”. Through the nested dense connection of U-Net++, the problems of fiber texture interference and boundary fuzziness are effectively solved. The false detection rate of pores (4.5–15.7%) is far better than that of traditional methods and it can simultaneously achieve multi-quantitative quantization of porosity, quantity, size classification (small/medium/large), type (intralayer/interlayer/interfacial pores) and three-dimensional structure (equivalent diameter, surface area, etc.). At the same time, in this study, through the unified scanning settings and standardized data processing procedures for six groups of specimens (C0/00, C±45, CGC0/00, CGC±45, G0/90, G±45), the comparability of pore characterization results under different systems and ply angles is ensured, providing a consistent benchmark for subsequent process optimization. In conclusion, this study fills the gaps in material universality and characterization of dimension and accuracy, and provides a more comprehensive technical path for pore analysis of fiber-reinforced composites.
In summary, most studies have focused on a single composite material, with few comparative defect analyses conducted on hybrid composites or different layup structures of the same material. This paper combines Micro-CT non-destructive testing technology and deep learning technology to study CFRP, GFRP and C/G hybrid laminates, considering two different ply angles. It conducts quantitative analyses of the porosity within the laminates, including face porosity statistics, three-dimensional porosity analysis and pore classification quantification. The aim is to provide a theoretical basis and experimental data support for the diversified applications of economically optimized composite laminates.
4. Deep Learning Processing
Due to the difficulty of distinguishing carbon fibers from pores using grayscale thresholds, problems such as blurred boundaries and incorrect component segmentation may occur. Accurate identification and classification of different types of components are the basis for analyzing the pore distribution and characteristics of carbon fiber, glass fiber and hybrid fiber boards. We utilized the deep learning module in DRAGONFLY.
Firstly, we created a high-quality training dataset using DRAGONFLY’s 3D ROI Painter tool, marking different types of pores. Each sample needed to be labeled separately, with 10 high-quality segmentation labels for each sample. Then, a deep supervision training strategy was employed, setting output branches at multiple levels of the decoder to focus on pores of different scales. Finally, multi-branch output fusion was used to improve the recognition rate of characteristic pores [
29]. The U net++ model was used for training, with Categorical Crossentropy as the loss function and Adadelta as the optimization algorithm, as shown in
Figure 5.
The deep learning framework of this study is built upon the U-Net++ architecture, which incorporates nested dense skip connections to enhance feature reuse and facilitate hierarchical feature fusion. The network comprises five convolutional blocks, with an initial filter count of 32 in the first layer, doubling progressively in each subsequent layer. Input data are single-channel 2D slices of dimension 512 × 512 × 1, specifically formatted to match the spatial resolution of Micro-CT images. For model training, the Categorical Crossentropy loss function is employed to address multi-class segmentation tasks. The initial learning rate is set to 1.0 and is dynamically adjusted using a ReduceLROnPlateau scheduling strategy, which reduces the learning rate by a predefined factor upon observing no improvement in validation loss over 10 consecutive epochs. To ensure training stability and prevent overfitting, early stopping is implemented when the validation loss plateaus for 15 successive epochs. Additionally, model checkpoints are saved whenever an improvement in validation performance is detected, preserving the optimal model state throughout training. The dataset is partitioned into a training set containing 144 image patches and a validation set comprising 2 patches. Training is conducted over 100 epochs, with computational time and key performance metrics (e.g., accuracy, Dice coefficient) recorded at each epoch in real time. This configuration ensures adequate model exposure to the training data while maintaining a reserved subset for unbiased validation, thereby supporting robust evaluation of segmentation performance.
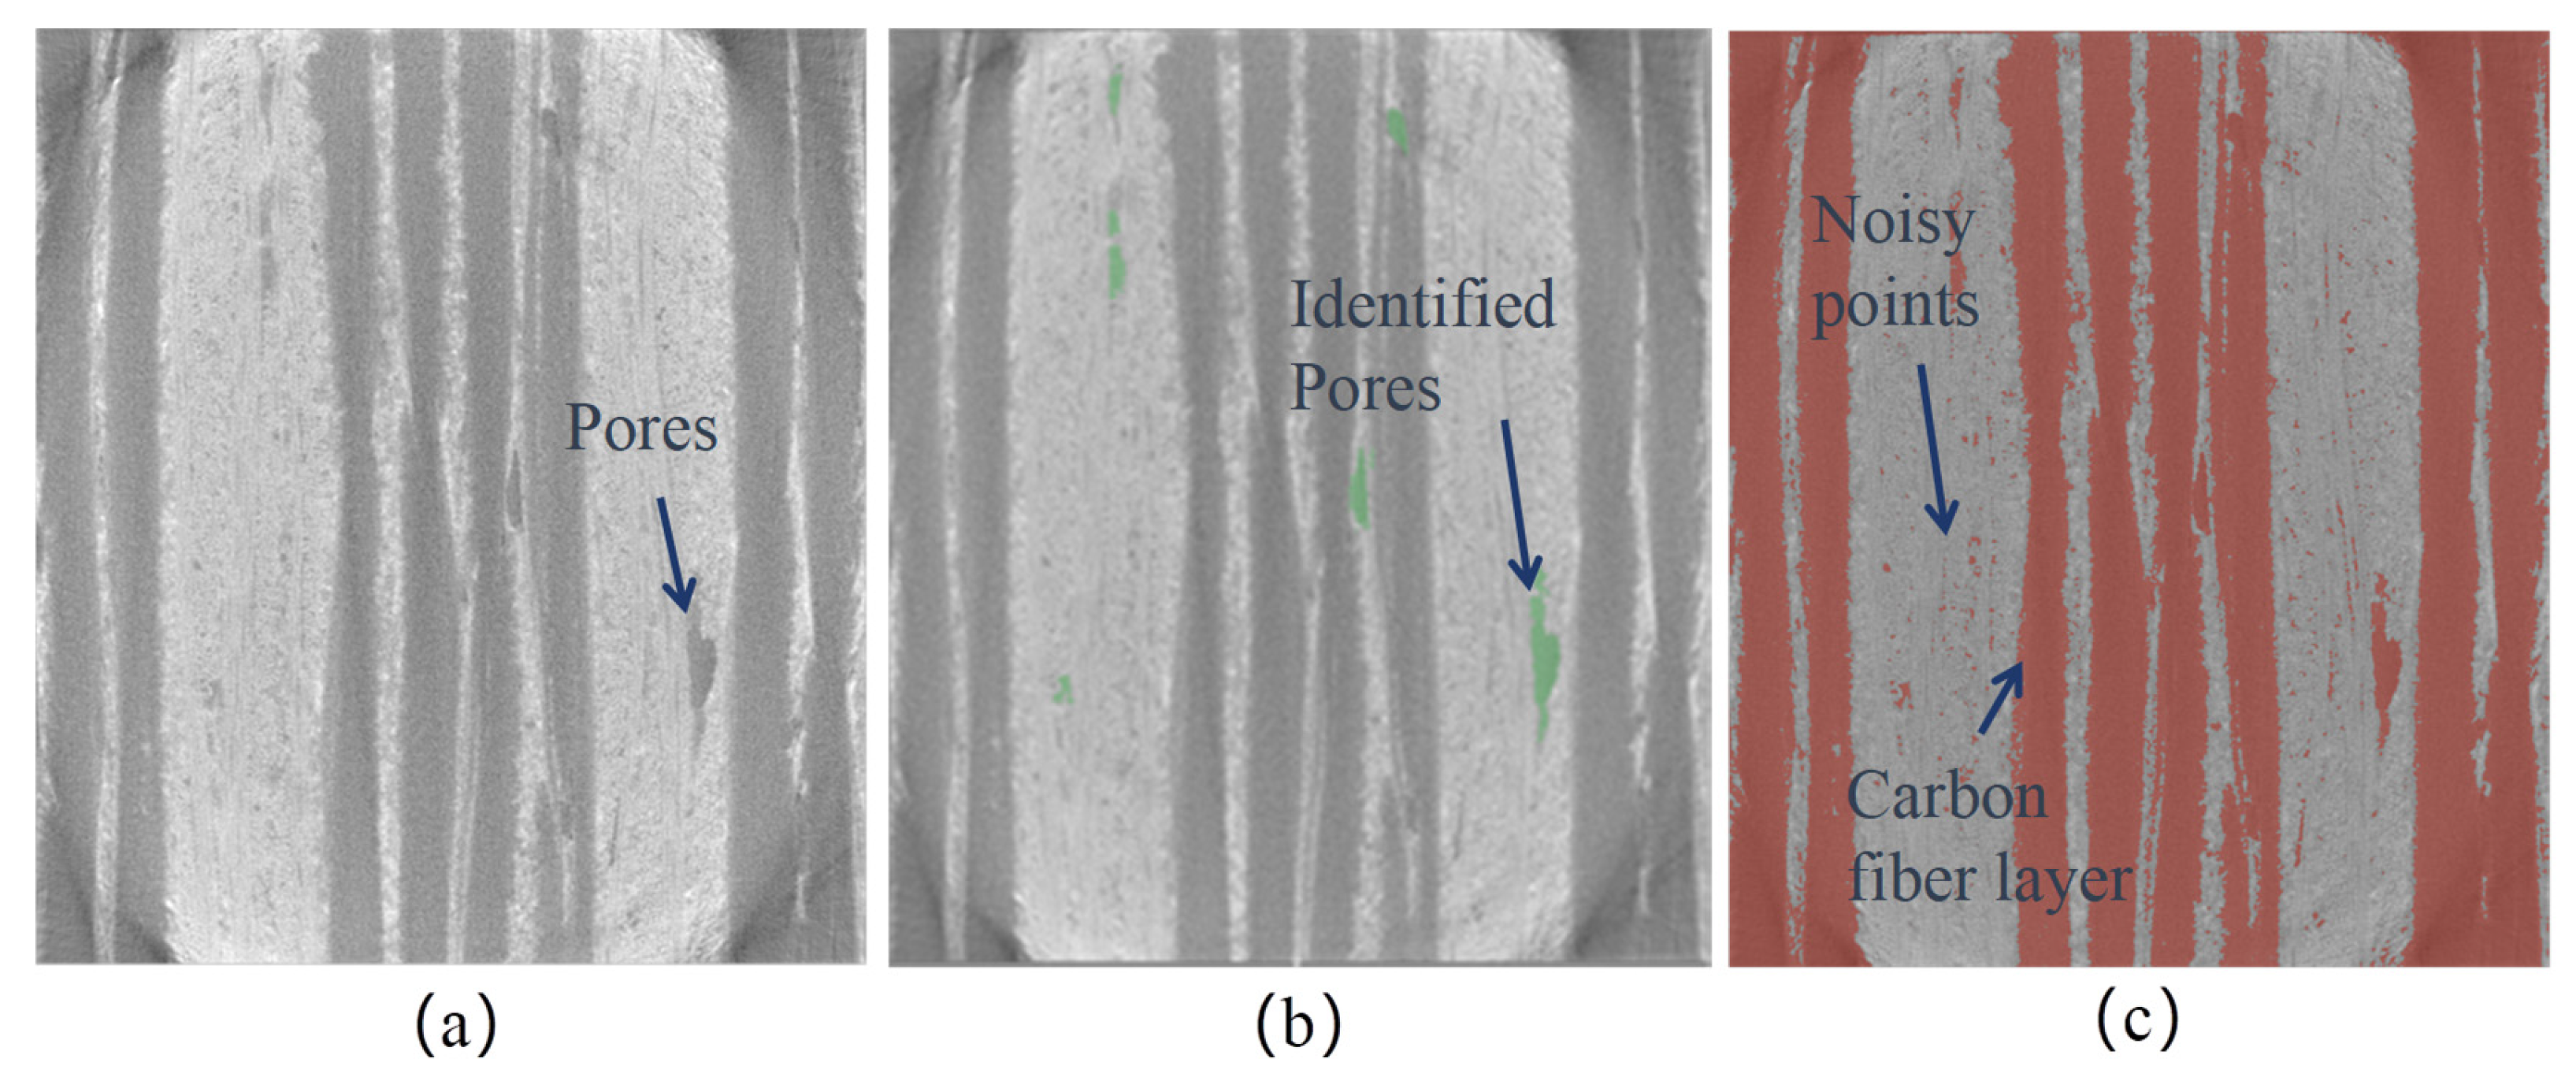
The pore recognition accuracy under this training framework is high, and the pore edges are clear, providing a good data foundation for subsequent pore quantification. The comparison of recognition results between deep learning and threshold segmentation is shown in
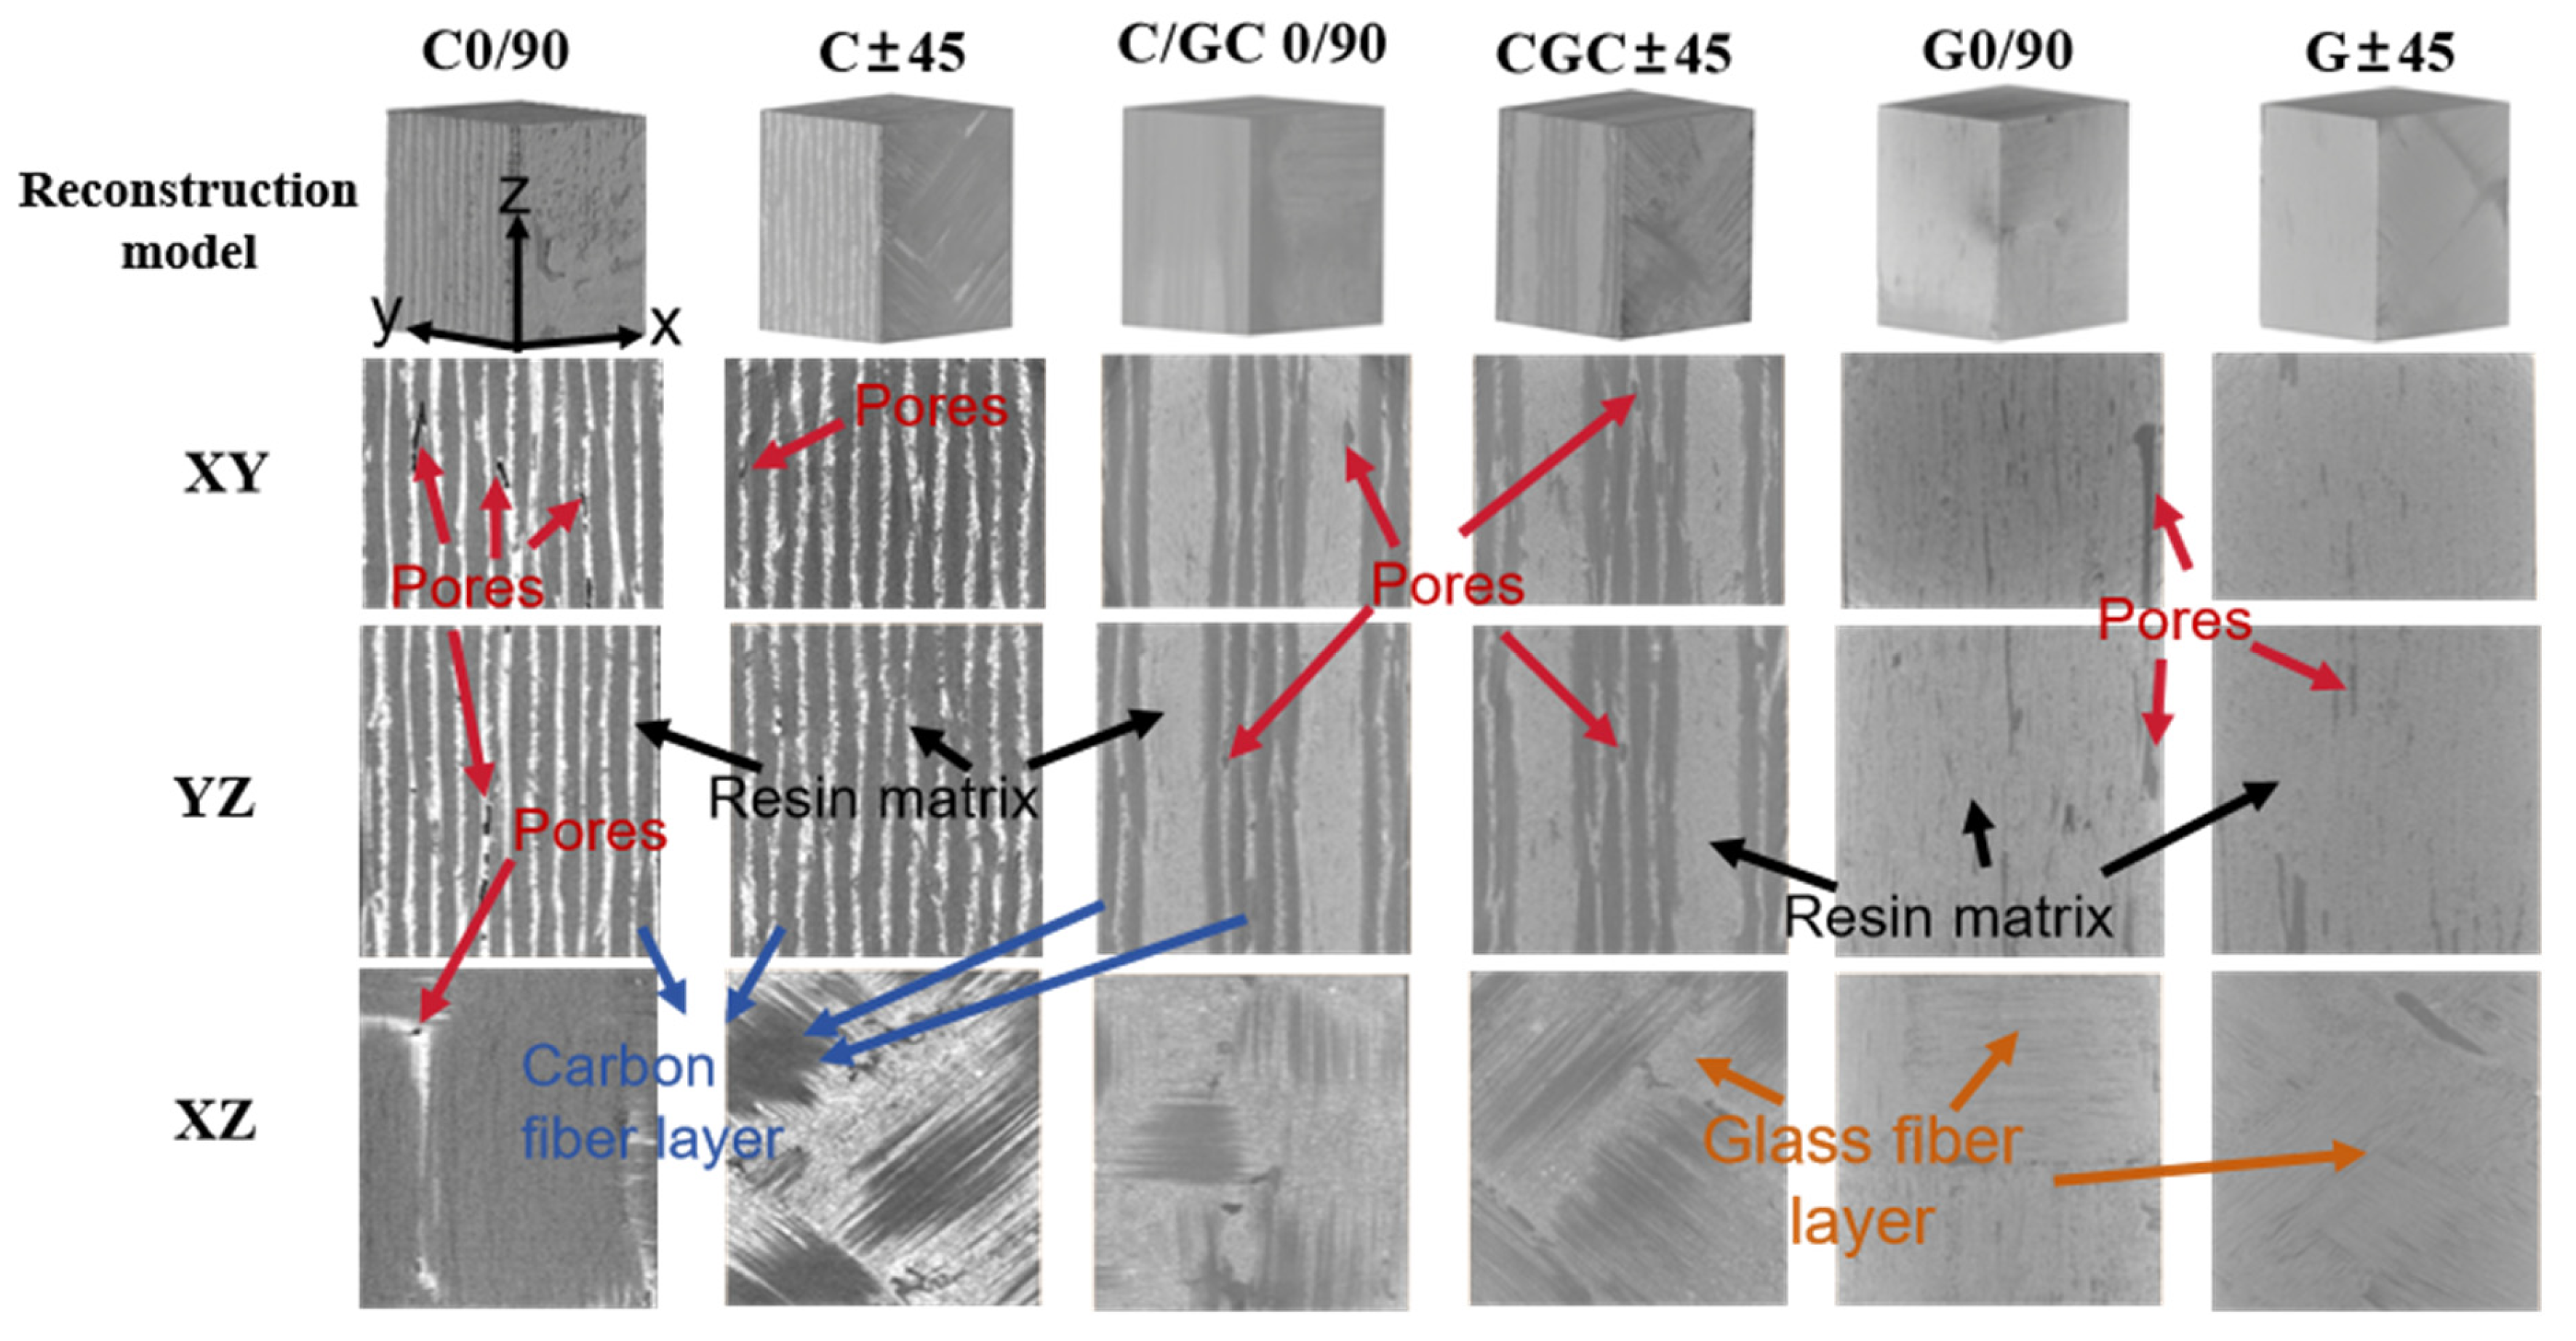
Figure 6. The gray contrast between pores and fiber bundles is often low, and the pore shapes are diverse, possibly elongated along the fiber direction or with irregular shapes existing at the interlayer interface. The partial volume effect makes the edge signals of small pores (close to voxel size) blurred; in addition, the texture noise inside the fiber bundles is easily misjudged as small pores. These factors lead to limited accuracy of traditional threshold segmentation or edge detection algorithms, often resulting in missed detection of pores or over-segmentation where noise is misidentified as pores. The components identified through threshold segmentation, apart from the pores that need to be extracted, also include noise and carbon fiber layers, which cannot be further separated by threshold.
To quantify the error difference between the U-Net++ deep learning method employed in this study and the traditional threshold segmentation method, the pore misdetection rate is used as the core error evaluation index. The formula for the misdetection rate is misdetection rate (%) = (number of non-pore pixels misclassified as pores / total number of pore pixels segmented) × 100%. One hundred CT slices are selected from each of the six groups of specimens in this study. Pore segmentation is performed on these slices using the two methods, and the accurately manually annotated slice results are used as the “true pores” to calculate the misdetection rates of the two methods. The comparison experiment shows that due to the inability to solve the gray-level overlap problem between carbon fibers and pores, the misdetection rate of the traditional threshold segmentation method is significantly higher than that of the U-Net++ deep learning method. A comparative summary of the two methods is presented in the
Table 1 below.
For the U-Net++ deep learning pore segmentation and porosity measurement method in this study, the original slices taken by Micro-CT are used as the sole data source throughout the process, without introducing additional experimental data. The specific process is as follows: Randomly select 10 representative slices from the original CT slices of six groups of specimens and accurately manually label the pore and background areas with the 3D ROI Painter tool to construct a “original slice–annotation label” training dataset. Next, build a framework based on the U-Net++ architecture and configure a single-channel input dimension of 512 × 512 × 1, a Categorical Crossentropy loss function and an Adadelta optimization algorithm. Combine the early stopping mechanism and model checkpoint to complete 100 epochs of training to obtain a converged segmentation model. A model will be trained for each sample, and then the respective model will be applied to all CT slices of the corresponding specimen to automatically segment the pore area and calculate the porosity. To verify the reliability of the results, the statistical value of the porosity of the accurately manually sliced sections is used as the experimental reference data for comparison. The results show that the relative deviation between the measured value of the method in this paper and the reference value is only 4.5–15.7%, indicating a relatively high degree of coincidence.
The U-Net++ model captures defect characteristics through its nested, multi-scale architecture specifically designed for semantic segmentation. It does not directly predict defect counts or sizes; rather, it performs pixel-wise classification to generate a binary segmentation mask that differentiates defects from the background. Defect enumeration is subsequently achieved by applying a connected-component labeling algorithm to the segmented mask, wherein each isolated connected region is identified as an individual defect. The size of each defect is quantified by computing the volume of its corresponding voxel cluster, using the known spatial resolution of the Micro-CT data (4.29 μm/voxel in this study). To discern defect types and structural features, U-Net++ leverages a deep encoder-decoder architecture with dense skip connections. The encoder pathway hierarchically extracts and compresses visual features, progressively learning to recognize complex patterns, from low-level edges and textures in early layers to high-level semantic representations such as pore morphology and fiber orientation in deeper layers. Critically, the decoder pathway, enhanced by skip connections that integrate multi-scale contextual information, enables precise spatial localization and accurate boundary delineation. This facilitates the differentiation of defect types, such as distinguishing small, dispersed intra-ply pores from larger, flattened inter-ply voids, on the basis of their morphological characteristics, spatial distribution and contextual appearance within the 3D volume.
U-Net++ employs an advanced encoder–decoder architecture with nested dense skip pathways to address the semantic gap between high-resolution feature maps from the encoder and the deep semantic features in the decoder. The algorithm builds upon the standard U-Net framework by introducing a series of convolutional blocks and dense connections between different resolution scales, enabling more precise segmentation of complex pore structures in composite materials. The key mathematical foundation includes a convolutional operation defined as
where
denotes the ReLU activation function,
and
represent the learnable weights and biases at layer
and
indicates the convolution operation. For feature fusion across scales, the model utilizes the formulation
where
is an upsampling operation and
denotes a fusion module typically involving concatenation followed by convolution. The training process is optimized using the Categorical Crossentropy loss function, expressed as
which penalizes deviations between the predicted pore probabilities and ground truth annotations. Model parameters are updated via the Adadelta optimizer, which dynamically adapts the learning rates using the rule
where
represents the root mean square of gradient updates.
U-Net++ demonstrates significant advantages in such tasks with its nested dense skip connection structure. Unlike U-Net, which simply concatenates the shallow features from the encoder with the deep features from the decoder, U-Net++ introduces intermediate convolutional layers and dense connection paths to construct a “feature optimization pipeline”. The detailed but semantically ambiguous features captured by the shallow layers of the encoder (such as possible noise points and weak edge gradients) are fused and reprocessed with the features at the same scale that have undergone deeper “understanding” before being passed to the corresponding deep layers of the decoder. This process effectively enhances the response of the true pore edges while suppressing the background noise caused by the texture of the fiber bundles. Ultimately, the deep layers of the decoder obtain feature maps that have been gradually refined and semantically enhanced, enabling more accurate reconstruction of the complete pore morphology and significantly improving the segmentation accuracy and robustness for small pores, low-contrast pores and complex-shaped pores, effectively reducing misjudgments and omissions. After the application of deep learning, interlayer pores and intralayer pores can be accurately identified, providing strong support for subsequent pore analysis.
5. Results and Analysis
5.1. Pore Quantification Analysis
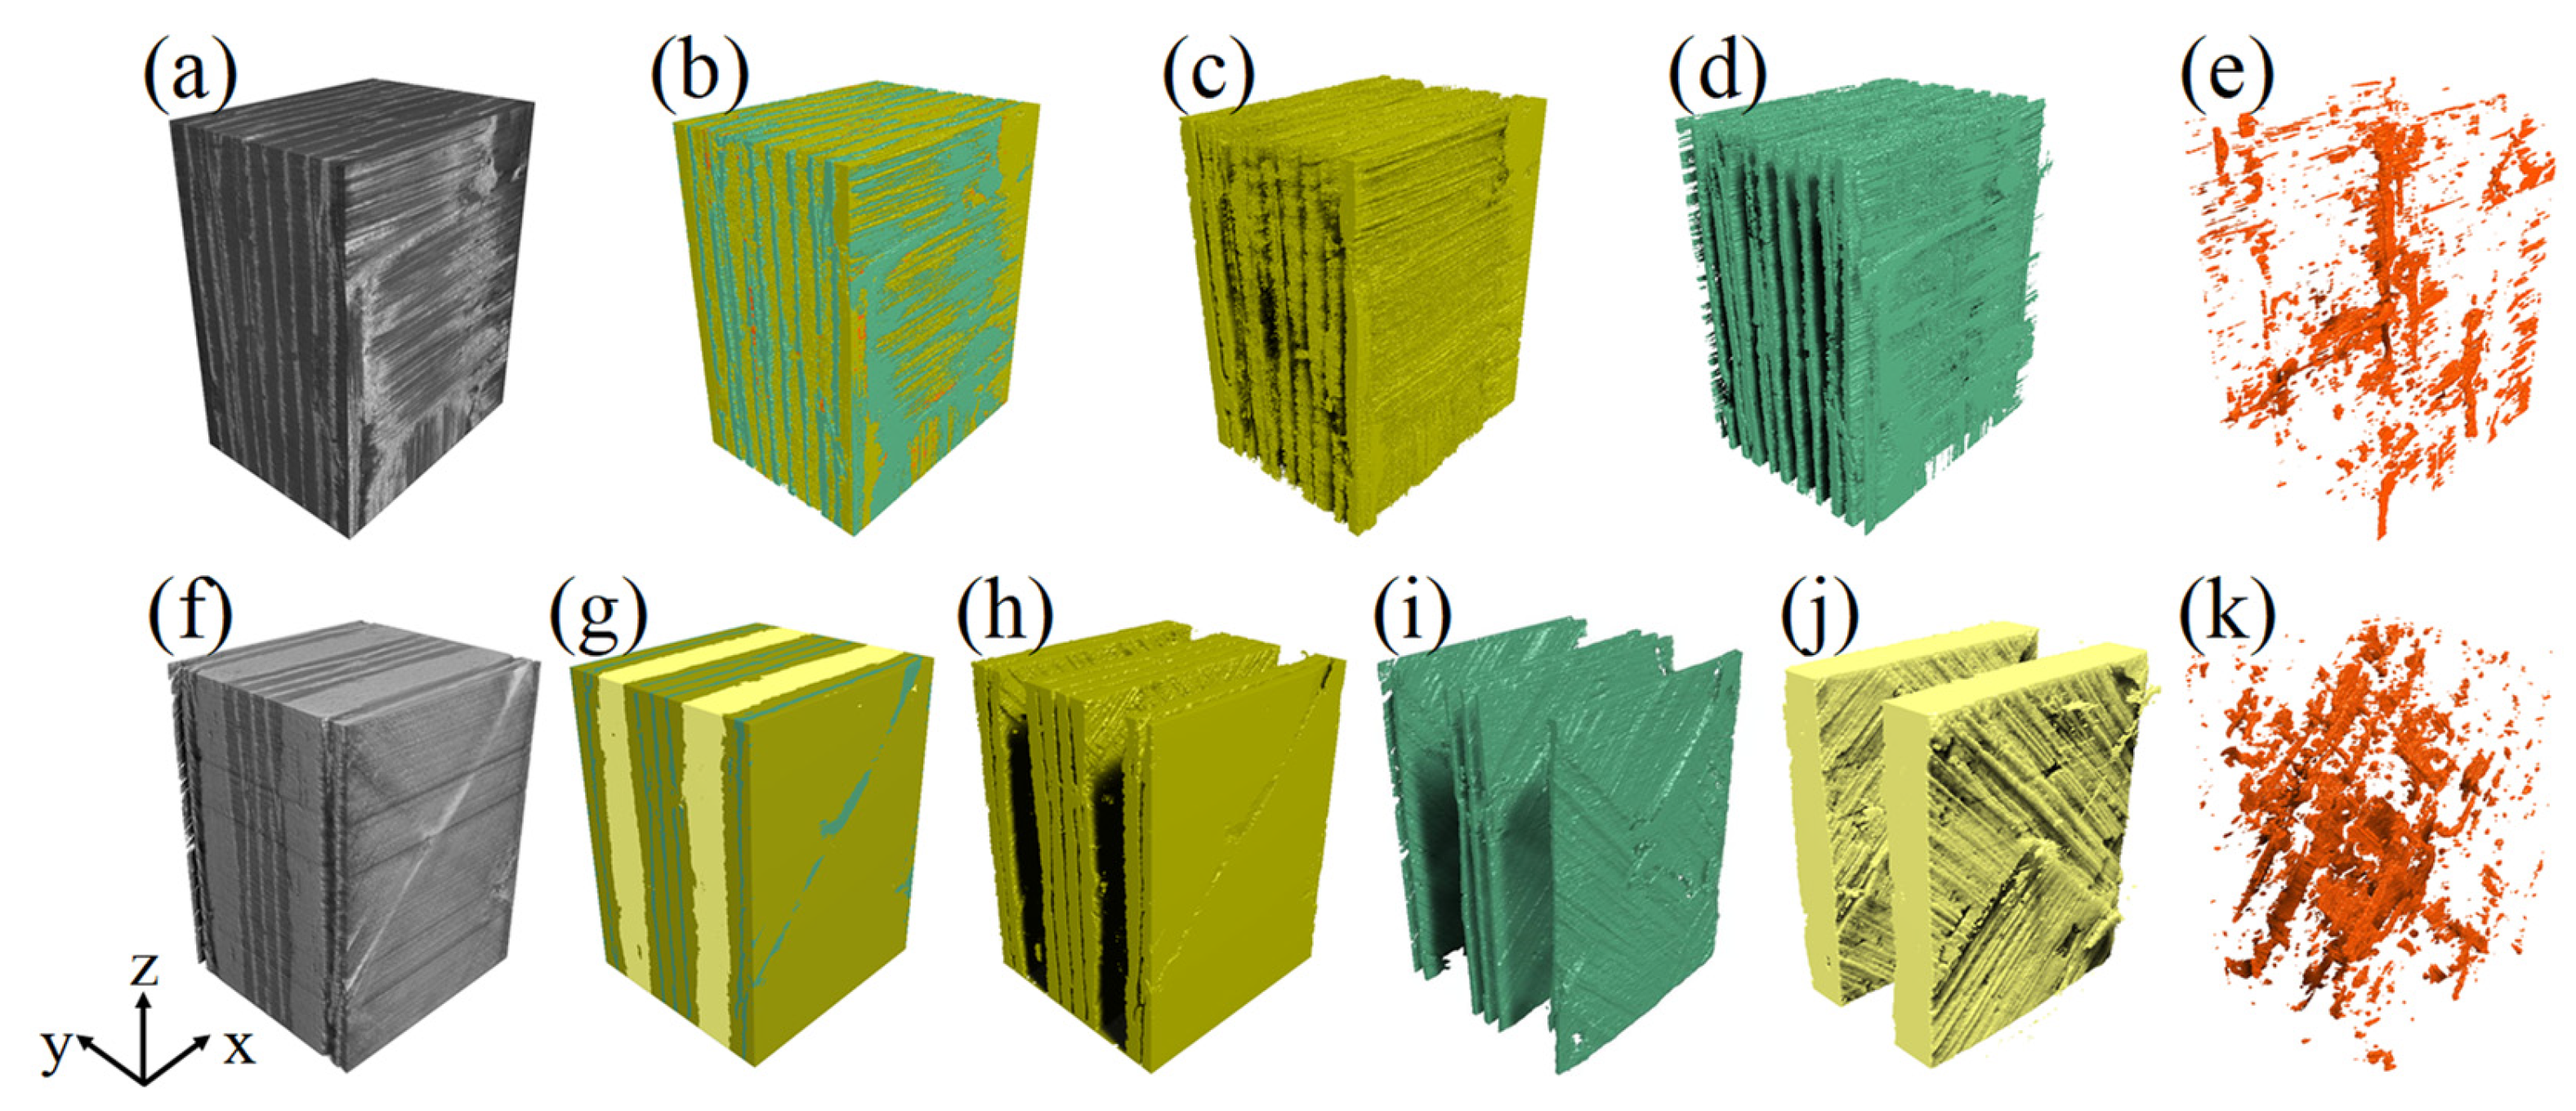
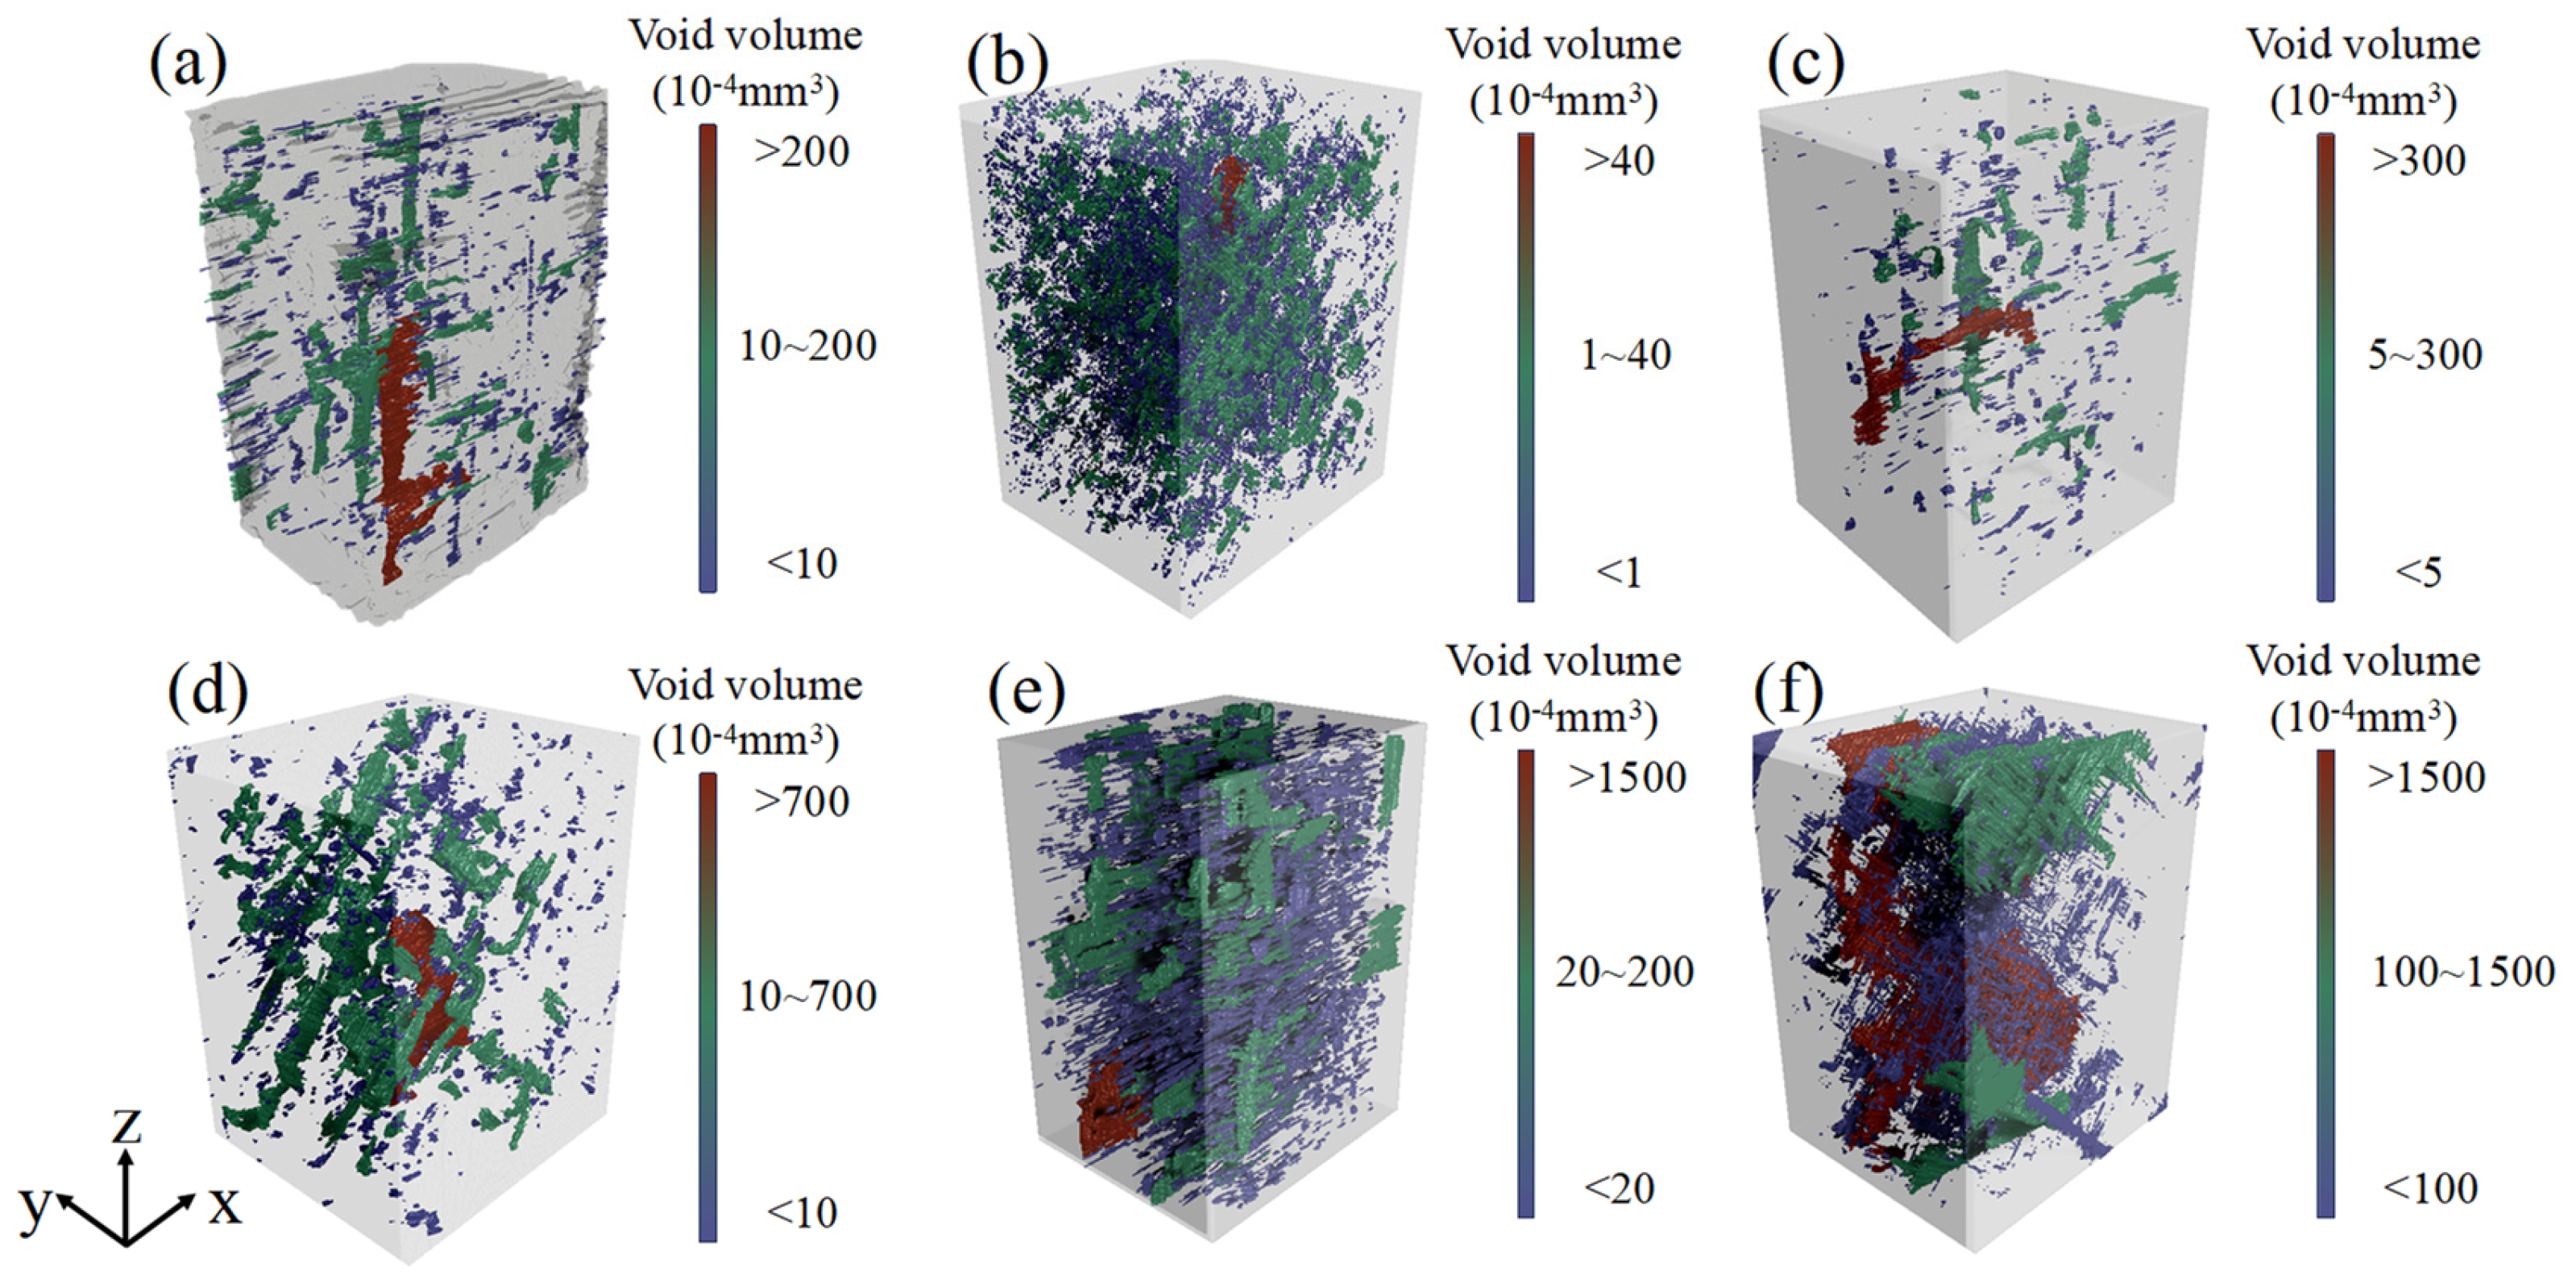
Figure 7 presents the internal pore space distribution models of six different types of laminates after deep learning segmentation and 3D reconstruction. To visually compare the distribution patterns of pores of different sizes, the pores in the figure are color-coded according to their volume: large (red, e.g., >200 × 10
−3 mm
3), medium (green, e.g., 10–200 × 10
−3 mm
3) and small (blue, e.g., <10 × 10
−3 mm
3). For ease of presentation, each sample is divided into different intervals.
Overall, the laminates of different layup types and fiber materials exhibit significant differences in pore characteristics. In the carbon fiber unidirectional layup samples of C0/90 (
Figure 7a) and C±45 (
Figure 7b), the pores are mainly medium and small in size and are relatively uniformly distributed in space. In contrast, the ±45 layup shows more medium-sized pores with a certain directional arrangement, indicating that the layup angle has a certain impact on the accuracy and precision of CT scanning. The pore characteristics of the 0/90 layup are more obvious, with continuous long strip pores that can be extracted, while the pores in the ±45 layup are not obvious in the original image, resulting in lower recognition accuracy. In the carbon/glass hybrid layup samples of CGC0/90 (
Figure 7c) and CGC±45 (
Figure 7d), the size and number of pores have increased, especially in the CGC±45 sample (
Figure 7d), where multiple large-sized pores (red) are present, mostly distributed in the interlayer interface area, indicating that the hybrid interface is more prone to defects. In the glass fiber laminates of G0/90 (
Figure 7e) and G±45 (
Figure 7f), the total pore volume is significantly higher than that of the carbon fiber samples, and the G±45 layup shows a large number of large-sized pores, suggesting that glass fiber composites are more sensitive to the process under non-orthogonal layup conditions and are prone to forming concentrated pores.
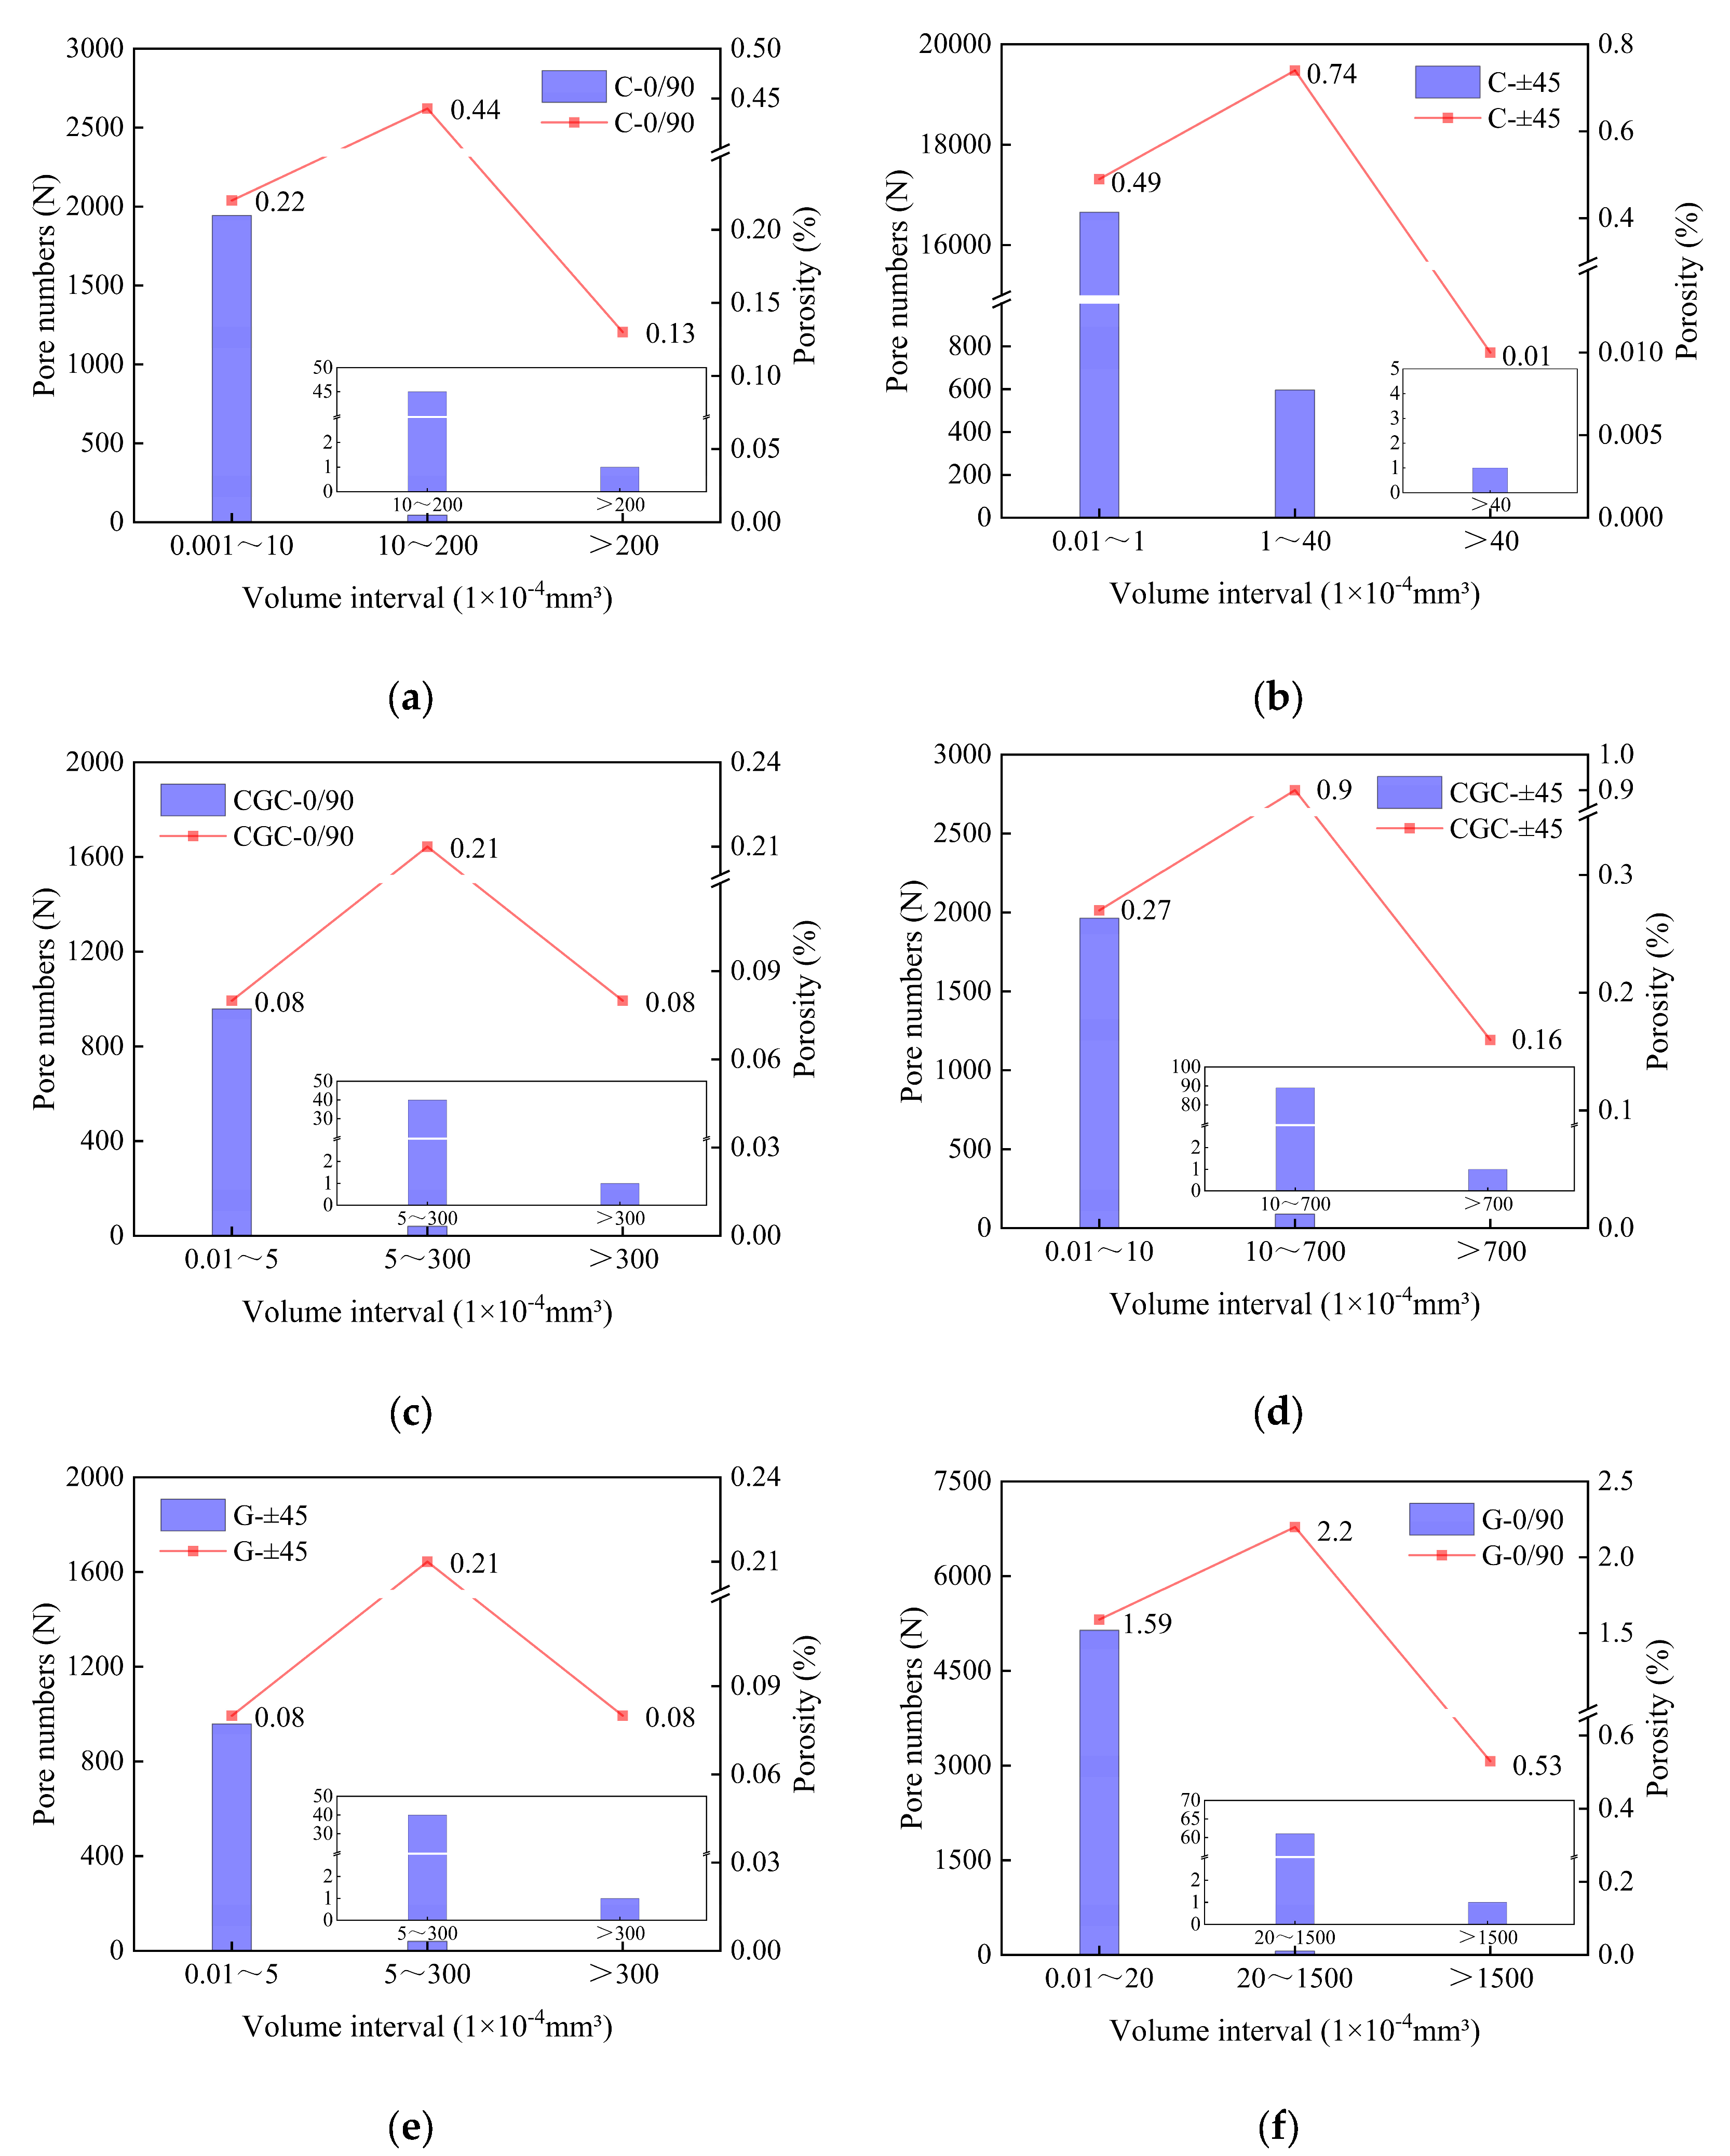
Figure 8 further quantitatively reveals, from a statistical perspective, the quantity distribution of six types of laminate samples within different pore size intervals and their contribution to the overall porosity. The horizontal axis represents the pore volume interval (unit: 1 × 10
−2 mm
3), the left vertical axis indicates the number of pores and the right vertical axis represents the percentage of the total pore volume within this interval to the total pore volume of the sample (i.e., volume porosity). In pure carbon fiber laminates (C0/90 and C±45), pores are mainly concentrated in the micro-size interval (<10 × 10
−2 mm
3), with a very high numerical proportion, but their contribution to the overall porosity is limited. This indicates that the defects in carbon fiber composites are mainly in the form of dispersed micro-pores. Carbon/glass hybrid laminates (CGC0/90 and CGC±45) exhibit different characteristics. Although small pores still dominate in number, in CGC±45, the number of medium and large-sized pores (such as >50 × 10
−2 mm
3) significantly increases, and these few large pores contribute very prominently to the overall porosity, revealing that the hybrid interface is prone to becoming the initiation point of large defects under specific layups. Pure glass fiber laminates (G0/90 and G±45) show the most significant pore problems. Not only is the number of small pores extremely large, but the numbers of medium and large-sized pores are also significantly more than those in carbon fiber materials. Especially in the G±45 layup, the large-sized pore interval shows a higher number and volume proportion, which is consistent with the macroscopic large holes observed in
Figure 7f, statistically confirming that glass fiber composites, especially non-orthogonal layups, have a higher tendency to form pores and poorer process adaptability.
As can be seen above, the layup angle and material have a significant impact on the identification of pores. In carbon fiber layers, ±45° layups are more difficult to identify than 0/90 layups, and it is hard to extract continuous long strip pores. However, this effect does not exist in glass fiber layers. In hybrid layups, the interlayer interface becomes a key area for pore enrichment. These results provide a three-dimensional spatial basis for subsequent pore rate statistics and pore feature analysis.
In terms of pore quantification and defect identification, we can observe the differences between CT technology and other methods. The CT plus post-processing method can accurately quantify the pores’ volume, distribution and porosity, and identify various types of defects such as pores and delaminations. Its resolution can reach the sub-micron level. However, detection takes a long time and requires cutting the specimen. The ultrasonic testing (UT) method relies on ultrasonic reflection signals. It is sensitive to macroscopic interlayer defects such as delaminations and can accurately identify and quantify the area and depth of delaminations. Nevertheless, it is ineffective for micro-pores (in the order of several micrometers), as the reflection signals are extremely weak. Moreover, fiber scattering will further mask the pore signals, making it impossible to identify pores and only possible to recognize delaminations. In addition, infrared thermography (IRT) can also only identify delaminations (with weak deep-layer signals) and cannot quantify tiny pores. Its resolution is at the sub-millimeter level. However, when it is necessary to quickly screen for delamination defects in large-area CFRP components (such as aircraft wing skins and the composite bodies of EMUs), the latter two methods are both good choices.
5.2. Analysis of Facial Porosity
Figure 9 and
Figure 10 systematically present the distribution characteristics of porosity along the three orthogonal directions x, y and z for six laminated plate specimens. By comparing the porosity curves of different material systems and layup structures, the anisotropic spatial distribution and local enrichment of pores can be clearly observed. These distribution features are closely related to the fiber orientation, layup structure and interlaminar interface properties of the materials, providing an important basis for understanding the formation mechanism of pores and their impact on the material’s performance.
From the perspective of material type, the face porosity of different composite systems shows significant differences. The face porosity of carbon fiber laminates (C0/90 and C±45) remains at a relatively low level in all three directions (generally below 0.02%) and the distribution curve is relatively flat, indicating a relatively uniform internal pore distribution. This is related to the good resin impregnation and interface bonding performance of carbon fibers. In contrast, the face porosity curves of carbon/glass hybrid laminates (CGC0/90 and CGC±45) show obvious fluctuation characteristics, especially in the y-direction (perpendicular to the layup direction), where multiple local peaks appear. This reflects that the interface area between carbon fiber layers and glass fiber layers is prone to becoming a weak link where pores are enriched. The face porosity of glass fiber laminates (G0/90 and G±45) is the highest overall, with local peaks in the y-direction even reaching 0.25%, indicating poor interface compatibility between glass fibers and resin, and making it more likely to form pore defects during the preparation process.
The influence of ply angle on the distribution of porosity should also not be overlooked. For the same material system, the face porosity of ±45 ply samples is generally higher than that of 0/90 ply samples, and the fluctuation of the distribution curve is more significant. Taking CGC±45 as an example, the peak value of face porosity in the y-direction is significantly higher than that of CGC0/90. This may be due to the complex fiber orientation in the ±45° ply structure, which affects the flow and infiltration of resin, making the interlayer area more prone to pore formation. The face porosity curves of all samples in the z-direction (thickness direction) show unique distribution patterns, among which, the porosity fluctuation of G±45 samples in the thickness direction is the most intense, suggesting that there may be pore channels penetrating multiple plies inside, and this defect morphology will have a particularly adverse effect on the interlaminar shear performance of the material.
On the basis of the analysis of face porosity in three directions, it can be concluded that the distribution of porosity within composite materials is jointly regulated by the material composition and ply structure. Carbon fiber laminates exhibit the best porosity control ability, while glass fiber laminates show the highest porosity sensitivity. Although hybrid laminates inherit some advantages of carbon fibers to a certain extent, the problem of pore enrichment at the interlaminar interface still needs to be taken seriously. In addition, the ±45 ply structure will aggravate the formation and aggregation of pores, especially in the interlayer area and thickness direction. These findings provide a clear direction for optimizing the preparation process of composite materials and improving pore defects, and also lay an important data foundation for subsequent research on the correlation between porosity and mechanical properties.
5.3. Analysis of Different Types of Pores
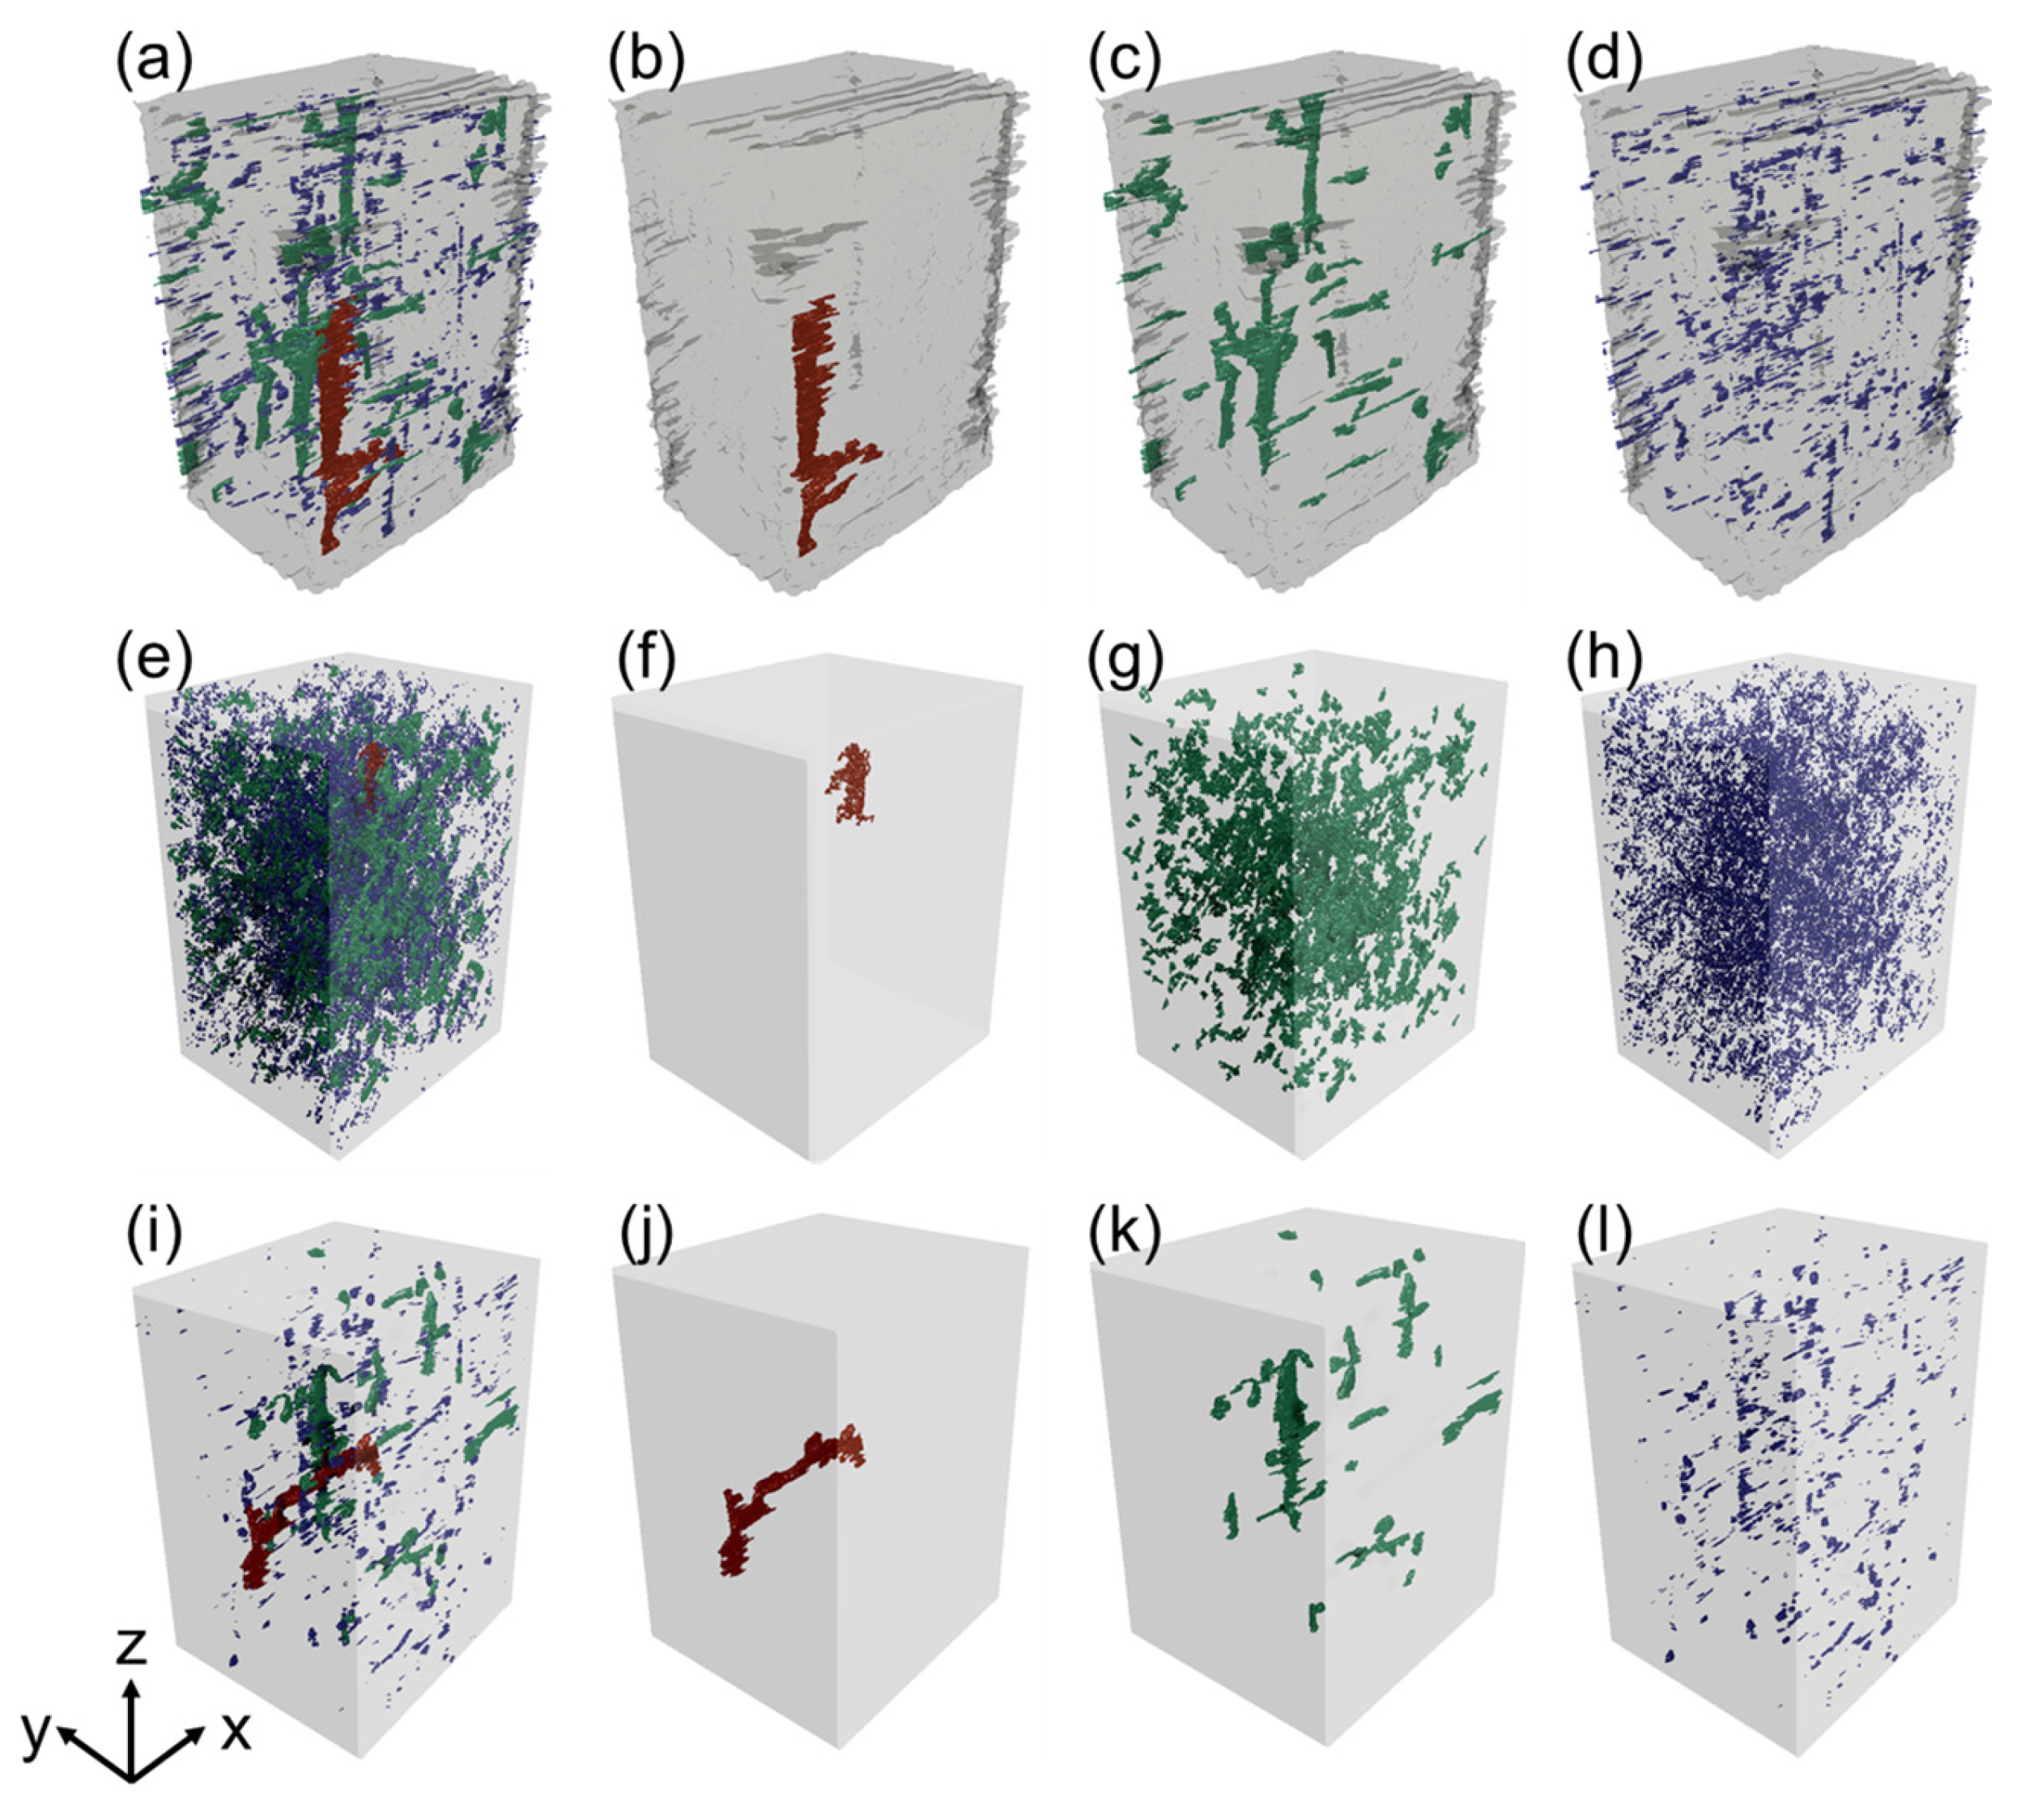
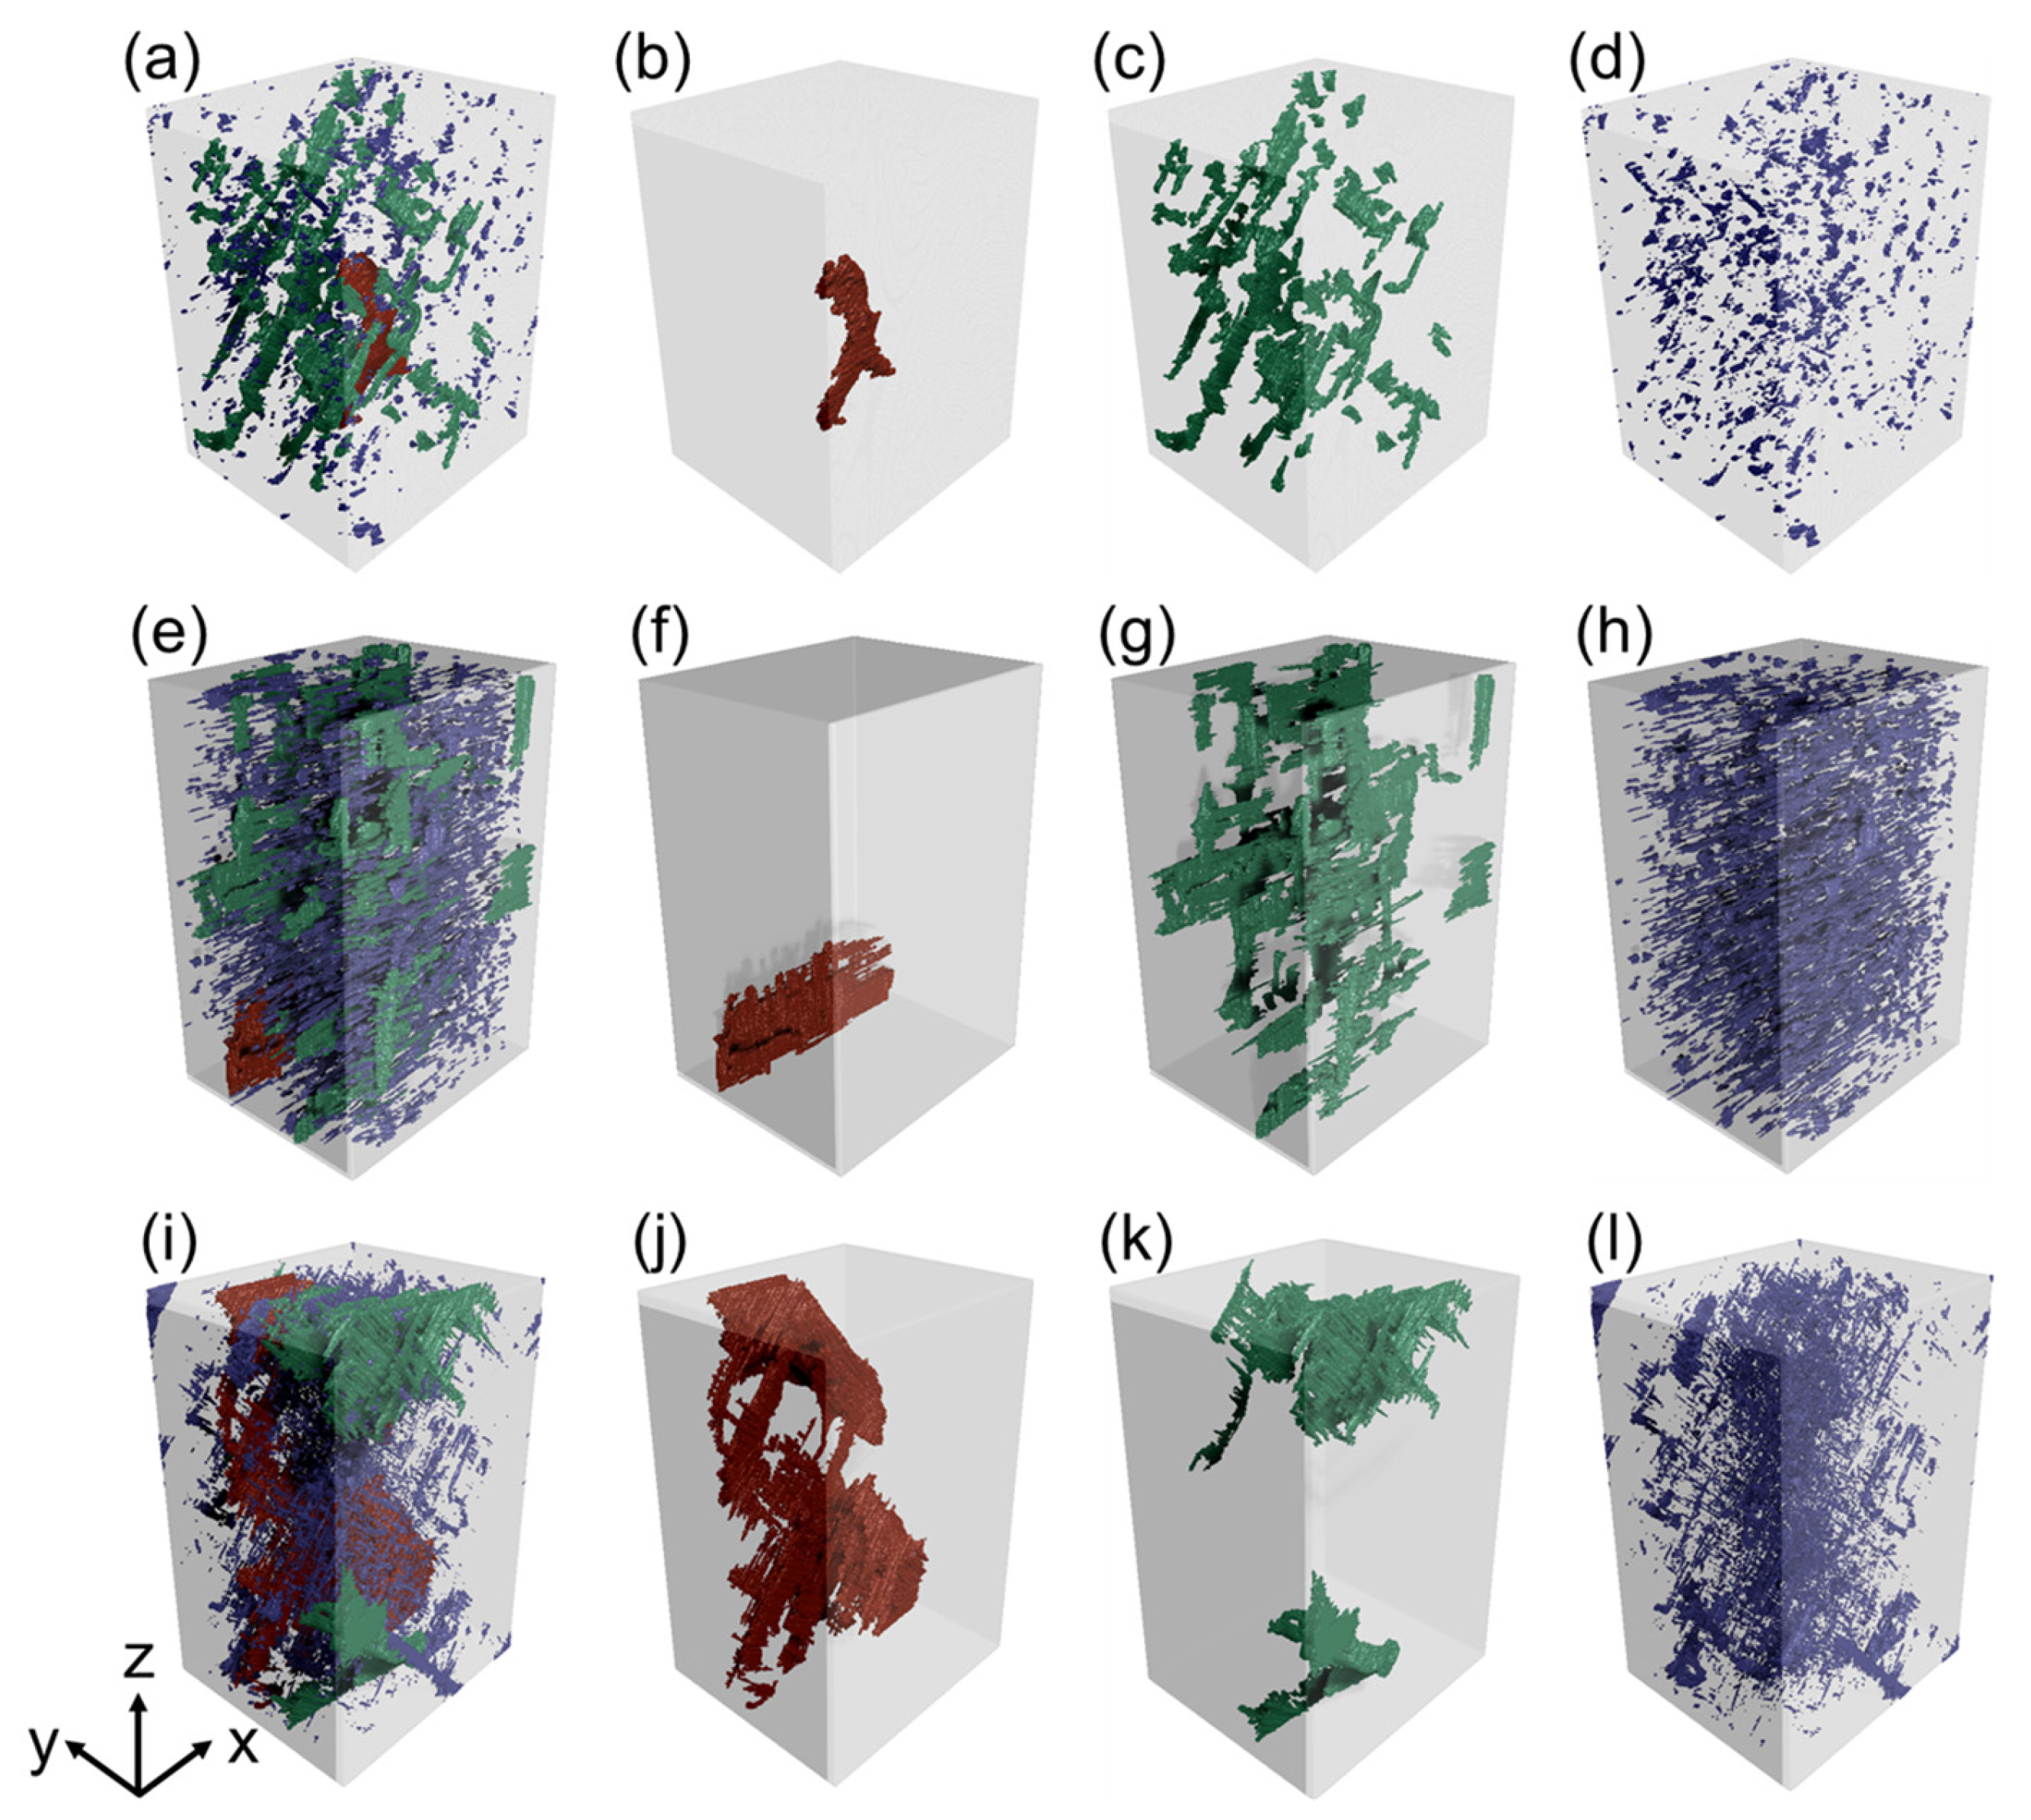
Figure 11 and
Figure 12 systematically present the three-dimensional morphology and spatial distribution characteristics of different types of pores in six laminated plate specimens. By classifying and displaying all pores according to their volume sizes (largest pores, medium-sized pores and small pores), the morphological differences and distribution patterns of pores in different material systems and layup structures can be clearly observed.
From the overall distribution pattern of pores, it can be seen that in the carbon fiber laminated plate C0/90, the pores are mainly isolated and dispersed small-sized ones, with a relatively limited volume of the largest pores and mostly presenting an approximately equiaxed shape. Due to the influence of shooting accuracy, continuous long strip pores could not be extracted in C±45. In contrast, in the glass fiber laminated plates (G0/90 and G±45), not only are the small pores densely distributed but the size of the largest pores is significantly larger than that of the carbon fiber samples, and they mostly present irregular long strip or flat shapes, extending along the interlaminar direction, showing a more obvious tendency of defect aggregation. The carbon/glass hybrid laminated plates (CGC0/90 and CGC±45) exhibit characteristics between the two, but in CGC±45, an increased number of medium-sized pores elongated along the fiber direction can be observed, and the largest pores are often located in the interface transition zone between the carbon layer and the glass layer, revealing that the hybrid interface is prone to becoming the source of large-sized defects under complex stress states.
The influence of ply angle on pore morphology is significant. In the various samples with ±45° ply angles (C±45, CGC±45, G±45), medium and large pores generally exhibit obvious directional alignment characteristics, with their long axes closely related to the fiber orientation. This oriented pore structure is likely to become a stress concentration source, exerting a more adverse impact on the mechanical properties of the material, especially its shear and fatigue performance. In contrast, in the 0/90 ply angle samples, the orientation of pores is relatively weak and their distribution is more random.
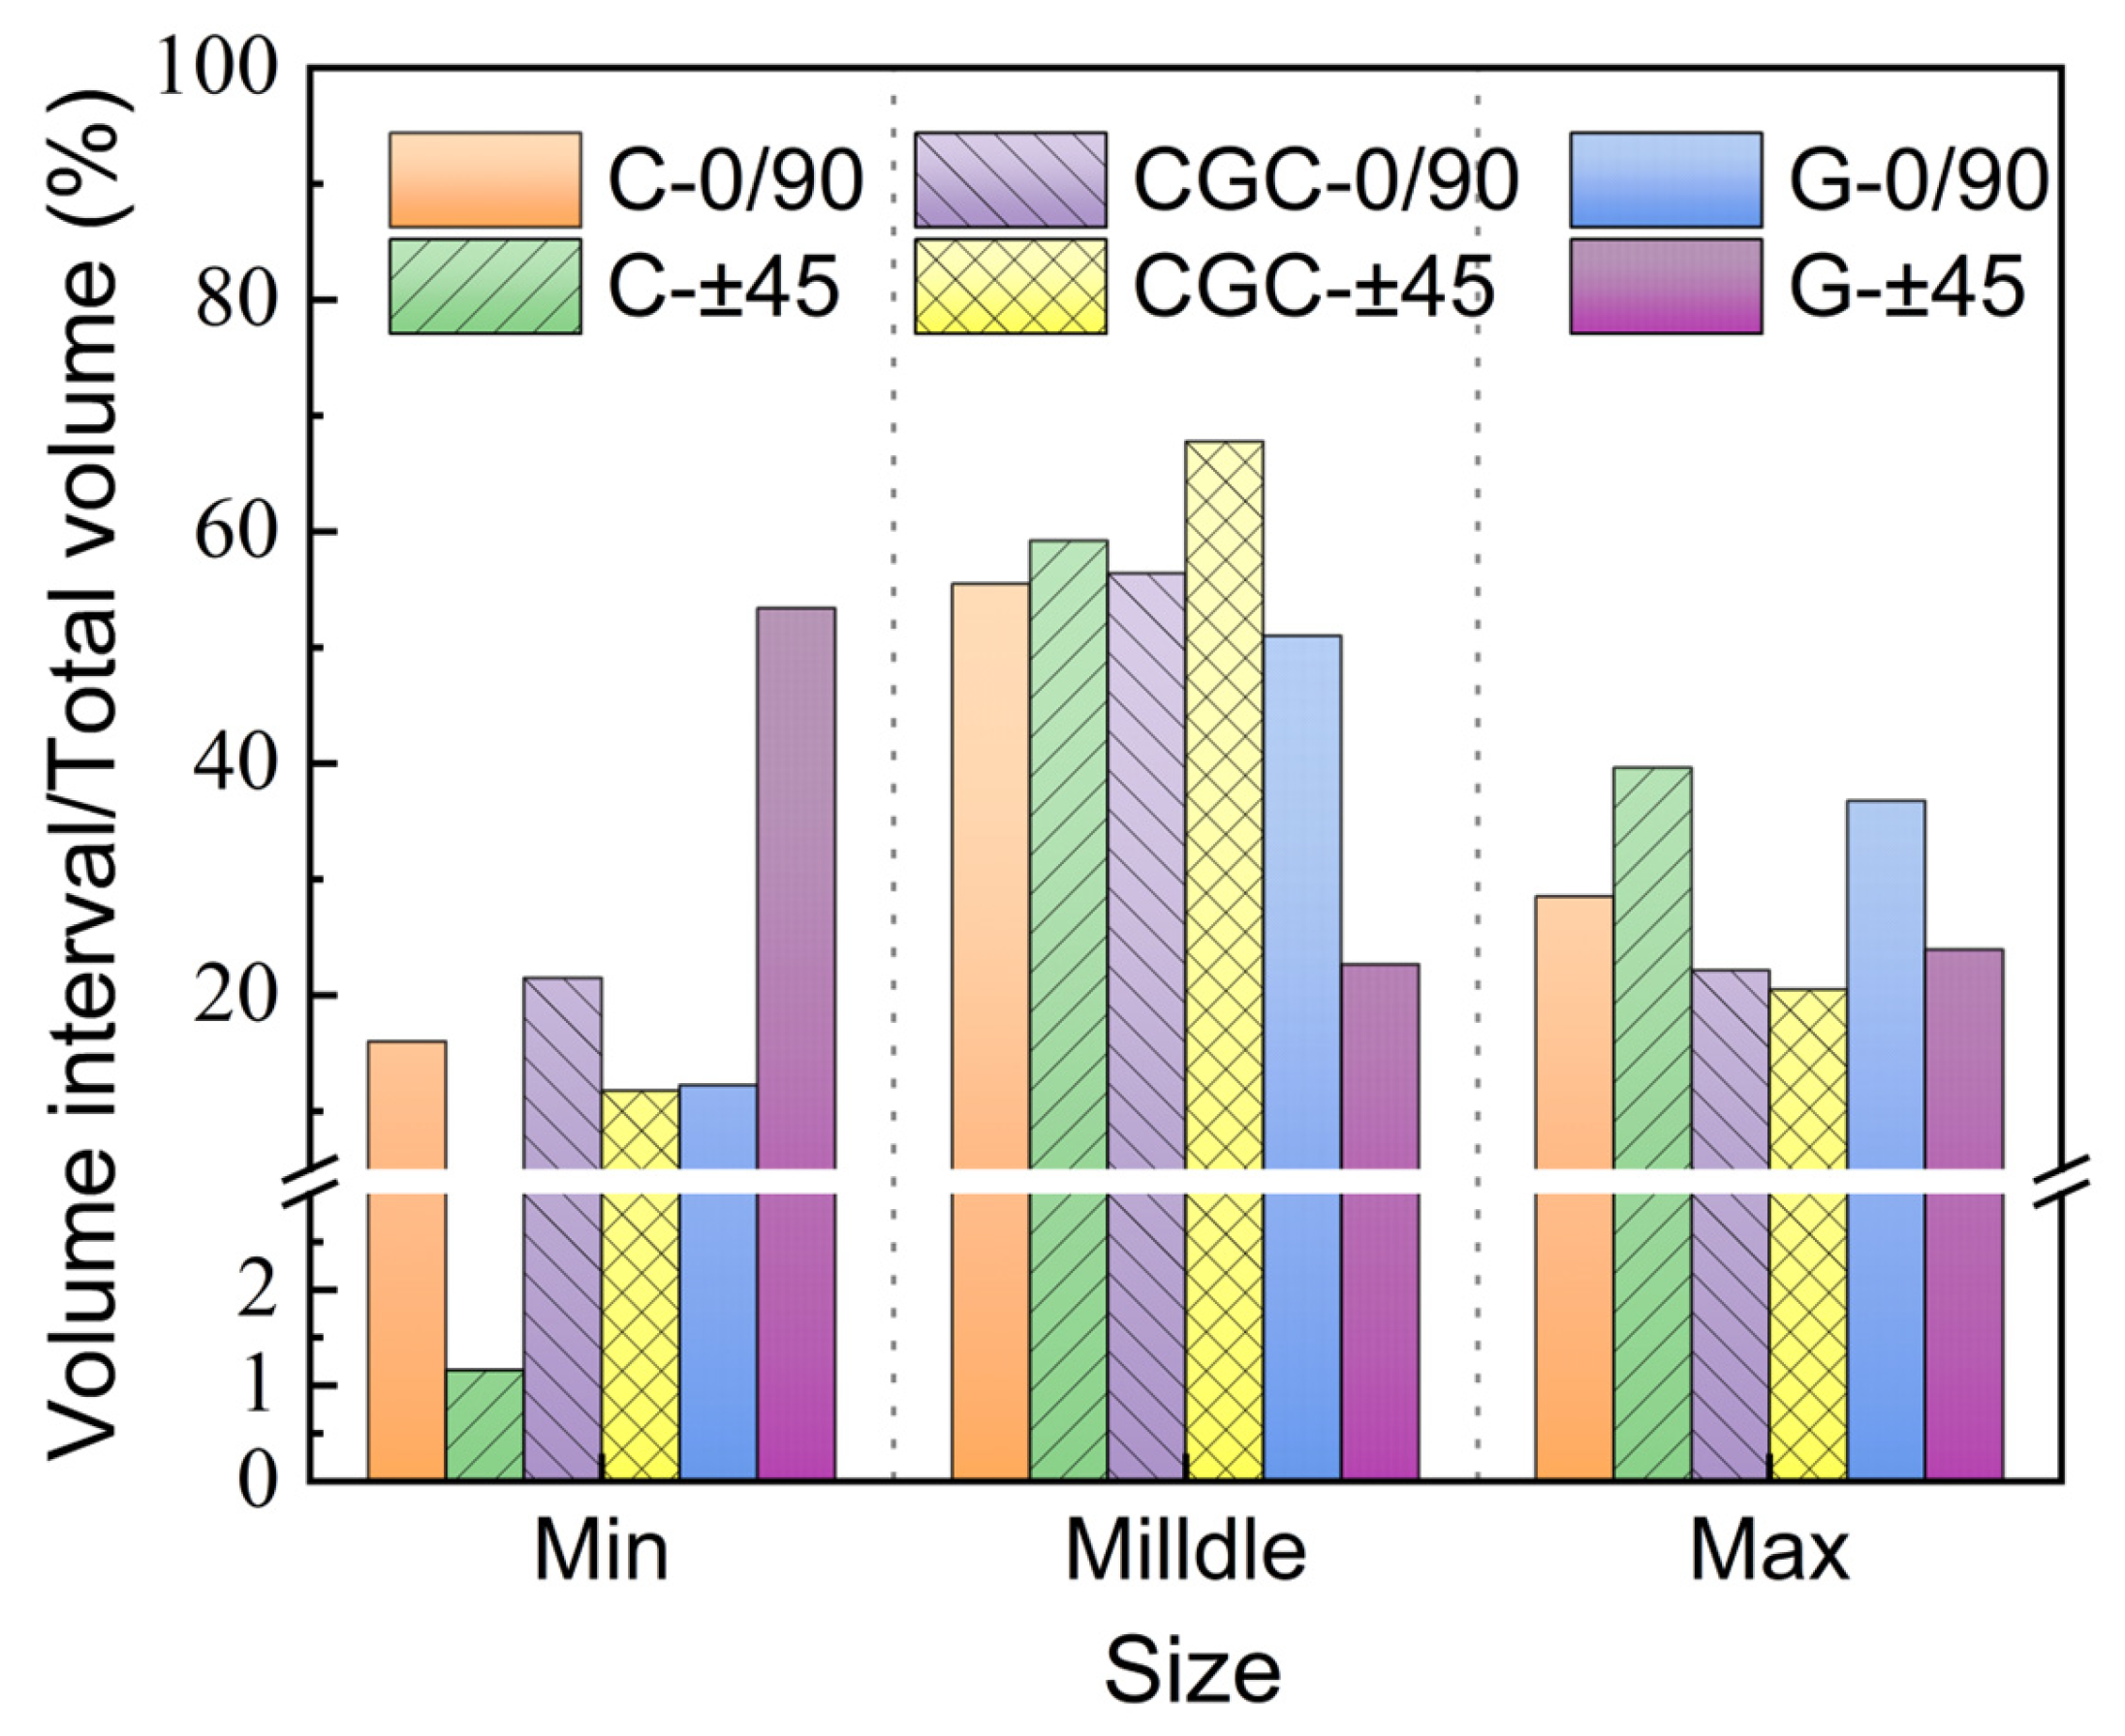
Figure 13 shows the percentage contribution of pores of different sizes (smallest, medium, largest) to the total pore volume in the six laminated plate specimens. From the statistical results, it can be clearly observed that there are significant differences in pore volume distribution among different material systems and ply structures.
For carbon fiber laminates (C0/90 and C±45), although the smallest-sized pores are in the majority in terms of quantity, their contribution to the overall porosity volume is limited; the overall porosity volume is mainly dominated by medium-sized pores, with the contribution of the largest pores being relatively small. This indicates that the pore distribution in carbon fiber laminates is relatively uniform and lacks extremely large-sized defects. In carbon/glass hybrid laminates (CGC0/90 and CGC±45), the distribution pattern of porosity volume undergoes a significant change. Medium-sized pores still play an important role, but the volume contribution of the largest pores increases significantly, especially in the CGC±45 layup, where the contribution rate of the largest pores approaches 40%. This confirms, from the volume proportion, the conclusion in the previous analysis that the hybrid interface is prone to inducing large-sized pores under the ±45 layup. Glass fiber laminates (G0/90 and G±45) exhibit the most pronounced size polarization phenomenon: the numerical advantage of the smallest pores does not translate into volume contribution, and the overall porosity volume is jointly dominated by medium-sized and largest pores. In G±45, the contribution rate of the largest pores even exceeds 50%. This indicates that glass fiber composites, especially under non-orthogonal layups, not only have a higher overall porosity volume but also tend to form larger-sized defects that are more harmful to the mechanical properties.
5.4. Feature Extraction of Key Pores
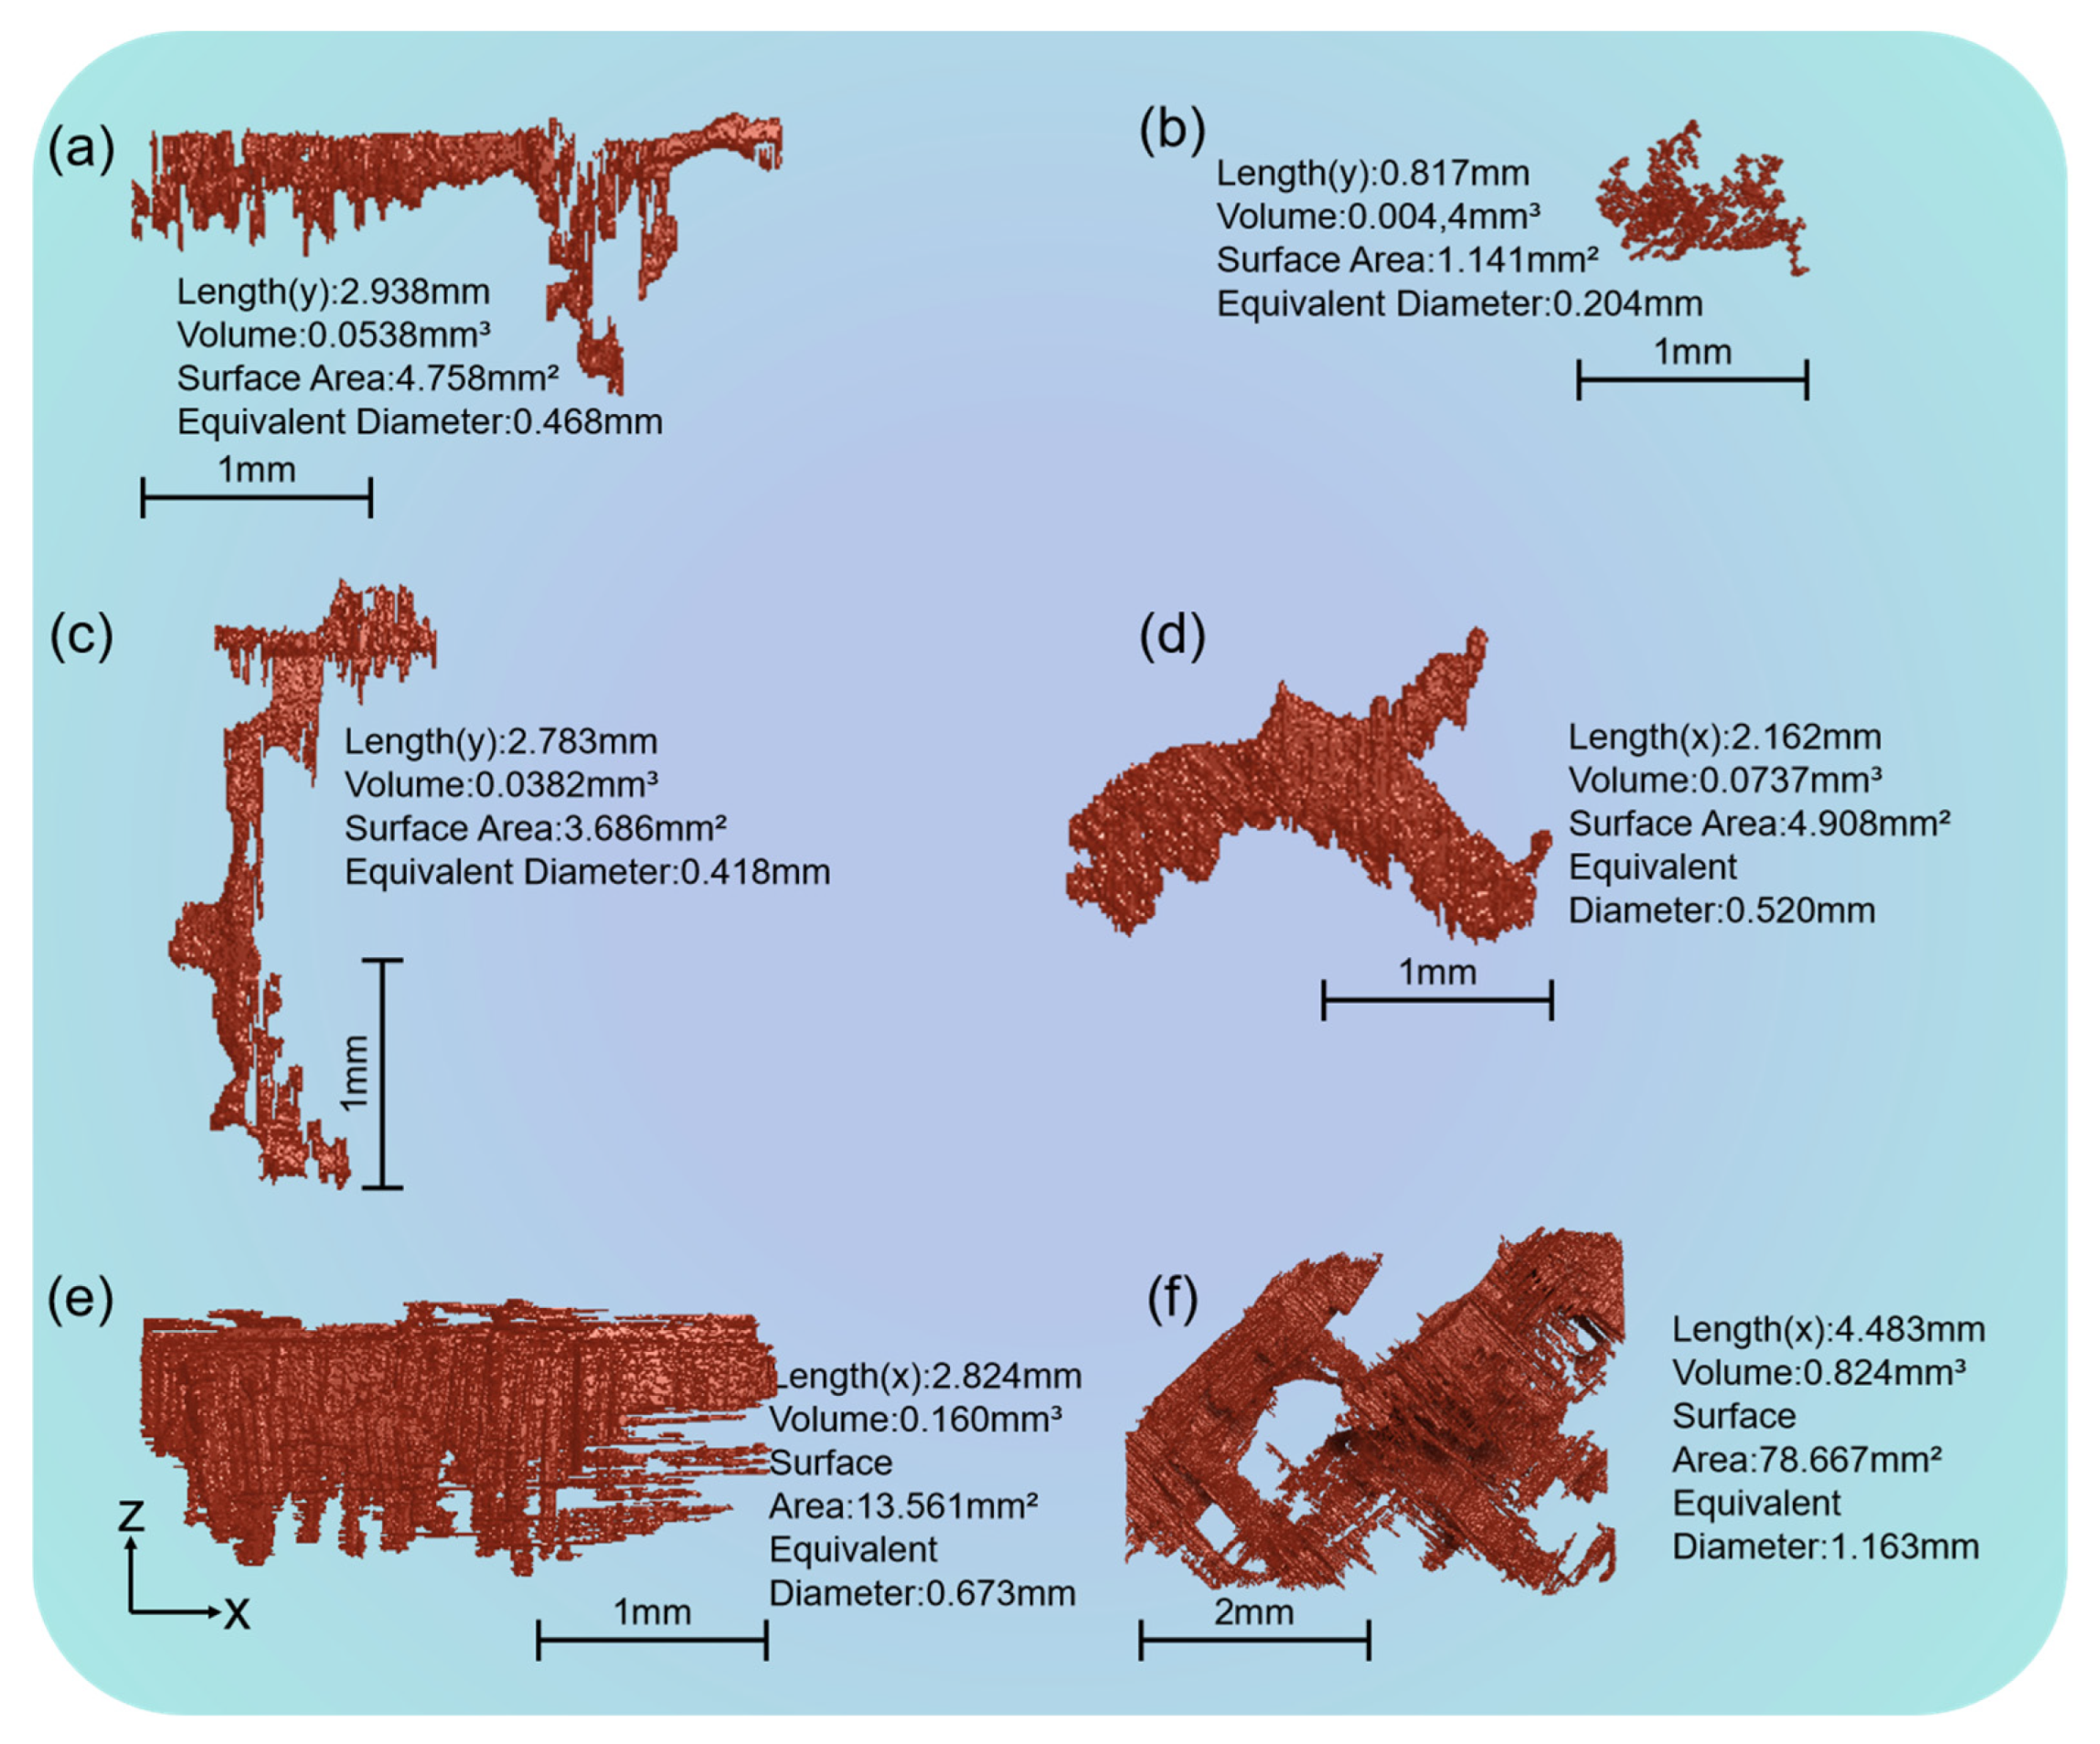
Figure 14 shows the morphology and key geometric parameters of the largest pores extracted from the six laminated plate specimens through 3D reconstruction. From the morphological features, the largest pores in different material systems and layup structures show significant differences: the largest pore volumes in carbon fiber laminates (C0/90 and C±45) are relatively small (0.0538 mm
3 and 0.0044 mm
3, respectively), with relatively regular shapes and equivalent diameters all less than 0.5 mm; in carbon/glass hybrid laminates (CGC0/90 and CGC±45), the largest pore volumes are significantly larger (0.0382 mm
3 and 0.0737 mm
3), and the shapes tend to be more complex, with surface areas significantly increased, especially in CGC±45, where the pore surface area reaches 4.908 mm
2, indicating that irregular large pores are prone to forming in the interface region. In glass fiber laminates (G0/90 and G±45), the largest pores further expand, with the largest pore volume in the G±45 sample reaching as high as 0.824 mm
3, the equivalent diameter reaching 1.163 mm and the surface area sharply increasing to 78.667 mm
2, presenting a clearly flattened structure extending along the interlaminar direction, reflecting the severe tendency of pore coalescence and expansion in glass fiber composites under the ±45 layup.
6. Conclusions
On the basis of X-ray Micro-CT and deep learning technology, this paper systematically realizes the precise identification and quantitative analysis of internal pore defects in CFRP, GFRP and C/G hybrid laminates, and mainly draws the following conclusions.
(1) The type of material significantly affects the pore characteristics. Carbon fiber laminates exhibit the best resistance to pores, with small-sized pores being the main type and evenly distributed. Glass fiber laminates have the highest porosity, with large-sized pores frequently occurring and strong process sensitivity. The pore characteristics of carbon/glass hybrid laminates lie between the two, but pore enrichment is prone to occurring at the interlaminar interface.
(2) The layup structure has a certain influence on the identification of pores, especially in CFRP plates. Deep learning can improve the accuracy of defect identification. Among them, the U-Net++ model effectively overcomes the ambiguity problem at the carbon fiber–pore boundary in traditional threshold segmentation, significantly improving the recognition rate of small pores and complex-shaped pores, laying the foundation for three-dimensional quantitative analysis.
(3) It reveals the multi-dimensional quantification of pore distribution patterns. Through three-dimensional pore reconstruction, face porosity curves and pore volume proportion analysis, it clarifies the heterogeneity of pore distribution within and between layers, especially in the z-direction (thickness direction), where the porosity fluctuates sharply, revealing that the interlayer interface is a defect-sensitive area.
(4) Aiming at the characteristics of different fiber systems (the grayscale of carbon fibers overlaps with that of pores, the density of glass fibers is similar to that of the resin, and the interface of hybrid laminates is complex), the optimized U-Net++ model achieves efficient and accurate pore segmentation. The false detection rate of pores is as low as 4.5–15.7%, far superior to the traditional manual threshold segmentation method (12.7–36.9%), verifying the reliability of this method.
This study established a quantitative evaluation method for defects in composite materials by integrating Micro-CT with deep learning. It clarified the influence mechanism of material combinations and ply designs on pore formation, providing important experimental data and process guidance for the reliable application of composite materials in high-end equipment such as aerospace and rail transportation. In subsequent research, we will expand to variables such as pressure process parameters, matrix composition ratios and mechanical loads. We will conduct in-depth analyses of the correlations between these factors and pore characteristics and build a pore prediction model to provide support for the optimization of composite material manufacturing processes and the prediction of material performance.

