You are currently viewing a new version of our website. To view the old version click .
Applied Sciences
  • Article
  • Open Access

14 November 2025

Changes in Intra-Set Biomechanics During a 3RM Deadlift in Strength-Trained Women: A Biomechanical Analysis

,
,
and
Department of Sports Sciences, Nord University, 7600 Levanger, Norway
*
Author to whom correspondence should be addressed.
This article belongs to the Special Issue Biomechanical Analysis for Sport Performance

Abstract

The conventional deadlift is frequently performed in multiple-repetition sets at loads exceeding 80% of one-repetition maximum (RM) to increase maximal strength in the posterior chain. Fatigue-induced intra-set movement alterations have been observed in various exercises and loading ranges, but whether they occur under strength-specific deadlift conditions remains poorly understood. This study compared the intra-set development of spinal and lower extremity kinematics, net joint moments (NJMs) of the lower extremities, and surface electromyography (sEMG) amplitudes during a 3RM deadlift using statistical parametric mapping. Ten strength-trained women (body mass: 69.2 ± 8.1 kg, height: 166.3 ± 3.1 cm, age: 23.2 ± 3.7 years) lifted 100.6 ± 18.1 kg for a set of 3RM deadlifts. Across repetitions, spinal flexion and hip extension angles increased, while barbell velocity and peak angular hip extension velocity decreased. In contrast, hip NJMs and sEMG amplitudes showed minimal or no significant differences between repetitions. These findings suggest that as fatigue accumulates during a 3RM set, lifting capacity is maintained primarily through kinematic adjustments rather than increased hip extensor contribution.

1. Introduction

The conventional deadlift (deadlift) is a multi-joint exercise used to increase strength and hypertrophic adaptations in the posterior chain muscles [,]. During the ascent phase, several large muscle groups contract to raise the lifter into an erect position []. Thus, the exercise is widely regarded as a key benchmark of overall strength []. Consequently, the deadlift is often employed across diverse populations for both development and assessment of maximal strength, including military personnel [], strongman competitors [], and powerlifters []. Because strength development is recognized as high-load-dependent [], these deadlift training protocols typically involve high barbell loads (>80% one repetition maximum (RM)) with few repetitions (<5). At elite levels, these loads impose significant mechanical demands [,], which have been linked to alterations in lifting technique []. For example, Spencer and Croiss [] observed increased spinal flexion in powerlifters performing single-repetition deadlifts when loads increased beyond 90% of 1RM. However, the exact mechanisms underlying these findings remain uncertain, but proposed explanations include compromised ability to maintain consistent technique and performance-oriented self-organization strategies [,,,]. For instance, increased spinal flexion shortens the torso, which reduces the horizontal distance from the barbell to the hip and intervertebral joints [,]. Additionally, it reduces peak hip flexion angles [], which potentially increases the gluteus maximus internal moment arms [], which is speculated to be beneficial for lifting performance.
Moreover, technique has also been shown to vary between repetitions within the same set, as intra-set differences have been reported during fatigue-inducing lifting protocols [,,]. This suggests that a set’s cumulative volume might also affect the degradation of lifting technique [,,]. However, it is uncertain whether these findings apply to strength-specific repetition ranges, which typically means low-repetition sets [], as kinematics have been shown to differ between repetition ranges in multiple exercises [,,]. Regarding deadlift sets < 5 repetitions, Aasa, Bengtsson [] compared spinal and pelvic kinematics across three repetitions at 70% 1RM and reported high intra-set reliability. Yet, the extension of these findings to intra-set spine kinematics at strength-specific loads >80% 1RM is uncertain, considering the aforementioned kinematic differences induced by these loads. Therefore, how intra-set spine kinematics unfold during deadlift sets at strength-specific loads remains largely unexplored. Additionally, no studies have investigated intra-set mechanics and muscle surface electromyography (sEMG) in both the spine and lower extremities during deadlift sets at strength-specific loading ranges. This gap is particularly significant in the context of maximal strength training, as altered lifting technique has been associated with reduced training specificity [,] and increased injury risk [,,,]. Accordingly, a clearer understanding of intra-set biomechanics at strength-specific loading ranges is necessary to establish a foundational groundwork for later studies to build on.
Lastly, women are vastly underrepresented in the deadlift studies cited above. This is despite evidence that men and women differ on a range of key anatomical characteristics relevant to the deadlift [,,,,]. For instance, sex differences in deadlift-related pain locations have previously been attributed to anatomical factors []. Additionally, on a populational average, women have a more pronounced q-angle [,], which is inversely correlated with knee extensor strength [,]. Nevertheless, this underrepresentation substantially limits the generalizability of existing deadlift research to female cohorts. Thus, further research on strength-trained women is warranted, as findings derived predominantly from male cohorts may not be directly applicable.
Therefore, this study aimed to compare the intra-set development of spinal and lower extremity kinematics, net joint moments (NJMs) of the lower extremity, and sEMG amplitudes during a 3RM deadlift set in strength-trained women. We hypothesized that (1) spinal flexion angles would increase progressively throughout the set, consistent with previous findings [,,]; (2) barbell velocity would progressively decrease throughout the set; (3) hip NJM would progressively decrease due to closer perpendicular proximity between the hip joint and barbell from increased spinal flexion, and reduced vertical reaction forces resulting from reduced barbell accelerations; and (4) sEMG amplitude in the prime movers would increase in accordance with Henneman’s size principle [].

2. Materials and Methods

2.1. Experimental Design

To examine intra-set deadlift biomechanics, a within-participant repeated measures design was utilized to compare kinematics, NJMs, and sEMG amplitude between each repetition in a set of 3RM. Participants completed both a familiarization session and an experimental test session. During familiarization, participants received feedback from two experienced powerlifting coaches to enhance proper performance in the experimental session. A minimum of seven days of rest was required between sessions to reduce the risk of fatigue-induced performance. Dependent variables were joint and barbell kinematics, NJMs, and sEMG amplitude, whilst independent variables were repetitions 1, 2, and 3. The data analyzed in this study were obtained from the same experimental data collection as a previous study by our research group [].

2.2. Sample Size Rationale and Participants

Although a priori power analyses are typically used to determine an ideal sample size, it is recognized that recruitment is often constrained by practical limitations []. Ultimately, our study included ten strength-trained women (body mass: 69.2 ± 8.1 kg, height: 166.3 ± 3.1 cm, age: 23.2 ± 3.7 years), and a within-participant design was used to further enhance statistical power. The participants were required to deadlift a minimum of 1.5× body mass for one repetition maximum (1RM) with their hips fully extended at lockout. Each participant had to declare the absence of any injury or illness that could reduce performance. Furthermore, participants were instructed to avoid intense physical activity and alcohol consumption within 48 h of both sessions. Risks and benefits were explained both orally and in text, and informed written consent was obtained prior to participation. The study adhered to the latest revision of the Helsinki Declaration and was approved by the Norwegian Agency for Shared Services in Education and Research (project number: 404365)

2.3. Procedures

Each participant performed two sessions: (1) a familiarization session to acquaint participants with the testing protocol, establish the 3RM load, and conduct anthropometrical measurements; (2) an experimental session where experimental data was collected. As part of a broader data collection, participants also performed alternative deadlift variations, which were analyzed in another study []. During familiarization participants’ body height (cm) and horizontal acromion length (cm left-right) were acquired with a measuring tape, while body mass (kg) was measured with a Tanita scale (MC-780MA, Tanita, Riga, Latvia). Stance width was standardized to 1.0× acromion length and marked with tape for both sessions, and participants were instructed to keep the medial part of the calcaneus on the tape for all repetitions. A general warm-up consisting of three sets of 10 repetitions with an unloaded Olympic barbell (Ohio power bar, Rogue Fitness, Pori, Finland) was performed, followed by a standardized warm-up protocol []. Thus, participants performed deadlift sets of progressively increasing load, culminating in performing a set of 100% 3RM. Mean barbell ascent velocity was measured during the 3RM set with a linear encoder (ET-Enc-02, Ergotest Technology AS, Langesund, Norway) and saved for use in the experimental session. The experimental session commenced with the same warm-up protocol as the familiarization session, before participants started the experimental testing. To account for daily strength fluctuations, the load was adjusted by 1–10 kg based on ascent velocity from familiarization or inability to achieve lockout, and the highest completed load with acceptable technique, approved by the two experienced powerlifting coaches, was selected for analysis. If an additional set was required, participants rested for 4 min before attempting the next set. Importantly, the goal was to assess intra-set development without the constraints of powerlifting rules to observe how the body self-organizes throughout a maximal deadlift set. Therefore, the lockout was defined as acceptable at maximal hip extension, regardless of knee extension angle.

2.4. Measurements

All three-dimensional kinematic data were collected with a Qualisys system (Qualisys, Gothenburg, Sweden) consisting of software coupled with eight motion capture cameras (Qualisys series 4 and 5+). The cameras sampled at 500 Hz to track thirty-four reflective markers. Markers were attached to the bilateral barbell ends, and the anatomical landmarks of acromion, 7th and 10th thoracic vertebrae, 1st, 3rd, and 5th lumbar vertebrae, anterior superior iliac spine, posterior superior iliac spine, bilateral condyles of the knee, lateral and medial malleolus, sternum, tuber calcanei, and 1st and 5th proximal phalanx. Additionally, marker clusters were positioned bilaterally of the lumbar vertebra markers. The 12th thoracic vertebra was created as a landmark at the 10th thoracic vertebra with a 66% offset towards the 1st lumbar vertebra. On recommendation from the developer (C-motion, Germantown, TN, USA), planar angles were computed in the YZ projection plane through three-point measurements between the heel center, toe center, and ankle center using static trials. These angles were then incorporated into the ankle flexion angle to counteract the ankle offset. Two force plates (type 9260AA6, Kistler, Winterthur, Switzerland), sampling at 2380 Hz, were integrated into the Qualisys system, collecting ground reaction forces for the calculation of NJMs. sEMG data was collected with Trigno Avanti sensors (DELSYS, Natick, MA, USA), sampling at 1111 Hz. Sensors were placed in adherence to SENIAM recommendations [] on the dominant side of erector spinae iliocostalis, gluteus maximus, gluteus medius, biceps femoris, semitendinosus, and vastus lateralis. Thereby, the sEMG sensors were coupled with the Qualisys system to synchronize sEMG and motion capture data.

2.5. Data Analysis

Using Qualisys software v. 2022.2, the 3RM set was first gap-filled before being cut to include only the concentric phase of each repetition. The concentric phase of each repetition was determined by the initiation of the pull and the lockout, and each repetition was saved as a separate file. Thereby, the data was exported in .c3d format to Visual3D 5.0 (C-motion, Germantown, TN, USA) software for modeling and analysis.
A V3D composite pelvis was constructed using the bilateral anterior and superior iliac spine markers, whereas the hip joint center was determined using a built-in regression equation. The relative rotation between proximal and distal Visual 3D default segment coordinate systems in an X-Y-Z Cardan sequence was used to compute meaningful anatomical joint angles, which are equivalent to the joint coordinate system []. Hip, knee, and ankle joint angular velocity was calculated using the default Visual 3D joint velocity computation, defined as the rate of angular change between distal and proximal segments, expressed as a vector in the resolute coordinate system of the reference segment. Thereby, kinematic data were low-pass filtered at 6 Hz using a Butterworth filter. A multi-segmental spine model was used to assess intra-spine kinematics in the thoracic and lumbar spines [] and reduce interference from soft tissue artifacts in this region []. This spine model comprised a lower thoracic segment (T7–T12), an upper lumbar (L1–L3), and a lower lumbar (L3–L5). Thus, inter-segment angles were computed between adjacent segments: the lower thoracic angle was defined between the lower thoracic and upper lumbar segments, and the upper lumbar angle was defined between the upper and lower lumbar segments []. Barbell velocity was calculated using its center of mass velocity (m/s) along the global Z-axis in Visual 3D. NJMs for the hip, knee, and ankle were computed in a resolute coordinate system around all rotational axes using the right-hand rule convention. Kinetic data were filtered with the same Butterworth filter and frequency to further enhance the accuracy of inverse dynamics calculations [,]. The anthropometric data used for inverse dynamics were based on marker data, acquired participant anthropometrics, and the Visual 3D integration of the geometric shape of segments. Joint moments for the hips, knees, and ankles were summed bilaterally and normalized to the participants’ body mass and articulated as Nm/kg []. Only sagittal plane NJMs represented by moments around the flexion/extension axis were obtained for further statistical analysis. Using a custom Visual 3D pipeline, raw sEMG signals were high- and low-pass filtered at 20 Hz and 500 Hz, respectively. These sEMG signals were then wave rectified, and their mean root mean square values were calculated. Lastly, peak joint angular velocity was calculated and exported from Visual 3D via ASCII files. Thus, all other calculated parameters were interpolated to 100 frames to normalize the entire concentric phase (0–100%) and exported from Visual 3D in JSON format via a custom pipeline.

2.6. Statistical Analysis

To examine the effect of repetition on peak angular velocity, normality was assessed with the Shapiro–Wilk test, followed by a discrete repeated measures ANOVA in JASP (Version 0.18.1). Post hoc testing was conducted with a Bonferroni correction. The assumption of sphericity was not violated. Discrete results are presented as mean ± standard deviations. Discrete effect sizes were evaluated with ηp2 (partial eta squared), where <0.01–0.06 constitutes a small effect, <0.06–0.14 a medium effect, and >0.14 a large effect []. The threshold for statistical significance was set at an alpha level of p < 0.05 for all tests. Statistical parametric mapping (SPM) was conducted in MATLAB R2024A (MathWorks, MA, USA) using a custom-made MATLAB application. The application was built by A.H.G. around the spm1d library [] to conduct 1D SPM of the interpolated data. Normality was assessed with the built-in Shapiro–Wilk test. Thus, a repeated measures ANOVA based on random field theory was conducted to evaluate the impact of repetition on kinematics, NJMs, and sEMG amplitudes. Significant regions were post hoc tested using two-tailed paired t-tests with a Bonferroni correction. In instances of non-normal data, statistical non-parametric mapping results were assessed.

3. Results

Participants lifted an average load of 100.6 ± 18.1 kg during the 3RM deadlift trials.

3.1. Kinematics

The discrete ANOVA revealed a significant effect of repetition on peak hip angular velocity in the concentric phase (F = 5.60, p = 0.01, ηp2 ≥ 0.41, Table 1). The post hoc test revealed a significantly lower peak hip extension angular velocity in repetition three compared to repetition one (p = 0.013). No significant effects were revealed for peak knee and ankle joint angular velocities (F ≤ 1.92, p ≥ 0.18, ηp2 ≤ 0.19).
Table 1. Displays mean ± SD peak angular velocities (°/s) during repetition one (second row), repetition two (third row), and repetition three (fourth row) for the hip, knee, and ankle joints. * indicates a significant difference between these two repetitions.
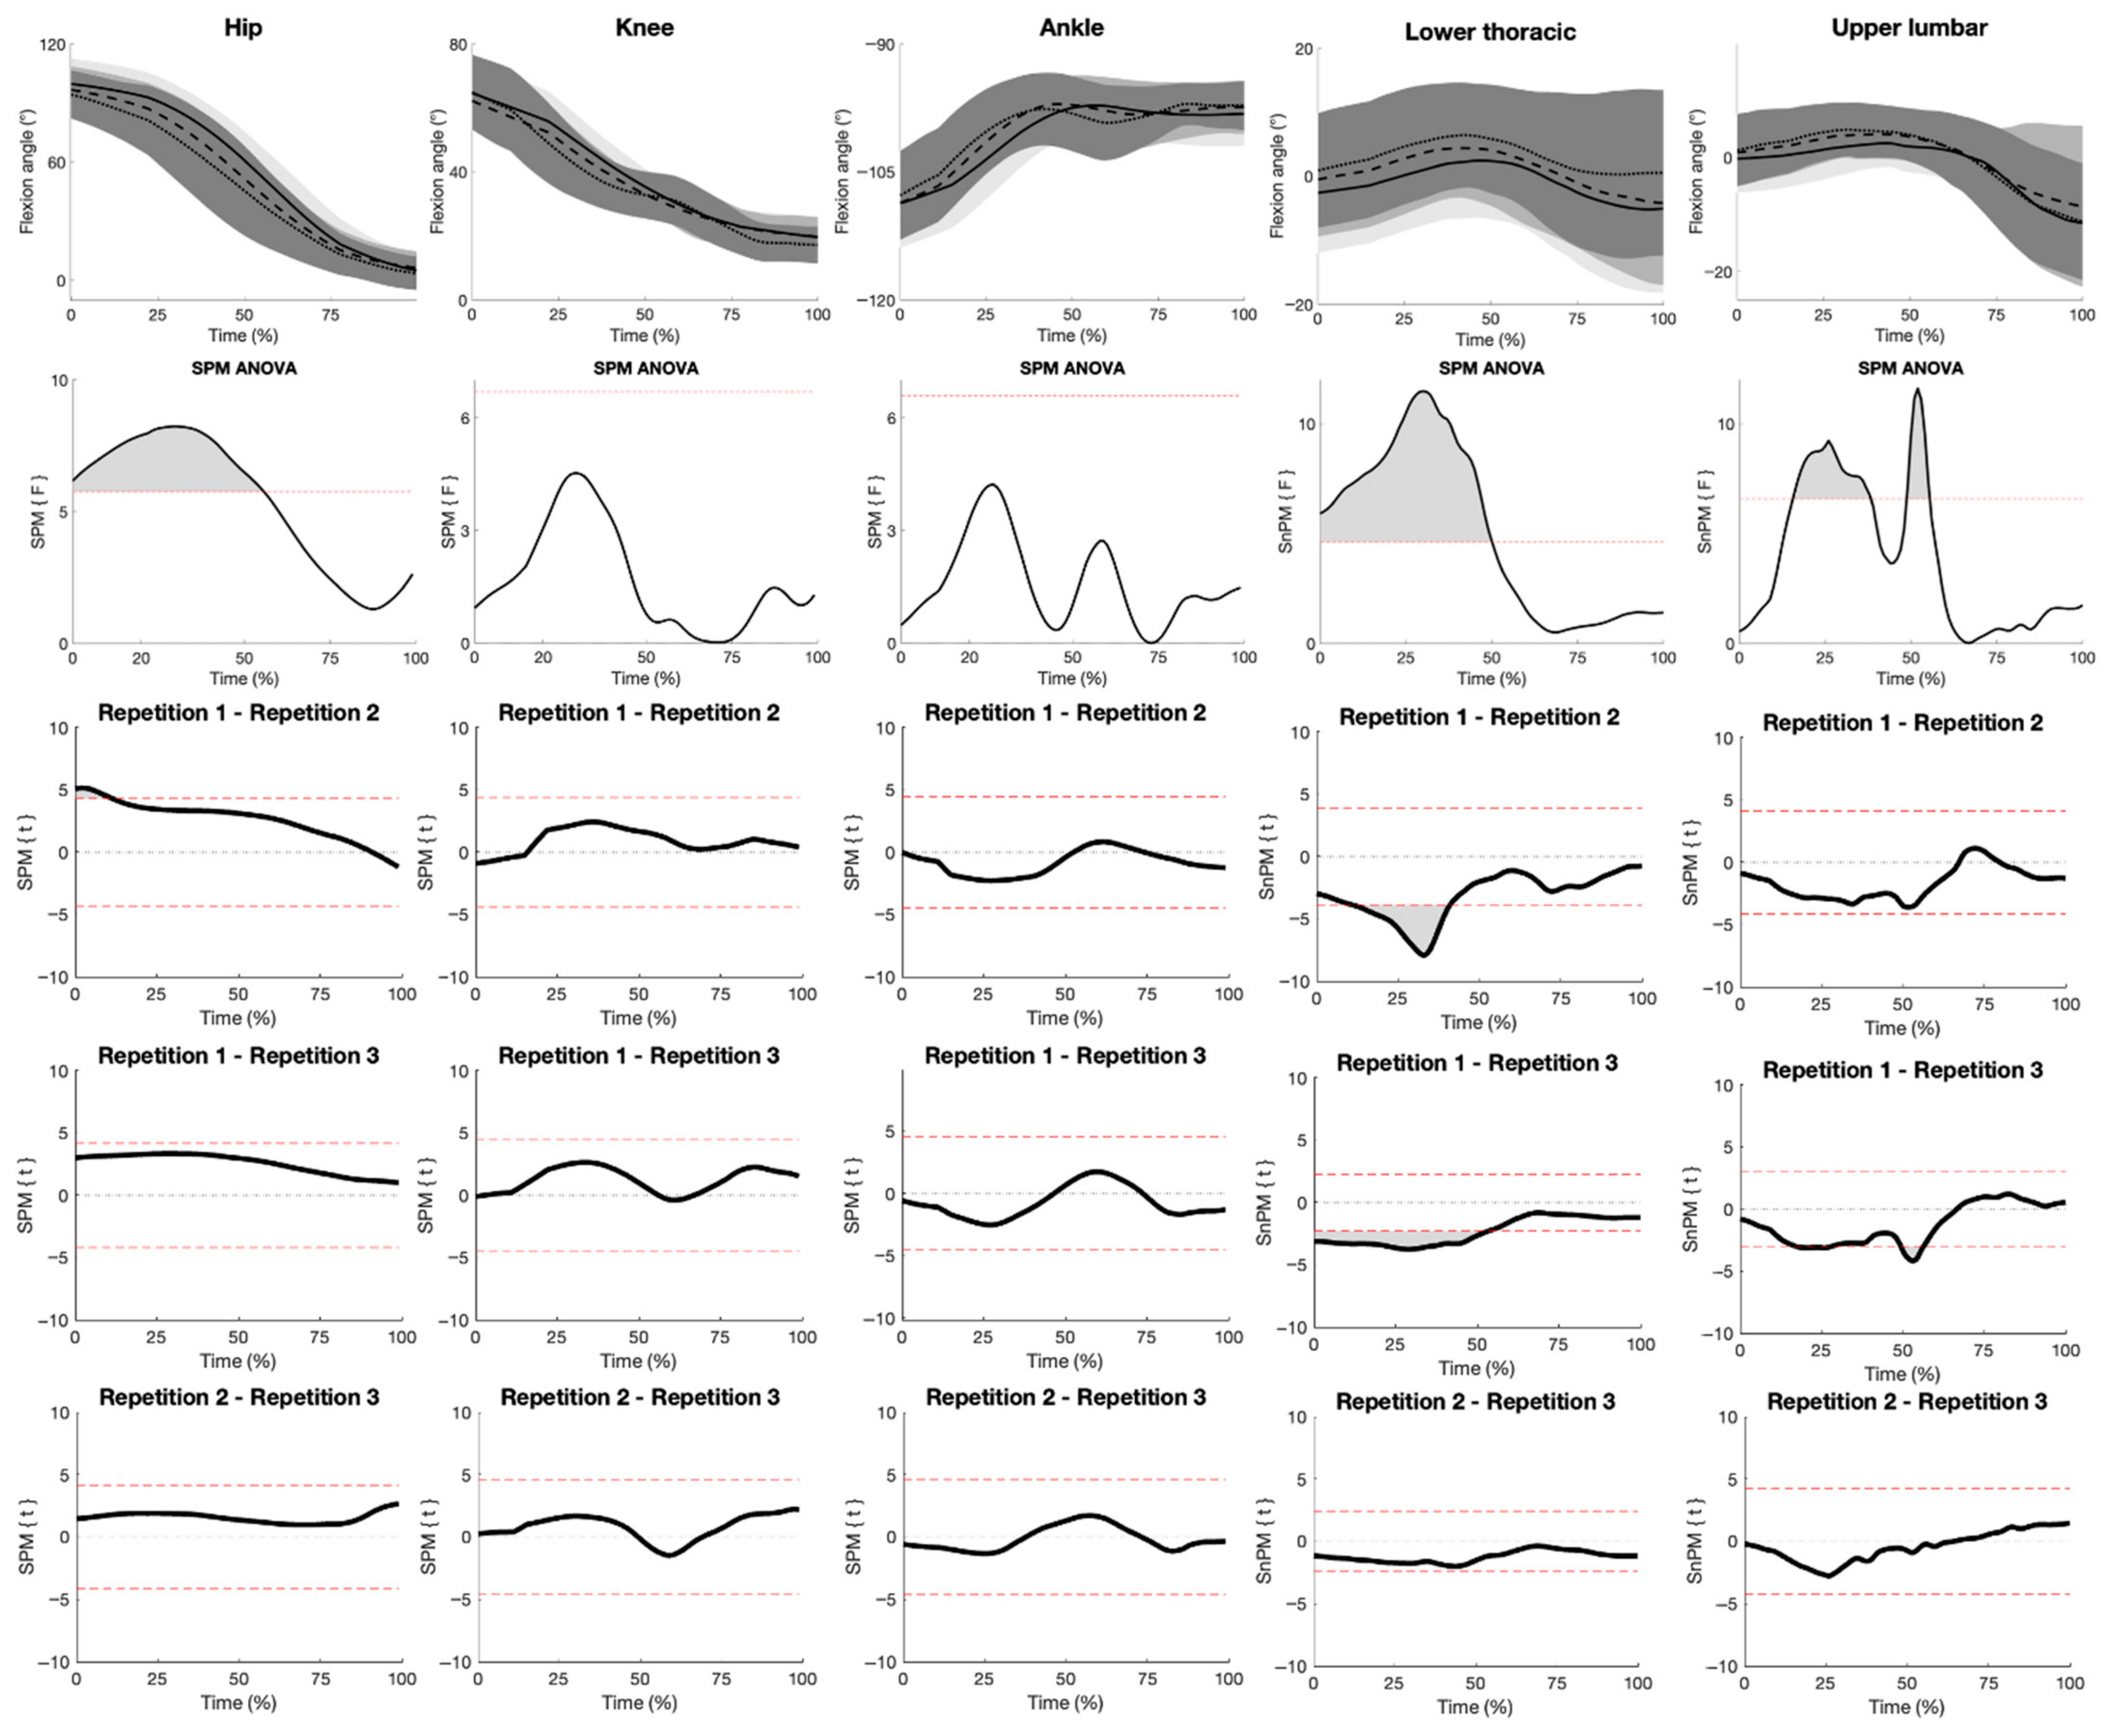
The SPM ANOVA revealed a significant main effect of repetition on hip flexion angles between 0 and 55% of the concentric (Figure 1). Post hoc SPM analysis revealed significantly larger hip flexion angles in repetition one compared to repetition two, between 0 and 7% of the concentric. Also, the SPM ANOVA revealed a significant main effect of repetition on lower thoracic flexion angle between 0 and 50% of the concentric. SPM post hoc testing revealed significantly smaller lower thoracic flexion angles in repetition one compared to repetitions two and three, between 10–45% and 0–50% of the concentric, respectively. A significant main effect of repetition was also observed for the upper lumbar flexion angle, commencing between 16–38% and 49–55% in the concentric. The post hoc analysis revealed significantly smaller upper lumbar flexion angles in repetition one compared to repetition three, between 18–28% and 50–55% of the concentric phase.
Figure 1. Row one displays mean (±SD) joint flexion angles during repetition one (solid lines), repetition two (dashed lines), and repetition three (dotted lines), with time normalized from 0 to 100% in the concentric. Row two presents SPM ANOVA curves, highlighting significant main effects with gray shading where the curves cross the red dotted significance threshold (p ≤ 0.05). The bottom three rows present SPM paired t-test curves with a Bonferroni correction for multiple comparisons.
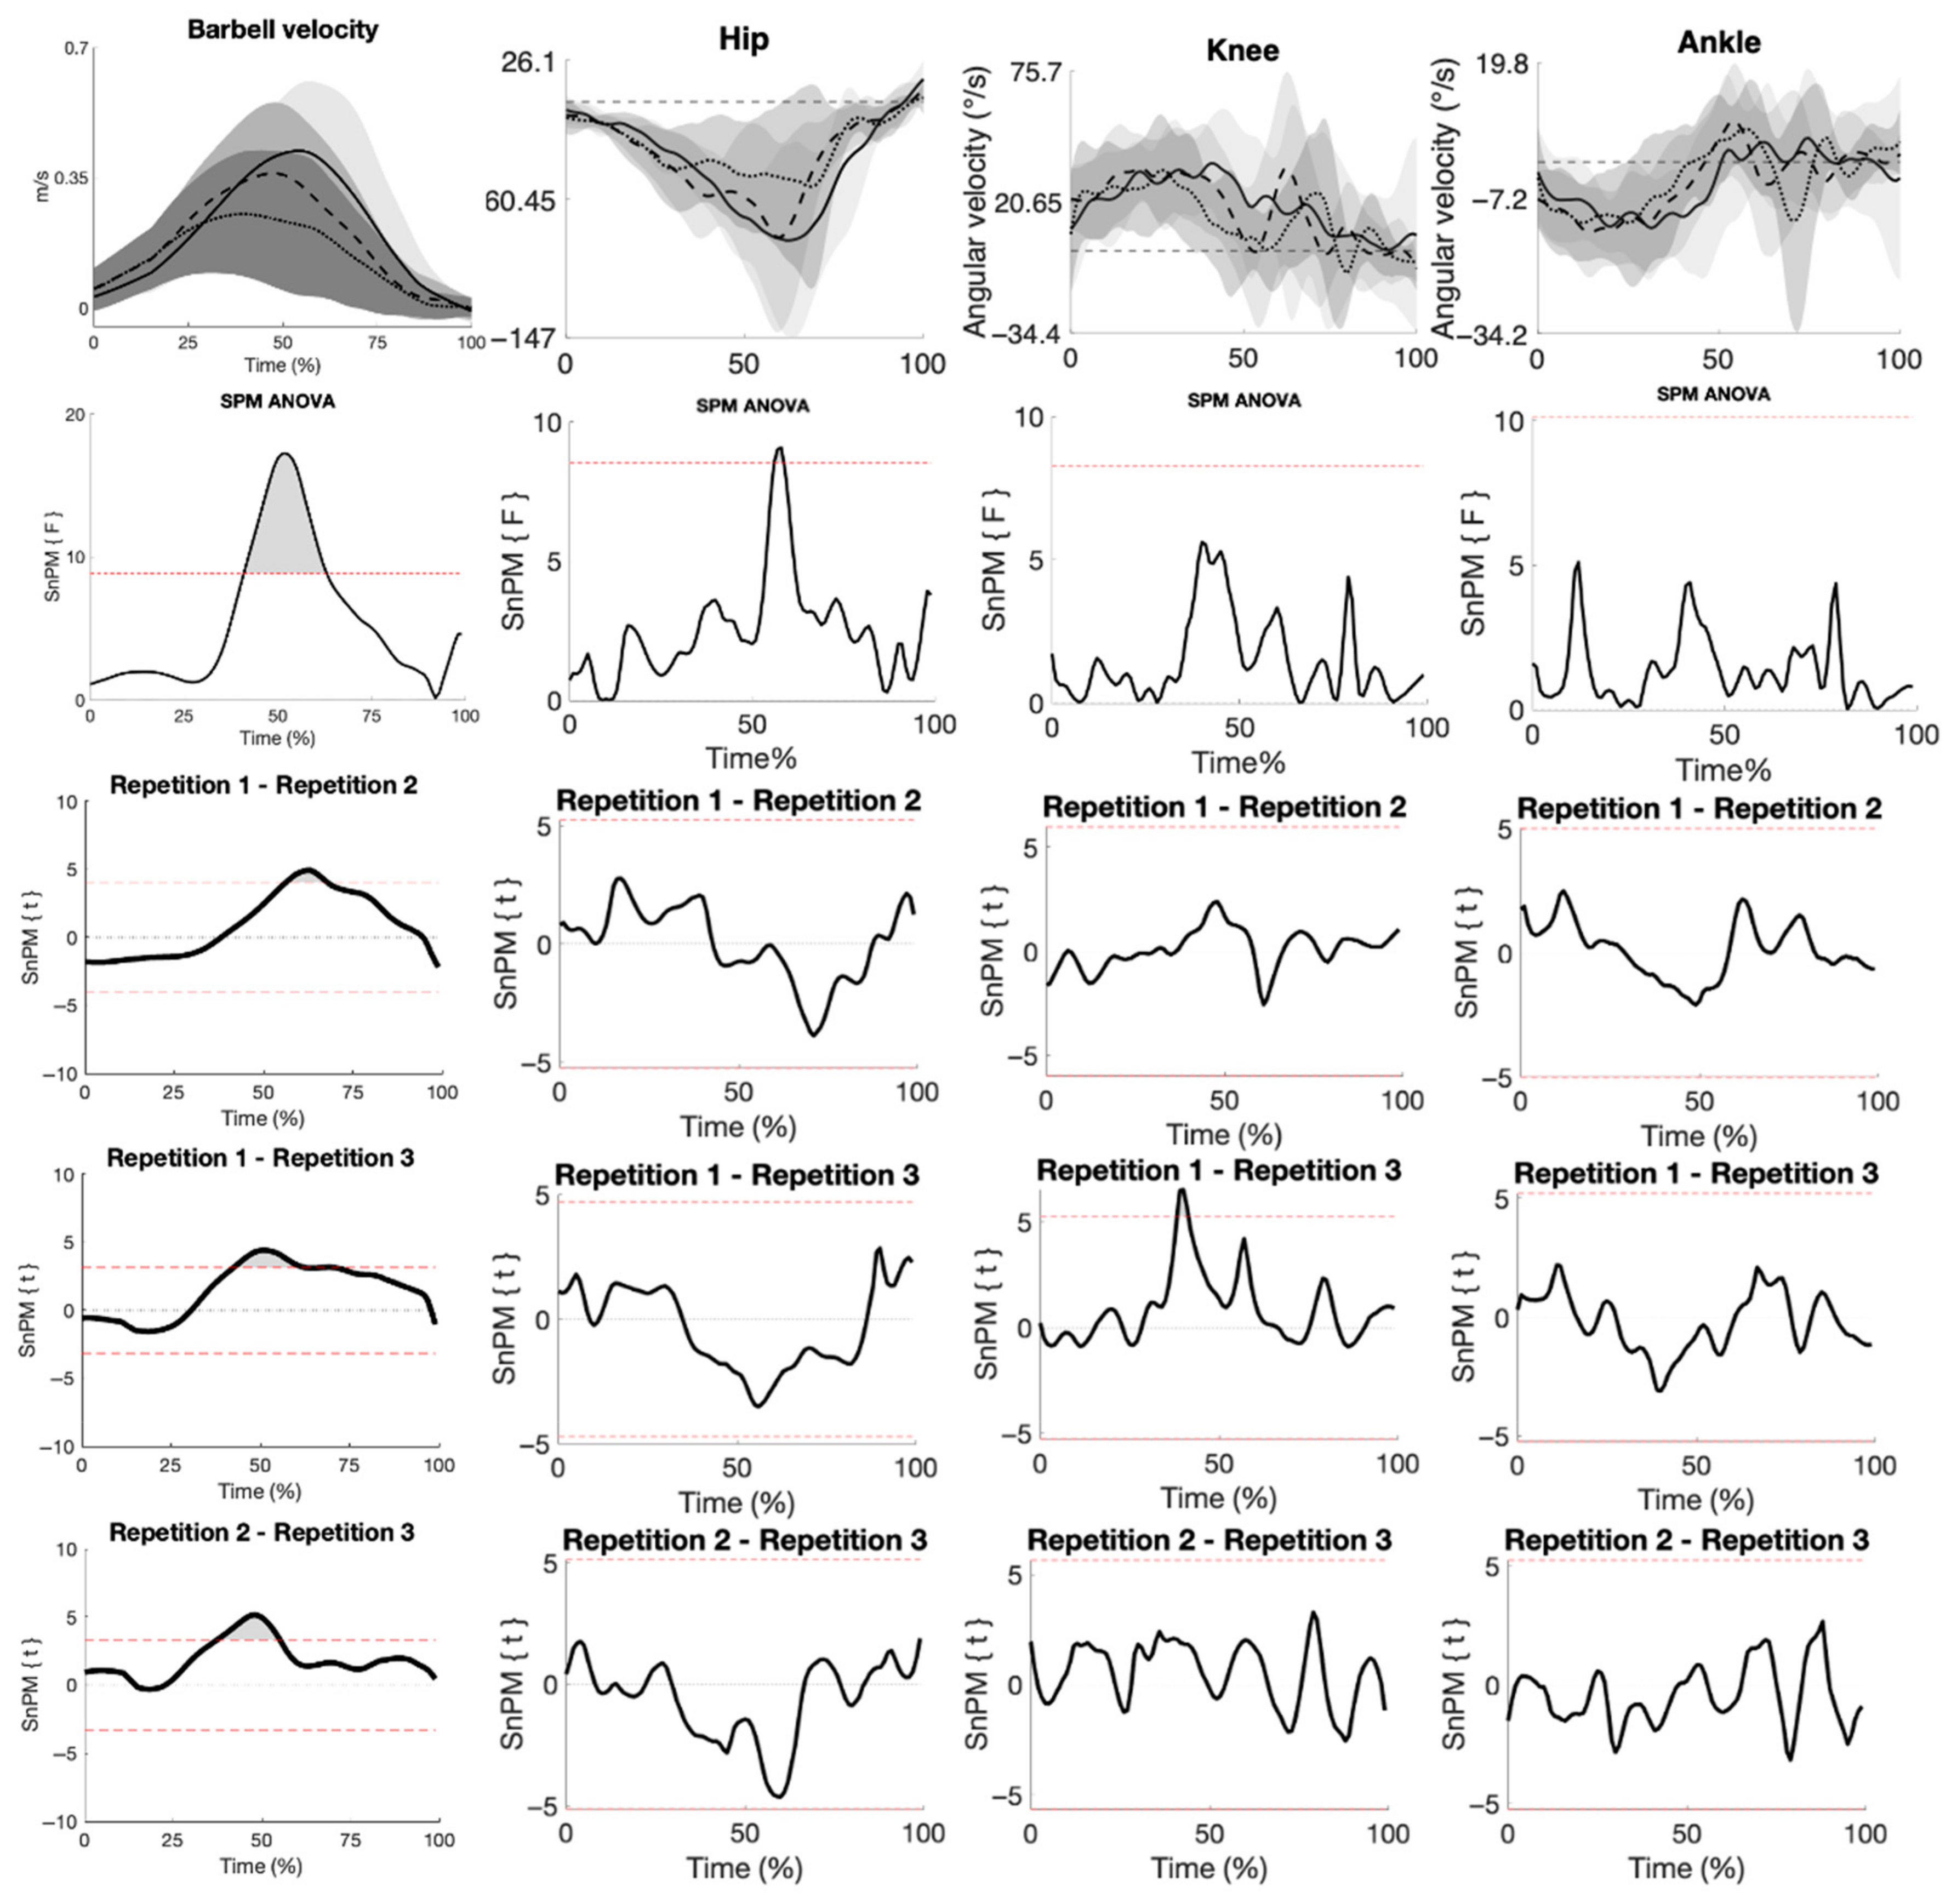
Moreover, a significant main effect of repetition was found on barbell velocity between 41 and 63% of the concentric phase (Figure 2). The SPM post hoc analysis revealed significantly higher barbell velocities in repetition one compared to repetitions two and three, between 41–55% and 45–60% in the concentric. Also, significantly higher barbell velocities were observed in repetition two compared to repetition three, commencing at 57–63% of the concentric. Lastly, a significant main effect of repetition was revealed for hip angular velocity between 55 and 56% of the concentric. However, the post hoc analysis revealed no between-repetition differences.
Figure 2. Row one displays mean (±SD) barbell velocity and joint angular velocities during repetition one (solid lines), repetition two (dashed lines), and repetition three (dotted lines), with time normalized from 0 to 100% in the concentric. Negative angular velocity values represent hip extension, knee flexion, and ankle plantarflexion angular velocities. Row two presents SPM ANOVA curves, highlighting significant main effects with gray shading where the curves cross the red dotted significance threshold (p ≤ 0.05). The bottom three rows present SPM paired t-test curves with a Bonferroni correction for multiple comparisons.

3.2. Net Joint Moments

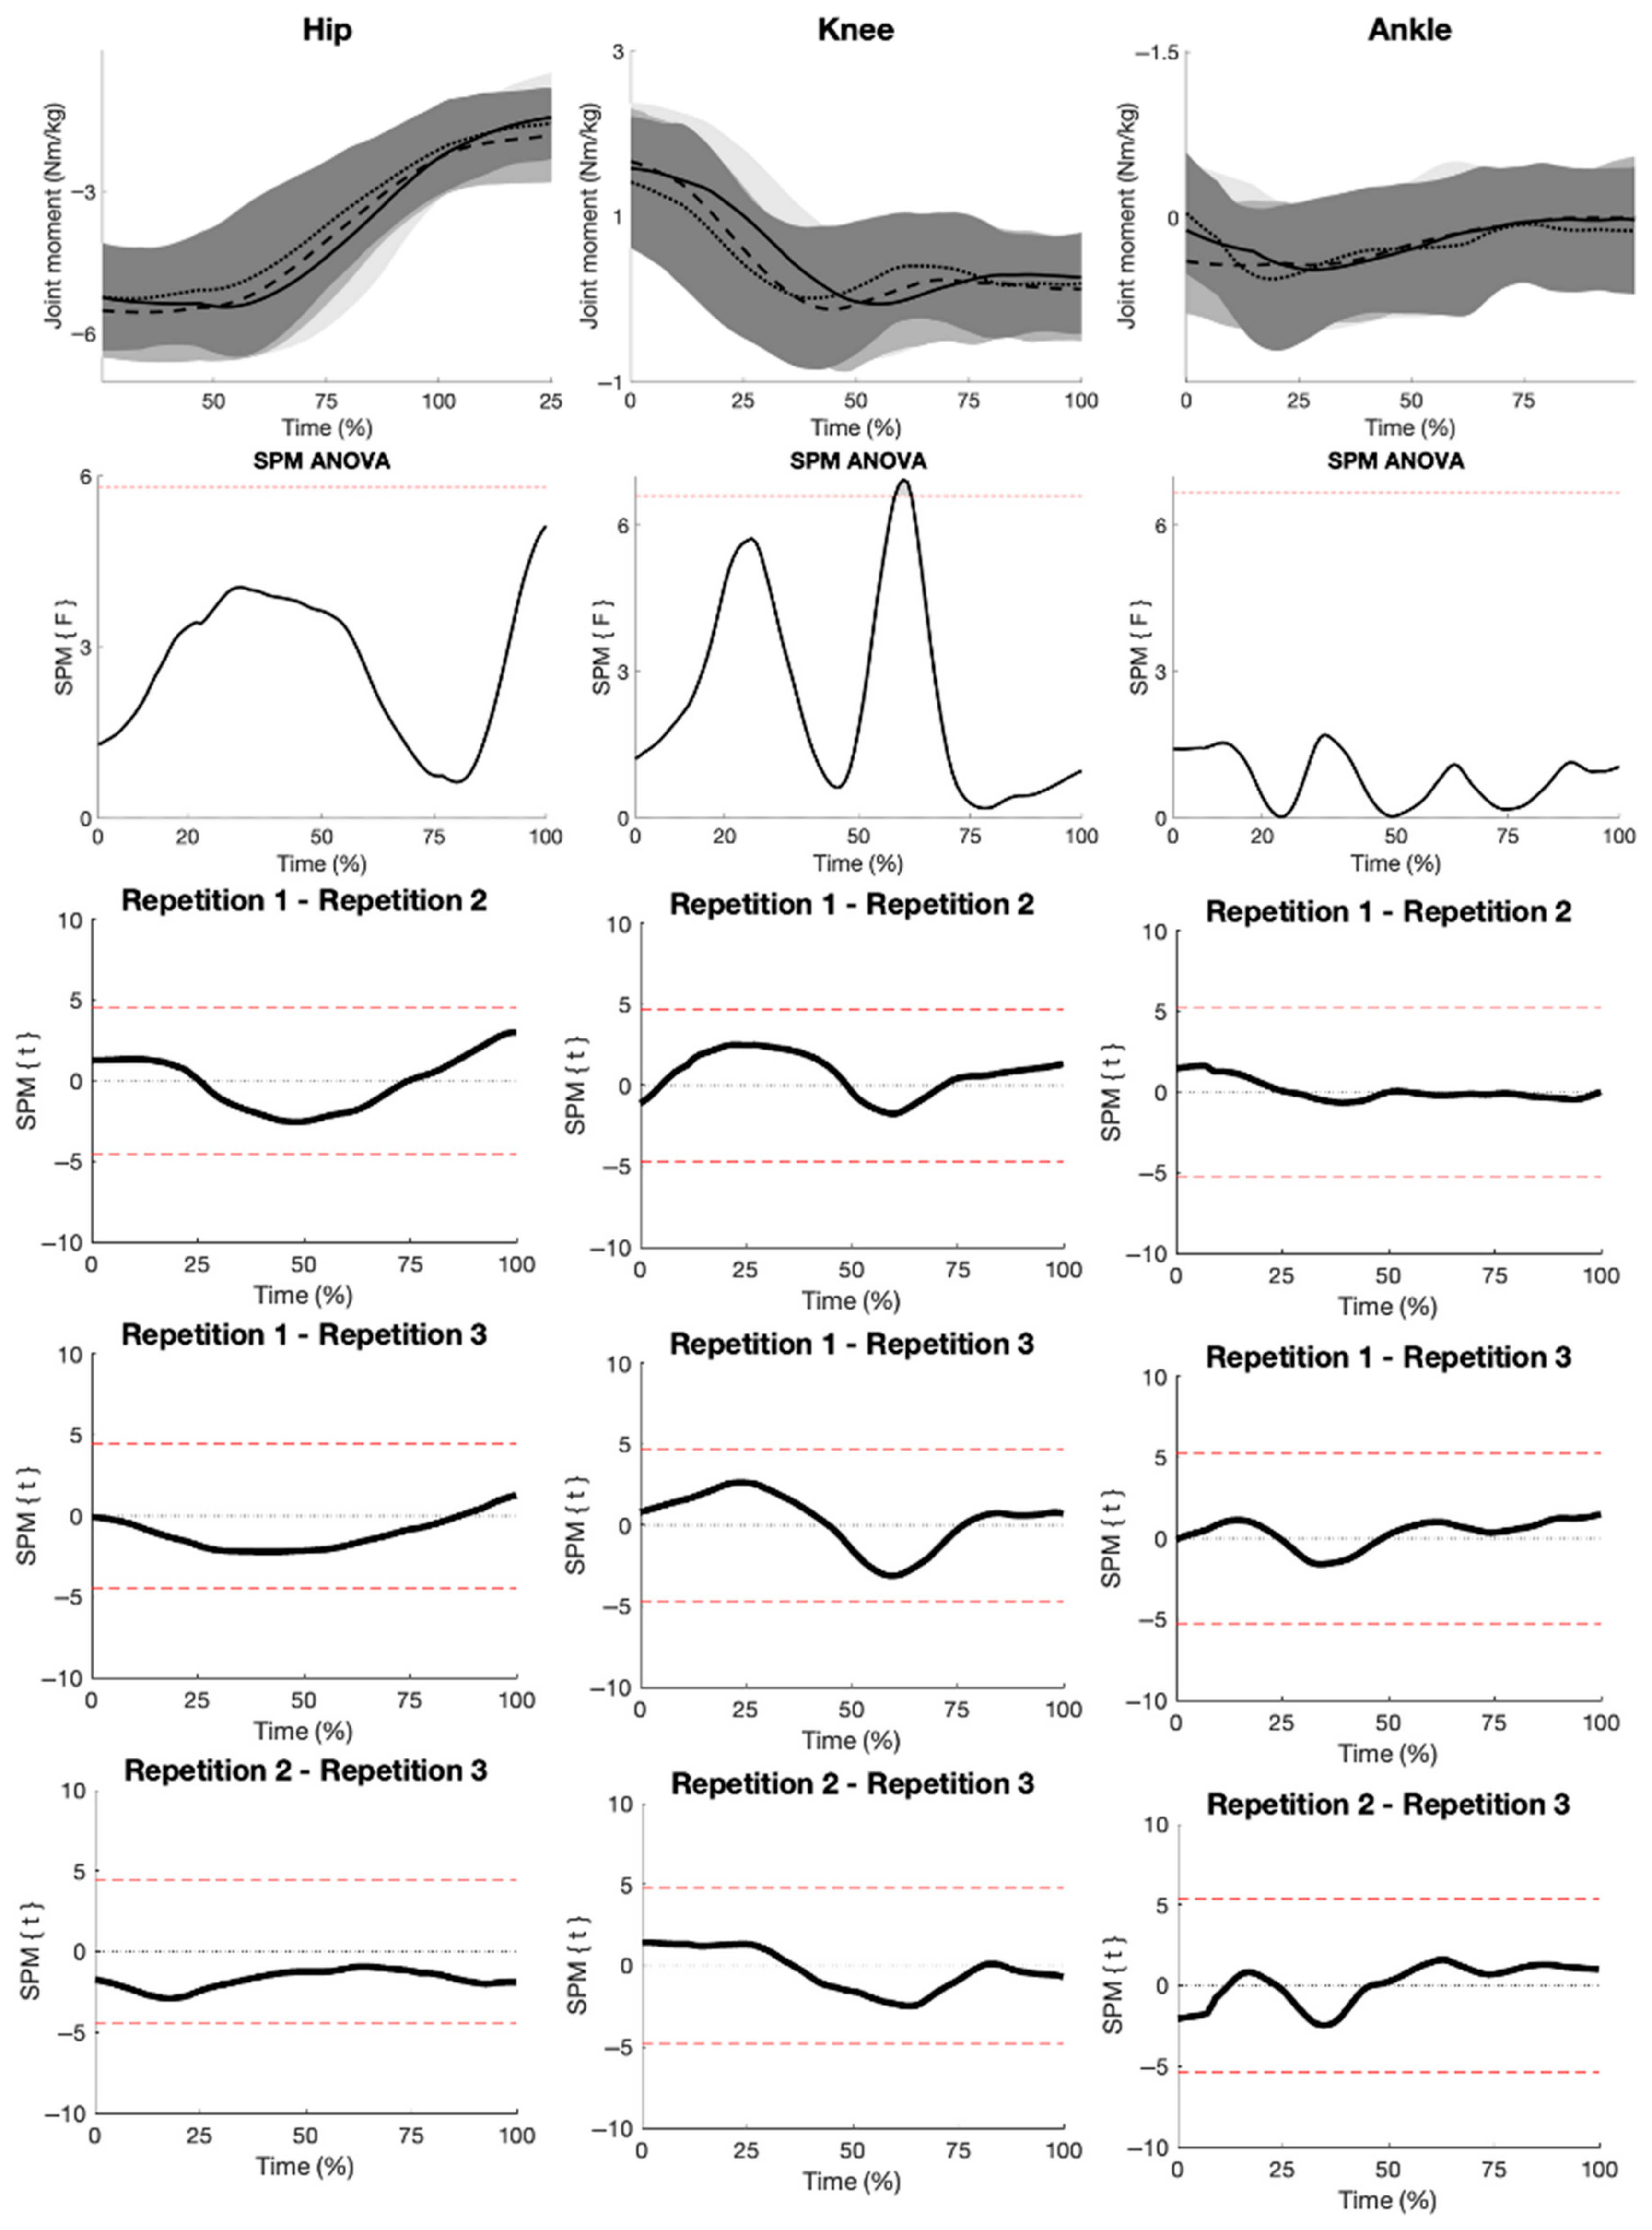
The SPM ANOVA revealed a significant main effect of repetition on knee NJMs between 55 and 58% of the concentric phase (Figure 3). The post hoc revealed no significant differences between repetitions.
Figure 3. Row one displays mean (±SD) NJMs for the different joints during repetition one (solid lines), repetition two (dashed lines), and repetition three (dotted lines), with time normalized from 0 to 100% in the concentric. Row two presents SPM ANOVA curves, highlighting significant main effects with gray shading where the curves cross the red dotted significance threshold (p ≤ 0.05). The bottom three rows present SPM paired t-test curves with a Bonferroni correction for multiple comparisons.

3.3. Surface Electromyography Amplitude

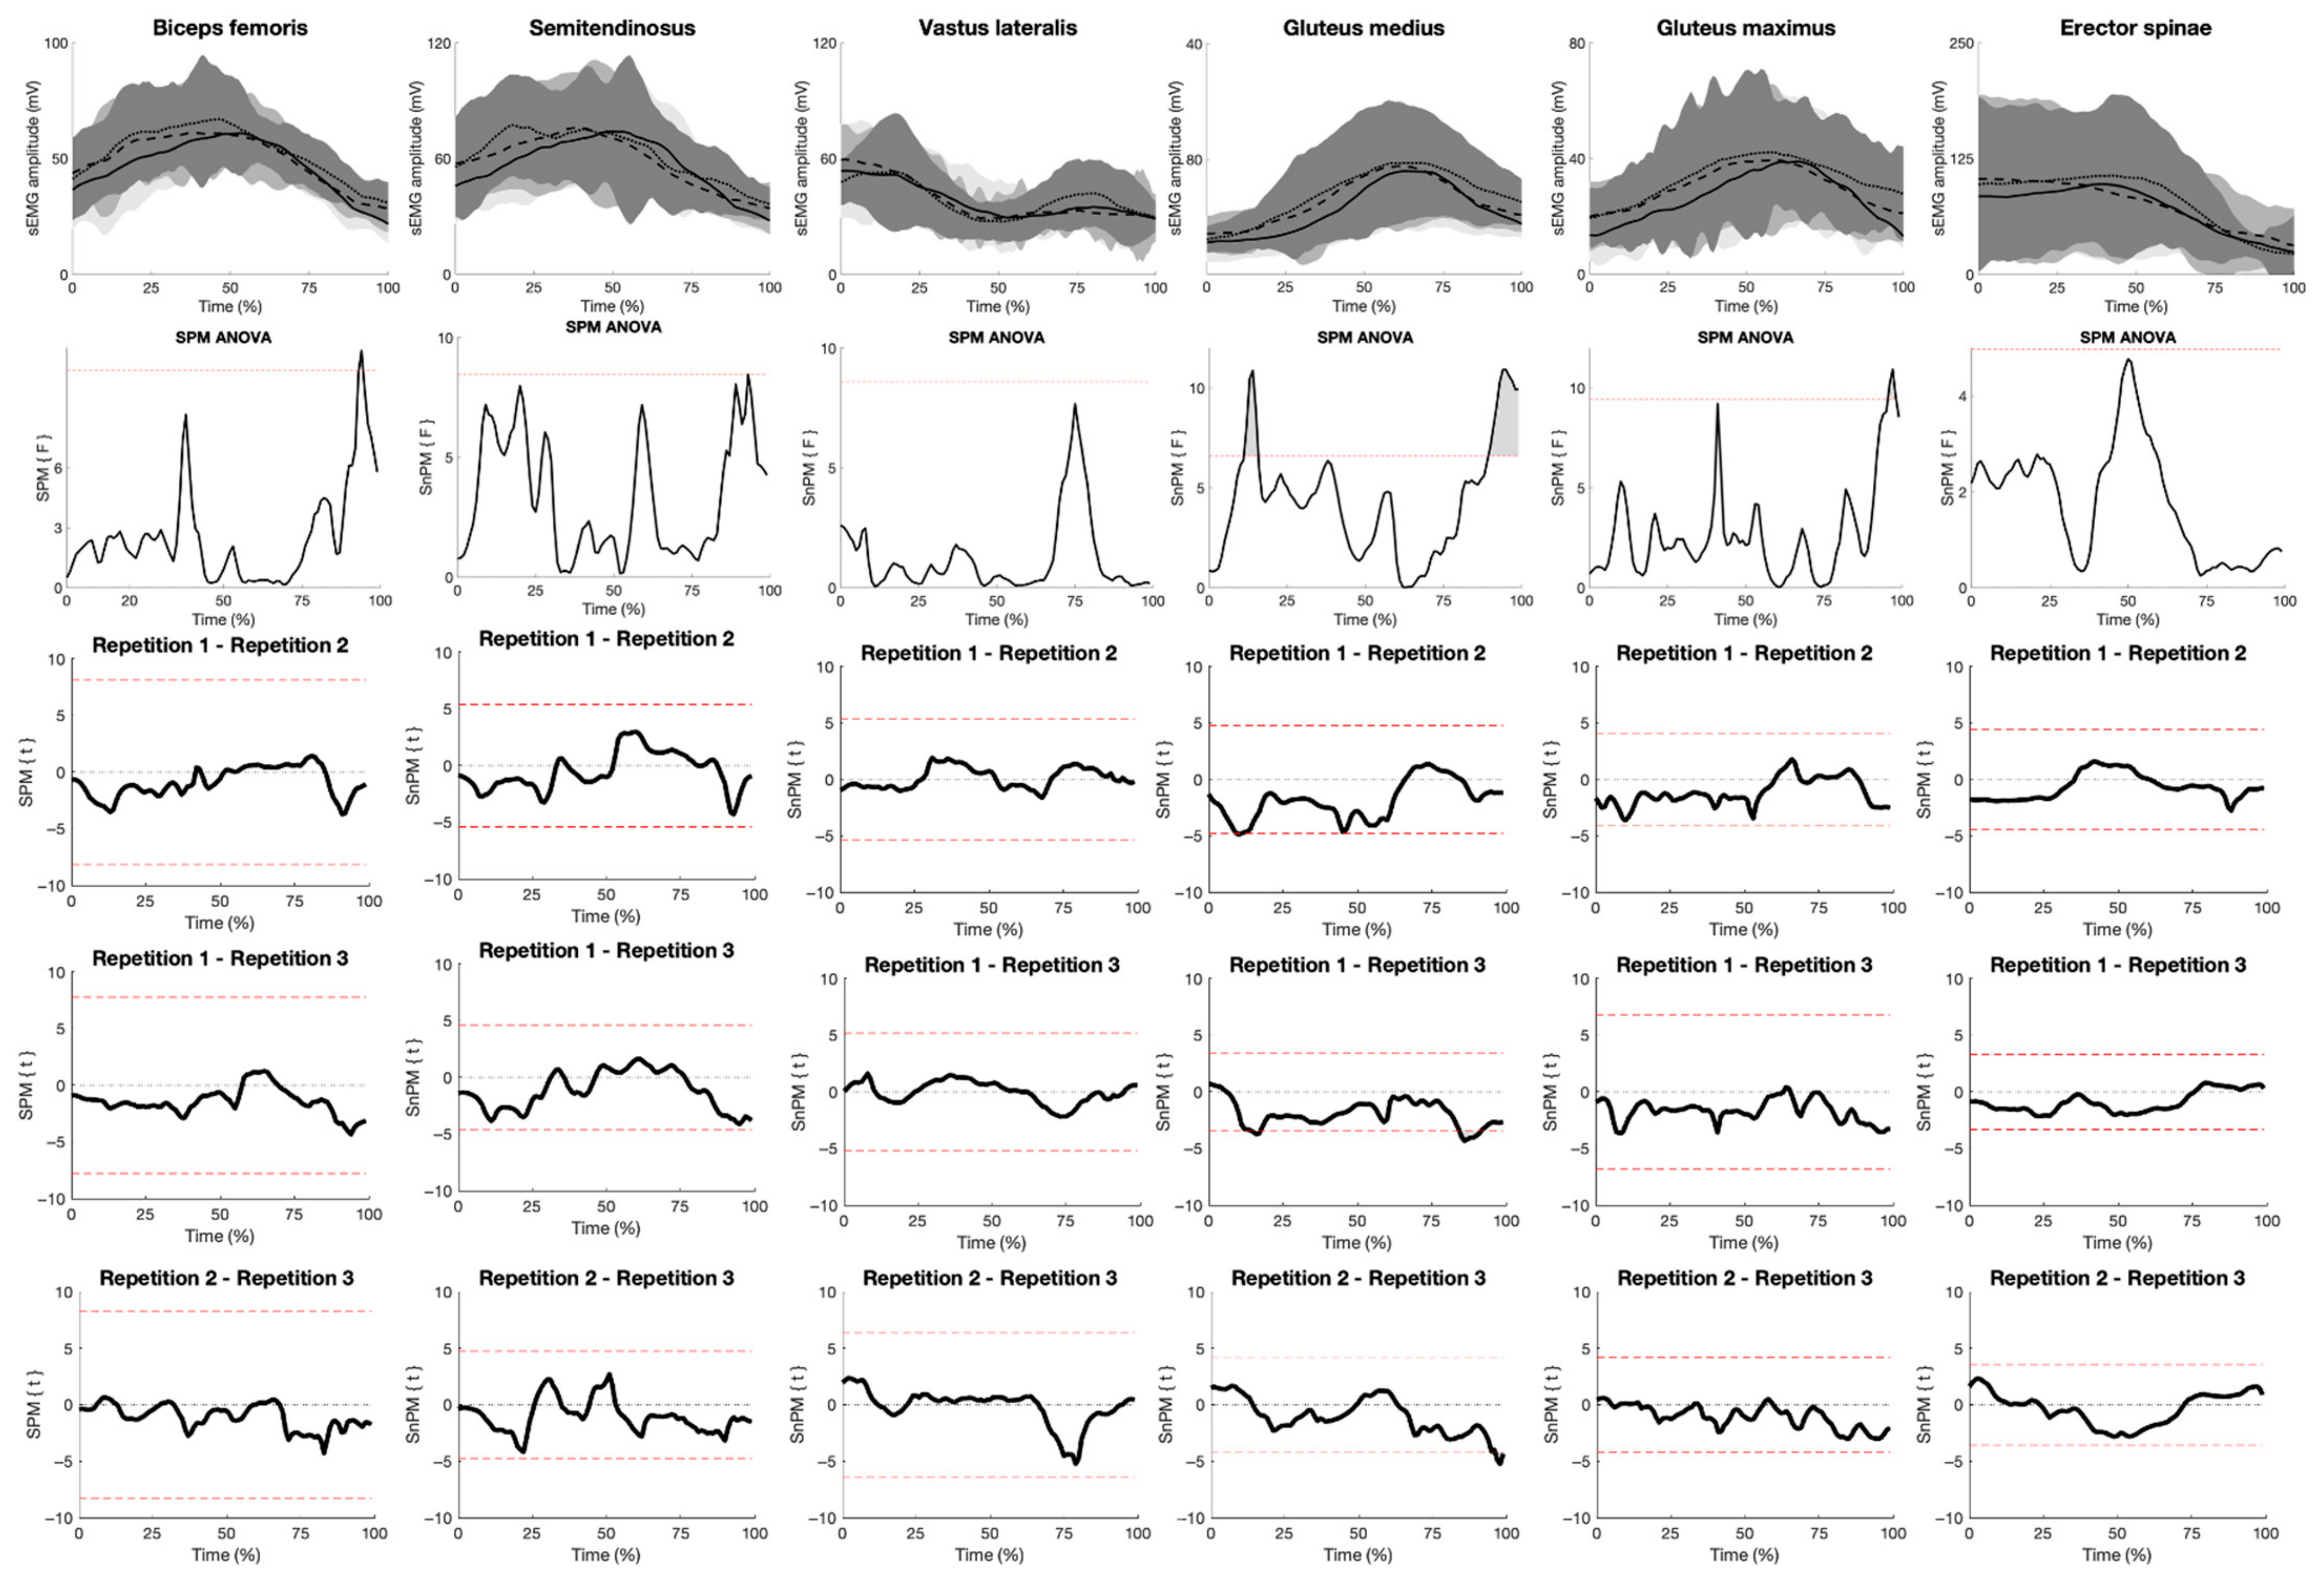
The SPM ANOVA revealed a significant main effect of repetition on gluteus medius sEMG amplitude, commencing between 12–15% and 90–100% of the concentric phase (Figure 4). The SPM post hoc revealed smaller gluteus medius sEMG amplitude in repetition one compared to repetitions two (at 10%) and three (between 15–17% and 90–91%) in the concentric. Additionally, the post hoc revealed smaller gluteus medius sEMG amplitudes in repetition two compared to repetition three, between 97 and 100% of the concentric. Moreover, significant main effects of repetition were revealed for the gluteus maximus at 96–98% of the concentric phase, and for the biceps femoris at 80% of the concentric. The post hocs showed no significant differences between repetitions.
Figure 4. Row one displays mean (±SD) sEMG amplitude for the different muscles during repetition one (solid lines), repetition two (dashed lines), and repetition three (dotted lines), with time normalized from 0 to 100% in the concentric. Row two presents SPM ANOVA curves, highlighting significant main effects with gray shading where the curves cross the red dotted significance threshold (p ≤ 0.05). The bottom three rows present SPM paired t-test curves with a Bonferroni correction for multiple comparisons.

4. Discussion

The aim of this study was to compare the kinematics and sEMG amplitudes of the spine and lower extremities, along with the NJMs of the lower extremities, between repetitions of a 3RM deadlift among strength-trained women. The main findings partly supported the initial hypotheses, as spinal flexion increased and barbell velocity and peak angular hip extension velocity decreased throughout the set. However, hip NJMs did not differ between repetitions as initially hypothesized. Repetition influenced sEMG amplitudes in the biceps femoris, gluteus medius, and gluteus maximus. However, only the gluteus medius showed significant post hoc differences, with higher sEMG amplitudes in repetitions two and three compared with repetition one.

4.1. Kinematics

This is the first study to investigate intra-set biomechanics in a maximal deadlift set <5 repetitions. This limits direct comparisons to prior research to fatigue-inducing protocols performed at lower loads and higher repetition ranges. Consistent with studies employing such protocols, we observed progressive increases in spinal flexion across repetitions [,]. More specifically, lower thoracic flexion angles increased in repetition two and three compared to repetition one in the first 50% of the concentric phase. Additionally, upper lumbar flexion angles increased in repetition three compared to repetition one, between 18–28% and 50–55% of the concentric phase. In fatigue-induced conditions, these kinematic changes have been attributed to paraspinal muscle fatigue [,,,,], as evidenced by reduced paraspinal sEMG amplitudes and a corresponding inability to maintain a rigid spine [,,]. However, we observed no differences in erector spinae sEMG amplitudes, possibly attributed to the different metabolic demands induced by our lower repetition range []. Therefore, our findings do not seem to be attributed to compromised excitation of erector spinae, but rather a movement strategy to adopt a more biomechanically advantageous posture [].
This movement strategy of increasing spinal flexion is previously reported among strength-trained lifters performing lifts > 90% 1RM [] and has been suggested to increase performance during maximal conditions [,,]. For example, flexing the spine at lift-off allows the athlete to begin the lift with more hip extension []. This position provides more favorable internal moment arms for the gluteus maximus, potentially enhancing its capacity to generate hip extension NJMs during the heaviest phase of the lift [,]. This interpretation aligns with our SPM ANOVA results, which revealed a significant main effect of repetition on hip flexion angles at 0–7% of the concentric. Additionally, other benefits such as shorter perpendicular distance between the hip joint and barbell, and increased contribution from passive spinal structures have also been proposed from increasing spinal flexion [,,,]. Collectively, these findings suggest that participants may have increased spinal flexion and hip extension angles as a deliberate compensatory strategy to sustain lifting capacity as fatigue accumulated and the set approached maximal.
Regarding angular velocities, the SPM analysis only revealed a main effect on hip angular velocity between 55 and 56%, with post hocs not yielding significant results. However, as SPM analyses generally require increased statistical power [], we suspected that the present study was underpowered to detect an effect, considering the substantial variability in our angular velocity data. Therefore, we complemented the SPM with a discrete analysis of angular velocities, revealing a significant reduction in peak hip extension angular velocity between repetition one and three. This suggests that the observed decrease in barbell velocity across repetitions is mainly reflected by a slower hip extension movement. Even though the vertical impulse required to raise the barbell remains constant, a reduced vertical barbell acceleration indicates lower peak net forces acting on the barbell. This reduction may lessen instantaneous force production demand on fatiguing high-threshold motor units in the hip extensors and help sustain load-lifting capacity as the set approaches maximum. This observation is consistent with previous findings, which attribute such reductions in barbell velocity to accumulating fatigue during maximal-effort, high-load sets [,].

4.2. Kinetics

Moreover, in contrast to our initial hypothesis, hip NJMs did not decrease across repetitions throughout the set. This hypothesis was based on our confirmed kinematic hypotheses of increased spinal flexion and reduced barbell velocity throughout the set. Increased thoracic and lumbar flexion “shortens the trunk”, thereby increasing the barbell’s proximity to the hip joint, which might shorten external hip flexion moment arms. However, as joint kinetics were calculated in a linked system with inverse dynamics, this simplified external moment arm calculation was not applicable. Therefore, we cannot confirm whether this actually differed between repetitions. Furthermore, although ground reaction forces were not analyzed, the reduced barbell velocity occurred from reduced vertical acceleration, implying smaller forces. Given these potential reductions in moment arms and acting forces, mechanical principles imply a decrease in hip NJMs. However, no statistically significant effect was found. This suggests that any changes in moment arms and acting forces were either too small to produce an effect on hip NJMs or that the study was underpowered to detect such an effect. When visually examining the hip NJM means and standard deviations, it indicates a gradual reduction across repetitions. Although speculative and not statistically significant, these data could suggest a minor effect of repetition on hip NJM. If such an effect existed, we were unable to confirm it with >95% certainty, which would confirm that the study was underpowered to detect it. Future studies should replicate this design with a larger sample to conclude this speculation.

4.3. sEMG Amplitude

Lastly, although to a lesser extent than hypothesized, the SPM ANOVA revealed a significant effect of repetition on the sEMG amplitude of the hip extensors. This increase was hypothesized based on the size principle of motor unit recruitment, whereby higher-threshold motor units are progressively recruited as effort increases []. Accordingly, the gluteus medius showed significant post hoc differences, with sEMG amplitudes increasing from repetition one to repetitions two and three. However, the other hip extensors showed no post hoc differences between repetitions. This may be attributed to the large muscular demands already imposed in the initial repetitions of the set. The average total barbell load at 3RM deadlifts surpasses> 90% of 1RM [,]. At these loads, sEMG amplitudes have been previously shown to plateau in other multi-joint exercises, such as squats [,]. Even though relative effort increases across repetitions due to accumulating fatigue, the already high sEMG amplitudes in the initial repetitions likely limited any further measurable increases. Based on these sEMG findings, increased hip extensor contribution does not appear to be a primary factor in sustaining lifting capacity as the set approached maximal effort. However, this conclusion cannot be drawn from sEMG data alone, and future studies incorporating static optimization are needed to provide a more definitive conclusion.

4.4. Limitations

The current study has several limitations that should be addressed. Our statistical analyses were mainly conducted with statistical parametric mapping based on random field theory. This method complicates the calculation of effect sizes, thereby limiting the range of statistical interpretations available. Additionally, this analysis of continuous 1D data generally requires increased statistical power compared to discrete statistics []. Considering this, along with the factors outlined in the discussion, we suspect the study may have been underpowered to detect certain effects, particularly in parameters such as hip NJMs and hip angular velocity. Moreover, the deadlift repetitions performed did not follow the International Powerlifting Federation technical rulebook, as participants were not required to extend their knees during lockout []. Consequently, our findings may not be fully attributable in settings adhering to these regulations. Moving on, only NJMs calculated by inverse dynamics were reported. These calculations do not account for individual muscle forces, and kinetic interpretations should be made accordingly. Another notable limitation is the absence of normalization tests for spinal flexion metrics, meaning that only total inter-segmental joint angles were reported. While this approach is valid for the current within-participant comparisons [], it complicates interpretation for future research []. Furthermore, we used a skin-marker-based multi-segmental spine model, which is susceptible to measurement errors up to 10 mm due to soft tissue artifacts [,]. Although our within-participant design reduced these effects, future research should interpret direct comparisons with caution. Finally, our spinal model did not include estimation of intervertebral forces and NJMs. Future research should incorporate spinal kinetics and static optimization to provide a more comprehensive understanding of intra-set mechanics during 3RM deadlift.

5. Conclusions

Based on these findings, deadlift kinematics change across repetitions in a 3RM deadlift in strength-trained women. As the set progressed, barbell velocities reduced and participants adopted a posture with increased spinal flexion and hip extension angles, while hip extensor sEMG amplitudes showed negligible change. These joint kinematic adjustments may enhance the NJM production capacity of the hip extensors in the heaviest part of the lift, and increase the contribution from passive spinal structures. Our findings suggest that, as fatigue accumulates and the set approaches maximal effort, lifting capacity is sustained primarily through kinematic changes rather than increased hip extensor contribution.

Author Contributions

Conceptualization, A.H.G., R.v.d.T. and S.L.; methodology, A.H.G., R.v.d.T. and S.L.; software, A.H.G.; validation, A.H.G., R.v.d.T., H.N.F. and S.L.; formal analysis, A.H.G. and S.L.; investigation, H.N.F. and S.L.; resources, R.v.d.T.; data curation, A.H.G.; writing—original draft preparation, A.H.G.; writing—review and editing, A.H.G., R.v.d.T., H.N.F. and S.L.; visualization, A.H.G.; supervision, S.L.; project administration, A.H.G., H.N.F. and S.L.; funding acquisition, none. All authors have read and agreed to the published version of the manuscript.

Funding

This research received no external funding.

Institutional Review Board Statement

Ethical review and approval were waived by the Regional Committee for Medical and Health Research Ethics (REK) North for this study due to it was not a study that was clinically. Just a normal training session.

Data Availability Statement

Data is available on request to the authors.

Acknowledgments

The author would like to thank all participants for their contributions to this study. During the preparation of this manuscript, the authors used [ChatGPT, 5.0] for the purposes of improving the quality of writing. The authors have reviewed and edited the output and take full responsibility for the content of this publication.

Conflicts of Interest

The authors declare no conflicts of interest.

Abbreviations

The following abbreviations are used in this manuscript:
RMRepetition Maximum
NJMsNet Joint Moments
SPMStatistical Parametric Mapping

References

  1. Bird, S.; Barrington-Higgs, B. Exploring the Deadlift. Strength Cond. J. 2010, 32, 46–51. [Google Scholar] [CrossRef]
  2. Stock, M.S.; Thompson, B.J. Sex comparisons of strength and coactivation following ten weeks of deadlift training. J. Musculoskelet. Neuronal Interact. 2014, 14, 387–397. [Google Scholar] [PubMed]
  3. Martín-Fuentes, I.; Oliva-Lozano, J.M.; Muyor, J.M. Electromyographic activity in deadlift exercise and its variants. A systematic review. PLoS ONE 2020, 15, e0229507. [Google Scholar] [CrossRef]
  4. Hales, M.E. Improving the Deadlift: Understanding Biomechanical Constraints and Physiological Adaptations to Resistance Exercise. Strength Cond. J. 2010, 32, 44–51. [Google Scholar] [CrossRef]
  5. Ramirez, V.J.; Bazrgari, B.; Spencer, A.; Gao, F.; Samaan, M.A. Influence of Repetitions-to-Failure Deadlift on Lumbo-Pelvic Coordination, with and Without Body Armor. J. Strength Cond. Res. 2024, 38, 1732–1738. [Google Scholar] [CrossRef]
  6. Winwood, P.W.; Hume, P.A.; Cronin, J.B.; Keogh, J.W. Retrospective Injury Epidemiology of Strongman Athletes. J. Strength Cond. Res. 2014, 28, 28–42. [Google Scholar] [CrossRef]
  7. Schoenfeld, B.J.; Grgic, J.; Van Every, D.W.; Plotkin, D.L. Loading Recommendations for Muscle Strength, Hypertrophy, and Local Endurance: A Re-Examination of the Repetition Continuum. Sports 2021, 9, 32. [Google Scholar] [CrossRef]
  8. Cholewicki, J.; McGill, S.; Norman, R.W. Lumbar spine loads during the lifting of extremely heavy weights. Med. Sci. Sports Exerc. 1991, 23, 1179–1186. [Google Scholar] [CrossRef]
  9. Escamilla, R.F.; Francisco, A.C.; Fleisig, G.S.; Barrentine, S.W.; Welch, C.M.; Kayes, A.V.; Speer, K.P.; Andrews, J.R. A three-dimensional biomechanical analysis of sumo and conventional style deadlifts. Med. Sci. Sports Exerc. 2000, 32, 1265–1275. [Google Scholar] [CrossRef]
  10. Spencer, K.; Croiss, M. The effect of increasing loading on powerlifting movement form during the squat and deadlift. J. Hum. Sport Exerc. 2015, 10, 764–774. [Google Scholar] [CrossRef]
  11. Howe, L.; Lehman, G. Getting out of neutral: The risks and rewards of lumbar spine flexion during lifting exercises. Strength Cond. J. 2021, 3, 1–38. [Google Scholar]
  12. Mawston, G.; Holder, L.; O’sUllivan, P.; Boocock, M. Flexed lumbar spine postures are associated with greater strength and efficiency than lordotic postures during a maximal lift in pain-free individuals. Gait Posture 2021, 86, 245–250. [Google Scholar] [CrossRef]
  13. Pinto, B.L.; Beaudette, S.M.; Brown, S.H.M. Tactile cues can change movement: An example using tape to redistribute flexion from the lumbar spine to the hips and knees during lifting. Human Mov. Sci. 2018, 60, 32–39. [Google Scholar] [CrossRef] [PubMed]
  14. Németh, G.; Ohlsén, H. In vivo moment arm lengths for hip extensor muscles at different angles of hip flexion. J. Biomech. 1985, 18, 129–140. [Google Scholar] [CrossRef] [PubMed]
  15. Ramirez, V.J.; Bazrgari, B.; Gao, F.; Samaan, M. Low Back Biomechanics during Repetitive Deadlifts: A Narrative Review. IISE Trans. Occup. Ergon. Human Factors 2021, 10, 34–46. [Google Scholar] [CrossRef] [PubMed]
  16. van Dieën, J.H.; van der Burg, P.; Raaijmakers, T.A.; Toussaint, H.M. Effects of repetitive lifting on kinematics: Inadequate anticipatory control or adaptive changes? J. Mot. Behav. 1998, 30, 20–32. [Google Scholar] [CrossRef]
  17. Falch, H.N.; Gundersen, A.H.; Larsen, S.; Haugen, M.E.; Tillaar, R.v.D. Comparison of kinematics and electromyography in the last repetition during different maximum repetition sets in the barbell back squat. PeerJ 2024, 12, e16865. [Google Scholar] [CrossRef]
  18. Larsen, S.; Haugen, M.; van den Tillaar, R. Comparison of Kinematics and Electromyographic Activity in the Last Repetition during Different Repetition Maximums in the Bench Press Exercise. Int. J. Environ. Res. Public Health 2022, 19, 14238. [Google Scholar] [CrossRef]
  19. Hegdahl Gundersen, A.; Falch, H.N.; Fredriksen, A.B.; Tillaar, R.v.D. The Effect of Sex and Different Repetition Maximums on Kinematics and Surface Electromyography in the Last Repetition of the Barbell Back Squat. J. Funct. Morphol. Kinesiol. 2024, 9, 75. [Google Scholar] [CrossRef]
  20. Aasa, U.; Bengtsson, V.; Berglund, L.; Öhberg, F. Variability of lumbar spinal alignment among power-and weightlifters during the deadlift and barbell back squat. Sports Biomech. 2022, 21, 701–717. [Google Scholar] [CrossRef]
  21. Strömbäck, E.; Aasa, U.; Gilenstam, K.; Berglund, L. Prevalence and Consequences of Injuries in Powerlifting: A Cross-sectional Study. Orthop. J. Sports Med. 2018, 6, 2325967118771016. [Google Scholar] [CrossRef]
  22. McGill, S.M. Distribution of tissue loads in the low back during a variety of daily and rehabilitation tasks. J. Rehabil. Res. Dev. 1997, 34, 448. [Google Scholar]
  23. McGill, S.M.; Hughson, R.L.; Parks, K. Changes in lumbar lordosis modify the role of the extensor muscles. Clin. Biomech. 2000, 15, 777–780. [Google Scholar] [CrossRef]
  24. Byl, T.; Cole, J.A.; Livingston, L.A. What Determines the Magnitude of the Q Angle? A Preliminary Study of Selected Skeletal and Muscular Measures. J. Sport Rehabil. 2000, 9, 26–34. [Google Scholar] [CrossRef]
  25. Herrington, L.; Nester, C. Q-angle undervalued? The relationship between Q-angle and medio-lateral position of the patella. Clin. Biomech. 2004, 19, 1070–1073. [Google Scholar] [CrossRef]
  26. Janssen, I.; Heymsfield, S.B.; Wang, Z.; Ross, R. Skeletal muscle mass and distribution in 468 men and women aged 18–88 yr. J. Appl. Physiol. 2000, 89, 81–88. [Google Scholar] [CrossRef]
  27. Kanehisa, H.; Ikegawa, S.; Fukunaga, T. Comparison of muscle cross-sectional area and strength between untrained women and men. Eur. J. Appl. Physiol. Occup. Physiol. 1994, 68, 148–154. [Google Scholar] [CrossRef]
  28. Miller, A.E.J.; MacDougall, J.D.; Tarnopolsky, M.A.; Sale, D.G. Gender differences in strength and muscle fiber characteristics. Eur. J. Appl. Physiol. Occup. Physiol. 1993, 66, 254–262. [Google Scholar] [CrossRef]
  29. Binder, D.; Brown-Cross, D.; Shamus, E.; Davies, G. Peak torque, total work and power values when comparing individuals with Q-angle differences. Isokinet. Exerc. Sci. 2001, 9, 27–30. [Google Scholar] [CrossRef]
  30. Henneman, E. Relation between Size of Neurons and Their Susceptibility to Discharge. Science 1957, 126, 1345–1347. [Google Scholar] [CrossRef]
  31. Gundersen, A.H.; Tillaar, R.v.D.; Falch, H.N.; Fredriksen, A.B.; Larsen, S. A Biomechanical Comparison Between Conventional, Sumo, and Hex-Bar Deadlifts Among Resistance Trained Women. J. Strength Cond. Res. 2025, 39, 281–288. [Google Scholar] [CrossRef]
  32. Lakens, D. Sample Size Justification. Collabra Psychol. 2022, 8, 33267. [Google Scholar] [CrossRef]
  33. Larsen, S.; Kristiansen, E.; van den Tillaar, R. New Insights About the Sticking Region in Back Squats: An Analysis of Kinematics, Kinetics, and Myoelectric Activity. Front. Sports Act. Living 2021, 3, 691459. [Google Scholar] [CrossRef]
  34. Hermens, H.J.; Freriks, B.; Disselhorst-Klug, C.; Rau, G. Development of recommendations for SEMG sensors and sensor placement procedures. J. Electromyogr. Kinesiol. 2000, 10, 361–374. [Google Scholar] [CrossRef]
  35. Grood, E.S.; Suntay, W.J. A joint coordinate system for the clinical description of three-dimensional motions: Application to the knee. J. Biomech. Eng. 1983, 105, 136–144. [Google Scholar] [CrossRef]
  36. Papi, E.; Bull, A.M.; McGregor, A.H. Spinal segments do not move together predictably during daily activities. Gait Posture 2019, 67, 277–283. [Google Scholar] [CrossRef] [PubMed]
  37. Xi, X.; Ling, Z.; Wang, C.; Gu, C.; Zhan, X.; Yu, H.; Lu, S.; Tsai, T.-Y.; Yu, Y.; Cheng, L. Lumbar segment-dependent soft tissue artifacts of skin markers during in vivo weight-bearing forward–Backward bending. Front. Bioeng. Biotechnol. 2022, 10, 960063. [Google Scholar] [CrossRef] [PubMed]
  38. Kristianslund, E.; Krosshaug, T.; van den Bogert, A.J. Effect of low pass filtering on joint moments from inverse dynamics: Implications for injury prevention. J. Biomech. 2012, 45, 666–671. [Google Scholar] [CrossRef] [PubMed]
  39. Mai, P.; Willwacher, S. Effects of low-pass filter combinations on lower extremity joint moments in distance running. J. Biomech. 2019, 95, 109311. [Google Scholar] [CrossRef]
  40. Cohen, J.; Cohen, J. Statistical Power Analysis for the Behaviour Sciences (Revised Edition); Routledge: Oxfordshire, UK, 1988; pp. 19–74. [Google Scholar]
  41. Pataky, T.C. One-dimensional statistical parametric mapping in Python. Comput. Methods Biomech. Biomed. Eng. 2012, 15, 295–301. [Google Scholar] [CrossRef]
  42. Hart, J.M.; Fritz, J.M.; Kerrigan, D.C.; Saliba, E.N.; Gansneder, B.M.; Ingersoll, C.D. Reduced quadriceps activation after lumbar paraspinal fatiguing exercise. J. Athl. Train. 2006, 41, 79–86. [Google Scholar] [PubMed]
  43. Coswig, V.S.; Freitas, D.F.M.; Gentil, P.; Fukuda, D.H.; Del Vecchio, F.B. Kinematics and Kinetics of Multiple Sets Using Lifting Straps During Deadlift Training. J. Strength Cond. Res. 2015, 29, 3399–3404. [Google Scholar] [CrossRef] [PubMed]
  44. Dolan, P.; Adams, M.A. Repetitive lifting tasks fatigue the back muscles and increase the bending moment acting on the lumbar spine. J. Biomech. 1998, 31, 713–721. [Google Scholar] [CrossRef] [PubMed]
  45. Hu, B.; Ning, X. The influence of lumbar extensor muscle fatigue on lumbar-pelvic coordination during weightlifting. Ergonomics 2015, 58, 1424–1432. [Google Scholar] [CrossRef]
  46. Sparto, P.J.; Parnianpour, M.; Reinsel, T.E.; Simon, S. The effect of fatigue on multijoint kinematics and load sharing during a repetitive lifting test. Spine 1997, 22, 2647–2654. [Google Scholar] [CrossRef]
  47. Bonato, P.; Ebenbichler, G.R.; Roy, S.H.; Lehr, S.; Posch, M.; Kollmitzer, J.; Della Croce, U. Muscle fatigue and fatigue-related biomechanical changes during a cyclic lifting task. Spine 2003, 28, 1810–1820. [Google Scholar] [CrossRef]
  48. Kraemer, W.J.; Ratamess, N.A. Fundamentals of Resistance Training: Progression and Exercise Prescription. Med. Sci. Sports Exerc. 2004, 36, 674–688. [Google Scholar] [CrossRef]
  49. Purslow, P.P. Strain-induced reorientation of an intramuscular connective tissue network: Implications for passive muscle elasticity. J. Biomech. 1989, 22, 21–31. [Google Scholar] [CrossRef]
  50. Adams, M.A.; Dolan, P. How to Use the Spine, Pelvis, and Legs Effectively in Lifting, in Movement, Stability & Lumbopelvic Pain; Elsevier: Amsterdam, The Netherlands, 2007; pp. 167–183. [Google Scholar]
  51. Robinson, M.A.; Vanrenterghem, J.; Pataky, T.C. Sample size estimation for biomechanical waveforms: Current practice, recommendations and a comparison to discrete power analysis. J. Biomech. 2021, 122, 110451. [Google Scholar] [CrossRef]
  52. Izquierdo, M.; González-Badillo, J.; Häkkinen, K.; Ibáñez, J.; Kraemer, W.; Altadill, A.; Eslava, J.; Gorostiaga, E. Effect of loading on unintentional lifting velocity declines during single sets of repetitions to failure during upper and lower extremity muscle actions. Int. J. Sports Med. 2006, 27, 718–724. [Google Scholar] [CrossRef]
  53. Sanchez-Medina, L.; González-Badillo, J.J. Velocity loss as an indicator of neuromuscular fatigue during resistance training. Med. Sci. Sports Exerc. 2011, 43, 1725–1734. [Google Scholar] [CrossRef]
  54. Gordon, T.; Thomas, C.K.; Munson, J.B.; Stein, R.B. The resilience of the size principle in the organization of motor unit properties in normal and reinnervated adult skeletal muscles. Can. J. Physiol. Pharmacol. 2004, 82, 645–661. [Google Scholar] [CrossRef]
  55. Bishop, A.; DeBeliso, M.; Sevene, T.G.; Adams, K.J. Comparing one repetition maximum and three repetition maximum between conventional and eccentrically loaded deadlifts. J. Strength Cond. Res. 2014, 28, 1820–1825. [Google Scholar] [CrossRef] [PubMed]
  56. NSCA. Essentials of Strength Training and Conditioning; Human Kinetics: Champaign, IL, USA, 2021. [Google Scholar]
  57. Yavuz, H.U.; Erdag, D. Kinematic and Electromyographic Activity Changes during Back Squat with Submaximal and Maximal Loading. Appl. Bionics Biomech. 2017, 2017, 9084725. [Google Scholar] [CrossRef] [PubMed]
  58. Larsen, S.; Kristiansen, E.; Falch, H.N.; Haugen, M.E.; Fimland, M.S.; Tillaar, R.v.D. Effects of barbell load on kinematics, kinetics, and myoelectric activity in back squats. Sports Biomech. 2022, 1–15. [Google Scholar] [CrossRef] [PubMed]
  59. International Powerlifting Federation. IPF Technical Rules Book; International Powerlifting Federation: Luxembourg, 2024. [Google Scholar]
  60. Papi, E.; Koh, W.S.; McGregor, A.H. Wearable technology for spine movement assessment: A systematic review. J. Biomech. 2017, 64, 186–197. [Google Scholar] [CrossRef]
  61. Edington, C. Lumbar Spine Kinematics and Kinetics During Heavy Barbell Squat and Deadlift Variations; University of Saskatchewan: Saskatoon, SK, Canada, 2017. [Google Scholar]
  62. Zemp, R.; List, R.; Gülay, T.; Elsig, J.P.; Naxera, J.; Taylor, W.R.; Lorenzetti, S. Soft tissue artefacts of the human back: Comparison of the sagittal curvature of the spine measured using skin markers an open upright MRI. PLoS ONE 2014, 9, e95426. [Google Scholar] [CrossRef]
Disclaimer/Publisher’s Note: The statements, opinions and data contained in all publications are solely those of the individual author(s) and contributor(s) and not of MDPI and/or the editor(s). MDPI and/or the editor(s) disclaim responsibility for any injury to people or property resulting from any ideas, methods, instructions or products referred to in the content.

Article Metrics

Citations

Article Access Statistics

Multiple requests from the same IP address are counted as one view.