Featured Application
This study employs time series Interferometric Synthetic Aperture Radar (InSAR) techniques to conduct high-precision monitoring of land subsidence in reclaimed urban areas of Tianjin’s Binhai New Area, and analyzes the influence of different land cover types and their dynamic changes on settlement patterns. The findings provide a scientific basis and technical support for infrastructure protection, sustainable spatial planning, and policy formulation in coastal reclaimed regions.
Abstract
Global coastal reclamation areas face significant land subsidence, threatening infrastructure and sustainable development. China’s large-scale projects show particularly severe subsidence. For example, Tianjin’s Binhai New Area contains 413.6 km2 of reclaimed land, and subsidence is driven by soft soil consolidation, industrial loads, and dynamic land use changes. This study addresses the unique geology of coastal reclamation zones: thick, soft clay layers; high porosity; and low soil strength. We employed optimized Small Baseline Subset Interferometric Synthetic Aperture Radar (SBAS-InSAR) technology using 48 Sentinel-1A radar images (2019–2022), which generated high-resolution annual deformation rate maps revealing a north-high, south-low subsidence gradient. Crucially, validation against leveling data confirmed reliability. The systematically quantified results demonstrate built areas and the bare ground intensifies subsidence through structural loads and soil compression. Land use transitions also exacerbate differential settlement. For coastal cities and reclamation zones, key strategies emerge, including regulating structural loads in high-subsidence areas, managing soft soil consolidation, and implementing dynamic monitoring. Aligning development intensity with geological capacity is essential, and adopting adaptive spatial planning can mitigate subsidence hazards. This approach offers a scientific framework for enhancing global coastal resilience.
1. Introduction
Land reclamation (the creation of new land from the sea for urban and industrial use) is key to easing land resource pressures in coastal cities [1]. While it boosts regional economic growth, it also introduces challenges such as soft soil consolidation [2], overuse of groundwater [3], and various human activities [4], which together raise the risk of surface deformation. The Tianjin Binhai New Area is among China’s largest reclamation projects, having reclaimed over 413.6 km2 by 2020 [5]. Industrial, residential, and ecological zones are also developed heavily here, which has increased differences in surface deformation over space and time [6]. Factories, ports, and other infrastructure on reclaimed land add constant weight, which drives land subsidence. Extra structural loads are the main cause of urban surface deformation [7]; for example, dense buildings can cause notable subsidence [8], cargo storage in reclamation areas makes ground deformation worse [9], and soft soil consolidation and structural loads combine. These have made surface deformation in Binhai New Area permanent, which causes secondary hazards such as coastal erosion [10], storm surges [11], seawater intrusion [12], and soil salinization [13]. These hazards put key infrastructure at risk, threatening the stability of important infrastructure, including highways [14], railways [15], buildings [16], dams [17], and metro tunnels [18], and greatly shortening their usable life. Analyzing deformation features across land uses and their changes over time is important. It helps reduce hazards and guide sustainable spatial planning in coastal economic zones.
Subsidence remains a serious problem in the North China Plain [19]. Tianjin saw its first ground subsidence in 1923 [20], and from 1959 to 2007, the city had three clear stages of subsidence: slow subsidence, faster subsidence, then slower again. Ground subsidence brings high risks of geological hazards, which can severely affect local economic growth and space planning. Many studies use different Interferometric Synthetic Aperture Radar (InSAR) techniques and multi-time satellite images, which show that Tianjin’s subsidence is mainly caused by taking out groundwater [21], as well as geological conditions [22] and land reclamation [23]. Currently, Tianjin has more subsidence events [24], and land reclamation and the land use changes it causes make these events worse. Existing studies look at groundwater changes and geological structures, but not much research connects land use types and spatiotemporal changes to subsidence in reclamation areas like Binhai. A full analysis of these connections is needed, which has the potential to move past old theories and offer useful ideas for city safety, protecting infrastructure, and coastal strength. These ideas are key for better land use plans and help develop targeted ways of reducing subsidence.
Traditional ways of monitoring surface deformation mainly depend on Global Navigation Satellite System (GNSS) measurements [25] and leveling surveys [26]. These can obtain accurate surface deformation data with high precision, but it is difficult to do so with spatial continuity [27]. With the development of InSAR technology, it is possible to obtain large-scale surface deformation data with spatial continuity. At present, commonly used methods of surface deformation quantification are described as follows. Differential Interferometric Synthetic Aperture Radar (D-InSAR) has become a useful tool for large-scale monitoring; it is cost-effective and has high resolution [28], but faces challenges such as spatial decorrelation, atmospheric delays, and orbital inaccuracies [29]. Time-series InSAR methods calculate deformation rates and analyze stable coherent points [30]. This effectively solves the problems of decorrelation and atmospheric interference [31] and also improves the detection of small deformations [32]. These techniques are widely used to monitor subsidence in urban and mining areas [33]. Time-series InSAR has two main methods: Permanent Scatterer InSAR (PS-InSAR) and Small Baseline Subset InSAR (SBAS-InSAR) [34]. PS-InSAR was developed by Ferretti [35] and others and focuses on extracting long-term stable points from consecutive SAR images for deformation analysis. SBAS-InSAR was introduced by Bermardino [36] and others and aims to reduce geometric errors and correct atmospheric delays. SBAS-InSAR usually works better than PS-InSAR in areas with few human-made structures and not many stable scatterers. PS-InSAR is often used in cities. SBAS-InSAR is known for being robust and reliable compared to D-InSAR and PS-InSAR and is preferred for monitoring ground subsidence in suburban areas [37]. Given the complex coastal environment of the Tianjin Binhai New Area, where extensive water bodies, farmland, tidal flats, and reclaimed land exhibit unstable scattering characteristics, it is difficult to obtain sufficient stable PS for precise deformation monitoring. Therefore, the SBAS-InSAR technique was adopted and, compared with the persistent scatterer interferometric (PSI) method, it effectively utilizes distributed scatterers, maintains temporal coherence, and shows greater robustness in low-coherence areas such as reclamation zones. Although Multi-dimensional SBAS (MSBAS) can retrieve multi-directional deformation, it requires higher computational cost. Since this study focuses on vertical deformation—where LOS deformation is regarded as vertical displacement—SBAS-InSAR sufficiently meets the research objectives.
Despite the recognized influence of human activities on ground subsidence in reclaimed coastal areas, a critical scientific gap remains: there is still no systematic, quantitative framework explaining how land use types and their temporal evolution govern settlement patterns. This gap is especially prominent in rapidly developing reclamation zones such as Tianjin Binhai New Area, where large-scale land creation has been driven by national strategic planning and economic expansion. The unique combination of soft marine sediments, intensive construction, and dynamic land conversion in these areas introduces complex subsidence mechanisms that have yet to be fully characterized.
To address these knowledge gaps, this study focuses on the Tianjin Binhai New Area, a representative coastal reclamation zone developed under national strategic planning and rapid urban expansion. In general, ground subsidence driven by complex anthropogenic and geological processes is a major issue in these newly formed lands. However, conventional monitoring techniques and standard InSAR processing often face challenges, including atmospheric disturbances, temporal decorrelation, and limited sensitivity to the dynamic characteristics of reclaimed soft soils. To overcome these limitations, this study employs an optimized SBAS-InSAR approach integrating Goldstein filtering, Delaunay MCF phase unwrapping, and GACOS atmospheric correction, thereby improving the precision and reliability of deformation retrieval. Using Sentinel-1A data from 2019 to 2022, we quantitatively characterize spatiotemporal deformation patterns and examine their relationships with land use categories and evolving development stages. Furthermore, seven major reclamation zones are selected as case areas to further assess how land use transitions influence settlement responses over time. This research provides a scientific foundation for sustainable coastal urban development and demonstrates the practical value of enhanced InSAR methodologies for mid- to long-term geohazard monitoring in rapidly evolving reclamation environments.
2. Study Area and Data Description
The Tianjin Binhai New Area lies in the northwest of Bohai Bay and covers a total area of 2270 square kilometers. Binhai New Area serves as a strategic hub for regional integration, international shipping, and national reforms. However, it faces greater subsidence risks because of its low-lying topography (usually below 5 m in elevation) and fragile geological conditions [38]. Its flat terrain includes tidal flats and marine lowlands, and the terrain slopes gradually from west to east, which increases environmental sensitivity. Most of the area is located in coastal zones, and its geological formations mainly include plain and coastal sedimentary deposits [39]. Extensive Quaternary loose deposits are known for high porosity and low strength, and lead to complex engineering geological conditions. These coastal sediments are mainly made of silty clay and loamy clay, which have high porosity and moisture content, and they exhibit soft, plastic properties and low mechanical strength [40].
From the 1990s onwards, multiple land reclamation phases led to artificial landforms, covering Lingang Industrial Zone and Nangang Industrial Zone. The “Overall Territorial Spatial Plan for Binhai New Area” shows that the total reclamation area hit 413.6 km2 by 2020. These zones act as key maritime hubs in North China, gathering major industries such as petrochemicals, equipment manufacturing, and cultural tourism and highlighting their strategic role. Binhai New Area’s reclamation areas are divided into several zones [41]: Zone A (Beijiang Power Plant, BJDC), Zone B (Central Fishing Port, ZXYG), Zone C (Zhongxin Ecological City, ZXSTC), Zone D (Dongjiang Port, DJG), Zone E (Nanjing Port, NJG), Zone F (Lingang Industrial Zone, LG), and Zone G (Nangang Industrial Zone, NG) [42]. The study area is delineated by the blue box in Figure 1.
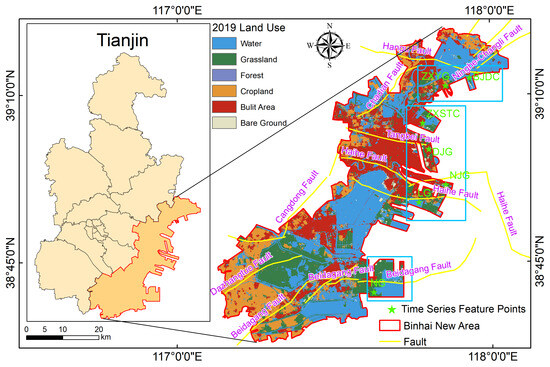
Figure 1.
Zoning map of the study area (image acquired on 14 December 2022).
This research used 48 ascending-track Sentinel-1A radar images, which came from the Alaska Satellite Facility’s SAR Data Center (https://search.asf.alaska.edu/ (accessed on 1 October 2024)) and cover the period from January 2019 to December 2022 at 12-day intervals. The data used the C-band (5.6 cm) and the interferometric wide swath (IW) mode, with a spatial resolution of 5 m in range and 20 m in azimuth. Swath width was 250 km with VV polarization and an incidence angle of 36.78°. Table 1 lists all SAR imaging parameters in detail. In the InSAR processing workflow, the 30 m SRTM Digital Elevation Model (DEM) was introduced to simulate and remove the topographic phase using the ISCE2 processing framework, thereby correcting phase distortions induced by terrain height variations. In addition, precise orbit ephemeris data provided by ESA were incorporated into the ISCE2 orbital refinement module to mitigate baseline uncertainties and re-flatten the interferometric phase during co-registration and interferogram generation. Atmospheric effects on the SAR data were handled with products from the Generic Atmospheric Correction Online Service (GACOS) [43,44] (http://www.gacos.net/ (accessed on 1 October 2024)).

Table 1.
SAR image parameter information.
3. Methodology
SBAS-InSAR used multiple reference images and short spatiotemporal baselines to form interference pairs, maximizing coherence. The deformation time series for each subset was solved by least squares, and the complete deformation history was constructed using singular value decomposition. Temporal and spatial filtering were applied to improve phase quality and reduce noise, enhancing deformation accuracy and temporal resolution [45]. The average deformation rate was calculated by linear regression, representing net displacement over the observation period, with the time series revealing nonlinear deformation behavior. The research flowchart is shown in Figure 2.
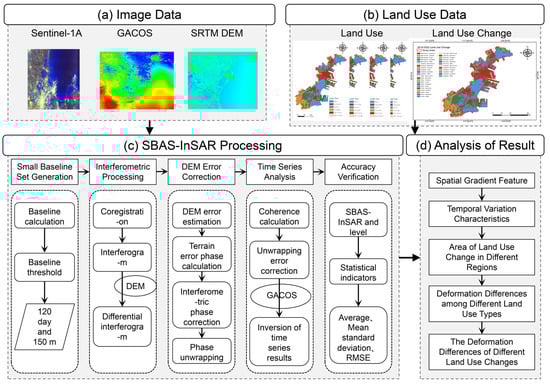
Figure 2.
Flowchart of the SBAS-InSAR processing and analysis methodology (abbreviations: DEM, Digital Elevation Model; GACOS, Generic Atmospheric Correction Online Service for InSAR; RMSE, Root-Mean-Square Error).
The main processing procedure in this study was as follows.
Interferometric pairs were created by selecting a master image based on its high coherence and central position in the observation period (2019–2022). This strategy was preferred as it minimized the average spatial and temporal baselines across the entire interferometric network compared to using a terminal image, thereby maximizing overall coherence and the robustness of the deformation results. This master image served as a reference, and slave images were co-registered with it [46]. The short baseline principle was applied, ensuring that the baseline length between the master and slave images was below a critical threshold, both in spatial and temporal terms. This approach enhanced the coherence of the interferograms, improving the reliability of the deformation monitoring results. The baseline threshold ensured that the interference pairs had strong spatial and temporal correlations, leading to accurate deformation inversion [47].
In the kth interferogram generated from the selected master–slave pairs, the phase information is expressed by Equation (1) [48]:
where denotes the interferometric phase; and represent the radar path lengths at times tA and tB, respectively; signifies the topographic phase error; indicates the atmospheric delay phase; and corresponds to the image noise error. By disregarding residual topographic effects, atmospheric delays, and noise, the equation is simplified as shown in (2) [49].
A network of 942 interferometric pairs was generated from 48 Sentinel-1A images, constrained by maximum temporal and spatial baselines of 120 days and 150 m, respectively. These thresholds were strategically set to minimize decorrelation while ensuring a robust inversion, thus forming a well-connected network for analysis (Figure 3).
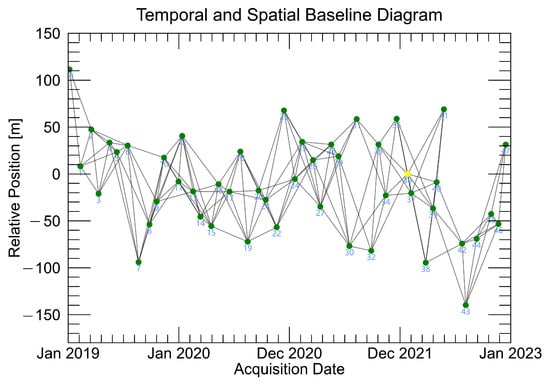
Figure 3.
Spatiotemporal baseline map. (Yellow is the master image and green is the slave images).
After generating differential interferograms and removing the topographic phase via SRTM 30 m DEM, high-frequency noise remains, obscuring deformation signals [50]. Therefore, Goldstein filtering is adopted for denoising in this study. This algorithm utilizes the Fourier transform to convert the interferogram from the spatial domain to the frequency domain, divides the interferogram into overlapping sliding windows, and then smooths the power spectrum of each window, as shown in Equation (3).
where is the filtering factor, is a smoothing operator, is the image to be processed, is the filtered image, and u and v represent spatial frequencies.
The core challenge of phase unwrapping lies in recovering the “lost integer cycles” (integer ambiguity k) from the wrapped phase [51]. In InSAR interferometry, the wrapped phase is the result of the true phase being “folded” by 2 cycles. To resolve 2 ambiguity in the wrapped phase, the relationship between the true phase () and wrapped phase () is
where k (integer) is the integer cycle ambiguity to be recovered.
The final results, including the annual average deformation velocity map and cumulative displacement time series, were geocoded and projected into the WGS84 coordinate system [52].
4. Results
4.1. SBAS-InSAR Results and Validation
To address the low-coherence characteristics of newly reclaimed areas in the Tianjin Binhai New Area, SBAS-InSAR processing was optimized through parameter and algorithm adjustments. Temporal and spatial baseline thresholds were set to 120 days and 150 m, respectively, to balance interferometric pair selection and minimize decorrelation. A coherence threshold of 0.4 was applied to select high-quality pixels, while Goldstein filtering and Delaunay Minimum Cost Flow phase unwrapping were used to enhance phase quality and continuity. Additionally, GACOS atmospheric correction data were integrated to mitigate tropospheric delays. Together, these optimizations improved the robustness, precision, and density of deformation measurements, yielding higher spatial and temporal resolution for monitoring ground subsidence in coastal reclamation zones.
Using the optimized SBAS-InSAR technique to analyze the Sentinel-1A radar data of Binhai New Area, the annual average rate of line-of-sight deformation was obtained, which is shown in Figure 4a. In Figure 4, a negative deformation rate indicated that the feature was moving away from the satellite along the radar line of sight (LOS), which corresponded to ground subsidence. Conversely, a positive deformation rate indicated movement toward the satellite along the radar LOS, corresponding to ground uplift. Within the Binhai New Area, the rate of surface deformation ranged from −114 to 63 mm per annum (mm/a). Although the trend of surface deformation in the region was quite different, the overall trend of subsidence was still present.
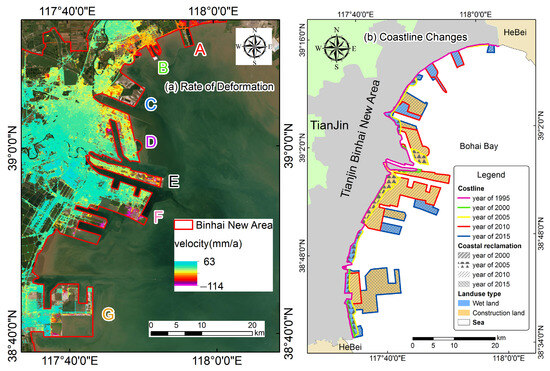
Figure 4.
(a) Annual LOS deformation rates (2019–2022) and (b) coastline changes in Binhai New Area (modified from Chen [53]).
The pronounced north–south deformation gradient, with higher rates in the north (e.g., Zones A–B) and lower rates in the south (e.g., Zone G), was attributed to the interplay of geology, reclamation history, and land use. The northern areas were underlain by thicker, compressible soft clays and were reclaimed more recently (2007–2011), leaving their soils less consolidated. Crucially, the intensive industrial land use there (e.g., power plants and ports) applied heavy static loads, while rapid land use changes (e.g., from bare land to built-up areas) caused significant soil disturbance, both accelerating consolidation. By contrast, the southern Zone G, with later reclamation, lower development intensity, and more stable land uses, experienced minimal settlement.
To verify the land deformation results obtained by SBAS-InSAR, suit-level measurement data from 2019 to 2022 were used in this study. SBAS-InSAR (raster) and leveling (vector) datasets had natural differences. Since the position of the level point did not correspond one-to-one with the results of SBAS-InSAR, taking the level point as the center, relevant points were found nearby and compared with the corresponding level point. There were five monitoring points in total: the Intelligent Container Terminal, Bohai Chemical, CSSC (China Shipbuilding, Shanghai, China), Tanggu Metro Station, and Dagang Park. Figure 5 compares the InSAR results with the level results. The average difference between the two was 4.23 mm, the minimum difference was 0.01 mm, the average standard deviation was 3.31 mm, and the Root-Mean-Square Error (RMSE) was 5.70 mm, which supported the rationality of the results of this study.
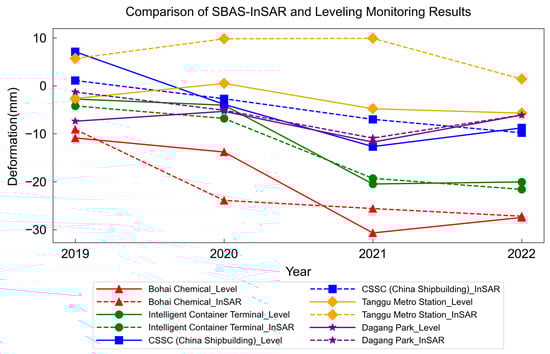
Figure 5.
Comparison of SBAS-InSAR and leveling monitoring results.
Since Tianjin became part of the national development plan in 2005, Binhai New Area needed more land as its economy grew. Land reclamation was an affordable way to meet this need and utilize the coastal location. Most local ports were built by dredging and filling seawater areas. Expanding artificial land pushed the coastline further into the sea (as shown in Figure 4b). Zone D started reclamation first, followed by Zones C, E, and F in 2010 which mostly finished by 2015. Zone G’s main work started in 2009 and finished in 2022, leaving Zones A and B which are still being built.
The spatial pattern of surface deformation in the reclamation area exhibited a distinct gradient, with higher rates in the northern sectors and lower rates in the southern sectors, as observed in the LOS deformation rate map. Data in Figure 6 and Figure 7 show that average deformation rates in Zones A to G decreased. Northern rates were −23 mm/a and southern rates were −2 mm/a, while cumulative deformation dropped from −90 to −10 mm. Extreme value ranges remained stable throughout.
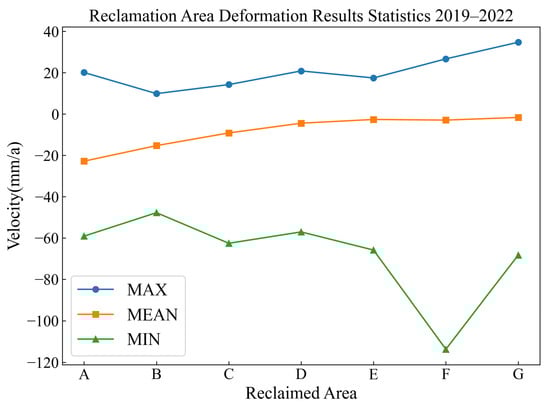
Figure 6.
Deformation rates across reclamation zones (2019–2022).
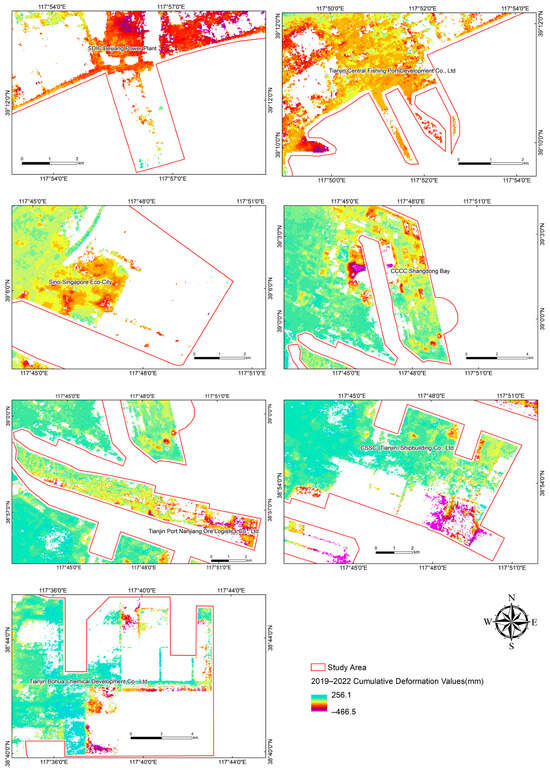
Figure 7.
Cumulative deformation of land reclamation areas from 2019 to 2022. Zone A: Beijiang Power Plant, BJDC; Zone B: Central Fishing Port, ZXYG; Zone C: Zhongxin Ecological City, ZXSTC; Zone D: Dongjiang Port, DJG; Zone E: Nanjing Port, NJG; Zone F: Lingang Industrial Zone, LG; and Zone G: Nangang Industrial Zone, NG.
4.2. Characteristics of Spatiotemporal Distribution of Reclamation Areas
Feature points were selected at different locations within the reclamation areas for time series analysis. Settlement centers were identified as localized zones exhibiting the maximum mean annual subsidence rates within the study region, which helped illustrate how each feature point changed over time relative to the subsidence center. Figure 1 displays the positional information of these points. Figure 8 shows that these centers displayed distinct temporal evolution patterns. The spatiotemporal variability of deformation was evident across the seven coastal reclamation zones. For example, in Zone C, thick muddy soft soils under continuous engineering loads consolidated rapidly, resulting in a 40 mm increase in subsidence between March and November 2021 [54]. Zone A experienced cumulative deformation of −148 mm, mainly due to the persistent loading from a coal-fired power plant and surrounding developments. Zones D and E shared similar industrial setups and thus exhibited comparable deformation patterns. In the early-developed parts of Zone F, soft soils had entered a stable consolidation stage with nearly linear deformation. Zone G, as a newly reclaimed area, had low development intensity and soils that had not yet fully consolidated, and showed linear subsidence behavior.
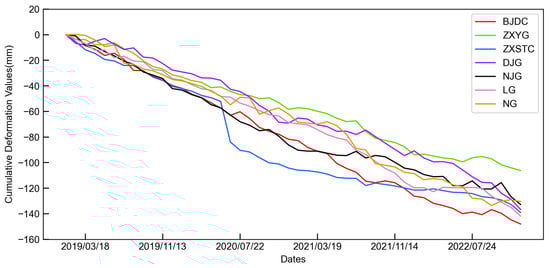
Figure 8.
Time series analysis of different reclamation areas.
In addition to these spatial differences, a weak seasonal signal could be observed in several zones (e.g., Zones B and C) during summer and early autumn. The rate of deformation tended to speed up during months with high temperatures and rainfall. This circumstance was probably because the pore-water pressure and soil moisture levels changed, which helped soft sediments consolidate quickly. These variations highlighted the joint influence of geological conditions, reclamation chronology, and human activity intensity on the temporal evolution of subsidence in coastal reclamation zones. Although Sentinel-1A had a 12-day revisit interval, the temporal density was sufficient to capture short-term deformation variations across different seasons.
These points were selectively chosen to illustrate characteristic temporal deformation behaviors across different land use and reclamation ages and were not intended to represent the entire area statistically. Figure 8 shows a time series analysis of different reclamation areas, aiming to show spatial distribution features of these zones. The results showed that seven main reclamation zones in Binhai New Area had different spatiotemporal developments and functional traits. Northern Zone A served as an energy supply hub, mixing power generation, heating, seawater desalination, and salt production. Zone B was in the coastal leisure and tourism belt, focusing on blending fisheries with cultural tourism. Located in the northeast, Zone C was a national green development pilot zone, creating an ecological barrier via artificial wetlands and green corridors. Zones D and E were along the eastern seafront, using their deep-water coastlines to build an international shipping hub. Zone D focused on container trade and free-trade operations. Zone E handled bulk cargo and petrochemical logistics. Southern Zones F and G worked together: Zone F specialized in high-end equipment manufacturing and Zone G focused on container trade and petrochemical industries. This spatial layout showed the steady development of port resources. It also helped regional development work together through specialized industrial sectors.
Figure 6, Figure 7 and Figure 8 show that ground subsidence in the seven reclamation zones of Tianjin Binhai New Area had a clear north-to-south gradient. Northern areas had higher subsidence rates, while southern areas had lower rates. This trend linked to the geological conditions below, as well as to the order of reclamation work and to what each zone was used for. In Figure 7, the text in the images marks buildings with high subsidence, and areas with clear subsidence were mostly water, plants, or empty land. In northern Zones A and B, heavy loads came from energy plants and groundwater was taken out for fisheries. In addition, thick, muddy clay could compress a lot, leading to later reclamation, and soft soil did not fully settle. All this caused the highest subsidence rates. In central Zone D, early reclamation took place first; then, busy port building took place, with the piling up of a large amount of cargo, which led to noticeable ground sinking. Zone C had a special function of using different reclamation methods to control subsidence, which worked somewhat. Zone E mainly has a mix of shops, offices, and homes. In Zone F, moving loads from petrochemical tanks and port buildings caused uneven subsidence. Southern Zone G was reclaimed later, after which there was no large port building; thus, it had the least subsidence. The reclamation areas saw subsidence intensity decrease from north to south. Table 2 shows the characteristics of the seven reclamation areas.
Table 2.
Overview of the characteristics of some reclamation areas.
4.3. Relationship Between Land Use and Surface Deformation
Based on the spatial variability of deformation rates, the study area was subdivided into active subsidence zones and relatively stable zones, allowing a clearer interpretation of the relationship between land use and ground deformation in reclaimed coastal areas. Subsidence hotspots were mainly concentrated in industrial zones, port facilities, and newly developed urban areas (Figure 4a), where substantial building loads imposed significant stress on the underlying soils. Cropland also showed elevated subsidence risks due to intensive groundwater extraction for irrigation. In reclamation areas, the consolidation of soft, newly deposited sediments followed a progressive temporal process, and transitional land cover types (e.g., temporary grasslands and bare surfaces) during land use conversion further intensified secondary compaction during later urban development. These spatiotemporal patterns confirmed that land use played a critical role in controlling subsidence development in coastal reclamation environments.
The causes of ground subsidence in the seven main reclamation zones were related to land use in Binhai New Area. This study carries out a statistical analysis of the overall land use changes in each district, where the numerical values represent the total area of land use change for each zone, as shown in Figure 9. In the subsequent analysis, the relationship between different land use types and deformation rates is discussed. The figure shows more land use changes in Zones D (68.01 km2), E (49.00 km2), and F (42.28 km2). These regions may have been more affected by this change than the other four regions (A: 8.89 km2, B: 11.00 km2, C: 14.91 km2, G: 18.14 km2). It also shows significant land use changes in Zones D, E, and F during the study period. The following two small sections, respectively, discuss the relationship between land use types and surface deformation in the four regions of Zones A, B, C, and G, with the relationship between land use change and surface deformation in the three regions of Zones D, E, and F.
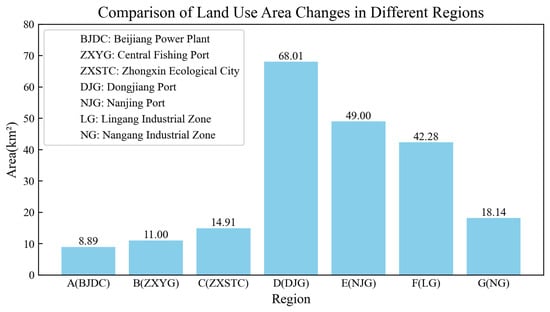
Figure 9.
Statistics on the area of land use changes in different reclamation areas.
To further quantify the differences in subsidence rates among different land use types, a repeated-measures Analysis of Variance (ANOVA) was conducted based on the deformation rates observed in the seven representative zones. The results indicated significant differences between BJDC and DJG, and NJG, and LG (p < 0.05), while no significant differences were found between the other pairs (p > 0.05). Moreover, DJG, NJG, and LG exhibited no significant mutual differences, and BJDC showed no significant differences with ZXSTC and ZXYG. Accordingly, the seven zones were classified into two statistically similar groups: (1) DJG, NJG, and LG, and (2) BJDC, ZXSTC, ZXYG, and NG. This classification was further supported by the spatial distribution patterns illustrated in Figure 9, indicating that areas with similar land use types and human activity intensities tended to exhibit comparable deformation behaviors.
Land Use Type-Dominated Zones (A, B, C, G) [55] included Zone A in the north, which had both industrial and residential loads that impacted its ground stability. Zone C had problems where ecological restoration efforts went against the settling of thick, soft soils. Zone B’s sandy base from reclamation had a risk of tidal liquefaction. Ground movement affected petrochemical storage operations in Zone G. These differences showed variations in load strength and geological conditions.
In the Land Use Change-Driven Zones [56,57], Zone D’s foundation developed new disturbances, which came from the free-trade zone’s second-phase expansion. Zone E saw a large rise in land use for bulk cargo yards, which accelerated the settling of deep soft soils. In Zone F, changes to smart manufacturing layouts increased shallow soil creep due to vibrational loads from machinery.
These two groups served two purposes, illustrating how static functions affected subsidence rates and highlighting the long-term effects of dynamic development on uneven deformation. The following sections were analyzed in detail from two perspectives: “land use type–deformation rate” and “land use change–deformation rate”.
This study used the 30 m annual land cover dataset for China (2019–2022) developed by Professor Huang Xin’s team at Wuhan University [58]. The dataset integrated multi-source remote sensing imagery and employed temporal–spectral feature fusion and machine learning classification, providing consistent and high-resolution land cover information across China. To ensure reliability, the dataset underwent accuracy assessment using independent validation samples, achieving an overall classification accuracy of approximately 80%. For this study, land cover classes within the Tianjin Binhai New Area were reclassified according to the <Current Land Use Classification standard> (GB/T 21010-2017) [59] into six primary categories: cropland, forest, grassland, water, built-up area, and bare land. This reclassification aimed to align with national land use standards and to facilitate the analysis of surface subsidence responses across different land use types [60]. The spatial distribution of land use in seven typical reclamation areas is illustrated in Figure 10, highlighting the dominance of cropland and newly reclaimed built-up zones where significant subsidence occurred.
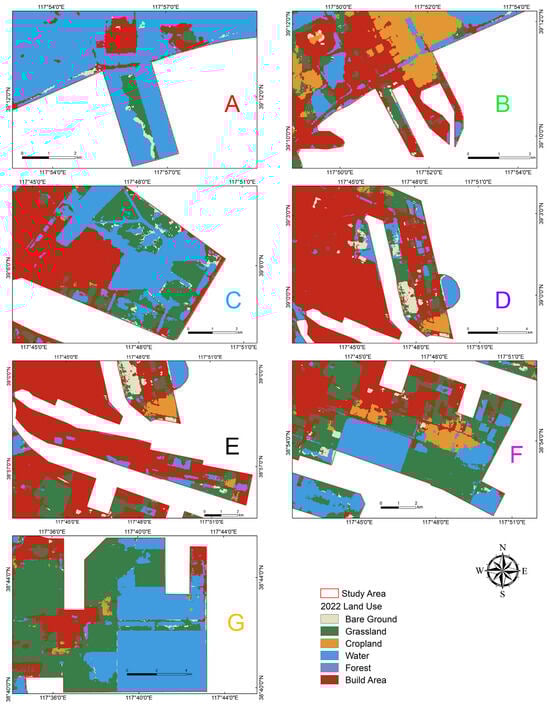
Figure 10.
Land use types in different reclamation areas in 2022. Zone A: Beijiang Power Plant, BJDC; Zone B: Central Fishing Port, ZXYG; Zone C: Zhongxin Ecological City, ZXSTC; Zone D: Dongjiang Port, DJG; Zone E: Nanjing Port, NJG; Zone F: Lingang Industrial Zone, LG; and Zone G: Nangang Industrial Zone, NG.
Area A was reclaimed between 2007 and 2010 and served as a core energy base built from 2007 to 2018, with mainly water (83%) and built areas (10%). Figure 11 shows large differences in subsidence rates among different land cover types. In area A, cropland had the highest annual average deformation rate, reaching −27 mm/a. Built area land followed with a rate of −24 mm/a, where a cyclical process involving power generation, desalination, and salt production contributed to the formation of high-density salt pan water bodies, which had an annual average deformation rate of −22 mm/a. Subsidence in these zones was further compounded by structural loads from power plants and aquaculture facilities.
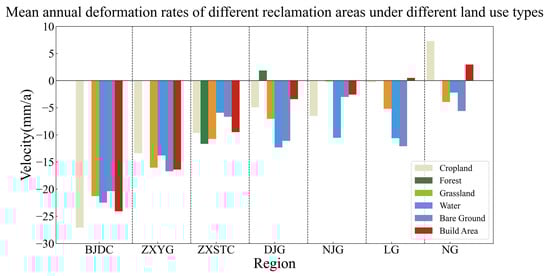
Figure 11.
Annual average deformation rates by land use type in different reclamation zones.
Area B served as a key fishery and logistics hub in Tianjin Binhai New Area, where it began its reclamation project in 2007 and reached major completion by 2011. Development work continued in this area, where land use mostly included built areas (51%) and cropland (25%). An examination of Figure 9, Figure 10 and Figure 11 revealed notable differences in subsidence rates among various land use types. In area B, bare ground exhibited an annual average deformation rate of −17 mm/a, primarily located in regions with intensive equipment operation and cargo accumulation, which resulted from the combined effects of load and the sandy characteristics of the reclamation substrate. Built area land demonstrated an annual average deformation rate of −16 mm/a, with urban and port construction exacerbating the consolidation of soft soils. Data analysis confirmed that built areas and bare land significantly influenced subsidence in Zone B.
Area C was a national model for sustainable development. It started reclamation in 2008 and mostly finished by 2010, with the main land uses being built areas (38%) and water (35%). Figure 9, Figure 10 and Figure 11 show large differences in subsidence rates between land types. In area C, the forest had an average annual deformation of −12 mm/a, grassland had −11 mm/a, and built areas had −13 mm/a. Further study found that urban construction created dynamic loads, which, together with sandy fill, made soft soils consolidate faster. Thick, muddy soils consolidated in artificial wetlands which were in ecological green spaces. The findings showed that both built areas and ecological green spaces affected subsidence in Area C.
Area G served as a top-heavy chemical industry and logistics center in Tianjin Binhai New Area. It started reclamation in 2009 and the core part was finished by 2014. Reclamation here was relatively new. Soft soils in most of Area G were not fully settled yet and much of the industrial construction had not yet happened there. The main land uses were water (55%) and grassland (36%). Figure 9, Figure 10 and Figure 11 show large differences in deformation rates between land types. In area G, bare ground had the highest average annual deformation at −6 mm/a, while grassland showed −4 mm/a. Some other land uses even had positive rates, meaning uplift, which was especially true in certain built areas and cropland, probably indicating that subsidence control measures worked. Further study found that a large offshore LNG-receiving station was present. Storage areas have very high stack loads, which go beyond the soft soil’s bearing capacity. This accelerated soft soil consolidation and caused subsidence. Also, port dynamic loads made sandy reclamation layers liquefy, which led to shallow soil settlement. Similarly, grassland and built areas in Zone G related strongly to subsidence patterns.
In reclamation Zones D, E, and F of Tianjin Binhai New Area, large dynamic changes in land use linked closely to surface subsidence. This study combined annual deformation rates with land use transitions (Figure 12) and analyzed the five most important change types in each zone. Reclamation started in 2005. Zone D changed from port storage to a multifunctional zone, which included logistics, industry, and commerce. Zone E focused on bulk cargo and petrochemical logistics. Expanding storage and port facilities accelerated the primary consolidation of deep soft soils. Zone F focused on high-end equipment manufacturing and petrochemical installations. Heavy machinery and material stockpiling increased subsidence impacts. Figure 12 and Figure 13 show that land use shifts mainly involved transitional cover types, including grassland, water, and cropland, which clustered in coastal zones. The zones related to port infrastructure development and ecological restoration efforts [61].
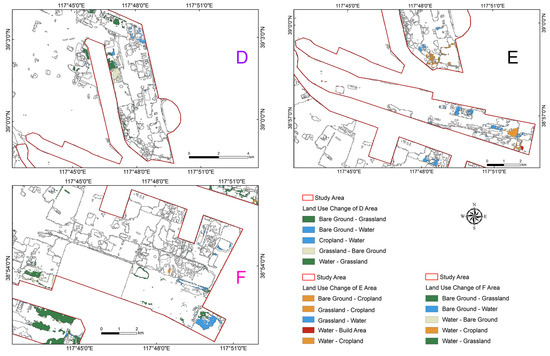
Figure 12.
Land use changes in zones D, E, and F.
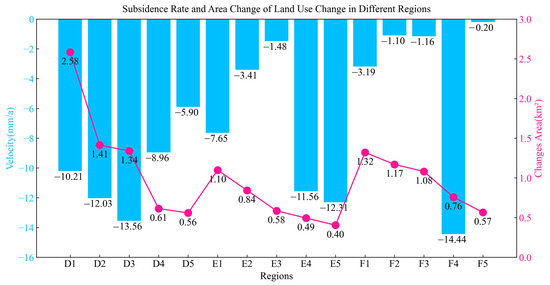
Figure 13.
The conversion types analyzed include D1 (grassland to built areas), D2 (bare land to forest), D3 (grassland to water), D4 (built areas to water), D5 (grassland to cropland), E1 (grassland to built areas), E2 (bare land to forest), E3 (built areas to grassland), E4 (bare land to built areas), E5 (grassland to cropland), F1 (grassland to built areas), F2 (grassland to cropland), F3 (built areas to grassland), F4 (grassland to water), and F5 (cropland to water).
To quantitatively verify the relationship between land use changes and subsidence patterns, trend consistency ratios and one-way ANOVA tests were conducted for the three representative zones (DJG, NJG, and LG). The results revealed that transitions from built area to other land use types exhibited high trend consistency and low variability in subsidence rates, indicating a stable “changes–subsidence” linkage shared across all zones. Although the ANOVA p-values (0.092 for DJG, 0.071 for NJG, and 0.301 for LG) did not reach the 0.05 significance level, the first two values were close to the threshold, suggesting that the limited sample size may have constrained statistical power. Nevertheless, the trend consistency ratios (mostly <0.5) confirmed that the subsidence variations were not random but systematically related to specific land use changes. This pattern, observed consistently across the three regions, underscores that particular land use changes—especially changes involving built areas and cropland—maintained a stable and reproducible association with subsidence rates.
To further illustrate the dynamic relationship between land use changes and ground subsidence, a chord diagram of land use changes was generated (Figure 14). The diagram clearly showed that most changes occurred from grassland and cropland to built areas, indicating that urban expansion was the dominant driver of subsidence in the reclaimed coastal zones.
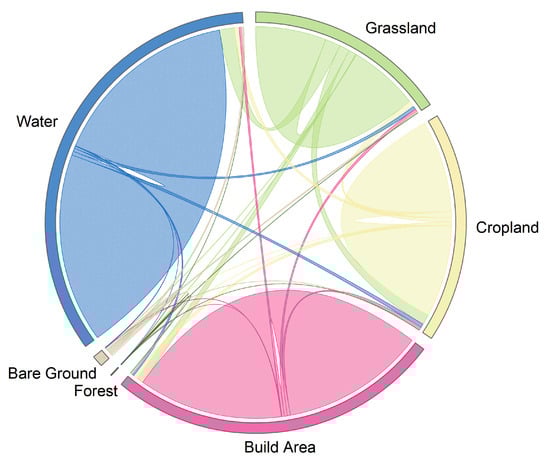
Figure 14.
Chord diagram of land use changes.
Zone D was a key part of the international shipping hub of Tianjin Binhai New Area, where reclamation started in 2002 and primary construction finished by 2009. The analysis (Figure 13) showed that the main land use change was from grassland to built areas. This change covered 2.58 km2, with an average deformation rate of −10 mm/a. The next significant change was from bare land to forest, which showed a deformation rate of −12 mm/a. Zone E was the core area for heavy chemical industry and logistics, where reclamation began in 2010 and the main phase finished the following year. Here, converting grassland to built areas spanned 1.10 km2, with an average deformation rate of −8 mm/a. Converting grassland to cropland showed a rate of −12 mm/a. Zone F focused on high-end equipment manufacturing and biomedicine, which was developed in stages from 2003 to 2013. Converting grassland to built areas here covered 1.32 km2, which had a notable deformation rate of −3 mm/a. Converting grassland to water showed a deformation rate of −14 mm/a. These land use change patterns in reclamation areas connected strongly to regional ecological balance strategies.
5. Discussion
The causes of ground subsidence in Tianjin were complex and involved many factors. Past studies mainly focused on natural and human-related factors, including over-pumping groundwater, tectonic movements, and the compression of soft soils [62]. In reclamation areas, the soil was mostly newly formed muddy, soft soils, which had high porosity and low permeability and could compress a lot. Such properties make these soils likely to consolidate quickly when external loads are applied [63,64]. Large changes in surface loads occur, as well as dynamic shifts in land use types, which have both become key factors affecting differences in deformation across reclamation regions.
It is important to note that while groundwater over-extraction was historically considered the primary cause of land subsidence, the geological and hydrological conditions of reclamation areas differ fundamentally from those of natural landscapes. The artificial fill soils in these zones generally lack natural aquifers, and since the implementation of the South-to-North Water Diversion Project, regional groundwater levels have risen, reducing the influence of groundwater extraction on subsidence [65]. Furthermore, seawalls constructed during reclamation projects interrupt the hydraulic connection between marine and terrestrial groundwater systems, resulting in limited groundwater exchange within reclamation zones. In coastal areas with dynamic shoreline changes, tidal fluctuations and sea-level variations may further exacerbate the compaction of soft soils. Periodic changes in pore-water pressure induced by tidal cycles accelerate consolidation in reclaimed sediments, particularly in zones with limited drainage due to seawall construction. Seawater intrusion can accelerate soil consolidation processes, thereby intensifying local subsidence. Spatially, deformation patterns correspond to areas of groundwater recovery and intensive underground construction [66], whereas fault activity in the Binhai New Area remains minimal and shows little correlation with high-subsidence zones, as illustrated in Figure 1.
Although the correlation between land use transitions and deformation varies across scales, this study successfully reveals clear spatially localized patterns in which specific land use changes correspond to consistent subsidence responses. These findings highlight the nonlinear and heterogeneous nature of settlement mechanisms in reclamation environments, driven by differences in soil consolidation history, loading intensity, and development phases. The demonstrated capability of the SBAS-InSAR approach to capture these spatiotemporal variations provides a valuable basis for advancing predictive deformation modeling. Building on this foundation, the integration of nonlinear or physics-informed models [67]—such as Physics-Informed Neural Networks (PINNs)—offers strong potential to further refine mechanism interpretation and improve risk forecasting in future research.
In rapidly developing coastal reclamation areas such as the Binhai New Area, annual updates of land use data integrated with InSAR deformation tracking would provide critical inputs for spatial planning, infrastructure maintenance, and risk zoning. Aligning land use with geological carrying capacity could be achieved through zoning by soft-soil thickness, restricting high-load projects in unstable zones, and managing drainage in newly reclaimed areas. Comparatively, the observed annual subsidence rates in Tianjin Binhai New Area are higher than those reported for Xiamen [68] and Singapore [69], but similar to that for Shanghai [70]. This comparison highlights the relatively severe deformation occurring in Tianjin’s reclaimed coastal areas and underscores the importance of continuous monitoring and adaptive land management. Several mitigation strategies have been locally implemented in the Binhai New Area, including soil stabilization in newly reclaimed zones and groundwater recharge in areas previously experiencing land subsidence due to overdraft. The effectiveness of these measures can be evaluated using SBAS-InSAR time-series deformation monitoring, which is capable of detecting whether subsidence rates stabilize or rebound following intervention. Although this study primarily employed the optimized SBAS-InSAR approach, the demonstrated spatiotemporal linkage between land use and deformation provides a solid foundation for predictive modeling. Integrating machine learning frameworks (e.g., Random Forest or Support Vector Regression) and more granular land use classification, together with explicit quantification of building loads and soil properties, would further enhance the ability to model and predict settlement responses to human activities [71,72]. The observed north-high, south-low pattern likely reflects reclamation chronology and differences in fill composition, while precipitation and temperature fluctuations may further modulate temporal deformation. We note that SBAS-InSAR has inherent limitations (e.g., LOS geometry and coherence sensitivity), and the leveling data used for validation may also contain uncertainties related to benchmark stability and measurement intervals. Variations in Sentinel-1 image temporal density and coherence thresholds can further affect deformation retrieval accuracy. Integrating complementary datasets such as LiDAR and GNSS, together with sensitivity analysis [73], would improve three-dimensional deformation characterization and enhance the robustness of operational monitoring and early-warning systems. Additionally, incorporating borehole records and geological survey data will help refine subsidence mechanism interpretation, particularly by quantifying the relative contributions of soil compaction and hydrological processes to the deformation of newly reclaimed soft soils.
Overall, the proposed SBAS-InSAR and land use integration framework is transferable to other soft-soil coastal regions. Extending this approach toward multi-temporal urban planning and early warning systems could provide valuable technical support for sustainable development in subsiding coastal cities.
6. Conclusions
This study investigated land subsidence in Tianjin’s Binhai reclamation areas by integrating SBAS-InSAR analysis of Sentinel-1A data (2019–2022) with land use dynamics. Seven distinct reclamation zones were analyzed to elucidate the connections between land use types, their temporal changes, and ground deformation. The main findings are as follows:
- The SBAS-InSAR analysis revealed a maximum cumulative deformation of −148 mm, with significant spatial variability. The high consistency between InSAR and leveling data confirmed the reliability of the results.
- The research found a distinct trend of increasing subsidence gradient from north to south. The subsidence rate in the north is highest, which is attributed to the dense industrial load and the consolidation of soft soil. By contrast, the subsidence rate in the south is lowest, because of its later reclamation date and lower development intensity. Research has found that spatiotemporal patterns are subject to the interaction among reclamation history, geological structure, and the gradient of human activities.
- Spatial patterns of subsidence were critically linked to specific types and dynamics of land use. Built areas and bare land exhibited the strongest correlation with subsidence. In zones like BJDC, ZXYG, and ZXSTC, subsidence was primarily driven by persistent structural loads and soil consolidation. In zones such as DJG, NJG, and LG, dynamic land use changes exacerbated differential settlement through soil disturbance. Subsidence is thus a cumulative consequence of both static land use attributes and dynamic changes, mediated by soil restructuring and load transmission.
This study establishes a clear causal connection between land use practices and ground subsidence in reclamation areas. Based on these findings, we propose the following specific planning recommendations to mitigate subsidence risks:
- Avoid constructing heavy infrastructure in areas identified with very thick, soft clay layers or a history of high subsidence rates.
- Implement phased development plans to allow for natural consolidation of the foundation soil before initiating large-scale construction.
- Prioritize green spaces and lightweight structures in high-subsidence risk zones to minimize surface loading.
- Mandate continuous InSAR monitoring as an early warning system for accelerated subsidence linked to new land use changes.
In summary, we propose two overarching strategies: focus on load reduction and ground stabilization in northern high-subsidence zones and ensure that development intensity aligns with the geological capacity of newer southern reclamation areas. The implementation of a dynamic monitoring system is recommended for flexible and risk-informed management. These findings and recommendations provide practical, science-based steps for mitigating reclamation hazards and enhancing resilience in coastal cities globally.
Author Contributions
L.H. and Z.W. designed the research; L.H., Y.W., K.S., C.Z. and R.L. processed the data; L.H., J.S. and Y.L. analyzed the data; L.H., Y.W. and Z.W. wrote the paper. All authors have read and agreed to the published version of the manuscript.
Funding
This research was funded by the National Natural Science Foundation of China, grant numbers 41971310 and 42271103.
Institutional Review Board Statement
Not applicable.
Informed Consent Statement
Not applicable.
Data Availability Statement
(1) Sentinel-1A data were derived from the following resources available in the public domain: [https://search.asf.alaska.edu/ (accessed on 1 October 2024)]. (2) The SRTM DEM data were derived from the following resources available in the public domain: [https://dwtkns.com/srtm30m/ (accessed on 1 October 2024)]. (3) Precise orbit ephemeris data were derived from the following resources available in the public domain: [https://step.esa.int/auxdata/orbits/ (accessed on 1 October 2024)]. (4) The Generic Atmospheric Correction Online Service (GACOS) data were derived from the following resources available in the public domain: [http://www.gacos.net/ (accessed on 1 October 2024)]. (5) The land use data were derived from the following resources available in the public domain: [https://zenodo.org/records/12779975 (accessed on 1 October 2024)].
Acknowledgments
The authors are grateful for the availability of the data online.
Conflicts of Interest
The authors declare no conflicts of interest.
References
- Li, J.G.; Pu, L.J.; Zhu, M.; Zhang, J.; Li, P.; Dai, X.Q.; Xu, Y.; Liu, L.L. Evolution of soil properties following reclamation in coastal areas: A review. Geoderma 2014, 226, 130–139. [Google Scholar] [CrossRef]
- Liu, Y.L.; Liu, J.Q.; Xia, X.F.; Bi, H.B.; Huang, H.J.; Ding, R.W.; Zhao, L.H. Land subsidence of the Yellow River Delta in China driven by river sediment compaction. Sci. Total Environ. 2021, 750, 142165. [Google Scholar] [CrossRef]
- El Shinawi, A.; Kuriqi, A.; Zelenakova, M.; Vranayova, Z.; Abd-Elaty, I. Land subsidence and environmental threats in coastal aquifers under sea level rise and over-pumping stress. J. Hydrol. 2022, 608, 127607. [Google Scholar] [CrossRef]
- Bagheri-Gavkosh, M.; Hosseini, S.M.; Ataie-Ashtiani, B.; Sohani, Y.; Ebrahimian, H.; Morovat, F.; Ashra, S. Land subsidence: A global challenge. Sci. Total Environ. 2021, 778, 146193. [Google Scholar] [CrossRef] [PubMed]
- Chen, Y.A.; Yan, F.L.; Chen, J.; Fan, X.T. Detection Ground Deformation Characteristics of Reclamation Land with Time-Series Interferometric Synthetic Aperture Radar in Tianjin Binhai New Area, China. Remote Sens. 2023, 15, 5303. [Google Scholar] [CrossRef]
- Machowski, R.; Rzetala, M.A.; Rzetala, M.; Solarski, M. Geomorphological and Hydrological Effects of Subsidence and Land Use Change in Industrial and Urban Areas. Land Degrad. Dev. 2016, 27, 1740–1752. [Google Scholar] [CrossRef]
- Chen, G.; Zhang, Y.; Zeng, R.Q.; Yang, Z.K.; Chen, X.; Zhao, F.M.; Meng, X.M. Detection of Land Subsidence Associated with Land Creation and Rapid Urbanization in the Chinese Loess Plateau Using Time Series InSAR: A Case Study of Lanzhou New District. Remote Sens. 2018, 10, 270. [Google Scholar] [CrossRef]
- Zhang, Y.; Liu, Y.L.; Jin, M.Q.; Jing, Y.; Liu, Y.; Liu, Y.F.; Sun, W.; Wei, J.Q.; Chen, Y. Monitoring Land Subsidence in Wuhan City (China) using the SBAS-InSAR Method with Radarsat-2 Imagery Data. Sensors 2019, 19, 743. [Google Scholar] [CrossRef]
- Li, D.; Li, B.; Zhang, Y.X.; Fan, C.; Xu, H.; Hou, X.Y. Spatial and temporal characteristics analysis for land subsidence in Shanghai coastal reclamation area using PS-InSAR method. Front. Mar. Sci. 2022, 9, 1000523. [Google Scholar] [CrossRef]
- Cai, F.; Su, X.Z.; Liu, J.H.; Li, B.; Lei, G. Coastal erosion in China under the condition of global climate change and measures for its prevention. Prog. Nat. Sci. 2009, 19, 415–426. [Google Scholar] [CrossRef]
- Wang, J.; Gao, W.; Xu, S.Y.; Yu, L.Z. Evaluation of the combined risk of sea level rise, land subsidence, and storm surges on the coastal areas of Shanghai, China. Clim. Change 2012, 115, 537–558. [Google Scholar] [CrossRef]
- Ma, J.; Zhou, Z.F.; Guo, Q.N.; Zhu, S.M.; Dai, Y.F.; Shen, Q. Spatial Characterization of Seawater Intrusion in a Coastal Aquifer of Northeast Liaodong Bay, China. Sustainability 2019, 11, 7013. [Google Scholar] [CrossRef]
- Han, D.M.; Currell, M.J. Delineating multiple salinization processes in a coastal plain aquifer, northern China: Hydrochemical and isotopic evidence. Hydrol. Earth Syst. Sci. 2018, 22, 3473–3491. [Google Scholar] [CrossRef]
- Li, G.R.; Zhao, C.Y.; Wang, B.H.; Liu, X.J.; Chen, H.Y. Land Subsidence Monitoring and Dynamic Prediction of Reclaimed Islands with Multi-Temporal InSAR Techniques in Xiamen and Zhangzhou Cities, China. Remote Sens. 2022, 14, 2930. [Google Scholar] [CrossRef]
- Jeon, S.S.; Park, Y.K.; Eum, K.Y. Stability assessment of roadbed affected by ground subsidence adjacent to urban railways. Nat. Hazards Earth Syst. Sci. 2018, 18, 2261–2271. [Google Scholar] [CrossRef]
- Cui, Z.D.; Yang, J.Q.; Yuan, L. Land subsidence caused by the interaction of high-rise buildings in soft soil areas. Nat. Hazards 2015, 79, 1199–1217. [Google Scholar] [CrossRef]
- Bai, L.; Jiang, L.; Wang, H.; Sun, Q. Spatiotemporal Characterization of Land Subsidence and Uplift (2009–2010) over Wuhan in Central China Revealed by TerraSAR-X InSAR Analysis. Remote Sens. 2016, 8, 350. [Google Scholar] [CrossRef]
- Huang, Q.; Miao, C.; Yuan, Y.; Qu, Y.; Gou, Y. Failure analysis of metro tunnel induced by land subsidence in Xi’an, China. Eng. Fail. Anal. 2023, 145, 106996. [Google Scholar] [CrossRef]
- Zhang, T.X.; Shen, W.B.; Wu, W.H.; Zhang, B.; Pan, Y.J. Recent Surface Deformation in the Tianjin Area Revealed by Sentinel-1A Data. Remote Sens. 2019, 11, 130. [Google Scholar] [CrossRef]
- Lixin, Y.; Fang, Z.; He, X.; Shijie, C.; Wei, W.; Qiang, Y. Land subsidence in Tianjin, China. Environ. Earth Sci. 2011, 62, 1151–1161. [Google Scholar] [CrossRef]
- Yu, X.; Wang, G.Q.; Hu, X.; Liu, Y.H.; Bao, Y. Land Subsidence in Tianjin, China: Before and after the South-to-North Water Diversion. Remote Sens. 2023, 15, 1647. [Google Scholar] [CrossRef]
- Wang, K.; Wang, G.; Bao, Y.; Su, G.; Wang, Y.; Shen, Q.; Zhang, Y.; Wang, H. Preventing Subsidence Reoccurrence in Tianjin: New Preconsolidation Head and Safe Pumping Buffer. Ground Water 2024, 62, 778–794. [Google Scholar] [CrossRef]
- Ha, D.; Zheng, G.; Loáiciga, H.A.; Guo, W.; Zhou, H.Z.; Chai, J.C. Long-term groundwater level changes and land subsidence in Tianjin, China. Acta Geotech. 2021, 16, 1303–1314. [Google Scholar] [CrossRef]
- Zhang, J.L.; Kou, P.L.; Tao, Y.X.; Jin, Z.; Huang, Y.J.; Cui, J.H.; Liang, W.L.; Liu, R. Urban ground subsidence monitoring and prediction using time-series InSAR and machine learning approaches: A case study of Tianjin, China. Environ. Earth Sci. 2024, 83, 473. [Google Scholar] [CrossRef]
- Hu, B.; Chen, J.Y.; Zhang, X.F. Monitoring the Land Subsidence Area in a Coastal Urban Area with InSAR and GNSS. Sensors 2019, 19, 3181. [Google Scholar] [CrossRef] [PubMed]
- Abidin, H.Z.; Andreas, H.; Djaja, R.; Darmawan, D.; Gamal, M. Land subsidence characteristics of Jakarta between 1997 and 2005, as estimated using GPS surveys. GPS Solut. 2008, 12, 23–32. [Google Scholar] [CrossRef]
- Tang, W.; Zhan, W.; Jin, B.W.; Motagh, M.; Xu, Y.B. Spatial Variability of Relative Sea-Level Rise in Tianjin, China: Insight from InSAR, GPS, and Tide-Gauge Observations. IEEE J. Sel. Top. Appl. Earth Obs. Remote Sens. 2021, 14, 2621–2633. [Google Scholar] [CrossRef]
- Acosta, G.; Rodríguez, A.; Euillades, P.; Euillades, L.; Ruiz, F.; Rosell, P.; Sanchez, M.; Leiva, F.; Ariza, J.; García, H. Detection of active landslides by DInSAR in Andean Precordillera of San Juan, Argentina. J. S. Am. Earth Sci. 2021, 108, 103205. [Google Scholar] [CrossRef]
- Osmanoglu, B.; Sunar, F.; Wdowinski, S.; Cabral-Cano, E. Time series analysis of InSAR data: Methods and trends. ISPRS J. Photogramm. Remote Sens. 2016, 115, 90–102. [Google Scholar] [CrossRef]
- Dai, K.R.; Shi, X.L.; Gou, J.S.; Hu, L.Y.; Chen, M.; Zhao, L.; Dong, X.J.; Li, Z.H. Diagnosing Subsidence Geohazard at Beijing Capital International Airport, from High-Resolution SAR Interferometry. Sustainability 2020, 12, 2269. [Google Scholar] [CrossRef]
- Bekaert, D.P.S.; Hooper, A.; Wright, T.J. A spatially variable power law tropospheric correction technique for InSAR data. J. Geophys. Res. Solid Earth 2015, 120, 1345–1356. [Google Scholar] [CrossRef]
- Ciampalini, A.; Bardi, F.; Bianchini, S.; Frodella, W.; Del Ventisette, C.; Moretti, S.; Casagli, N. Analysis of building deformation in landslide area using multisensor PSInSAR™ technique. Int. J. Appl. Earth Obs. 2014, 33, 166–180. [Google Scholar] [CrossRef]
- Chen, Y.; Yu, S.W.; Tao, Q.X.; Liu, G.L.; Wang, L.Y.; Wang, F.Y. Accuracy Verification and Correction of D-InSAR and SBAS-InSAR in Monitoring Mining Surface Subsidence. Remote Sens. 2021, 13, 4365. [Google Scholar] [CrossRef]
- Zhou, C.D.; Lan, H.X.; Gong, H.L.; Zhang, Y.Q.; Warner, T.A.; Clague, J.J.; Wu, Y.M. Reduced rate of land subsidence since 2016 in Beijing, China: Evidence from Tomo-PSInSAR using RadarSAT-2 and Sentinel-1 datasets. Int. J. Remote Sens. 2020, 41, 1259–1285. [Google Scholar] [CrossRef]
- Ferretti, A.; Prati, C.; Rocca, F. Nonlinear subsidence rate estimation using permanent scatterers in differential SAR interferometry. IEEE Trans. Geosci. Remote Sens. 2000, 38, 2202–2212. [Google Scholar] [CrossRef]
- Berardino, P.; Fornaro, G.; Lanari, R.; Sansosti, E. A new algorithm for surface deformation monitoring based on small baseline differential SAR interferograms. IEEE Trans. Geosci. Remote Sens. 2002, 40, 2375–2383. [Google Scholar] [CrossRef]
- Tao, Q.X.; Wang, F.Y.; Guo, Z.J.; Hu, L.Y.; Yang, C.; Liu, T.W. Accuracy verification and evaluation of small baseline subset (SBAS) interferometric synthetic aperture radar (InSAR) for monitoring mining subsidence. Eur. J. Remote Sens. 2021, 54, 641–662. [Google Scholar] [CrossRef]
- Hu, B.B.; Zhou, J.; Wang, J.; Chen, Z.L.; Wang, D.Q.; Xu, S.Y. Risk assessment of land subsidence at Tianjin coastal area in China. Environ. Earth Sci. 2009, 59, 269–276. [Google Scholar] [CrossRef]
- Wu, Y.X.; Lyu, H.M.; Shen, J.S.; Arulrajah, A. Geological and hydrogeological environment in Tianjin with potential geohazards and groundwater control during excavation. Environ. Earth Sci. 2018, 77, 392. [Google Scholar] [CrossRef]
- Wang, W.Q.; Ye, Y.C.; Wang, Q.H.; Hu, N.Y. Experimental Study on Anisotropy of Strength, Deformation and Damage Evolution of Contact Zone Composite Rock with DIC and AE Techniques. Rock. Mech. Rock. Eng. 2022, 55, 837–853. [Google Scholar] [CrossRef]
- Liu, S.P.; Shi, B.; Gu, K.; Zhang, C.C.; Yang, J.L.; Zhang, S.; Yang, P. Land subsidence monitoring in sinking coastal areas using distributed fiber optic sensing: A case study. Nat. Hazards 2020, 103, 3043–3061. [Google Scholar] [CrossRef]
- Yang, J.L.; Cao, G.L.; Han, D.M.; Yuan, H.F.; Hu, Y.Z.; Shi, P.X.; Chen, Y.S. Deformation of the aquifer system under groundwater level fluctuations and its implication for land subsidence control in the Tianjin coastal region. Environ. Monit. Assess. 2019, 191, 162. [Google Scholar] [CrossRef] [PubMed]
- Yu, C.; Li, Z.H.; Penna, N.T. Interferometric synthetic aperture radar atmospheric correction using a GPS-based iterative tropospheric decomposition model. Remote Sens. Environ. 2018, 204, 109–121. [Google Scholar] [CrossRef]
- Yu, C.; Li, Z.H.; Penna, N.T.; Crippa, P. Generic Atmospheric Correction Model for Interferometric Synthetic Aperture Radar Observations. J. Geophys. Res. Solid Earth 2018, 123, 9202–9222. [Google Scholar] [CrossRef]
- Liu, P.; Li, Q.Q.; Li, Z.H.; Hoey, T.; Liu, G.X.; Wang, C.S.; Hu, Z.W.; Zhou, Z.W.; Singleton, A. Anatomy of Subsidence in Tianjin from Time Series InSAR. Remote Sens. 2016, 8, 266. [Google Scholar] [CrossRef]
- Chen, D.H.; Chen, H.E.; Zhang, W.; Cao, C.; Zhu, K.X.; Yuan, X.Q.; Du, Y.Y. Characteristics of the Residual Surface Deformation of Multiple Abandoned Mined-Out Areas Based on a Field Investigation and SBAS-InSAR: A Case Study in Jilin, China. Remote Sens. 2020, 12, 3752. [Google Scholar] [CrossRef]
- Yao, J.M.; Yao, X.; Liu, X.H. Landslide Detection and Mapping Based on SBAS-InSAR and PS-InSAR: A Case Study in Gongjue County, Tibet, China. Remote Sens. 2022, 14, 4728. [Google Scholar] [CrossRef]
- Hanssen, R.F. Radar Interferometry: Data Interpretation and Error Analysis; Kluwer Academic: Dordrecht, The Netherlands; Boston, MA, USA, 2001; pp. 161–196. [Google Scholar] [CrossRef]
- Lin, Q.; Vesecky, J.F.; Zebker, H.A. Phase unwrapping through fringe-line detection in synthetic aperture radar interferometry. Appl. Opt. 1994, 33, 201–208. [Google Scholar] [CrossRef]
- Goldstein, R.M.; Werner, C.L. Radar interferogram filtering for geophysical applications. Geophys. Res. Lett. 1998, 25, 4035–4038. [Google Scholar] [CrossRef]
- Costantini, M. A novel phase unwrapping method based on network programming. IEEE Trans. Geosci. Remote Sens. 1998, 36, 813–821. [Google Scholar] [CrossRef]
- Wu, Q.; Jia, C.T.; Chen, S.B.; Li, H.Q. SBAS-InSAR Based Deformation Detection of Urban Land, Created from Mega-Scale Mountain Excavating and Valley Filling in the Loess Plateau: The Case Study of Yan’an City. Remote Sens. 2019, 11, 1673. [Google Scholar] [CrossRef]
- Chen, W.G.; Wang, D.C.; Huang, Y.; Chen, L.D.; Zhang, L.H.; Wei, X.W.; Sang, M.Q.; Wang, F.C.; Liu, J.Y.; Hu, B.X. Monitoring and analysis of coastal reclamation from 1995–2015 in Tianjin Binhai New Area, China. Sci. Rep. 2017, 7, 3850. [Google Scholar] [CrossRef] [PubMed]
- Zou, T.; Zhou, Z. Urban surface water system in coastal areas: A comparative study between Almere and Tianjin Eco-city. Open J. Ecol. 2013, 03, 407–416. [Google Scholar] [CrossRef][Green Version]
- Du, Z.Y.; Ge, L.L.; Ng, A.H.M.; Zhu, Q.G.Z.; Yang, X.H.; Li, L.Y. Correlating the subsidence pattern and land use in Bandung, Indonesia with both Sentinel-1/2 and ALOS-2 satellite images. Int. J. Appl. Earth Obs. 2018, 67, 54–68. [Google Scholar] [CrossRef]
- Corbau, C.; Simeoni, U.; Zoccarato, C.; Mantovani, G.; Teatini, P. Coupling land use evolution and subsidence in the Po Delta, Italy: Revising the past occurrence and prospecting the future management challenges. Sci. Total Environ. 2019, 654, 1196–1208. [Google Scholar] [CrossRef]
- Minderhoud, P.S.J.; Coumou, L.; Erban, L.E.; Middelkoop, H.; Stouthamer, E.; Addink, E.A. The relation between land use and subsidence in the Vietnamese Mekong delta. Sci. Total Environ. 2018, 634, 715–726. [Google Scholar] [CrossRef]
- Yang, J.; Huang, X. The 30 m annual land cover dataset and its dynamics in China from 1990 to 2019. Earth Syst. Sci. Data 2021, 13, 3907–3925. [Google Scholar] [CrossRef]
- GB/T 21010-2017; Current Land Use Classification. China Standards Press: Beijing, China, 2017.
- Jafarpour Ghalehteimouri, K.; Shamsoddini, A.; Mousavi, M.N.; Binti Che Ros, F.; Khedmatzadeh, A. Predicting spatial and decadal of land use and land cover change using integrated cellular automata Markov chain model based scenarios (2019–2049) Zarriné-Rūd River Basin in Iran. Environ. Chall. 2022, 6, 100399. [Google Scholar] [CrossRef]
- Zangabadi, S.S.; Shamsipour, A.; Jafarpour Ghalehteimouri, K.; Hosseini, A. A holistic exploration local climate zoning through land use and land cover values: Tehran’s urban climate tapestry. Theor. Appl. Climatol. 2024, 155, 9783–9797. [Google Scholar] [CrossRef]
- Shamai, A.; Jafarpour Ghalehteimouri, K. Land use evaluation and capacity assessment for sustainable urban physical development: Case of study Ahvaz city. City Territ. Archit. 2024, 11, 18. [Google Scholar] [CrossRef]
- Ao, Z.R.; Hu, X.M.; Tao, S.L.; Hu, X.; Wang, G.Q.; Li, M.J.; Wang, F.; Hu, L.T.; Liang, X.Y.; Xiao, J.F.; et al. A national-scale assessment of land subsidence in China’s major cities. Science 2024, 384, 301–306. [Google Scholar] [CrossRef]
- Herrera-García, G.; Ezquerro, P.; Tomás, R.; Béjar-Pizarro, M.; López-Vinielles, J.; Rossi, M.; Mateos, R.M.; Carreón-Freyre, D.; Lambert, J.; Teatini, P.; et al. Mapping the global threat of land subsidence. Science 2021, 371, 34–36. [Google Scholar] [CrossRef] [PubMed]
- Jiang, Z.S.; Zhu, J.Y.; Guo, H.P.; Qiu, K.S.; Tang, M.; Yang, X.H.; Liu, J.Y. South-to-North Water Diversion Halting Long-Lived Subsidence in Tianjin, North China Plain. Remote Sens. 2024, 16, 3213. [Google Scholar] [CrossRef]
- Guo, H.P.; Jiao, J.J. Impact of coastal land reclamation on ground water level and the sea water interface. Ground Water 2007, 45, 362–367. [Google Scholar] [CrossRef] [PubMed]
- Liu, B.; Wang, Y.; Rabczuk, T.; Olofsson, T.; Lu, W. Multi-scale modeling in thermal conductivity of Polyurethane incorporated with Phase Change Materials using Physics-Informed Neural Networks. Renew. Energy 2024, 220, 119565. [Google Scholar] [CrossRef]
- Xiong, Z.; Deng, K.; Feng, G.; Miao, L.; Li, K.; He, C.; He, Y. Settlement Prediction of Reclaimed Coastal Airports with InSAR Observation: A Case Study of the Xiamen Xiang’an International Airport, China. Remote Sens. 2022, 14, 3081. [Google Scholar] [CrossRef]
- Bai, Z.; Wang, Y.; Li, M.; Sun, Y.; Zhang, X.; Wu, Y.; Li, Y.; Li, D. Land Subsidence in the Singapore Coastal Area with Long Time Series of TerraSAR-X SAR Data. Remote Sens. 2023, 15, 2415. [Google Scholar] [CrossRef]
- Ma, G.; Zhao, Q.; Wang, Q.; Liu, M. On the Effects of InSAR Temporal Decorrelation and Its Implications for Land Cover Classification: The Case of the Ocean-Reclaimed Lands of the Shanghai Megacity. Sensors 2018, 18, 2939. [Google Scholar] [CrossRef]
- Liu, B.; Liu, P.; Wang, Y.; Li, Z.; Lv, H.; Lu, W.; Olofsson, T.; Rabczuk, T. Explainable machine learning for multiscale thermal conductivity modeling in polymer nanocomposites with uncertainty quantification. Compos. Struct. 2025, 370, 119292. [Google Scholar] [CrossRef]
- Zhang, X.; Xia, Y.Y.; Zhang, C.; Liu, B.K.; Wang, C.X.; Fang, H.Y.; Wang, J. A prediction model for dyke-dam piping based on data augmentation and interpretable ensemble learning. Eng. Fail. Anal. 2025, 182, 110174. [Google Scholar] [CrossRef]
- Liu, B.; Liu, P.; Lu, W.; Olofsson, T. Explainable Artificial Intelligence (XAI) for Material Design and Engineering Applications: A Quantitative Computational Framework. Int. J. Mech. Syst. Dyn. 2025, 5, 236–265. [Google Scholar] [CrossRef]
Disclaimer/Publisher’s Note: The statements, opinions and data contained in all publications are solely those of the individual author(s) and contributor(s) and not of MDPI and/or the editor(s). MDPI and/or the editor(s) disclaim responsibility for any injury to people or property resulting from any ideas, methods, instructions or products referred to in the content. |
© 2025 by the authors. Licensee MDPI, Basel, Switzerland. This article is an open access article distributed under the terms and conditions of the Creative Commons Attribution (CC BY) license (https://creativecommons.org/licenses/by/4.0/).