Abstract
Seismic risk assessment in megacities requires a high-resolution spatial framework that can capture the intrinsic heterogeneity of local geology, building distribution, and population characteristics beyond conventional administrative boundaries. This study develops a hazard-independent seismic susceptibility framework for the Seoul Metropolitan Area, a megacity of approximately 9.5 million residents (as of 2024), where historical and instrumental earthquake records are limited. The proposed framework integrates nine standardized indicators across geotechnical, structural, and social domains within a vulnerability–exposure model, analyzed on a 250 m grid—approximately 300 times finer than district-level assessments. Domain-specific indices and the integrated Seismic Susceptibility Index (SSI) were derived using Analytic Hierarchy Process (AHP)-based weighting to quantify the relative importance of indicators. Results show a highly concentrated spatial pattern of susceptibility: only 2.2% of Seoul (229 grids, 14.3 km2) falls within the high-to-very-high categories, primarily in northern and southwestern residential zones characterized by soft soils, aging buildings, and vulnerable populations. The proposed framework supports targeted risk-reduction strategies by providing a practical basis for pre-disaster decision-making and efficient allocation of mitigation resources in data-scarce urban environments.
1. Introduction
Seismic risk in megacities represents a multifaceted challenge in contemporary disaster risk science [1,2,3]. The convergence of dense populations, critical infrastructure, and intricate socio-economic systems can amplify the impact of even moderate earthquakes [4,5]. Urban seismic susceptibility is defined as the intrinsic propensity of urban systems to experience damage under uniform ground shaking [6,7]. It arises not only from geological site conditions but from the interplay among geotechnical characteristics, structural vulnerabilities, and socio-economic attributes [8]. These systemic interdependencies and the potential for cascading failures demand multidisciplinary approaches that move beyond single-domain analyses [8,9].
Although the Korean Peninsula was traditionally perceived as seismically stable, this perception changed following the 2016 Gyeongju (Mw 5.8) and 2017 Pohang (Mw 5.4) earthquakes [10,11]. These events revealed that even moderate earthquakes can cause considerable damage [12,13]. Moreover, subsequent geological investigations have identified the distribution of multiple active Quaternary faults across the peninsula [14,15]. In a megacity like Seoul, where both population and building densities are high, even small-to-moderate earthquakes may cause significant localized impacts.
A large body of literature on seismic risk studies at both national and international levels can be found [1,2,16,17,18,19]. Like many megacities in moderate seismicity regions (e.g., Montreal, Lisbon) [19,20,21,22], Seoul faces relatively high exposure despite moderate hazard levels. Most seismic risk assessments operate at national or city scales using administrative boundaries as analytical units. Although this approach supports large-scale planning, it fails to capture fine-grained spatial heterogeneity critical for urban seismic risk management [4,17,23,24]. Domestic studies, including those for Gyeongju [25] and nationwide evaluations in Korea [26], exhibit similar limitations through their reliance on administrative boundaries as analytical units. In addition, despite growing international interest in high-resolution urban risk modeling [27,28,29], integrated seismic risk studies remain limited, particularly those incorporating social vulnerability. In Korea, for example, there is a lack of comprehensive assessments for Seoul. Existing research has focused primarily on individual components, such as seismic hazard [10,30] or building vulnerability [31,32], without considering multi-domain interactions. While Probabilistic Seismic Hazard Analyses (PSHA) remain fundamental for estimating ground-motion parameters, they depend on the availability of historical earthquake records and fault-recurrence data [33,34]. In regions such as Seoul, where instrumental observations are relatively short and large-magnitude events have not been documented, a complementary hazard-independent assessment can provide additional context for understanding vulnerability and exposure [35,36]. Therefore, this study introduces a susceptibility-based framework that serves as a pre-hazard baseline, which can later be integrated with PSHA-based models to achieve a more comprehensive view of seismic risk.
This study presents a high-resolution seismic susceptibility assessment for the Seoul Metropolitan Area through a vulnerability–exposure framework that integrates geotechnical, structural, and social factors on a 250 m grid, enabling the identification of localized high-susceptibility zones within the city. The proposed framework adopts the proactive paradigm of disaster risk reduction by emphasizing vulnerability and exposure rather than hazard intensity. It aligns with the UNDRR [37] Sendai Framework, which promote pre-disaster risk governance and evidence-based decision-making, and provides a robust foundation for risk-informed urban planning and emergency preparedness in megacities such as Seoul.
2. Study Area
Seoul, the capital of South Korea, is located in the center of the Korean Peninsula (Figure 1a). The city covers an area of 605.21 km2. Topographically, Seoul is surrounded by mountains including Bukhansan to the north and Gwanaksan to the south, while the central areas are characterized by extensive alluvial plains formed by the Hangang River and its tributaries [38,39]. Seoul is administratively divided into 25 autonomous districts (Figure 1b).
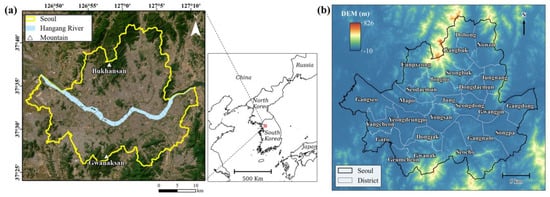
Figure 1.
Spatial context of Seoul: (a) satellite imagery showing geographic location within the Korean Peninsula and major topographic features, and (b) digital elevation model with administrative district boundaries.
Seoul’s urban morphology reflects rapid industrialization and urbanization processes since the 1960s. Seismic design requirements were first introduced in the 1988 Building Code amendments, with phased implementation across major building categories [25,40]. The city contains approximately 500,000 structures, 32.4% of which were built before the introduction of seismic code requirements (Figure 2a). Historic central districts and northwestern areas, developed primarily during the 1970s–1980s [41,42], exhibit concentrated distributions of aging structures that may have limited seismic performance.
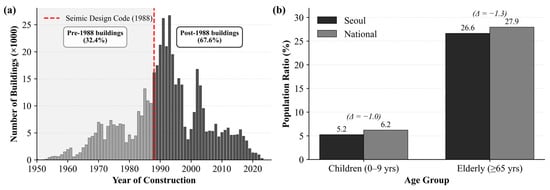
Figure 2.
Urban characteristics of the study area: (a) temporal distribution of buildings by year of construction, and (b) demographic vulnerability characteristics comparing the ratios of children (0–9 years) and elderly (≥65 years) populations between Seoul and the national average (Seoul − National).
Demographically, Seoul houses approximately 9.5 million residents (September 2024), with 26.6% aged 65 or older and 5.2% under 10 years, comparable to national averages of 27.9% and 6.2%, respectively (Figure 2b). These population groups are considered more vulnerable during disasters due to limitations in rapid decision-making and evacuation capacity, and their spatial distribution is therefore an important factor in susceptibility assessments.
These characteristics establish Seoul as a representative case for seismic risk analysis in densely populated megacities. In such urban environments, intrinsic system susceptibility often governs damage outcomes more decisively than seismic hazard intensity itself.
3. Methodology
3.1. Multi-Level Seismic Susceptibility Assessment Framework
This study develops a hierarchical multi-level index system that integrates theoretical foundations with practical applicability for disaster risk management. The framework builds upon Cutter, Boruff and Shirley [31]’s Hazards-of-Place model and Pittore, et al. [43] multi-resolution assessment approach, adapted to Seoul’s administrative structure and policy requirements for targeted disaster risk reduction interventions.
The framework integrates indicators across geotechnical, structural, and social domains into three index levels (Figure 3a). Within each domain, indicators are conceptually divided into vulnerability (intrinsic susceptibility characteristics) and exposure (extent of elements at risk) [37,44].
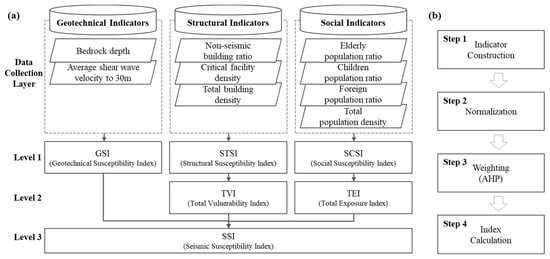
Figure 3.
Analytical framework for seismic susceptibility assessment: (a) data collection layer comprising nine indicators across three domains (geotechnical, structural, and social) and their aggregation into multi-level indices (GSI, STSI, SCSI, TVI, TEI, SSI), and (b) four-step calculation flow chart.
In the data collection layer, nine indicators are collected and preprocessed. At Level 1, three domain-specific susceptibility indices are produced: the Geotechnical Susceptibility Index (GSI) quantifying ground amplification potential, the Structural Susceptibility Index (STSI) representing built environment conditions, and the Social Susceptibility Index (SCSI) characterizing demographic vulnerabilities. At Level 2, auxiliary indices, such as the Total Vulnerability Index (TVI) and Total Exposure Index (TEI), integrate vulnerability and exposure components across structural and social domains. At Level 3, the Seismic Susceptibility Index (SSI) is derived as a weighted linear combination of GSI, STSI, and SCSI, providing an integrated representation of overall susceptibility. SSI values are classified into five grades using equal interval classification.
As illustrated in (Figure 3b), the analysis proceeds through four stages: (1) construction through GIS-based spatial standardization, converting point-interpolated, polygon, and grid data into a unified grid format; (2) normalization via min-max transformation; (3) weighting through an AHP-based expert survey; and (4) multi-level index calculation by sequentially computing Level 1-3 indices from normalized values and weights. All calculations were conducted on a 250 m × 250 m grid (10,125 cells total), providing a spatial resolution approximately 387 times finer than the average administrative district (24.21 km2).
3.2. Indicators and Data
Based on established theoretical frameworks [29,31,35,43] and Seoul’s regional characteristics, six vulnerability indicators and three exposure indicators were selected (Table 1).

Table 1.
Seismic susceptibility indicators and data sources.
3.2.1. Geotechnical Indicators
Geotechnical indicators represent intrinsic physical properties that influence site-specific ground amplification and damage intensity, even under identical seismic loading. Kriged surface data, produced by ordinary kriging from 15,494 borehole records by Lee, Lee and Park [30], were resampled to the defined grid cells.
Bedrock depth (H, GT1) represents the depth to engineering bedrock beneath the surface soil. Sites with deeper overburden layers generally experience stronger shaking because soft soils amplify ground motions. Thus, greater depth indicates higher amplification potential during an earthquake.
Average shear wave velocity to 30 m (VS30, GT2) is calculated as the time-weighted average to 30 m depth, indicating ground stiffness [47,48]. Lower VS30 values indicate softer soils that tend to amplify seismic waves. Therefore, lower VS30 values were assigned higher susceptibility scores in the analysis.
3.2.2. Structural Indicators
Structural indicators were developed using building registry containing information such as year of construction, structural type, and floor area, combined with GIS datasets obtained from the V-WORLD [45]. Each building polygon was assigned to a single grid cell based on its centroid location, ensuring unique allocation and preventing double-counting.
Structural vulnerability (STV1) represents the percentage of buildings constructed before effective compliance with seismic design. Practical application remained low through the early 1990s, so 1994 was adopted as a conservative threshold:
where is the number of pre-1994 buildings in grid and is the total building count.
Structural exposure comprises two indicators. Total building density (STE1) is the total building count per grid, representing the absolute scale of physical assets at risk. Critical facility density (STE2) represents the number of facilities per grid whose functional disruption could amplify secondary impacts. Critical facilities were classified by building use codes into categories including hospitals, schools, substations, power plants, hazardous material storage, and other key public service buildings. This indicator represents exposure to potential cascading effects.
3.2.3. Social Indicators
Unlike prior studies relying on static census data [8,26,29], this study uses time-resolved living population data from Seoul Open Data Plaza [46], derived from anonymized mobile network data. The dataset provides high-resolution population distributions by 250 m grid, time, gender, and age. Weekday late-night periods (September 2024) were selected to capture the realistic residential population distribution.
Social vulnerability comprises population groups with relatively limited self-evacuation and recovery capacity. Elderly population ratio (SCV1) is the percentage aged 65 or older, characterized by mobility and evacuation limitations [16,31]. Child population ratio (SCV2) is the percentage under 10 years old, with high care needs and limited self-evacuation capability [49,50]. Foreign population ratio (SCV3) is the percentage of foreign residents facing disaster information access constraints due to language and cultural barriers.
Social exposure (SCE1) is the total population count per grid, representing the absolute number of people at risk. Higher population density is associated with a higher potential for casualties under identical ground shaking.
3.3. Analytic Hierarchy Process-Based Weighting
The Analytic Hierarchy Process (AHP) was applied as a matrix-based multi-criteria decision-making method to determine the relative importance of indicators [51,52]. AHP decomposes complex problems into hierarchical levels and converts subjective expert judgments into quantitative weights through pairwise comparisons. Although the method includes consistency checks to minimize bias, it fundamentally reflects expert judgment rather than objective measurement [52]. AHP has been widely used in disaster risk assessments [8,29,50].
Twenty experts from academia and government evaluated the indicators using Saaty’s 9-point scale, and all matrices satisfied the consistency-ratio threshold (CR < 0.1). Individual weights were aggregated using the geometric mean.
As shown in Table 2, domain-level weights (Level 1) indicated that structural factors had the highest relative importance (0.50), followed by social factors (0.35) and geotechnical factors (0.15). This reflects expert consensus that structural factors have the most direct influence on earthquake damage.

Table 2.
AHP-derived weights for seismic susceptibility indicators.
3.4. Susceptibility Index Calculation
Since indicators have different units and measurement scales, min-max normalization was applied to transform all values to a 0-1 scale. For indicators where higher values indicate greater vulnerability, positive-direction normalization was applied. Conversely, for indicators where higher values indicate lower vulnerability (e.g., GT2), an inverse transformation was performed prior to normalization:
where is the original value of indicator in grid cell , and are the minimum and maximum values of that indicator across all grid cells, and is the rescaled value.
Three domain-level susceptibility indices are calculated using different approaches. GSI combines two geotechnical vulnerability indicators through a weighted linear combination. STSI and SCSI integrate vulnerability and exposure components within each domain.
where all variables refer to grid cell . The definitions of indicators and weights follow those presented in Section 3.2. Indicators and data.
The integrated vulnerability and exposure indices are then formulated to facilitate broader policy interpretation. The TVI and TEI integrate structural-social vulnerability and exposure components, respectively:
where and are weighted at 0.59 and 0.41, respectively, after excluding geotechnical factors and renormalizing the original AHP weights.
The SSI is finally computed using AHP-derived domain weights (Table 2). Higher SSI values indicate greater comprehensive seismic susceptibility at each grid cell.
, , and are the domain weights for the geotechnical (0.15), structural (0.50), and social (0.35) domains derived from the AHP survey (Table 2).
The calculated SSI values were classified into five grades using equal interval method with an interval of 0.2. This classification provides consistent interpretability, enabling the identification of high-susceptibility areas and supporting evidence-based disaster risk management.
4. Results
4.1. Spatial Patterns of Component Indices
4.1.1. Geotechnical Susceptibility Index
The analysis of geotechnical susceptibility in Seoul revealed distinct spatial variability. The spatial pattern of bedrock depth (GT1), as shown in Figure 4a, indicates that thick overburden layers—often exceeding 30 m—are concentrated along the Hangang River basin and its tributary plains, reflecting long-term fluvial deposition and lateral sediment accumulation [53]. These deposits consist mainly of soft alluvial materials such as silty sand and clayey silt, resulting from repeated flooding and channel migration. In contrast, shallow bedrock conditions (<5 m) prevail in the northern and southern uplands, where weathered granite are exposed or covered by thin colluvial soils. Similarly, VS30 values (GT2) show an opposite tendency: alluvial plains generally record 280–320 m/s, whereas exposed bedrock zones in mountainous areas exceed 800 m/s (Figure 4b). The two indicators exhibit a strong inverse correlation (r = −0.73, p < 0.001) (Figure 4c), indicating that thicker unconsolidated deposits are associated with softer soils having lower shear stiffness, which can amplify seismic waves more readily during an earthquake.

Figure 4.
Spatial distribution of geotechnical indicators: (a) H, (b) VS30, and (c) correlation between the two indicators (r = −0.76, p < 0.001).
GSI values showed clear spatial patterns, with the highest concentrations across the Hangang River basin and southwestern alluvial plains (Figure 5a). The mean GSI was 0.43, with a moderately left-skewed distribution (skewness = −0.523) (Figure 5b). While GSI values are relatively well-distributed across Seoul, the top 25% (>0.537) were concentrated in alluvial zones along the Hangang River, highlighting areas with elevated potential for ground motion amplification during seismic events.
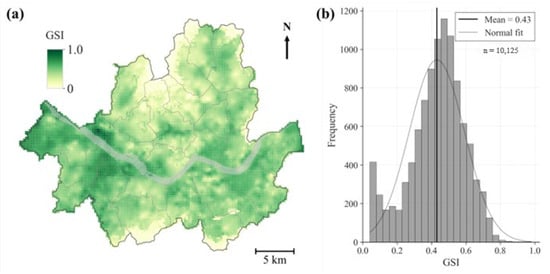
Figure 5.
(a) Spatial and (b) statistical distribution of GSI across Seoul.
4.1.2. Structural Susceptibility Index
The proportion of non-seismic buildings (STV1) was calculated, and about 58.6% of buildings were identified as non-seismic. Northern districts (Dobong, Nowon, Gangbuk) showed high ratios of 70–100% (Figure 6a), corresponding to the concentration of older residential buildings constructed during the housing development of the 1970s and 1980s. In contrast, recently developed areas in Gangnam and Seocho showed relatively lower ratios of 30–40%. Building density (STE1) was highest in central business and commercial districts such as Jung and Jongno, reaching 200–400 buildings per grid, while mountainous and park areas showed very limited development (Figure 6b). Critical facilities (STE2) accounted for about 2.0% of buildings and were dispersed across residential neighborhoods, particularly around schools and hospitals (Figure 6c).

Figure 6.
Spatial distribution of structural indicators: (a) non-seismic building ratio, (b,c) building and critical facility density.
High STSI values are clustered in the northern and southwestern residential areas of Seoul (Figure 7a). In contrast, central and southeastern districts exhibit low STSI values, corresponding to the predominance of newer, code-compliant structures. The mean STSI was 0.070, indicating generally low levels of structural susceptibility (Figure 7b). The distribution was right-skewed (skewness = 1.403), with most grids concentrated in the 0.0–0.1 range. High-risk grids (STSI > 0.20) accounted for only 7.8% of the northern areas. The high coefficient of variation (CV = 110.7%) indicates distinct spatial variability.
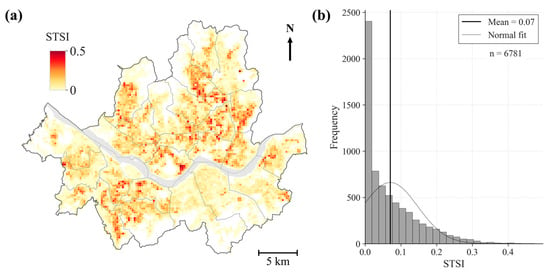
Figure 7.
(a) Spatial and (b) statistical distribution of STSI across Seoul.
4.1.3. Social Susceptibility Index
The proportion of elderly residents (SCV1) averaged 18.9% and was relatively evenly distributed across the city, with several residential neighborhoods near Bukhansan exceeding 25% (Figure 8a). Child population ratios (SCV2) were relatively higher in large apartment complex areas but averaged only 8.7% citywide (Figure 8b). Foreign residents (SCV3) showed localized concentrations up to 30% in Jung, Mapo, and Yongsan, while the overall average was 4.0% (Figure 8c). Population density (SCE1) reached approximately 13,000 persons per grid in high-density residential and commercial areas, while mountain and river park areas remained near zero (Figure 8d).
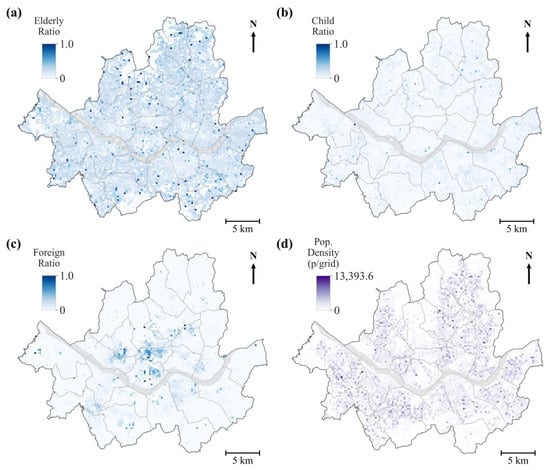
Figure 8.
Spatial distribution of demographic indicators: (a–c) elderly, child, and foreign population ratios, and (d) population density.
SCSI values are broadly distributed across residential areas, with localized hotspots in the northeastern, northwestern, and southwestern parts of Seoul (Figure 9a). The distribution is strongly right-skewed (skewness = 1.67), with 75% of grid cells falling below 0.01 (Figure 9b). The mean SCSI is 0.01 while the CV (128%) is the highest among the three indices, indicating that social vulnerability is concentrated within a limited number of grid cells.
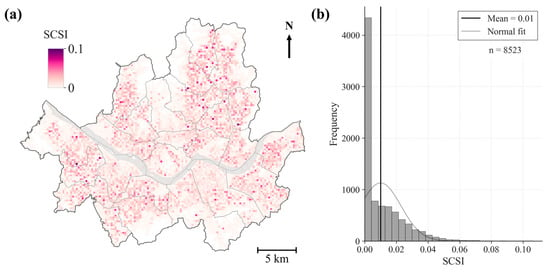
Figure 9.
(a) Spatial and (b) statistical distribution of SCSI across Seoul.
4.1.4. Total Vulnerability and Exposure Indices
TVI represents overall vulnerability characteristics by combining non-seismic building ratios (STV1) and the proportions of socially vulnerable populations (SCV1–3). It shows a wide spatial distribution across Seoul, with high values mainly observed in older urban cores and residential areas developed during the 1970s–1980s (Figure 10a). TEI captures quantitative exposure based on building and population density, exhibiting a more localized spatial concentration in residential and commercial clusters (Figure 10b). While TVI highlights areas with inherent vulnerability characteristics, TEI identifies locations with relatively high concentrations of population and assets at risk.
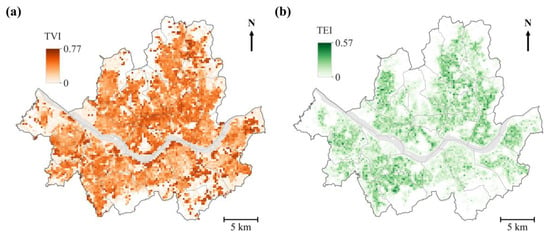
Figure 10.
Spatial distribution of Level 2 indices: (a) TVI and (b) TEI.
4.2. Identification of Seismic Hotspots
4.2.1. Spatial and Statistical Distribution Characteristics
The SSI distribution exhibits a distinct north-south asymmetry divided by the Hangang River (Figure 11a). Northern districts show generally higher SSI values (0.3–0.6), whereas southern districts are mostly lower (0.1–0.3). This pattern is associated with the distribution of aging buildings (high STSI) and elderly populations (high SCSI) concentrated in northern districts. High GSI values are observed along the alluvial belts of the Hangang River, but STSI and SCSI values remain low, resulting in moderate overall SSI levels.
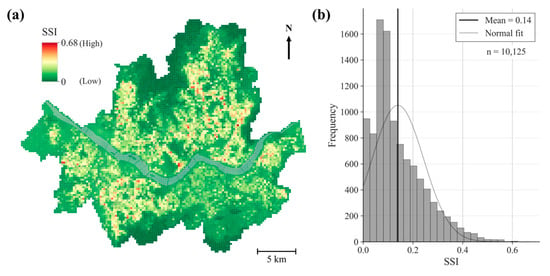
Figure 11.
Spatial distribution and statistical characteristics of SSI: (a) spatial patterns and (b) frequency distribution.
The highest SSI values are observed in areas where multiple susceptibility factors overlap, including soft ground conditions, high proportions of aging buildings, and vulnerable population groups. These critical hotspots are primarily located in older residential districts of northern Seoul (Seongbuk, Dobong, Nowon) and parts of the southwestern alluvial areas (Yeongdeungpo, Guro).
SSI values ranged from 0 to 0.675, with a mean of 0.12 (Figure 11b). The distribution was right-skewed (skewness = 0.88), with most grids concentrated at lower values. With a CV of 99.4%, SSI variability was higher than GSI but lower than STSI and SCSI, indicating that integrating the three domains moderated the variability across grid cells.
4.2.2. Classification by Susceptibility Grade
The normalized SSI values were classified into five grades using equal interval classification (Figure 12). Very Low, Low, and Moderate together account for 97.8% of the city, indicating that most areas fall within the low to moderate susceptibility range. In contrast, High and Very High grades comprise only 2.2% of the total area (229 grids, approximately 14.3 km2). The Very High grade corresponds to 24 grids (about 1.5 km2) are identified as priority management zones.
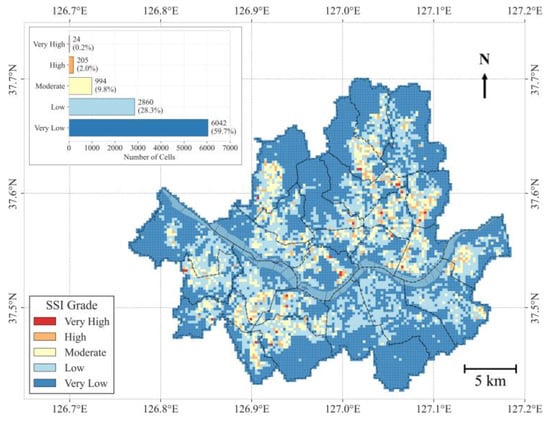
Figure 12.
Classification of seismic susceptibility zones showing the SSI map with five grades and the distribution of cells by grade.
These high-risk areas—representing the High to Very High grades of the susceptibility classification—are primarily characterized by the convergence of structural and social vulnerabilities (Figure 13). Compared to citywide averages, structurally, they exhibit 3.48 times higher building density and 2.08 times higher proportions of non-seismic structures. Demographically, they show 2.66 times higher population density, with elevated concentrations of foreign residents (2.26×) and elderly populations (1.35×). Geotechnical conditions show minimal variation, indicating that susceptibility is predominantly driven by built environment factors, particularly aging and densely developed urban cores.
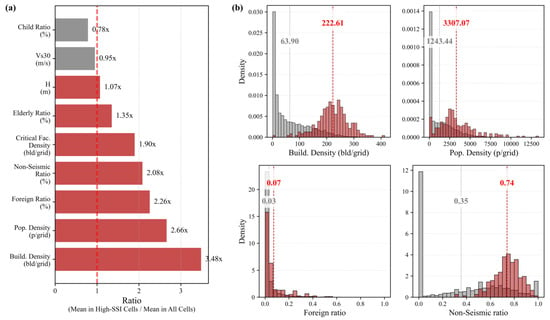
Figure 13.
Characteristics of High to Very High SSI areas: (a) ratio of mean indicator values, and (b) distribution comparison with citywide values (red = High/Very High SSI grids; gray = all grids).
This clear contrast between low and high SSI areas illustrates the spatial concentration of seismic susceptibility in Seoul. Targeted allocation of resources to the 229 high-susceptibility grids (2.2%) could improve mitigation efficiency, while low-susceptibility areas should remain under regular inspection or maintenance to manage potential risk accumulation.
4.3. Administrative District-Level Analysis
Because disaster management policies are implemented at the district level, the SSI results derived from the 250 m grid analysis were aggregated for Seoul’s 25 administrative districts to identify relative susceptibility levels by district. For each district, the proportion of grids classified as High or Very High was calculated (Figure 14a).
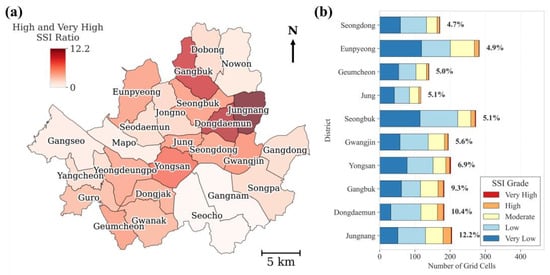
Figure 14.
Spatial distribution of seismic susceptibility by administrative district: (a) percentage of high and very high susceptibility areas by district and (b) top 10 districts ranked by proportion of high-risk grid cells.
Among all districts (Figure 14b), Jungnang showed the highest proportion at 12.2%, followed by Dongdaemun (10.4%) and Gangbuk (9.3%), Yongsan (6.9%), and Gwangjin (5.6%). Most of these districts are located in northern (Jungnang, Dongdaemun, Gangbuk, Seongbuk) and southwestern (Yeongdeungpo, Dongjak, Guro) parts of Seoul.
5. Discussion
5.1. Spatial Concentration and Distribution Patterns
The results reveal a distinct spatial concentration of seismic susceptibility. While most areas fall within low–moderate classes, only a limited portion of the city corresponds to high-risk areas (Figure 12). This provides quantitative evidence to inform targeted rather than uniform intervention strategies.
A clear north–south variation is associated with differences in development history and geological conditions. Northern districts (1970s–1980s development) show high concentrations of aging buildings and elderly populations, while the southwestern alluvial corridor combines soft soil with dense development. In contrast, southeastern areas show uniformly low susceptibility.
The three domains show markedly different spatial patterns. GSI displays a relatively uniform distribution across Seoul, whereas STSI and SCSI exhibit more concentrated patterns with substantial spatial variability. The 250 m resolution reveals considerable variation within individual administrative districts, where SSI values in some grid cells are up to six times higher than in others. This illustrates how coarse administrative units may obscure important micro-scale variations relevant to local risk management.
5.2. Policy Application of the Multi-Level Framework
The hierarchical index system supports tailored interventions across agencies and objectives. Level 1 domain-specific indices provide actionable sectoral priorities. GSI’s relatively even distribution suggests the need for general ground condition management in urban planning. STSI’s high concentration indicates the necessity of prioritizing retrofit programs in northern residential zones. SCSI’s identification of socially vulnerable grids supports more focused emergency preparedness and resource allocation planning.
Level 2 auxiliary indices distinguish management strategies. TVI’s broad distribution across aging cores suggests area-wide qualitative improvements (e.g., strengthened codes, safety education). TEI’s selective concentration in dense clusters indicates opportunities for quantitative management (e.g., density regulations, facility dispersion).
Level 3 integrated assessment (SSI) provides an integrated basis for comprehensive disaster management. Nearly half of all high-risk zones are concentrated in just five districts (Jungnang, Dongdaemun, Gangbuk, Yongsan, Gwangjin) which together cover only 16% of the city’s area. District-specific susceptibility profiles reveal differentiated intervention needs: Jungnang exhibits high population density with elevated elderly and child ratios; Yongsan shows concentrated building and critical facility density; Gangbuk demonstrates compound vulnerabilities across both structural and demographic factors.
While district-level results may vary depending on the specific weighting scheme applied, they consistently identify areas with higher concentrations of vulnerability and exposure factors. These findings provide practical guidance for prioritizing disaster risk reduction efforts and support proactive approaches to urban risk management.
5.3. Methodological Advances
This study addresses three key gaps in previous research. First, it introduces a high-resolution micro-scale analysis. By employing 250 m grid units, the analysis provides a spatial resolution substantially finer than district-level studies, allowing the identification of important intra-district variations that are typically averaged out in administrative-scale analyses.
Second, it establishes an integrated multi-domain framework. Nine indicators across geotechnical, structural, and social dimensions are systematically combined using AHP-based weighting, allowing the framework to capture interactions between vulnerability and exposure that may be underrepresented in single-domain assessments.
Third, it advances a hazard-independent susceptibility assessment approach. By focusing on intrinsic factors rather than relying on seismic hazard analyses, the framework provides practical insights for proactive disaster risk management. Moreover, it is compatible with subsequent hazard model integration and aligns with international standards set by UNDRR and IPCC, facilitating potential application to other megacities with aging infrastructure and heterogeneous geology.
Sensitivity Analysis of Classification Methods
To assess the robustness of the SSI classification, three methods—equal interval (Figure 12), natural breaks (Jenks), and quantiles (Figure 15)—were applied to the normalized SSI grid. The class thresholds and distribution of observations are summarized in Table 3.
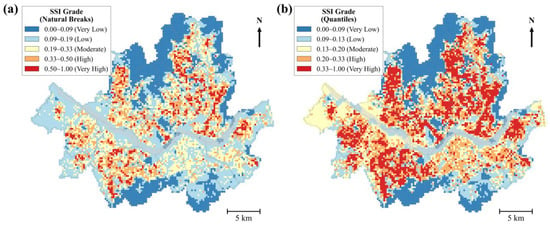
Figure 15.
Comparison of SSI maps classified by (a) natural breaks (Jenks) and (b) quantiles.

Table 3.
Break points and class distributions for three classification methods applied to the normalized seismic susceptibility index.
A pairwise Cohen’s Kappa test was performed to quantify the spatial agreement between schemes. Results indicate low to moderate agreement (Kappa = −0.036 to 0.275), suggesting that classification boundaries vary numerically but have limited impact on the spatial pattern of high-susceptibility zones. Across all methods, cells classified in the top 4–5% under the Equal Interval scheme consistently appeared in the highest classes under Jenks and Quantile schemes as well.
These findings suggest that, while the proportion of each class differs depending on binning criteria, the spatial pattern of high-susceptibility clusters remains consistent across classification methods. This indicates that the framework’s main policy implications and priority areas are consistent and reproducible.
5.4. Limitations and Future Directions
Several directions can further improve and refine the framework. First, future research will extend the current hazard-independent approach toward full risk assessment by incorporating deterministic and probabilistic ground-motion parameters (e.g., PGA, spectral acceleration, site amplification) derived from active fault data. Second, vulnerability characterization should be refined with structural details (e.g., building type, retrofit history) and expanded social indicators (e.g., income, preparedness, resilience). Third, incorporating temporal dynamics and uncertainty analysis beyond the static 2024 snapshot would enhance the robustness of the assessment. Finally, external validation with recent earthquakes that caused damage in Korea, such as Gyeongju and Pohang, would help evaluate the transferability and broader applicability of the framework.
6. Conclusions
This study developed a multi-domain seismic susceptibility framework for Seoul at a 250 m spatial resolution, providing substantially finer detail than conventional administrative boundary-based assessments.
The results provide three key findings with direct policy relevance. First, seismic susceptibility is spatially concentrated: only 2.2% of Seoul (229 grids, 14.3 km2) is classified as high or very high risk, whereas most areas falls into the low range, indicating the need for targeted rather than uniform interventions. Second, domain-specific patterns reveal that geotechnical factors call for broad, citywide strategies, while structural and social vulnerabilities demand selective, hotspot-oriented actions. Third, considerable intra-district variability suggests that conventional district-level analyses may overlook important micro-scale patterns relevant to effective planning.
The hierarchical multi-level index system offers a structured basis for sectoral prioritization and integrated disaster risk management. District-level analysis identifies five priority districts—Jungnang, Dongdaemun, Gangbuk, Yongsan, Gwangjin—containing 43% of high-risk zones within just 16% of the city’s area. The hazard-independent framework, aligned with global standards [37,44], supports proactive management in low-to-moderate seismicity regions and can be coupled with probabilistic hazard models to enhance future risk assessments.
Overall, these findings provide an evidence-based foundation for prioritizing seismic risk management in urban areas. The proposed framework facilitates resource allocation to high-susceptibility areas and provides a transferable approach for other megacities, emphasizing the practical importance of intrinsic susceptibility assessment in earthquake preparedness and mitigation.
Author Contributions
Conceptualization, Y.L. and J.-K.Y.; methodology, Y.L.; software, Y.L.; validation, Y.L. and J.-K.Y.; formal analysis, Y.L.; investigation, Y.L.; data curation, Y.L.; writing—original draft preparation, Y.L.; writing—review and editing, J.-K.Y.; visualization, Y.L.; supervision, J.-K.Y.; project administration, Y.L.; funding acquisition, J.-K.Y. All authors have read and agreed to the published version of the manuscript.
Funding
This research received no external funding. The APC was funded by the Seoul Institute.
Institutional Review Board Statement
Not applicable.
Informed Consent Statement
Not applicable.
Data Availability Statement
The data supporting the findings of this study are available from the corresponding author upon reasonable request.
Conflicts of Interest
The authors declare no conflicts of interest.
References
- Dolce, M.; Prota, A.; Borzi, B.; da Porto, F.; Lagomarsino, S.; Magenes, G.; Moroni, C.; Penna, A.; Polese, M.; Speranza, E.; et al. Seismic risk assessment of residential buildings in Italy. Bull. Earthq. Eng. 2021, 19, 2999–3032. [Google Scholar] [CrossRef]
- Chaulagain, H.; Rodrigues, H.; Silva, V.; Spacone, E.; Varum, H. Seismic risk assessment and hazard mapping in Nepal. Nat. Hazards 2015, 78, 583–602. [Google Scholar] [CrossRef]
- Choo, M.; Yoon, D.K. Examining the effects of the local communities’ social capital on disaster response capacity in Seoul, South Korea. Int. J. Disaster Risk Reduc. 2022, 75, 102973. [Google Scholar] [CrossRef]
- Mestav Sarica, G.; Pan, T.C. Seismic loss dynamics in three Asian megacities using a macro-level approach based on socioeconomic exposure indicators. Commun. Earth Environ. 2022, 3, 101. [Google Scholar] [CrossRef]
- Bansal, B.K.; Chopra, S.; Wu, Y.M. Editorial: Seismic hazard assessment of metropolitan cities: Scenario and challenges. Front. Earth Sci. 2023, 11, 1205383. [Google Scholar] [CrossRef]
- Guéguen, P.; Michel, C.; LeCorre, L. A simplified approach for vulnerability assessment in moderate-to-low seismic hazard regions: Application to Grenoble (France). Bull. Earthq. Eng. 2007, 5, 467–490. [Google Scholar] [CrossRef]
- Xofi, M.; Ferreira, T.M.; Domingues, J.C.; Santos, P.P.; Pereira, S.; Oliveira, S.C.; Reis, E.; Zêzere, J.L.; Garcia, R.A.C.; Lourenço, P.B. On the Seismic Vulnerability Assessment of Urban Areas Using Census Data: The Lisbon Metropolitan Area as a Pilot Study Area. J. Earthq. Eng. 2024, 28, 242–265. [Google Scholar] [CrossRef]
- Ansari, A.; El Hussain, I.; Deif, A.; Mohamed, A.M.; Al-Shijbi, Y.; Al-Jabri, K.; Mandhaniya, P.; Lee, J.H.; Alluqmani, A.E.; Mutaz, E. Integrated GIS-AHP based assessment of earthquake vulnerability and risk for urban residential buildings in Muscat, Sultanate of Oman. Sci. Rep. 2025, 15, 31995. [Google Scholar] [CrossRef] [PubMed]
- Hoyos, M.C.; Hernández, A.F. Impact of vulnerability assumptions and input parameters in urban seismic risk assessment. Bull. Earthq. Eng. 2021, 19, 4407–4434. [Google Scholar] [CrossRef]
- Kim, H.S.; Sun, C.G.; Lee, M.G.; Cho, H.I. Multivariate geotechnical zonation of seismic site effects with clustering-blended model for a city area, South Korea. Eng. Geol. 2021, 294, 106365. [Google Scholar] [CrossRef]
- Han, J.; Nur, A.S.; Syifa, M.; Ha, M.; Lee, C.-W.; Lee, K.-Y. Improvement of Earthquake Risk Awareness and Seismic Literacy of Korean Citizens through Earthquake Vulnerability Map from the 2017 Pohang Earthquake, South Korea. Remote Sens. 2021, 13, 1365. [Google Scholar] [CrossRef]
- Kim, B.; Ji, Y.; Kim, M.; Lee, Y.-J.; Kang, H.; Yun, N.-R.; Kim, H.; Lee, J. Building Damage Caused by the 2017 M5.4 Pohang, South Korea, Earthquake, and Effects of Ground Conditions. J. Earthq. Eng. 2022, 26, 3054–3072. [Google Scholar] [CrossRef]
- Choi, J.H.; Ko, K.; Gihm, Y.S.; Cho, C.S.; Lee, H.; Song, S.G.; Bang, E.S.; Lee, H.J.; Bae, H.K.; Kim, S.W. Surface deformations and rupture processes associated with the 2017 M w 5.4 Pohang, Korea, earthquake. Bull. Seismol. Soc. Am. 2019, 109, 756–769. [Google Scholar] [CrossRef]
- Naik, S.P.; Park, K.; Hategekimana, F.; Shin, H.C.; Kim, Y.S. Stratigraphic and structural evidence of transpressional Quaternary fault reactivation along the SE Korean Peninsula. Quaternary Sci. Adv. 2024, 13, 100165. [Google Scholar] [CrossRef]
- Naik, S.P.; Shin, H.C.; Jeong, S.H.; Park, K.; Hategekimana, F.; Lee, J.; Kim, Y.S.; Choi, J.H.; Takao, K. Comprehensive Analysis of Late Quaternary Faulting and Earthquake Potential on the Cheongun-Dong Fault, Southeast Korea: Implications for Intraplate Seismic Hazards in a Slow Tectonic Regime. Bull. Seismol. Soc. Am. 2025, 115, 1979–2001. [Google Scholar] [CrossRef]
- Frigerio, I.; Ventura, S.; Strigaro, D.; Mattavelli, M.; De Amicis, M.; Mugnano, S.; Boffi, M. A GIS-based approach to identify the spatial variability of social vulnerability to seismic hazard in Italy. Appl. Geogr. 2016, 74, 12–22. [Google Scholar] [CrossRef]
- Huang, C.; Palacios, S.M.; Meslem, A. Development of a new tool for seismic risk assessment and multi-criteria decision making. Int. J. Disaster Risk Reduc. 2024, 106, 104261. [Google Scholar] [CrossRef]
- Ravankhah, M.; Schmidt, M.; Will, T. An indicator-based risk assessment framework for World Heritage sites in seismic zones: The case of “Bam and its Cultural Landscape” in Iran. Int. J. Disaster Risk Reduc. 2021, 63, 102405. [Google Scholar] [CrossRef]
- Silva, V.; Crowley, H.; Varum, H.; Pinho, R. Seismic risk assessment for mainland Portugal. Bull. Earthq. Eng. 2014, 13, 429–457. [Google Scholar] [CrossRef]
- Rosset, P.; Zhu, H.; Chouinard, L.; Sirous, N.; Rimando, J.; Peace, A.; Goda, K. Influence of local versus national datasets on seismic loss estimates: A case study for residential buildings in the metropolitan area of Montreal, Canada. Int. J. Disaster Risk Reduc. 2024, 105, 104404. [Google Scholar] [CrossRef]
- Abo El Ezz, A.; Smirnoff, A.; Nastev, M.; Nollet, M.-J.; McGrath, H. ER2-Earthquake: Interactive web-application for urban seismic risk assessment. Int. J. Disaster Risk Reduc. 2019, 34, 326–336. [Google Scholar] [CrossRef]
- Mascheri, G.; Chieffo, N.; Arrighi, C.; Del Gaudio, C.; Lourenço, P.B. A framework for multi-risk assessment in a historical area of Lisbon. Int. J. Disaster Risk Reduc. 2024, 108, 104508. [Google Scholar] [CrossRef]
- Bellalem, F.; Molina, S.; Daniell, J.; Maouche, S.; Talbi, A.; Mobarki, M.; Ymmel, H.; Djellit, H. Seismic risk assessment for the downtown of the city of Blida, Algeria. Int. J. Disaster Risk Reduc. 2024, 103, 104314. [Google Scholar] [CrossRef]
- Galderisi, A.; Limongi, G. A Comprehensive Assessment of Exposure and Vulnerabilities in Multi-Hazard Urban Environments: A Key Tool for Risk-Informed Planning Strategies. Sustainability 2021, 13, 9055. [Google Scholar] [CrossRef]
- Han, J.; Kim, J. A GIS-Based Seismic Vulnerability Mapping and Assessment Using AHP: A Case Study of Gyeongju, Korea. Korean J. Remote Sens. 2019, 35, 217–228. [Google Scholar] [CrossRef]
- Lee, S.; Oh, S. A comprehensive seismic risk assessment map of South Korea based on seismic, geotechnical, and social vulnerability. Environ. Earth Sci. 2022, 81, 33. [Google Scholar] [CrossRef]
- Malakar, M.; Malakar, S.; Hasan, M.S.U.; Rai, A.K.; Kannaujiya, V.K. Seismic risk assessment using integrated MCDM method in West Bengal, India. Evol. Earth 2024, 2, 100036. [Google Scholar] [CrossRef]
- Yu, K.; Chouinard, L.E.; Rosset, P. Seismic vulnerability assessment for Montreal. Georisk 2016, 10, 164–178. [Google Scholar] [CrossRef]
- Rahimi, F.; Sadeghi Niaraki, A.; Ghodousi, M.; Choi, S.M. Spatial-temporal modeling of urban resilience and risk to earthquakes. Sci. Rep. 2025, 15, 8321. [Google Scholar] [CrossRef]
- Lee, Y.; Lee, Y.-G.; Park, D. Geotechnical data based seismic microzonation in Seoul using region-specific and code-based site amplification models. Bull. Earthq. Eng. 2024, 22, 2375–2403. [Google Scholar] [CrossRef]
- Cutter, S.L.; Boruff, B.J.; Shirley, W.L. Social Vulnerability to Environmental Hazards. Soc. Sci. Q. 2003, 84, 242–261. [Google Scholar] [CrossRef]
- Park, Y.; Yang, J.S.; Kim, S. Social and Economic Disaster Vulnerability Assessment Considering Urban Characteristics of Seoul. J. Korean Soc. Hazard Mitig. 2016, 16, 337–345. [Google Scholar] [CrossRef]
- Ba, Z.; Zhao, J.; Zhang, Y.; Wu, M.; Mu, S. A Probabilistic Seismic Hazard Analysis Method Incorporating Physics-Based Simulation and Ground Motion Prediction Equation. Int. J. Disaster Risk Sci. 2025, 16, 392–407. [Google Scholar] [CrossRef]
- STEIn, S.; Geller, R.J.; Liu, M. Why earthquake hazard maps often fail and what to do about it. Tectonophysics 2012, 562-563, 1–25. [Google Scholar] [CrossRef]
- Van Westen, C.J.; Castellanos, E.; Kuriakose, S.L. Spatial data for landslide susceptibility, hazard, and vulnerability assessment: An overview. Eng. Geol. 2008, 102, 112–131. [Google Scholar] [CrossRef]
- Guillard Gonçalves, C.; Zêzere, J.L.; Pereira, S.; Garcia, R.A.C. Assessment of physical vulnerability of buildings and analysis of landslide risk at the municipal scale: Application to the Loures municipality, Portugal. Nat. Hazards Earth Syst. Sci. 2016, 16, 311–331. [Google Scholar] [CrossRef]
- UNDRR. Sendai Framework for Disaster Risk Reduction 2015–2030; United Nations Office for Disaster Risk Reduction (UNDRR): Geneva, Switzerland, 2015. [Google Scholar]
- Lee, J.Y.; Kwon, K.D.; Raza, M. Current water uses, related risks, and management options for Seoul megacity, Korea. Environ. Earth Sci. 2018, 77, 14. [Google Scholar] [CrossRef]
- Kim, H.J.; Lee, J.Y.; Jeon, W.H.; Lee, K.K. Chapter 18—Groundwater Environment in Seoul, Republic of Korea. In Groundwater Environment in Asian Cities, Shrestha, S., Pandey, V.P., Shivakoti, B.R., Thatikonda, S., Eds.; Butterworth-Heinemann: London, UK, 2016; pp. 413–449. [Google Scholar]
- Choi, W.; Park, J.W.; Kim, J. Loss assessment of building and contents damage from the potential earthquake risk in Seoul, South Korea. Nat. Hazards Earth Syst. Sci. 2019, 19, 985–997. [Google Scholar] [CrossRef]
- Jeong, S.K.; Ban, Y.U. The spatial configurations in South Korean apartments built between 1972 and 2000. Habitat Int. 2014, 42, 90–102. [Google Scholar] [CrossRef]
- Gelézeau, V. Changing Socio-Economic Environments, Housing Culture and New Urban Segregation in Seoul. Eur. J. East Asian Stud. 2008, 7, 295–321. [Google Scholar] [CrossRef]
- Pittore, M.; Haas, M.; Silva, V. Variable resolution probabilistic modeling of residential exposure and vulnerability for risk applications. Earthq. Spectra 2020, 36, 321–344. [Google Scholar] [CrossRef]
- IPCC. Summary for Policymakers. In Managing the Risks of Extreme Events and Disasters to Advance Climate Change Adaptation. A Special Report of Working Groups I and II of the Intergovernmental Panel on Climate Change; IPCC: Geneva, Switzerland, 2012; pp. 1–3. [Google Scholar]
- MOLIT. V-world. Available online: https://www.vworld.kr (accessed on 15 December 2024).
- SMG. Seoul Open Data Plaza. Available online: https://data.seoul.go.kr/ (accessed on 15 December 2024).
- KDS 17 10 00:2018; General Seismic Design. MOLIT: Sejong, Republic of Korea, 2018.
- FEMA. NEHRP Recommended Seismic Provisions for New Buildings and Other Structures; Rep. No. P-1050-1; Building Seismic Safety Council, National Institute of Building Sciences: Washington, DC, USA, 2015. [Google Scholar]
- Government of the Republic of Korea. Enforcement Decree of the Framework Act on Disaster and Safety Management. Available online: https://www.law.go.kr/법령/재난및안전관리기본법시행령 (accessed on 15 December 2024).
- Lori, P. Children and Disasters: Understanding Vulnerability, Developing Capacities, and Promoting Resilience—An Introduction. Child. Youth Environ. 2008, 18, 1–29. [Google Scholar] [CrossRef]
- Saaty, T.L.; Kearns, K.P. Chapter 3—The Analytic Hierarchy Process. In Analytical Planning; Saaty, T.L., Kearns, K.P., Eds.; Pergamon: Oxford, UK, 1985; pp. 19–62. [Google Scholar]
- Rehman, A.; Song, J.; Haq, F.; Ahamad, M.I.; Sajid, M.; Zahid, Z. Geo-physical hazards microzonation and suitable site selection through multicriteria analysis using geographical information system. Appl. Geogr. 2021, 135, 102550. [Google Scholar] [CrossRef]
- Sun, C.G.; Kim, H.S. GIS-based regional assessment of seismic site effects considering the spatial uncertainty of site-specific geotechnical characteristics in coastal and inland urban areas. Geomat. Nat. Hazards Risk 2017, 8, 1592–1621. [Google Scholar] [CrossRef]
Disclaimer/Publisher’s Note: The statements, opinions and data contained in all publications are solely those of the individual author(s) and contributor(s) and not of MDPI and/or the editor(s). MDPI and/or the editor(s) disclaim responsibility for any injury to people or property resulting from any ideas, methods, instructions or products referred to in the content. |
© 2025 by the authors. Licensee MDPI, Basel, Switzerland. This article is an open access article distributed under the terms and conditions of the Creative Commons Attribution (CC BY) license (https://creativecommons.org/licenses/by/4.0/).