Featured Application
The specific application of this research is on DEM modelling of phenomena that occur during the handling of bulk solids in industrial processes.
Abstract
Granular materials usually require the design of specialised equipment for their processing and transport. Nowadays, equipment design increasingly relies on modelling techniques to support decision-making during the design process. The Discrete Element Method (DEM) is a numerical technique that enables the prediction of forces and displacements acting on individual particles. The design of ship loaders, dumpers, screw conveyors, conveyor belts, moving floors, bucket elevators, truck feeders, hoppers, and silos can all benefit from DEM-based predictions of particle behaviour. To develop DEM models able to accurately predict the particle behaviour, it is essential to characterise the material by determining its physical and mechanical properties. Key parameters include particle density, elastic modulus, Poisson’s ratio, particle-to-wall friction, and particle-to-particle friction. In this research, a methodology is proposed for determining the particle-to-particle friction coefficient. For this purpose, a test apparatus was designed and constructed to perform direct measurements of sliding angles. The proposed method yielded an average particle-to-particle friction coefficient of μ = 0.62, based on twelve independent sliding-angle tests. The measurements showed an overall relative standard deviation of 3.4%, indicating good repeatability and demonstrating that the developed apparatus provides reliable and consistent friction values for granular particles. The primary aim of the study was to validate the test method. Hand-made clay samples were produced, arranging the particles in different configurations and placing them in various orientations on the apparatus. The results confirm that the proposed method is suitable for determining representative particle-scale friction parameters, offering a simple and repeatable approach that can support DEM calibration and enhance the predictive capability of granular flow simulations.
1. Introduction
Granular materials are involved in many industrial processes, particularly in the food and pharmaceutical fields. Understanding the behaviour of granular systems is essential for designing safe and efficient equipment for their storage and handling. Since the behaviour of such systems is difficult to describe analytically with precision, these studies often rely on semi-empirical mathematical models combined with laboratory-scale experiments [].
The Discrete Element Method (DEM) has become a widely used numerical approach to study the behaviour of granular materials and predict their mechanical response. The method is based on an explicit numerical procedure in which the interactions, particle-to-particle and particle-to-wall, are modelled contact-by-contact, monitoring the movement of each particle [].
DEM has been successfully applied to investigate pressure distributions in silos [,,], flow patterns [], segregation phenomena [,], and discharge rates [,], among others. Nevertheless, DEM models still require experimental validation to ensure their accuracy [].
The use of DEM has come with new challenges in the determination of the mechanical properties at the particle level. Sometimes the shape of the particle of the granular media is difficult to approximate, and sometimes the lack of accuracy in the determination of the mechanical properties is found. Accurate determination of the mechanical properties of particulate materials is crucial to predict their behaviour during various operations and industrial handling processes (e.g., transport, conveying, storage). Parameters such as those for the restitution coefficient, the density, the elasticity modulus, and the particle-to-particle friction and particle-to-wall friction coefficient are needed to model processes. Some standardised procedures can be found in the literature for the determination of some of them [,], others rely on commonly used but non-standardised methods, such as those for the restitution coefficient [].
This work focuses on determining the particle-to-particle friction coefficient, a key parameter governing bulk shear behaviour and energy dissipation in granular systems []. While the internal friction angle of granular materials can be measured using standardised apparatuses such as the triaxial cell, Casagrande shear box, Jenike shear tester, or Schulze ring shear tester, no standardised method currently exists for determining particle-to-particle friction coefficients [,]. For non-spherical particles, this coefficient is sometimes approximated by the bulk internal friction angle or obtained indirectly through DEM calibration against experimental results. However, these indirect approaches can introduce significant uncertainty. The lack of a standardised and reproducible laboratory procedures therefore represents a critical gap that motivates the development of the test method presented in this work.
In the case of the particle-to-wall friction, it is possible to find in the literature different methodologies for its evaluation, the most popular being based on a sliding test on an inclined table []. In this procedure, the germ-side surface of each grain is sanded to obtain a uniform height. Three grains are used and glued, horny endosperm-side up, on the horizontal base plate. The test plate is placed on top of the three grains, and the level is checked again to ensure that it is horizontal. The test consists of the gradual inclination of the base plate until relative sliding between the grains and the test plate occurs, measuring the inclination angle (ϕ). The friction coefficient (µ) can be determined from µ = tan ϕ. Another test methodology is named “pin-on-disk” [], commonly used for measuring the coefficient of kinetic friction of materials []. It comprises a horizontally oriented disc that rotates and a vertically oriented pin that can be lowered into contact with the disk. A controlled normal force is applied downwards to the pin during the measurement, and the disk is rotated at a controlled rate. The shear force acting on the pin is measured using strain gauges and used to determine the coefficient of friction for that specific combination of materials. In some cases, the particle-to-particle friction values have been considered equal to the friction of particle-to-wall []. Other times, they have been determined, as Coetzee et al. [] or Grima et al. [], after a calibration procedure. As an example, in Coetzee et al. [], the values of true density, the particle stiffness and the friction between particles (corn grains) were tuned using three different calibration experiments: filling of a cylindrical container, confined compression test and direct shear test.
Cavarretta et al. [] designed a micro-contact apparatus enabling direct measurement of friction between individual sand particles under controlled normal loading. Their setup allows high-resolution mechanical control. Further work using the same principle has been developed by Senetakis et al. [] and Li et al. [].
More advanced techniques, such as Atomic Force Microscopy (AFM) allow the measurement of inter-particle friction for very small particles, from powder-scale to fine sands. Jones [] reported AFM-based friction measurements on artificial particles with diameters between 0.04 and 0.20 mm. However, its applicability is generally limited to sub-millimetre particles, making it unsuitable for the larger granular systems typically encountered in bulk solids handling.
This research proposes a new apparatus and testing method to directly determine the particle-to-particle friction coefficient. The design of the test apparatus, the preparation of samples, the test procedure and validation of the method are presented and discussed.
2. Materials and Methods
2.1. Preparation of Samples
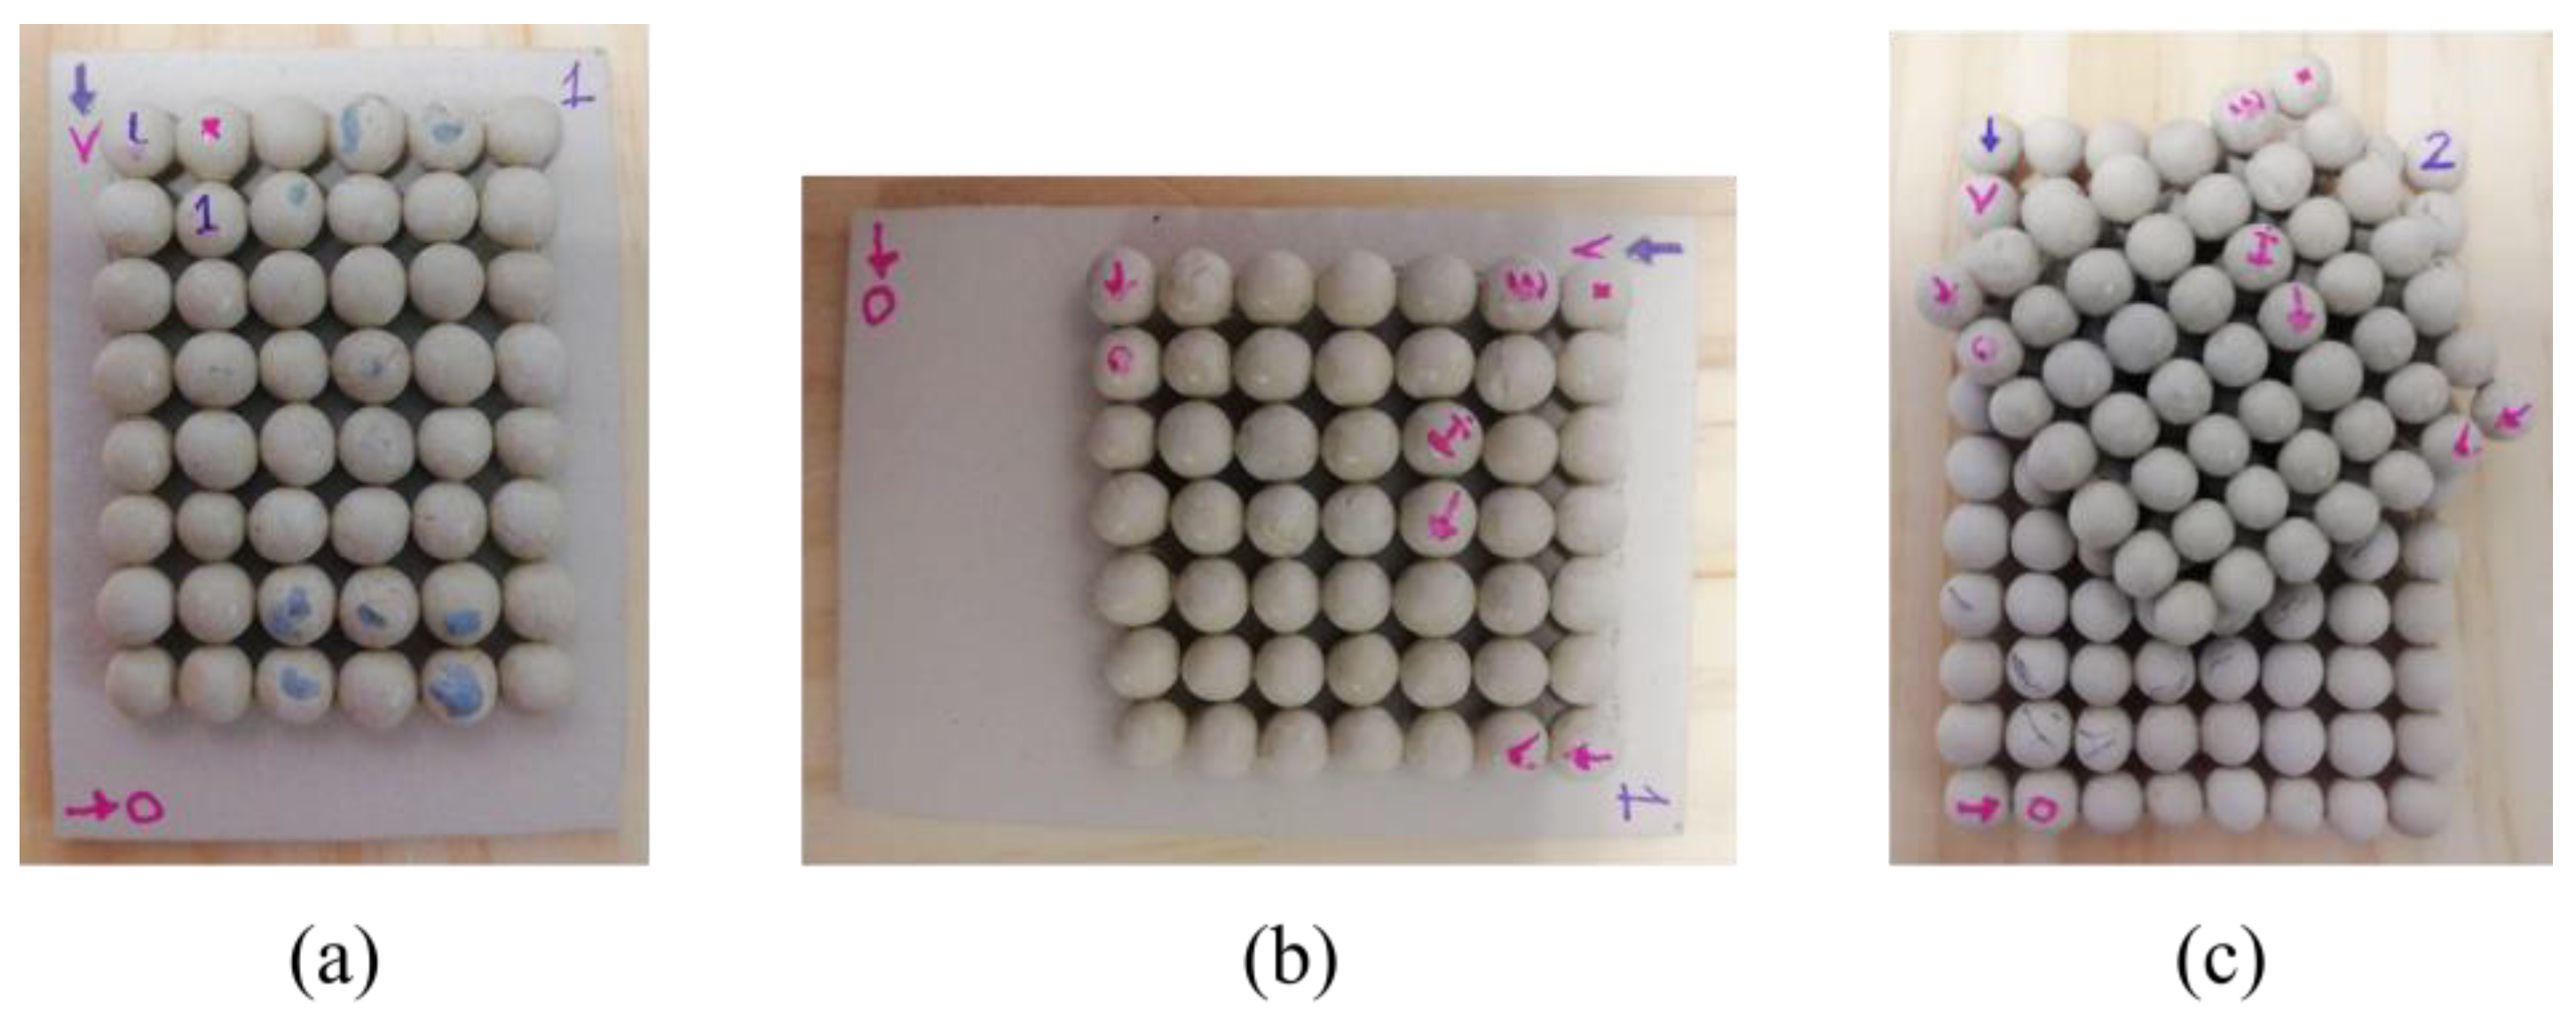
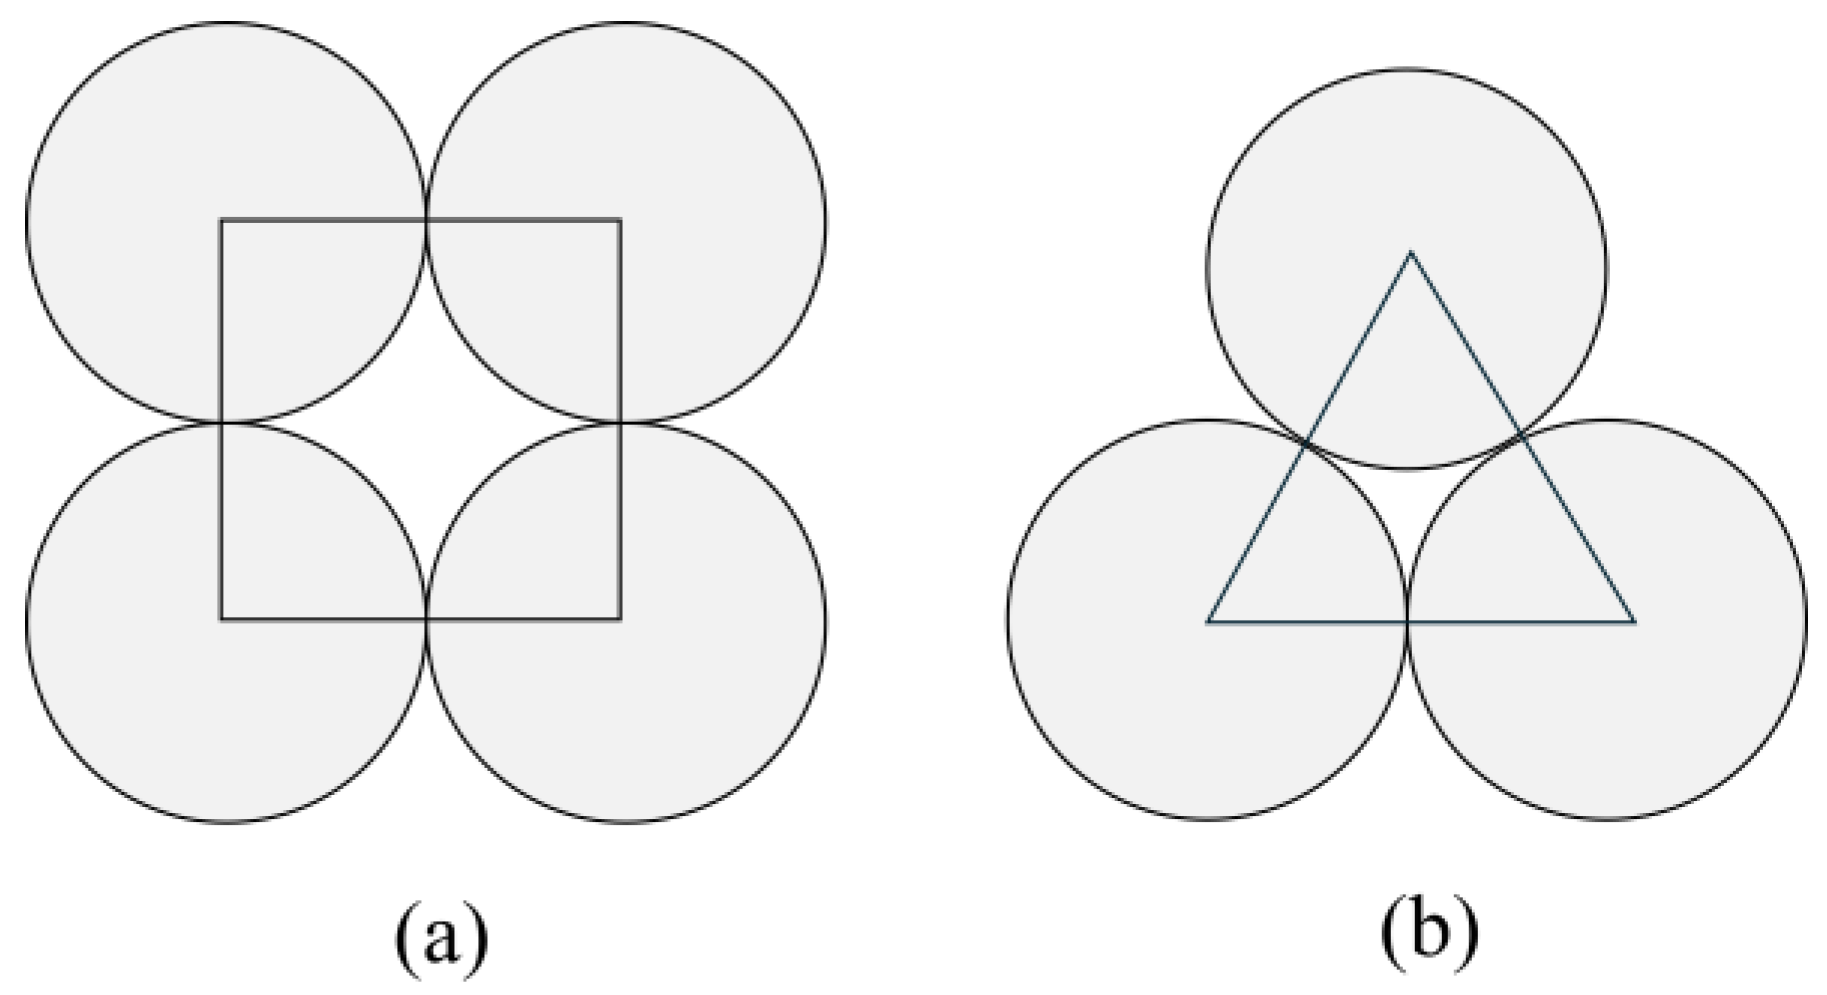
Initial samples were produced using natural air-drying clay, SIO-2 PLUS®. Hand-shaped spherical particles with an average diameter of 6 mm and flat plates were prepared. A smooth surface of these particles was achieved. After the shaping process, the particles were left to dry for 24 h before being placed on a flat surface and bound using adhesive. Two geometric configurations were adopted: one with the centres of the spherical particles arranged in a square grid and the other in a triangular distribution (Figure 1).
Figure 1.
Particle configurations for the preparation of samples: (a) square and (b) triangular.
Plates were produced by placing clay between two metal sheets to ensure flatness and two paper sheets to prevent sticking. Four bolts served as a top to maintain uniform thickness during pressing. Each clay plate was cut into a rectangular shape (7 cm × 5 cm) and re-pressed to ensure homogeneity. After removal from the press, the clay plates were kept between metal plates during a 72 h drying period to minimise imperfections (Figure 2).
Figure 2.
Steps for the preparation of a clay plate.
Clay was used, because it was assumed that different particles and plates could be produced with the same surface friction, so that differences in measured friction could be attributed to natural scatter or sensitivity to test set-up.
2.2. Nomenclature
All samples were rectangular; therefore, specifying their orientation during testing was essential, particularly in relation to the sliding direction.
Each test was identified using the format *–⁑–⁂, where * is the name of the bottom plate sample (Table 1), ⁑ is the name of the top plate sample (Table 1), and ⁂ indicates the orientation of the two samples: V (longest side parallel to sliding direction), I (longest side inclined 45°) and O (longest side perpendicular to V).
Table 1.
Test samples.
For example, in Figure 3a, PL-S1SQT-VV means that PL is at the bottom, S1SQT is on top, which is the first sample produced with the centres of the spherical particles arranged according to a square, and both are oriented with their longer sides in the direction of the displacement (VV). Figure 3b,c show other examples. One flat plate (PL) and seven plates of spherical particles of clay (S1SQT, S2SQB, S3SQT, S4TT, S5TT, S6TB, S7TT) were produced—see Table 1.
Figure 3.
Three examples of test samples. (a) PL-S1SQT-VV; (b) PL-S3SQT-OV; (c) S2SQB-S3SQT-VI.
2.3. Test Apparatus
2.3.1. Design Requirements
The apparatus was specifically designed to measure the coefficients of friction between particles of the same material by means of a controlled inclined plane. From the outset, several design requirements were established to guarantee measurement reliability, reproducibility, and ease of operation. The frame had to be rigid and stable in order to withstand repeated testing without deformation. The inclination system needed to operate smoothly, with sufficient angular resolution (±0.2°) and a constant inclination rate that would prevent sudden accelerations capable of altering the onset of sliding. In addition, the ramp control had to be automated to minimise operator variability, while the entire structure was required to maintain low vibration levels during actuation so as not to perturb particle movement. A further requirement was the integration of a data acquisition system capable of recording ramp inclination and vibration in real time, combined with a user-friendly interface that would allow straightforward calibration, operation, and monitoring.
To fulfil these specifications, the structure was constructed from 20 mm thick wooden panels joined with metallic L-shaped brackets and screws, providing rigidity and dimensional stability. A movable ramp was mounted on this frame, with a stopper placed at its lower edge to prevent excessive displacement or detachment of particles during the tests (Figure 4).
Figure 4.
Different views of the experimental apparatus, basically a rigid frame supporting a movable ramp.
The ramp was inclined automatically by means of a piston driven by an Eco-Worthy 100 mm 12 V linear electric actuator (Eco-Worthy Clean Energy, USA, Inc., 1226 North King St, No. 932, Wilmington, DE 19801, USA). The actuator was operated using a UEETEK 1203BB 12 V, 3 A, 80 W DC motor speed controller (PWM) with adjustable and reversible motor driver switch (Shenzhen Guanghengda Technology Co., Ltd., Longhua District, Shenzhen 518109, China). This configuration enabled smooth and uniform inclination of the ramp at a controlled rate of 1.2°/s, which was maintained constant for all experiments. Vibrations induced by the actuator were measured and remained below 0.004 mm, confirming the mechanical stability of the setup.
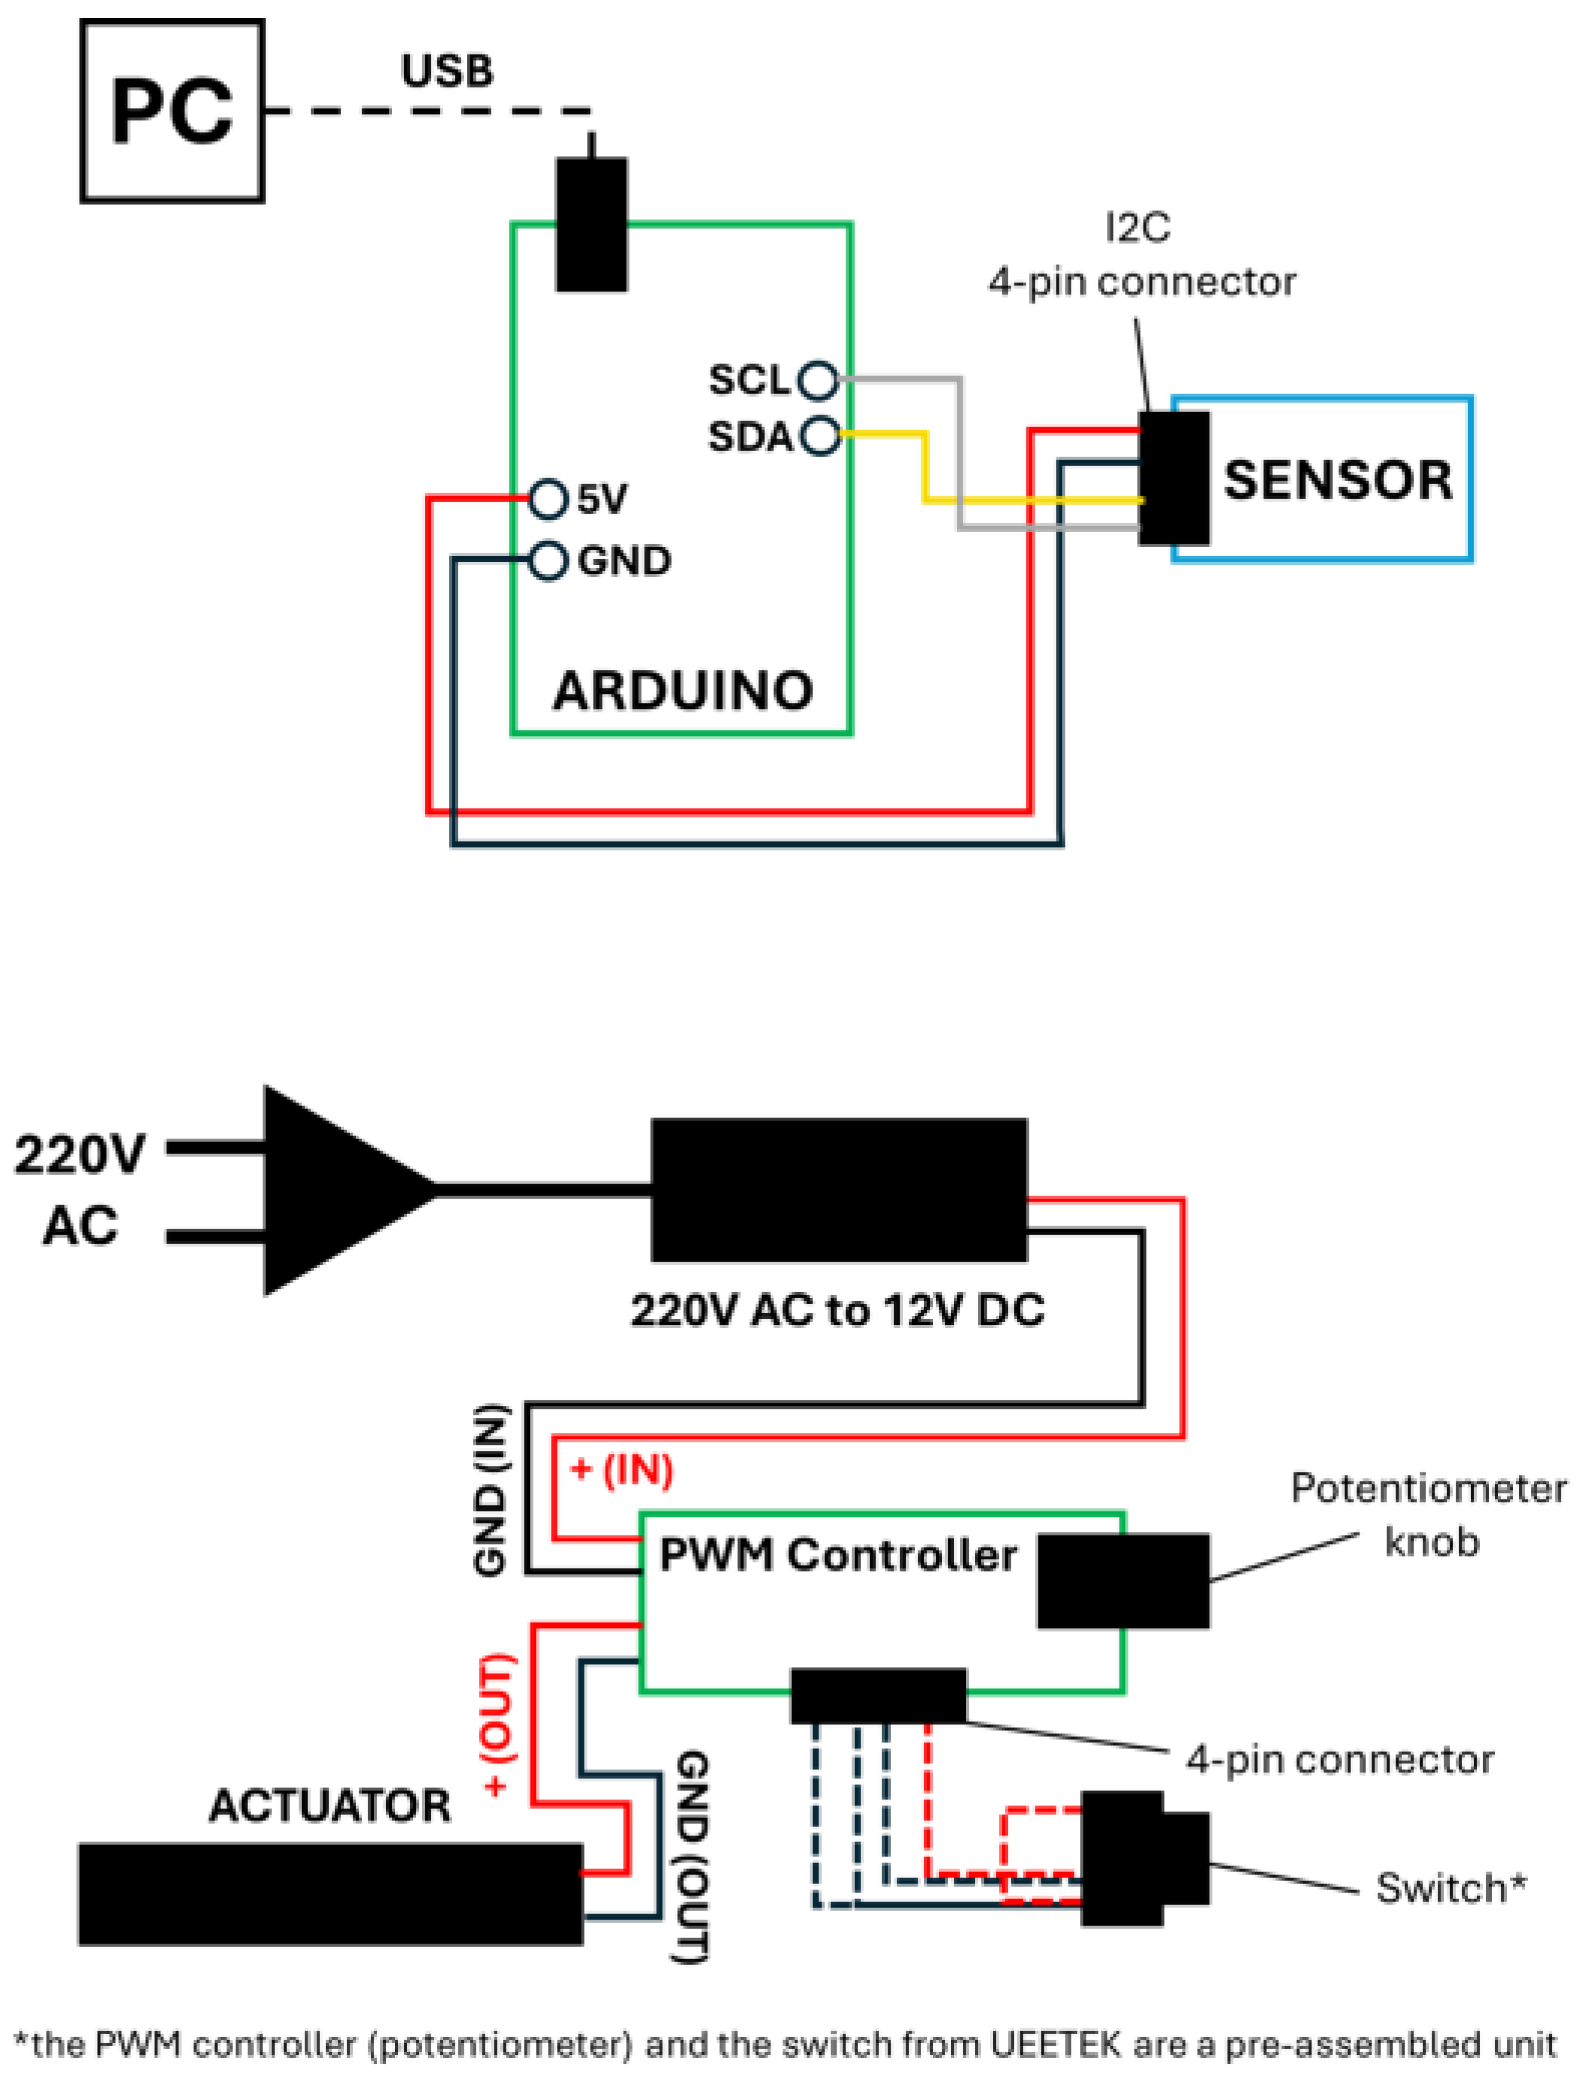
The measurement system was based on an Arduino UNO microcontroller (Via Andrea Appiani 25, 20900 Monza (MB), Italy) programmed to process sensor data and transfer it to a PC. For angle detection, a GROVE IMU 9DOF V2.0 sensor (Seeed Studio. 9F, Building G3, TCL International E City, ZhongShanyuan Road, Nanshan District, Shenzhen 518000, Guangdong Province, China) (integrating a three-axis accelerometer, gyroscope, and magnetometer) was connected to the Arduino through an I2C interface (GND, 5 V, SCL, SDA). The Arduino board was powered and linked to the PC via USB connection, while the actuator received energy from a dedicated 12 V DC power supply controlled through the potentiometer. Jumper wires were used to establish stable connections between the microcontroller and the IMU.
Prior to each experimental run, the IMU sensor underwent automatic calibration through the LabVIEW acquisition interface, which performs sensor axis alignment. This calibration cycle was executed at the start of every test to ensure consistent angular readings. The repeatability of the sensor response was verified by comparing idle-state measurements across tests, which exhibited negligible drift during operation.
Communication between the Arduino and the PC was managed through LabVIEW 2017 software (National Instruments Corporation, 11500 North Mopac Expressway, Building B, Austin, TX 78759-3504, USA), which also provided a graphical user interface for real-time monitoring and data logging. The LabVIEW program incorporated automatic calibration routines and displayed angular position, vibration signals, and sensor status indicators. This configuration allowed continuous tracking of the ramp inclination and immediate identification of the onset of particle sliding, reducing the risk of human error.
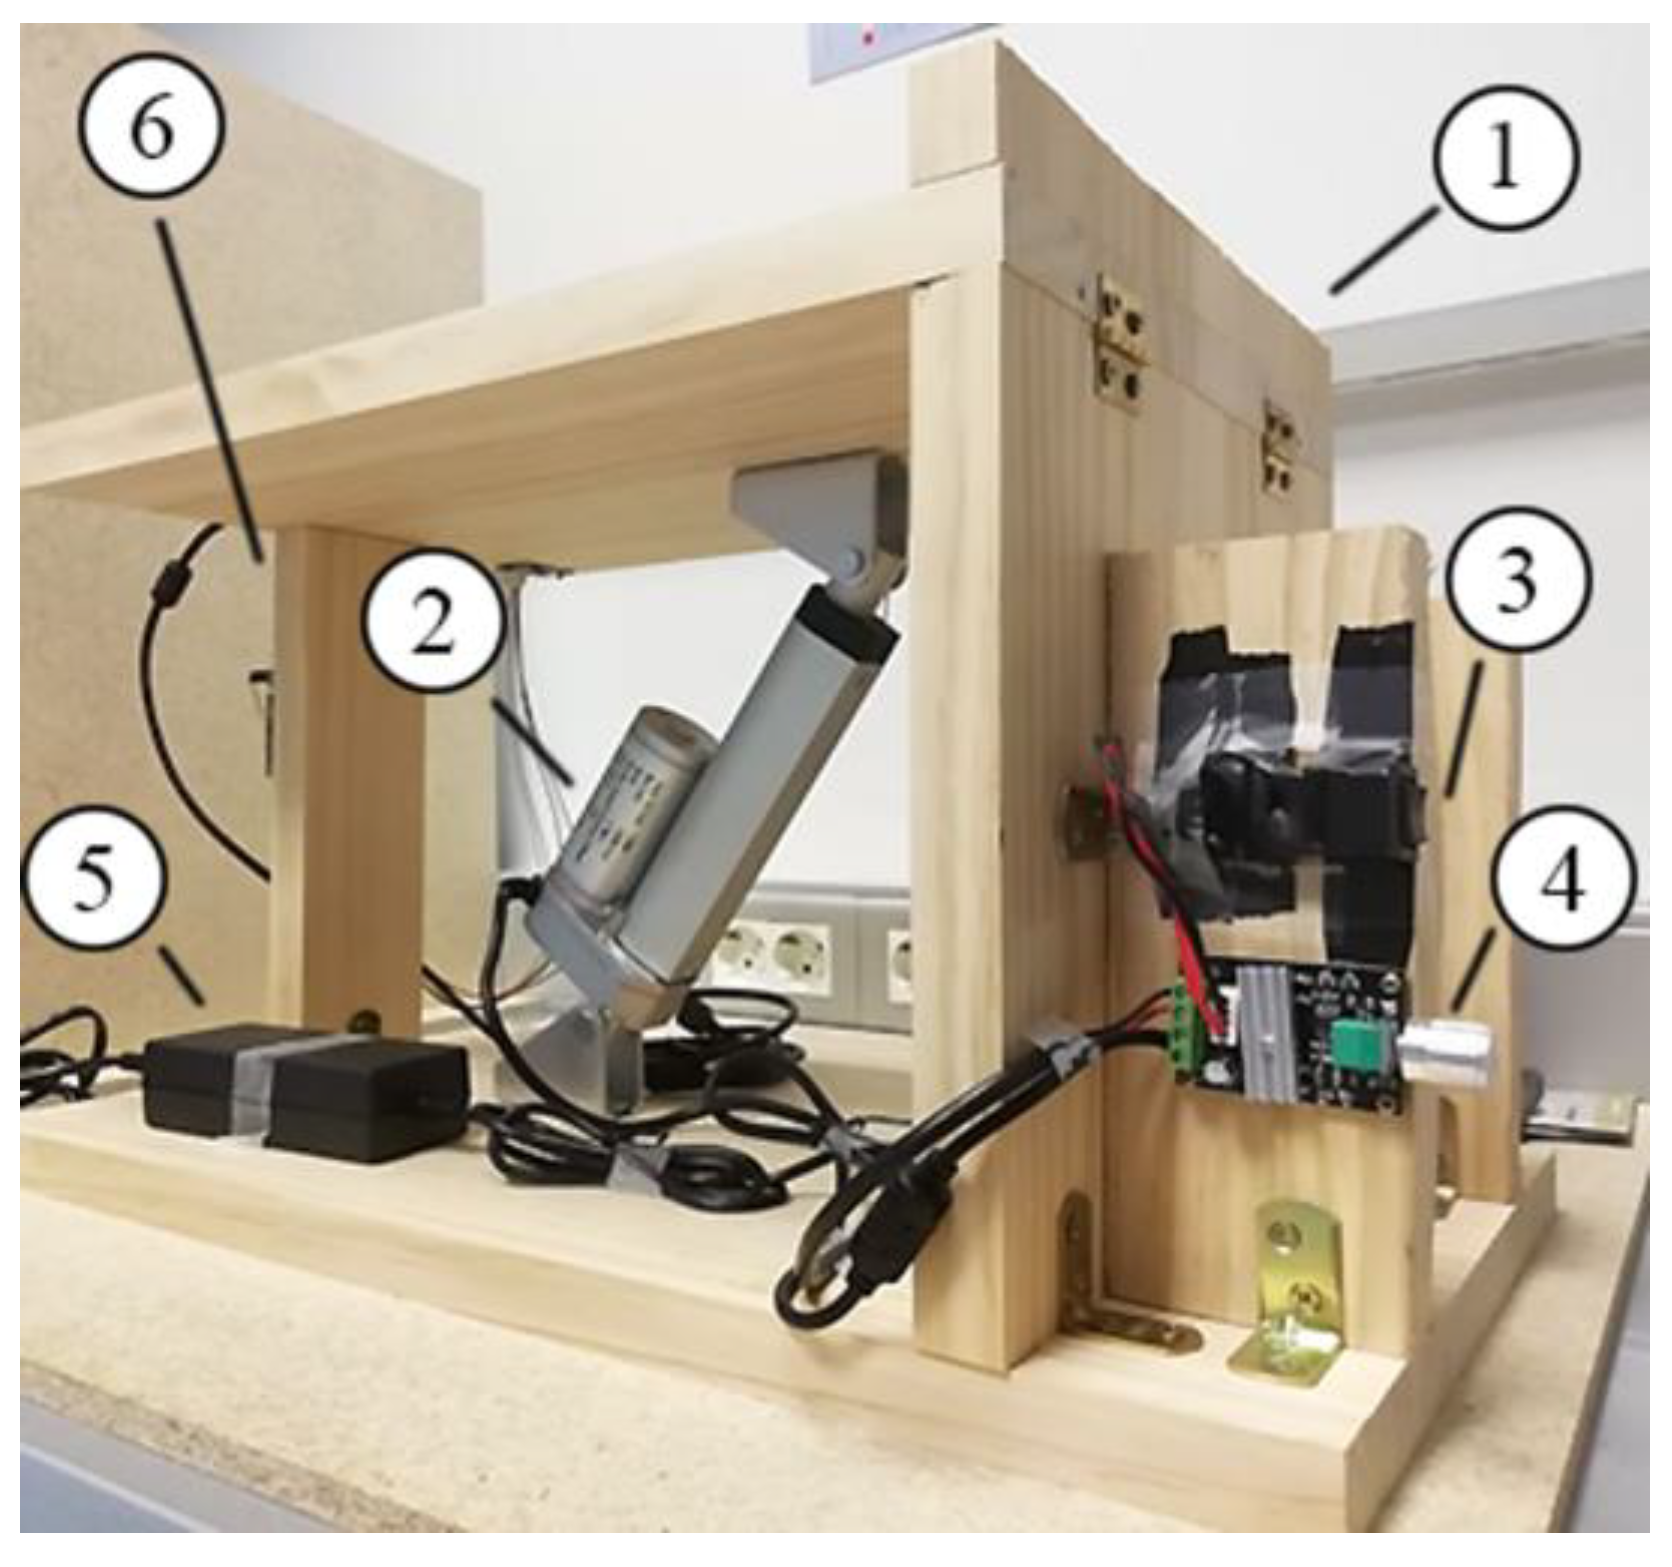
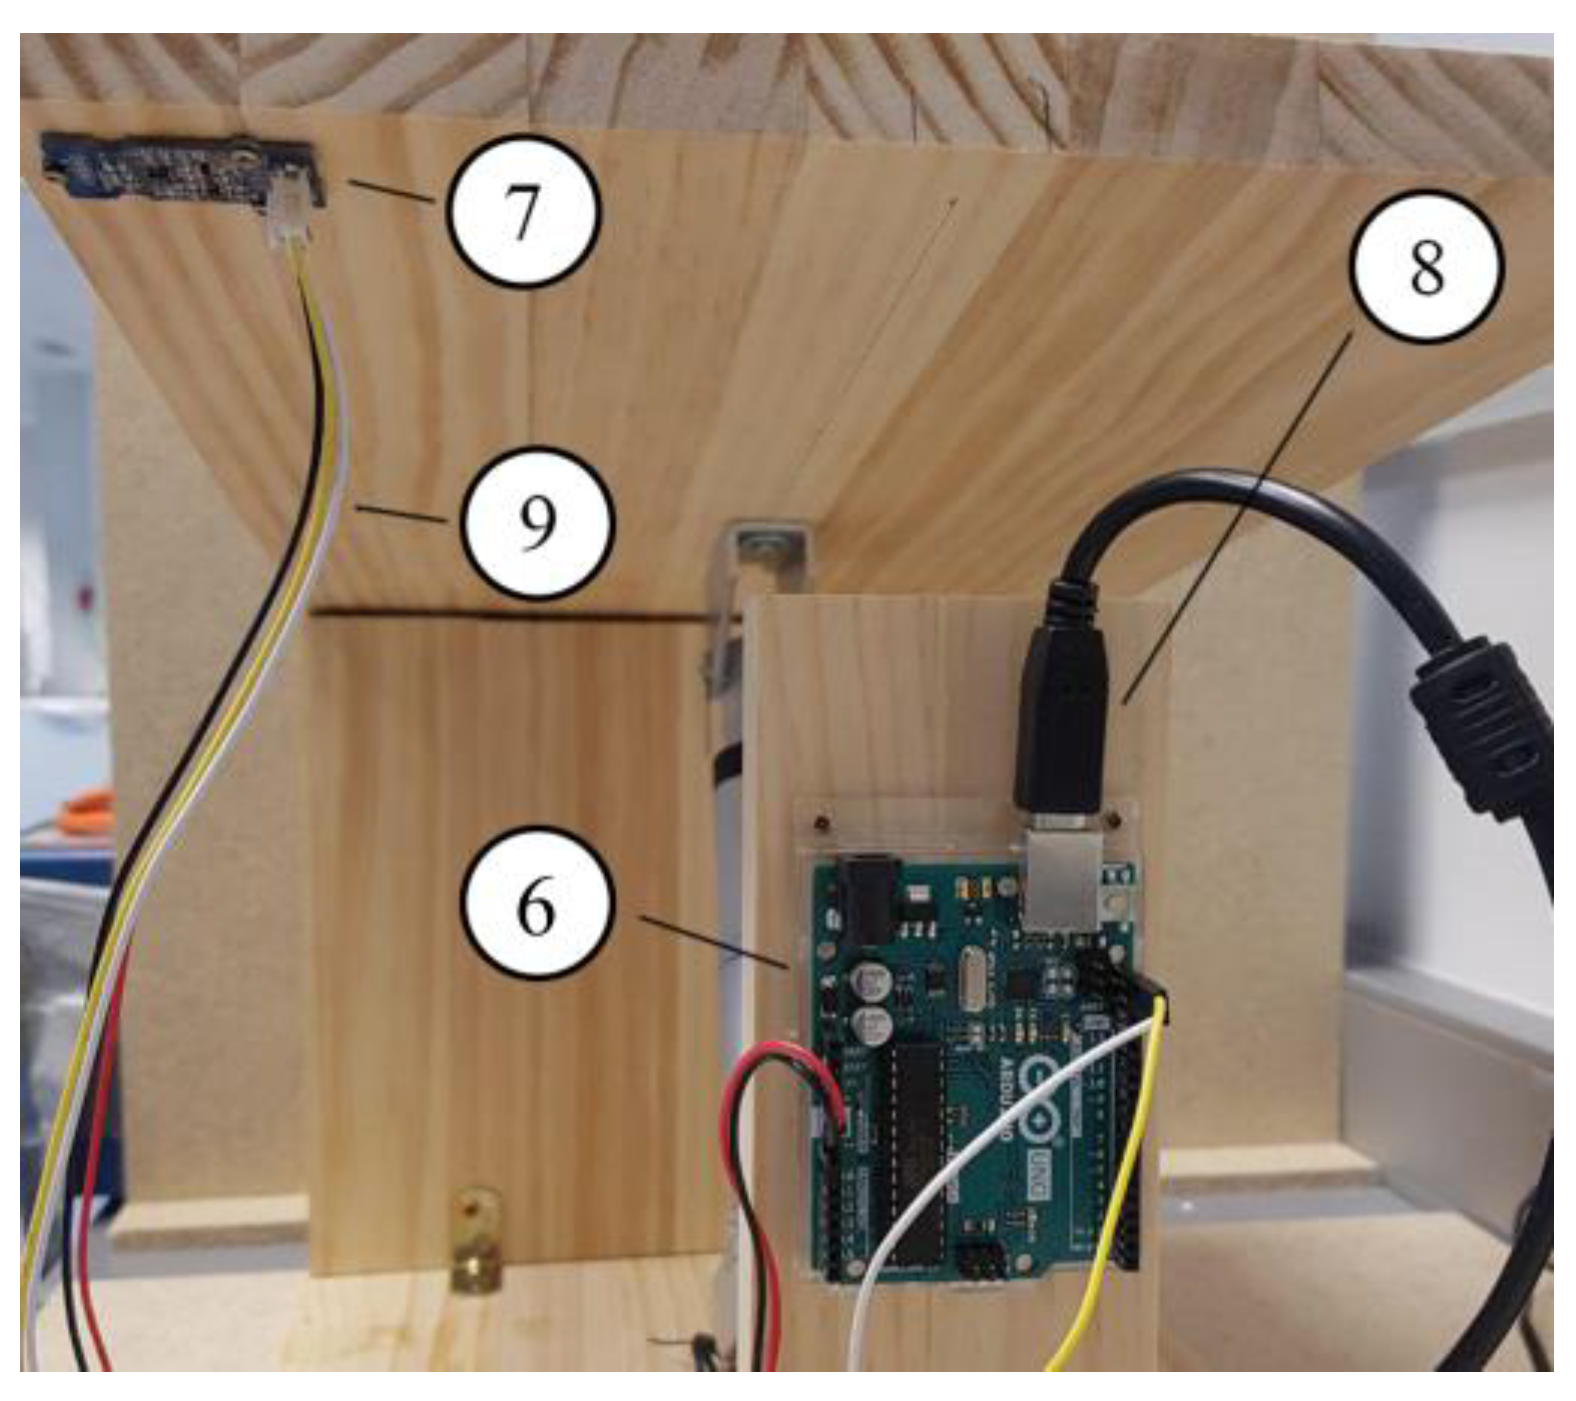
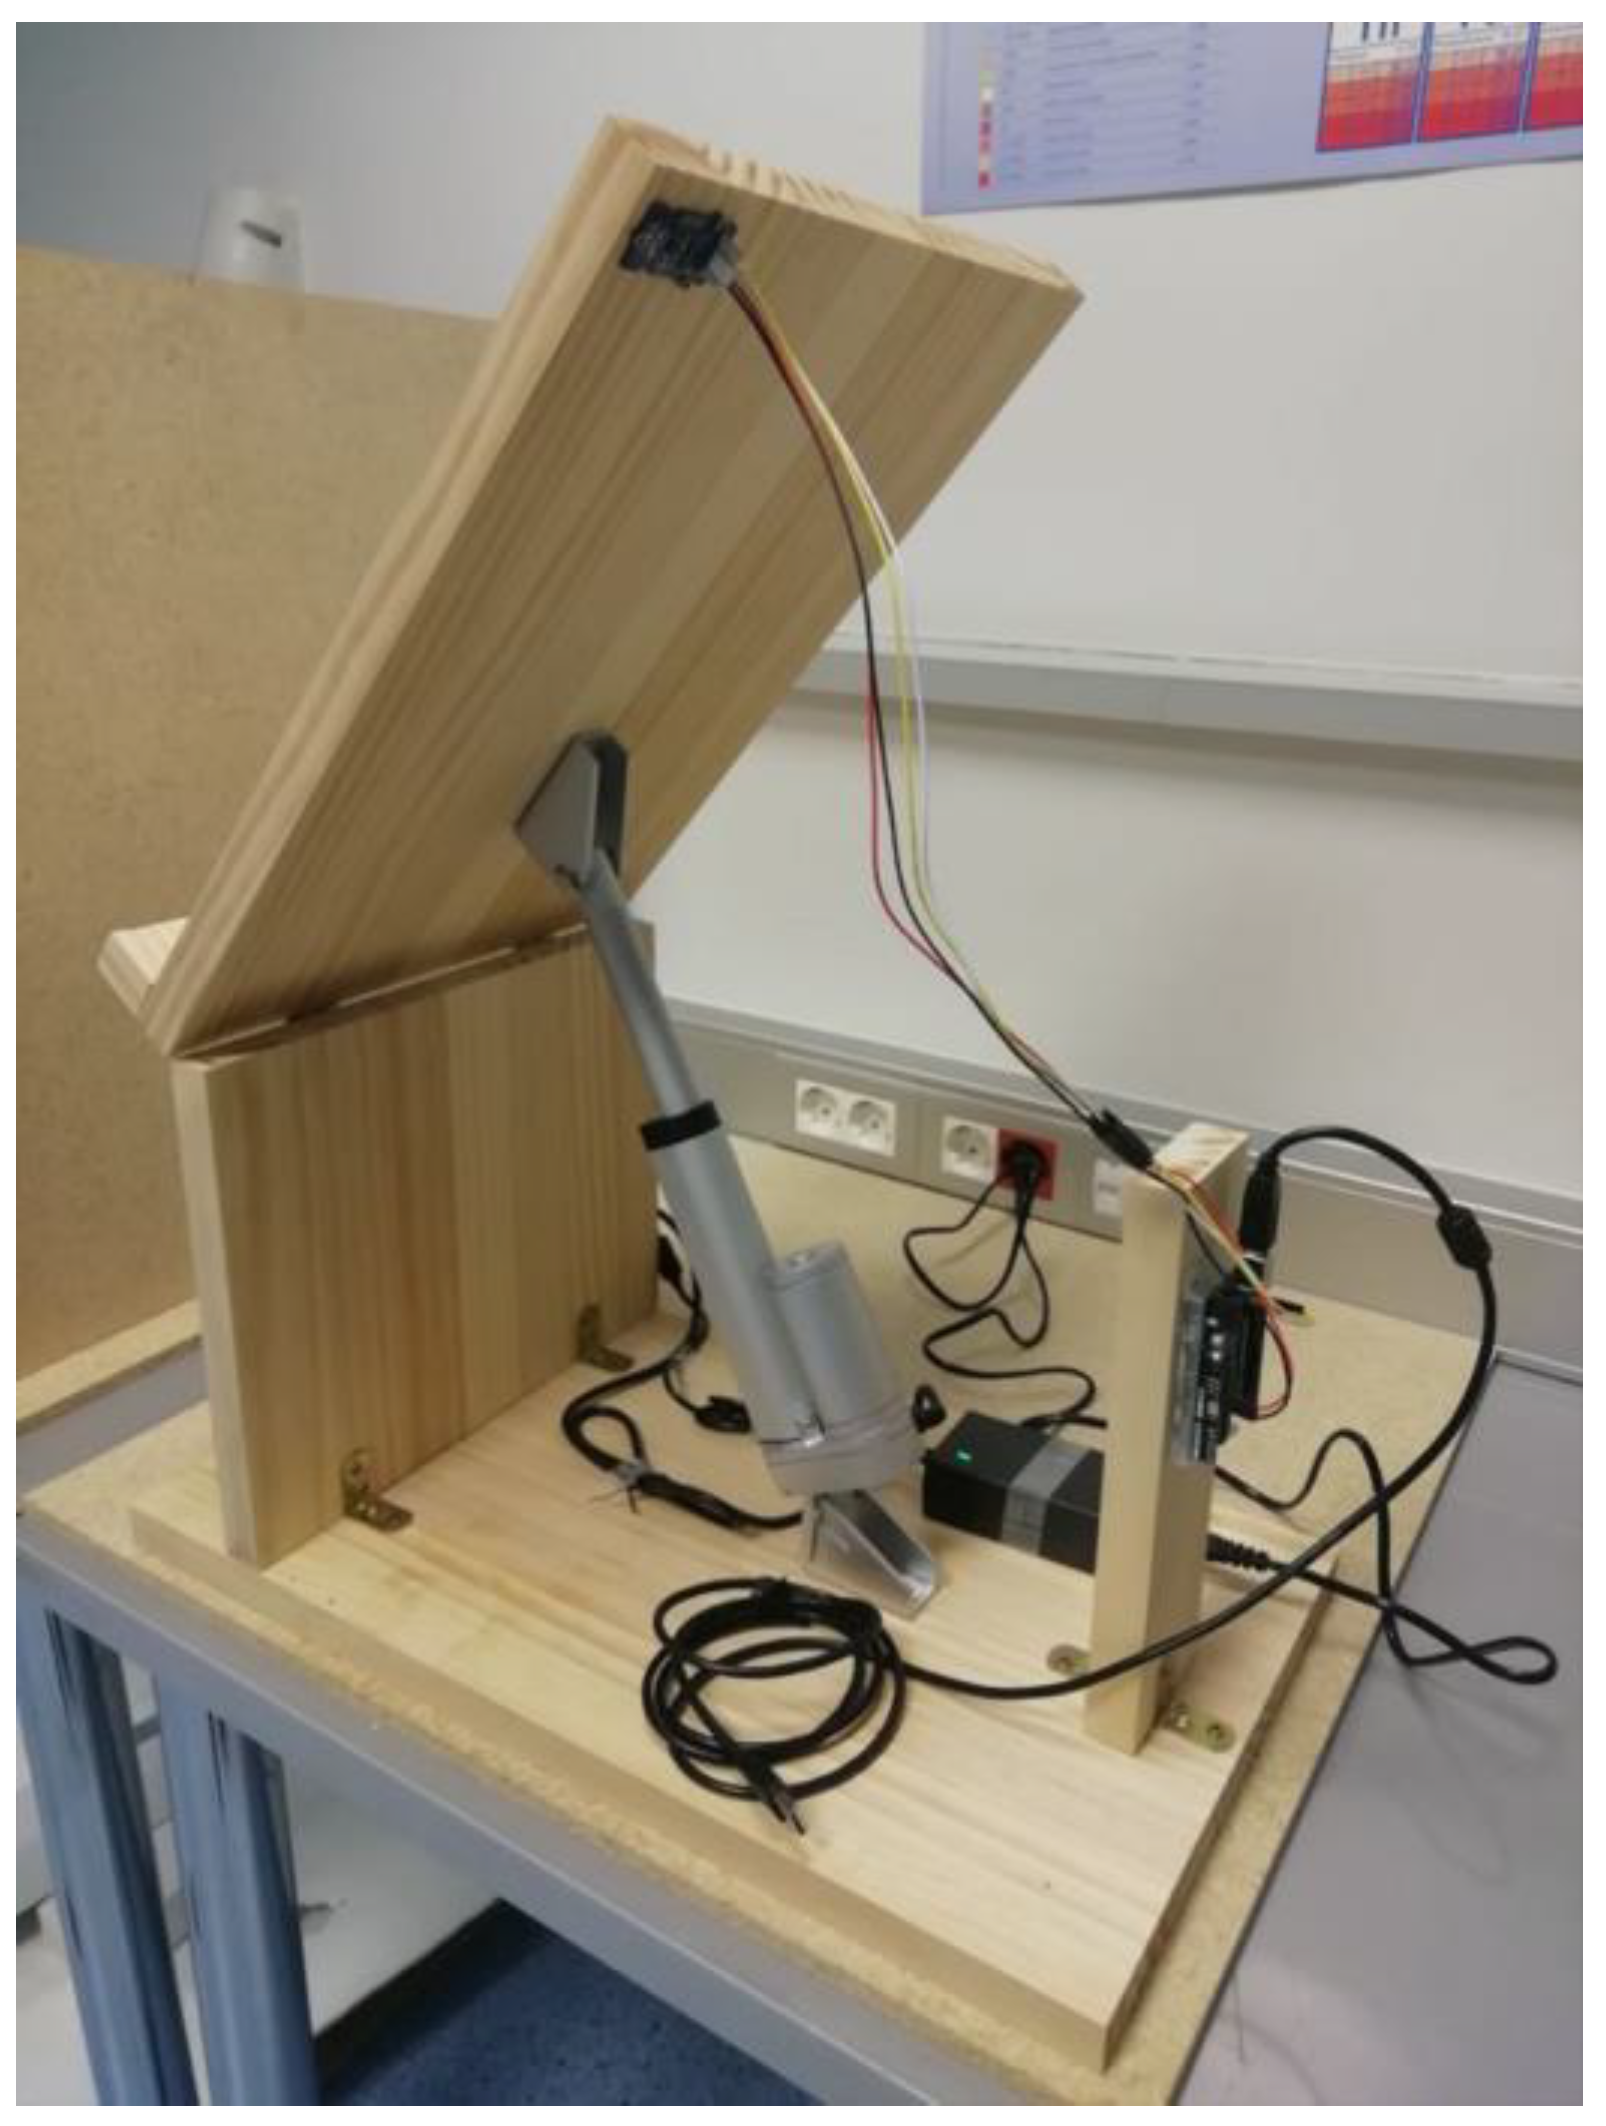
The final apparatus is shown in Figure 5, Figure 6 and Figure 7. With its rigid frame, automated and stable inclination mechanism, and integrated data acquisition system, the device fulfilled the original design requirements and ensured reproducible measurements of coefficients of friction.
Figure 5.
Experimental apparatus with the variable plane in its initial position. (1) Moveable ramp, (2) linear actuator ECO-WORTHY 100 mm 12 V, (3) reversible switch UEETEK, (4) potentiometer UEETEK, (5) power supply and (6) Arduino UNO board.
Figure 6.
Side view of the experimental apparatus. (6) Arduino UNO board, (7) GROVE IMU 9DOF v2.0 sensor, (8) USB cable and (9) jumper wires.
Figure 7.
Experimental apparatus with the support of the samples completely inclined (50°).
A schematic diagram of the electronic connections is shown in Figure 8.
Figure 8.
Schematic diagram of the electronic connections between the PC and Arduino (top) and between the piston and plate via the potentiometer (bottom).
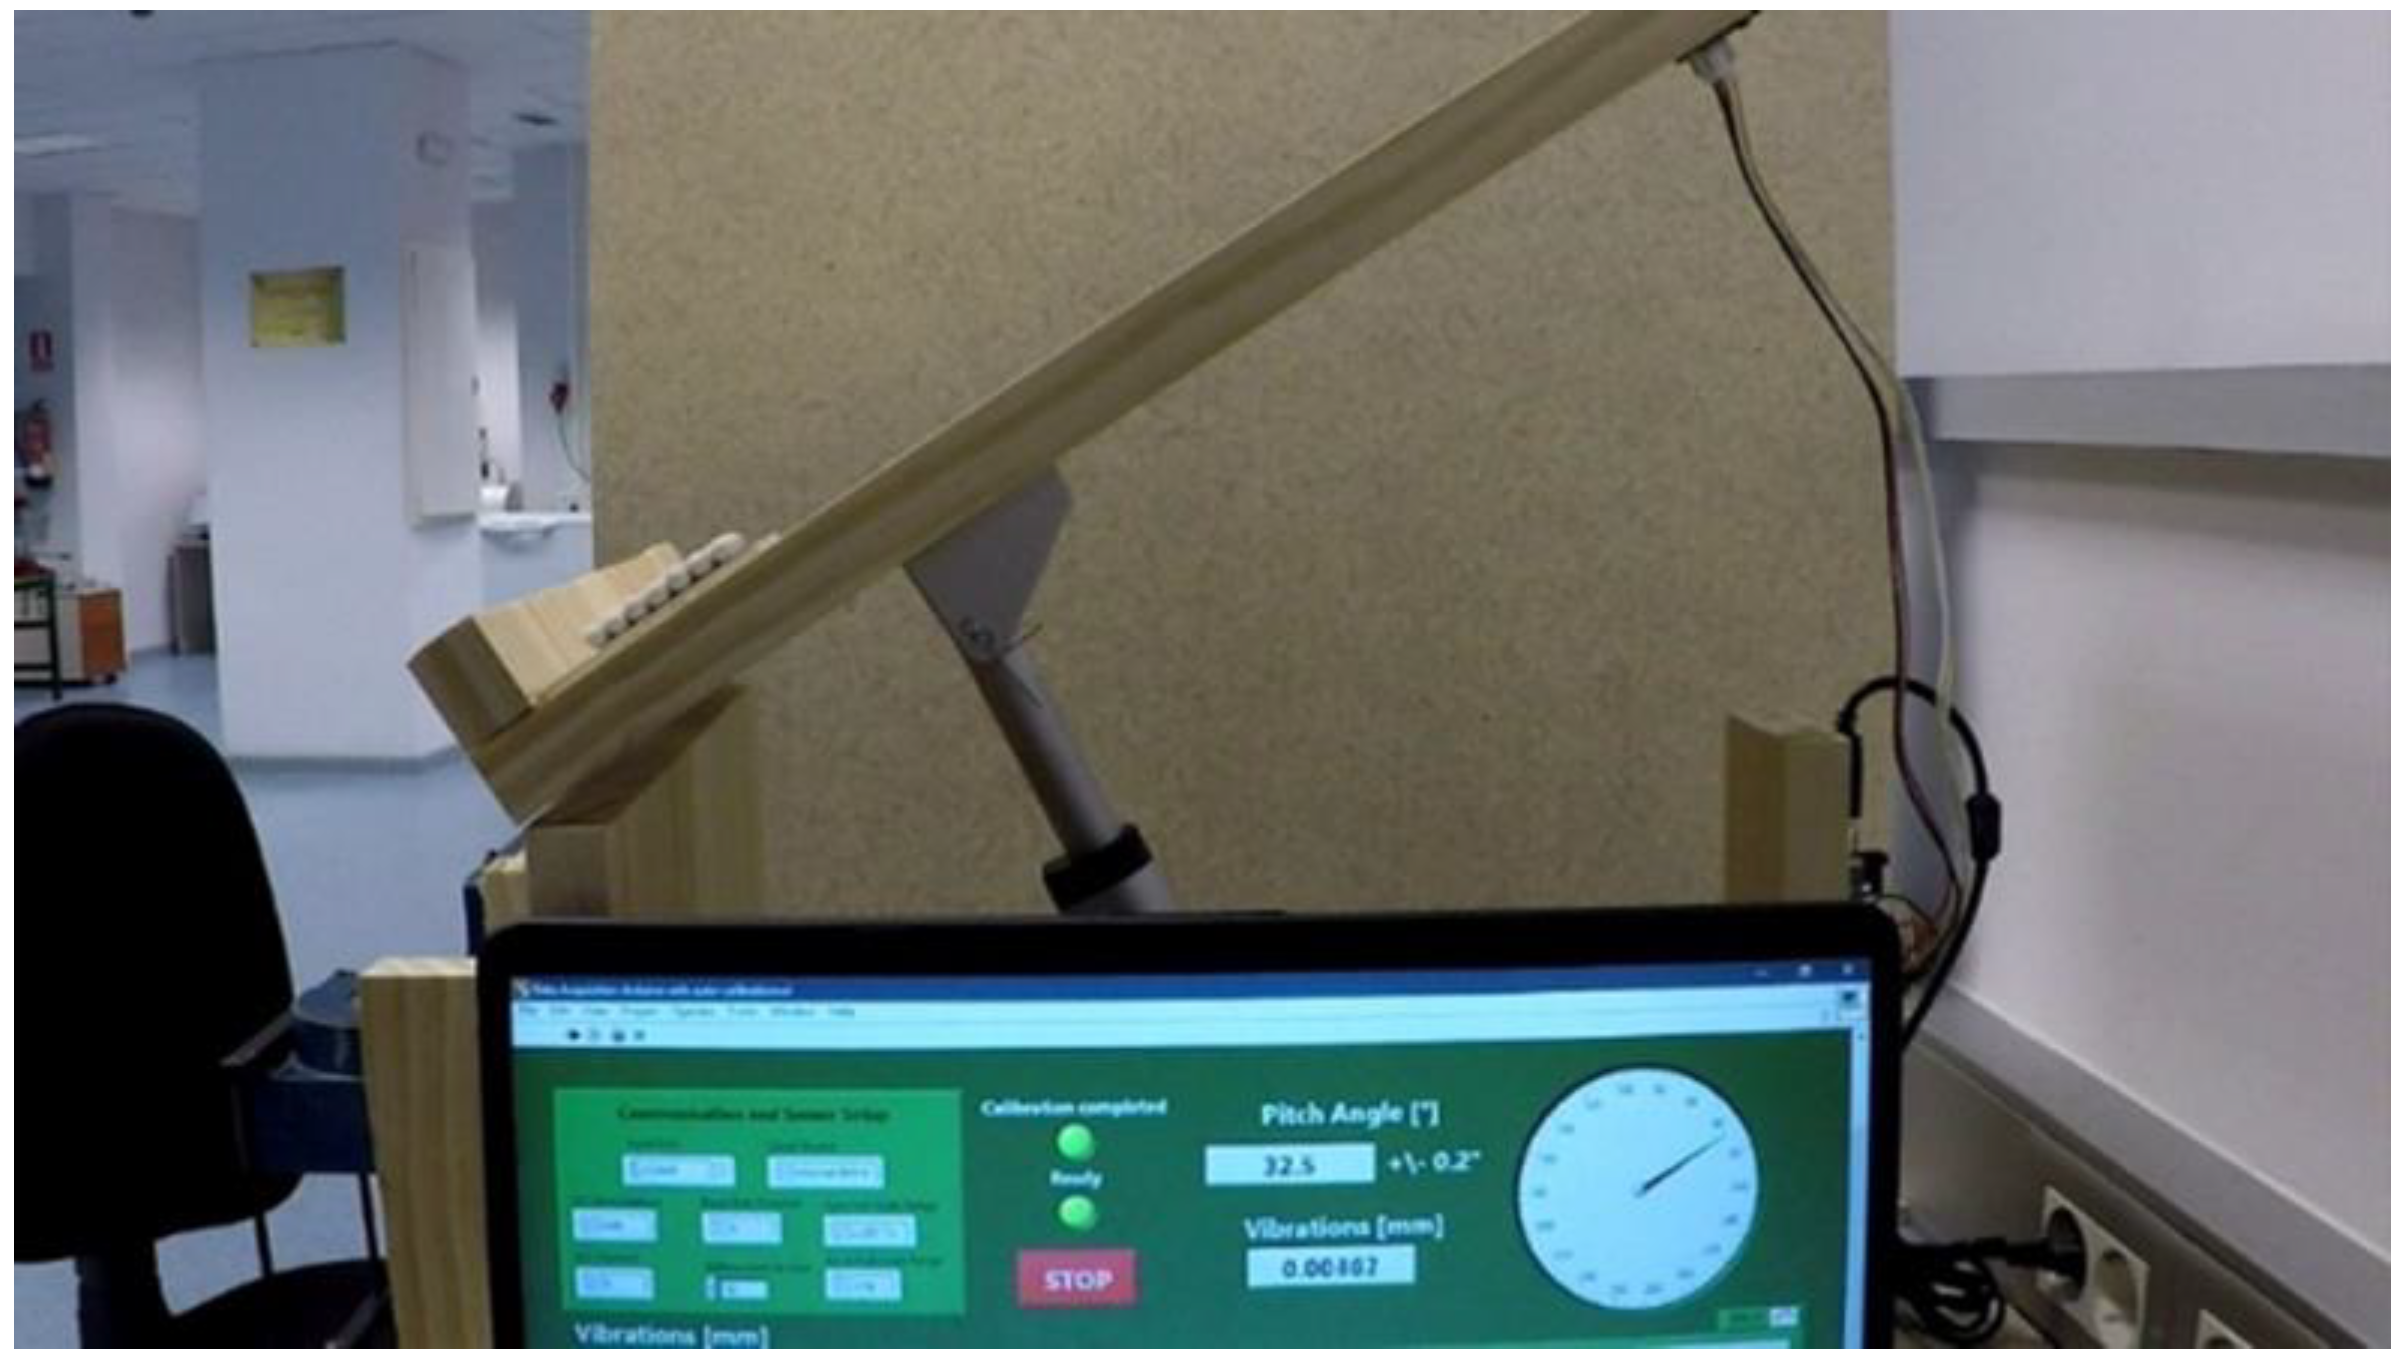
Each test was video recorded using a camera (Figure 9), which captured the onset of sliding and subsequent displacement. The recording settings were 720p resolution at 120 fps, with a narrow field of view.
Figure 9.
View of the test as seen from the camera.
2.3.2. Software
The software used was LabVIEW (National Instruments, Austin, TX, USA). LabVIEW is a system-design platform and development environment based on a visual programming language. The control program was implemented as a .VI file (Data Acquisition Arduino with Auto-Calibration.VI).
To enable communication between LabVIEW and the Arduino board, the following software packages were required: NI-VISA 17.0, freely available from National Instruments, VI Package Manager 2017, Arduino IDE 1.8.2, LINX 3.0.1.192, installed through the VI Package Manager 2017, and LabVIEW Interface for Arduino (LIFA) 2.2.0.79, also installed through the VI Package Manager 2017.
The LabVIEW code was preloaded into the Arduino board. Therefore, after completing the software installation and connecting the Arduino to the PC, the program was ready for its use. The block diagram of the code could be visualised by pressing CTRL + E from the front panel interface.
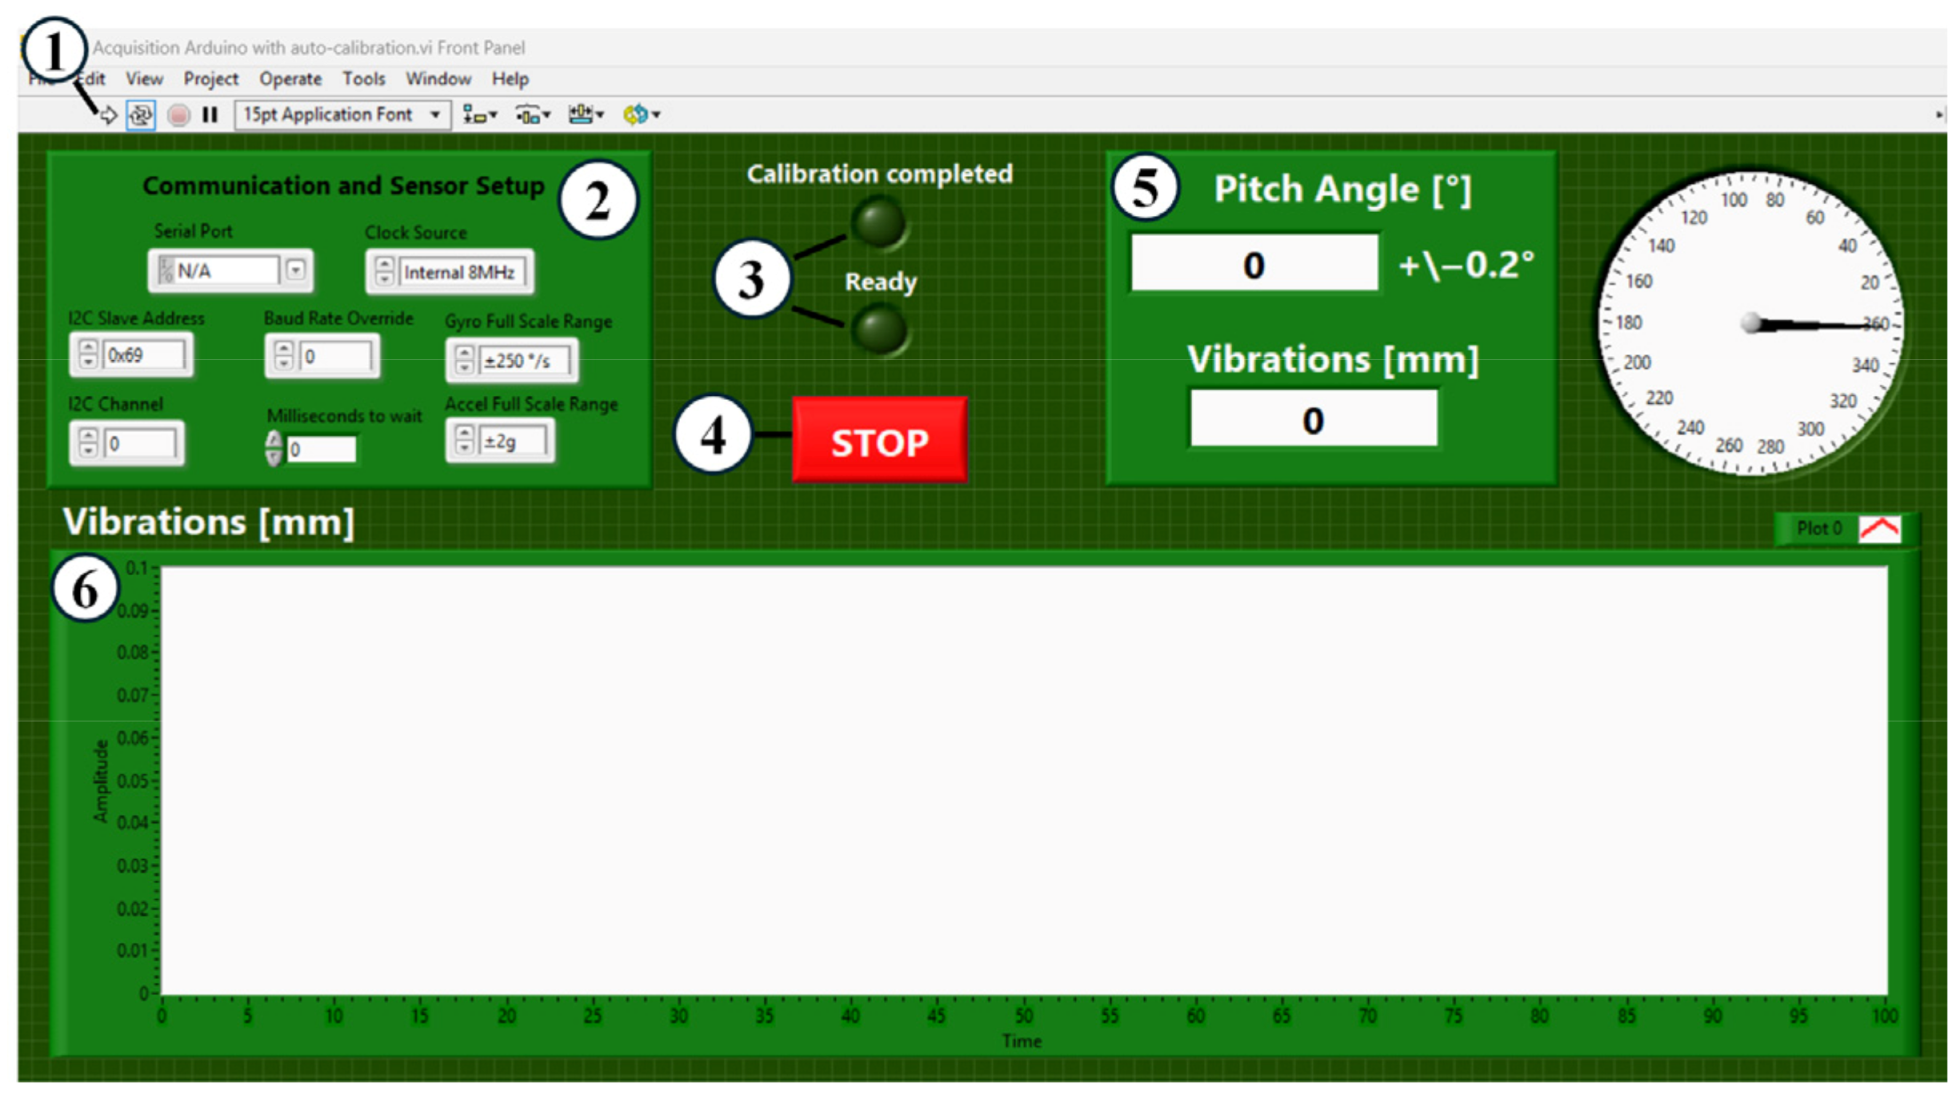
The front panel provided different controls and indicators that facilitated system operation. A run-button initiated communication with the Arduino and executed the LabVIEW commands. The communication and sensor setup included a drop-down menu to select the USB port connected to the Arduino, with the option to refresh the list if the port was not displayed; the correct port could be verified through the Windows Device Manager (Figure 10).
Figure 10.
Control panel. (1) Run-button, (2) communication and sensor setup, (3) “calibration completed” and “ready” lights, (4) stop button, (5) pitch angle and vibrations indicators and (6) waveform graph.
The clock source was always set to “Internal 8 MHz” for synchronisation, while the I2C slave address was fixed at 0 × 68, corresponding to the accelerometer. The I2C channel was set to 0 because only one sensor was used, and the baud rate override remained at 0 to maintain the Arduino default configuration. The interval between consecutive measurements, defined as milliseconds to wait, was set to 10 ms to ensure adequate processing time without reducing the acquisition rate below the ramp inclination rate.
The gyroscope full-scale range was not used, whereas the accelerometer full-scale range was fixed at ±2 g to provide optimal resolution. Status indicators labelled “Calibration Completed” and “Ready” confirmed proper initialisation and calibration before testing. A stop button was available to terminate program execution. Additional real-time outputs included indicators of pitch angle and vibration, as well as a waveform graph displaying the vibration signals continuously.
This configuration enabled reliable data acquisition and real-time monitoring of the ramp inclination and vibration during the tests.
2.4. Test Procedure
A total of eight samples (Table 1) were tested to determine particle-to-particle and particle-to-wall friction for clay. Since the friction coefficient is influenced by moisture content, moisture levels of the environment were measured prior to testing. Experiments were performed at the Laboratorio de Investigación de Materiales de Interés Tecnológico (LIMIT) of the Escuela Técnica Superior de Ingeniería y Diseño Industrial (ETSIDI) under controlled environmental conditions: relative humidity within 24% and 35.6% and temperature between 24.4 °C and 26 °C.
For each test, one particle plate was placed on the horizontal support, and a second plate was positioned on top, ensuring proper alignment. The plane was then inclined at a constant rate until the upper plate of particles initiated sliding. Inclination was controlled electronically to minimise operator influence and digitally recorded. For each configuration, maximum, minimum, mean values, and standard deviations of the sliding angle were calculated.
Tests may be performed with different loads on top of the upper plate to measure the influence of contact forces. How this load is distributed on individual particles is not known in this set up. That means that if the friction coefficient depends significantly on the magnitude of the individual particle contact forces, an error is introduced. Tests across different pressure regimes may reveal if such load dependence is significant for a particular granular material. However, the tests reported here are all done with the weight of the upper specimen as the only vertical load.
The apparatus may also be used to determine the particle-to-wall friction coefficient. This is done by using a wall sample as the bottom plate. The result will be different from that in a shear box tester because the particles here are locked. The freedom to move in the shear box is comparable to what happens against a silo wall and, therefore, realistic for continuum stress–strain analyses. For a DEM analysis, the yield contact friction force for locked particles is the parameter needed, while the freedom for the particle to move is part of the result of the DEM simulation.
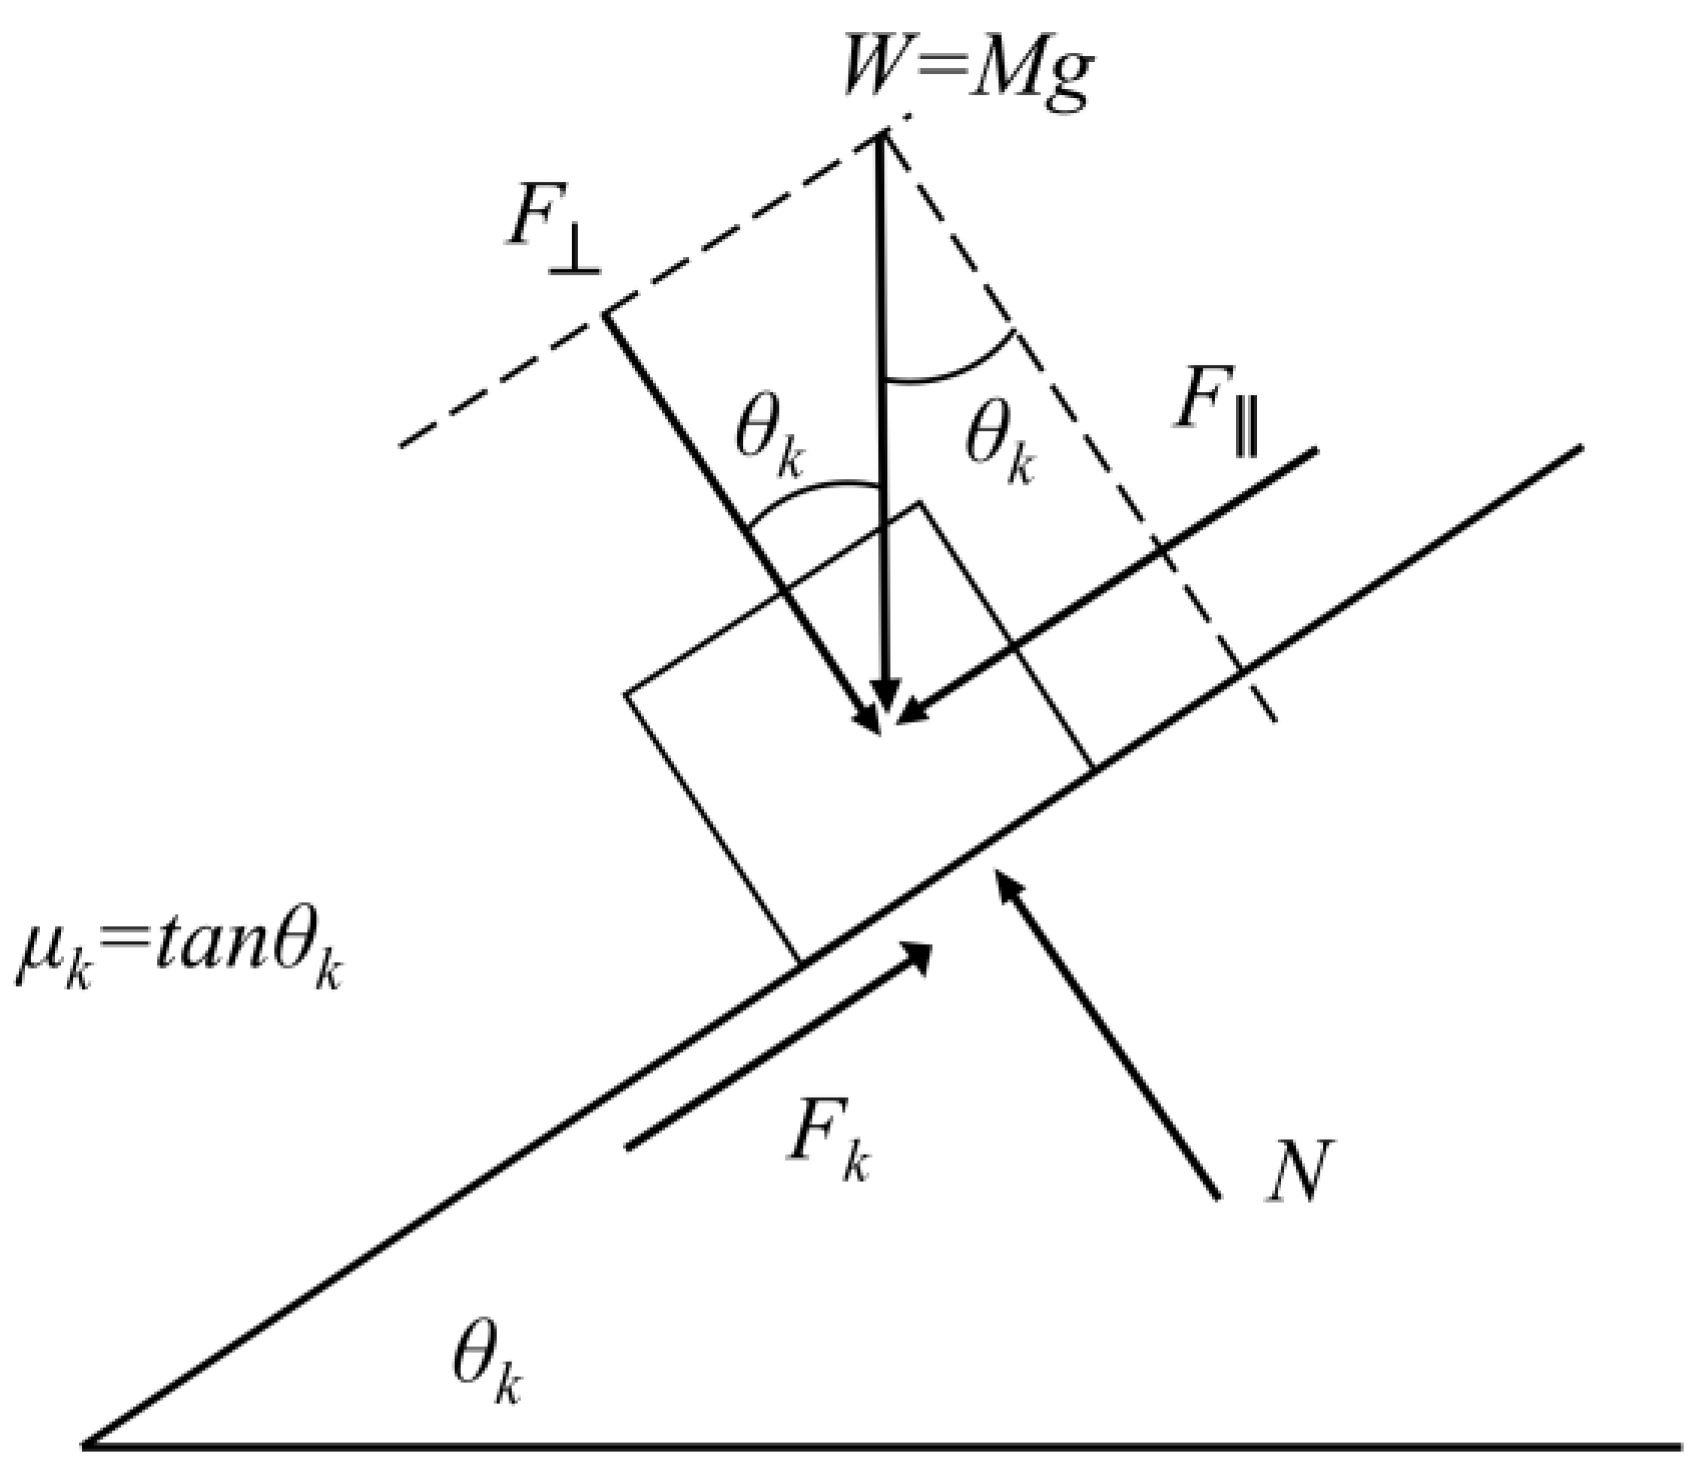
The friction coefficient (μk) can be calculated from the tangent of the sliding angle (θk) at the onset of motion (Figure 11).
Figure 11.
Equilibrium of forces in an inclined plane.
The coefficient obtained from the onset angle corresponds to the static friction coefficient. This parameter governs the initiation of sliding and is assumed to be the relevant parameter for DEM simulations in quasi-static granular flows, where particle motion is dominated by slip-stick mechanics.
Initial validation was performed with clay spheres and clay plates to ensure repeatability and reliability of the apparatus and proposed method. Tests were repeated for different plate orientations as described in Section 2.2 and illustrated in Figure 3. Each configuration was tested in ten repetitions to obtain representative mean values.
3. Results
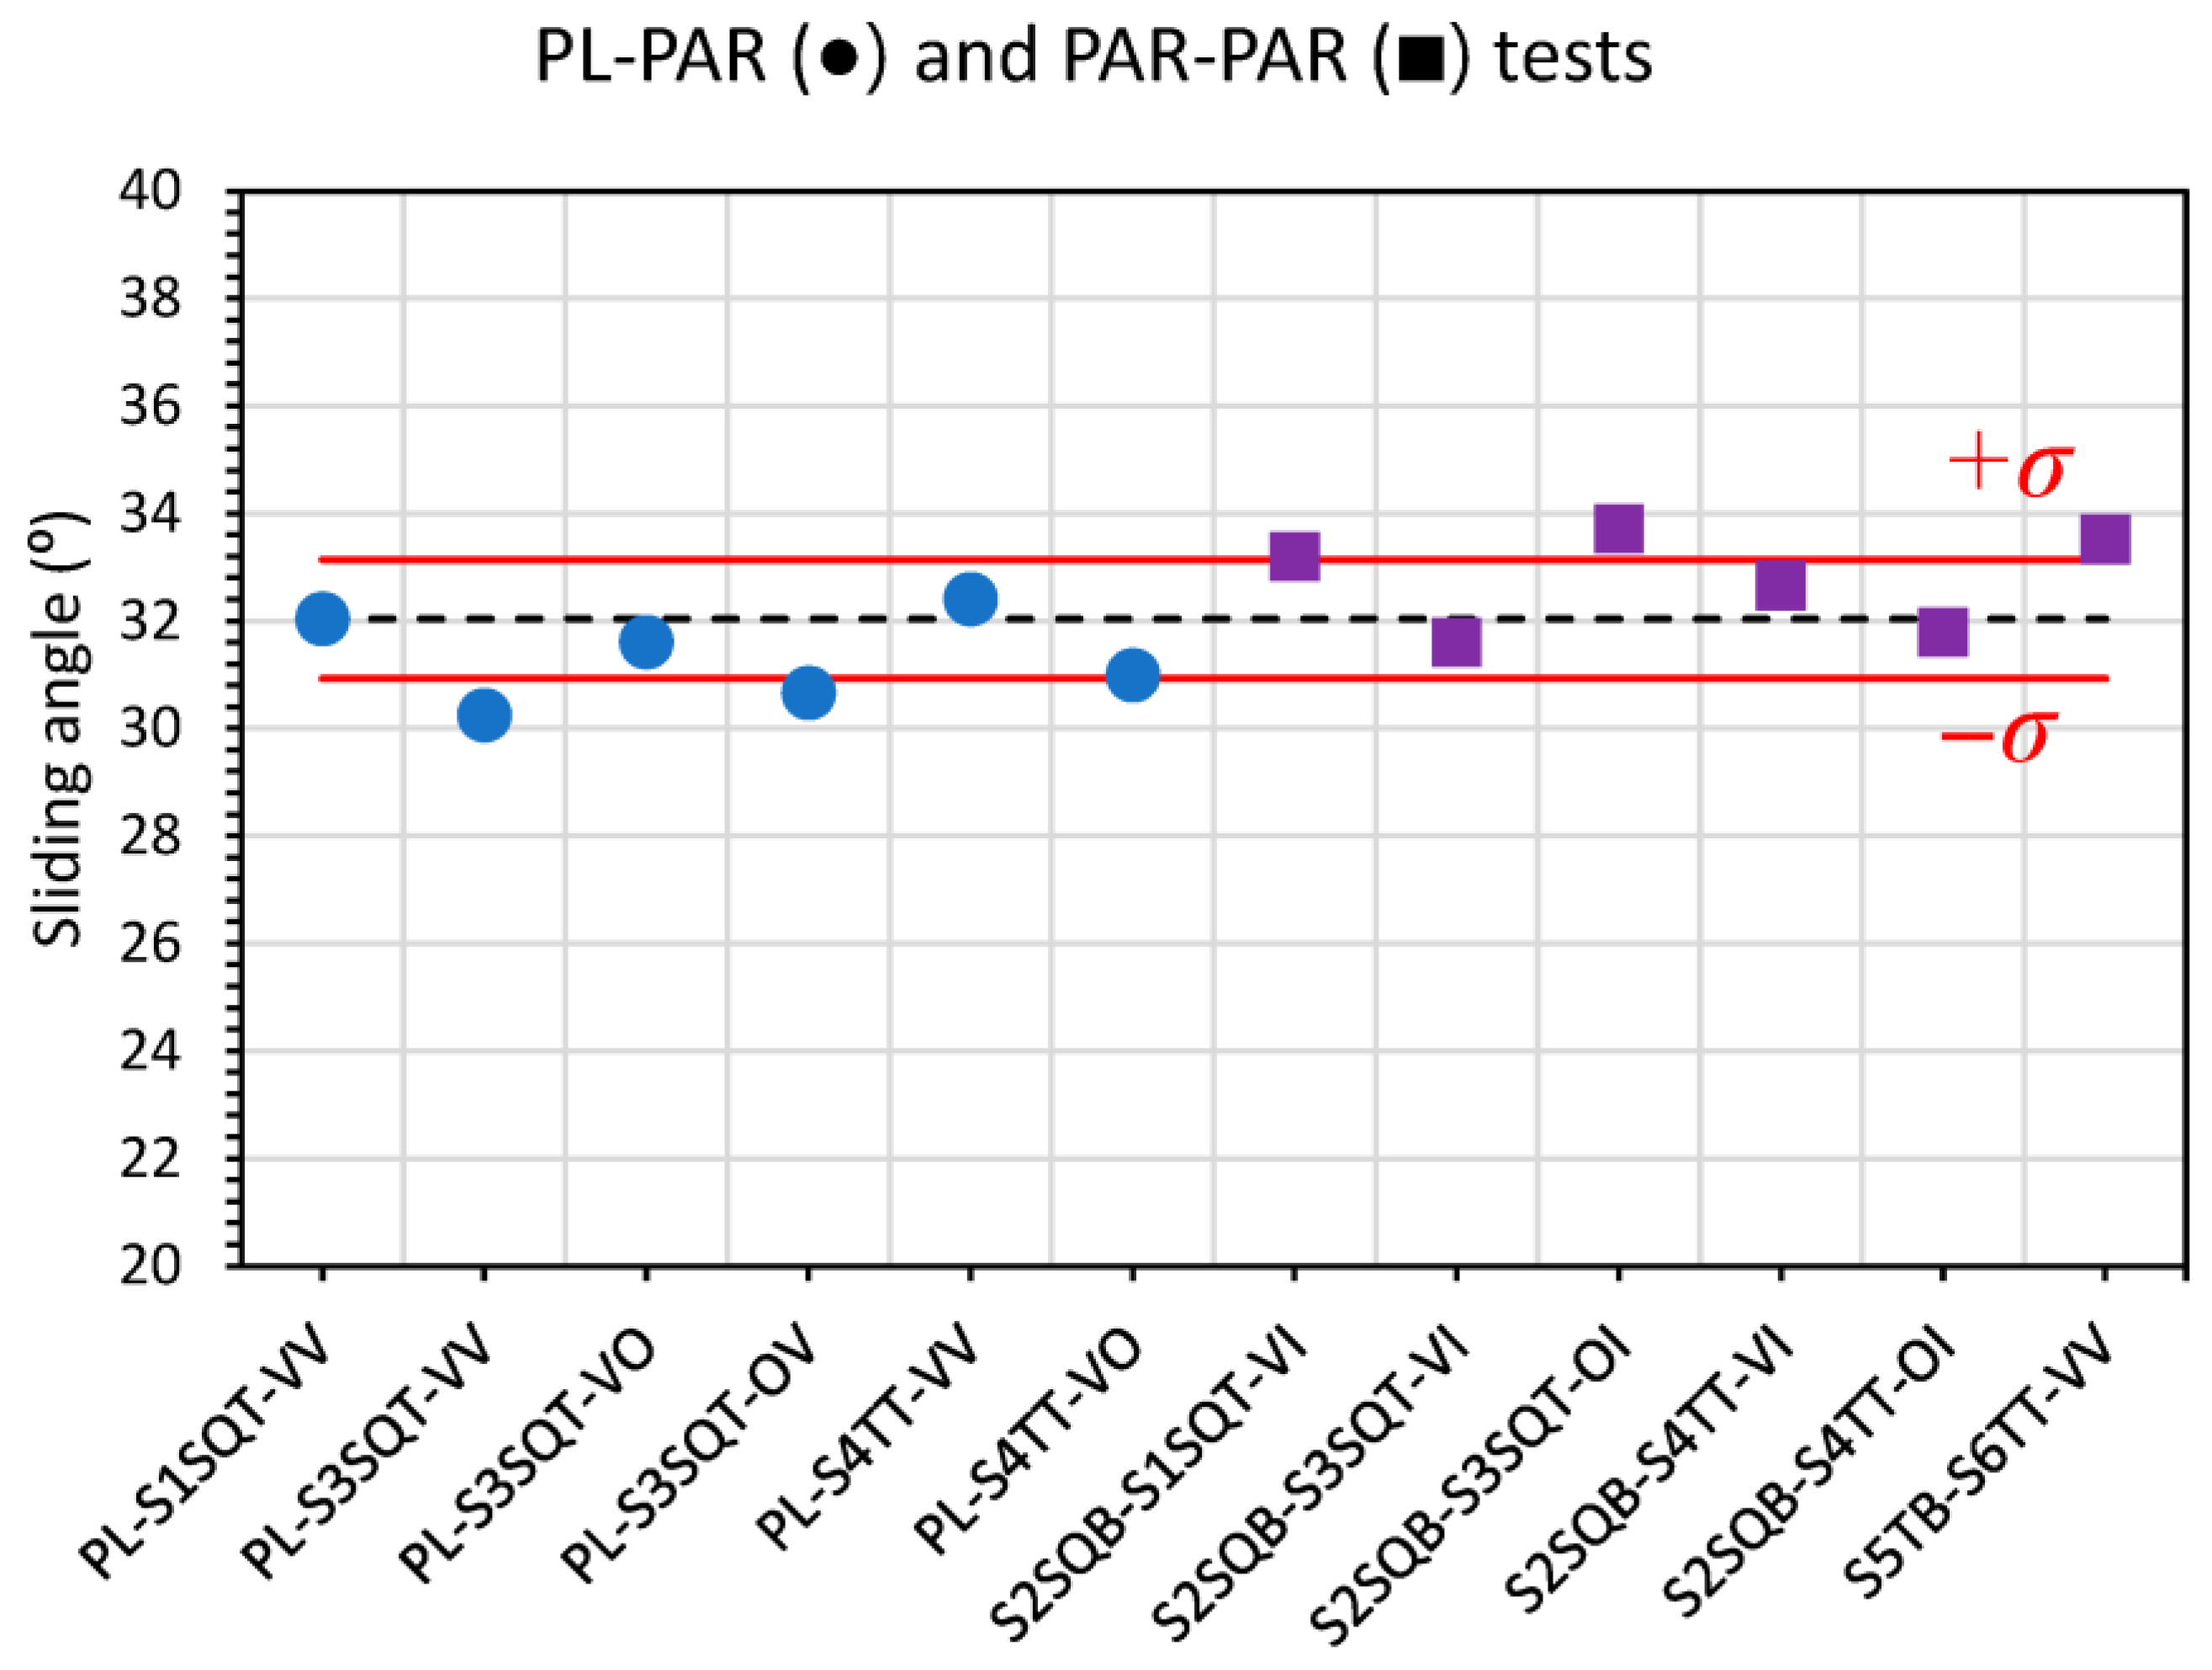
The results obtained with the test apparatus for the different sample configurations are summarized in Table 2 and Figure 12.
Table 2.
Results for all testing configurations.
Figure 12.
Comparison of all tests, 6 PL-PAR and 6 PAR-PAR tests.
The study considered particle plates tested against solid plates, and particle plates tested against other particle plates, under different particle arrangements (triangular and square) and orientations (vertical–vertical, vertical–orthogonal, and vertical–inclined at 45°).
Overall, the mean sliding angles ranged from 30.2° (Test 4, PL-S3SQT-OV) to 34.4° (Test 12, S5TB-S6TT-VV). Standard deviations were generally low, between 0.8° and 2.9°, indicating a high repeatability of the measurements. The minimum and maximum values within each group also showed limited scatter, with ranges typically below 10°.
4. Discussion
In principle all tests aimed at determining the same clay-to-clay sliding angle. The robustness of the methodology is evaluated by analyses of the possible influence from plate-to-particle vs. particle-to-particle testing, orientation of samples and particle configuration (triangle or square).
4.1. Plate–Particles vs. Particles–Particles
To assess if the type of contact influences the sliding angle, a Student’s t-test for two samples was carried out grouping tests 1–6 (plate–particles, PL–PAR) and tests 7–12 (particles–particles, PAR–PAR). On average, the sliding angle was slightly higher for particle–particle contacts, with a mean difference of 1.41°, the t-statistic (t) from Student’s t-test was −2.88, with a corresponding p-value (p) of 0.016. This difference was statistically significant, which suggests that the type of contact could have an effect.
However, when interpreting this result it is important to consider its magnitude. The difference between the average values of the two groups (≈1.4°) is small compared with the absolute values of the sliding angles (≈31–33°) and with the low scatter observed across the measurements. To evaluate if this shift is meaningful in practice, an equivalence analysis using the Two One-Sided Tests (TOST) procedure was conducted. The 90% confidence interval (CI) for the difference between the two group means (−2.30° to −0.52°) fell entirely within a pre-defined equivalence margin of ±2.5°. According to the TOST criterion, this indicates that the two contact types can be considered statistically equivalent for practical purposes.
In summary, although particle–particle contacts produced slightly higher sliding angles than particle–plate contacts, the difference is minor and falls within the range of experimental variability. From an engineering perspective, both contact types can be treated as equivalent under the selected tolerance.
4.2. Orientation of the Samples
The effect of sample orientation was assessed by comparing tests with a vertical–vertical (VV) orientation (tests 1, 2, 5 and 12) against those with a vertical–inclined (VI) orientation (tests 7, 8 and 10). The mean sliding angles were very similar (32.06° for VV and 32.53° for VI), with a small difference of −0.47°. A two-sample Student’s t-test confirmed that this difference was not statistically significant (t = −0.55, p = 0.61; 95% CI: −2.70° to 1.76°).
The variability was also comparable between orientations, with standard deviations of 1.33° for VV and 0.76° for VI, the Fisher test statistic (F) was 3.02, with a corresponding p-value 0.52. A Mann–Whitney test, based on the Wilcoxon rank-sum statistic (W = 7, p = 0.86) yielded the same conclusion, with no significant difference in medians (32.22° vs. 32.70°). Finally, the Kolmogorov–Smirnov test indicated that the data were consistent with normality (p = 0.93), validating the use of parametric methods.
Altogether, these results demonstrate that the orientation of the samples (VV vs. VI) does not significantly affect either the mean value or the variability of the sliding angle. In practical terms, this means that the frictional response is not sensitive to sample orientation.
4.3. Particle Configuration
The influence of particle arrangement (square vs. triangular) was assessed in two separate comparisons. The first involved Tests 1–4 (square samples) versus Tests 5–6 (triangular samples). The average sliding angles were 31.16° and 31.70°, respectively, with a negligible difference of −0.54° (95% CI: −2.59° to 1.51°; t = −0.73, p = 0.50). Variability was also comparable (SD = 0.80° vs. 0.99°; F = 0.65, p = 0.61). A Mann–Whitney test supported these findings, with no difference in medians (31.15° vs. 31.70°, W = 6, p = 0.49). Normality was confirmed by the Kolmogorov–Smirnov test (p = 0.89). Although the number of triangular samples was limited in the case of triangular samples, the consistency across parametric and nonparametric tests indicates that the arrangement had no measurable effect.
A second comparison contrasted square Tests 7–9 (square samples) with Tests 10–12 (triangular samples). In this case, the mean values were virtually identical (32.76° vs. 32.67°), with a difference of only 0.09° (95% CI: −2.30° to 2.48°; t = 0.10, p = 0.92). Variability was again similar (SD = 1.23° vs. 0.85°; F = 2.08, p = 0.65), and no differences were observed in medians (33.2° vs. 32.7°; Mann–Whitney W = 4.0, p = 1.0). Normality was confirmed for both groups (Kolmogorov–Smirnov, p = 0.996).
Overall, the two comparisons provide consistent evidence that the spatial arrangement of particles—square or triangular—does not significantly affect the sliding angle or its variability. Occasional small shifts in mean values were not statistically significant and showed no consistent trend.
4.4. Twelve Tests
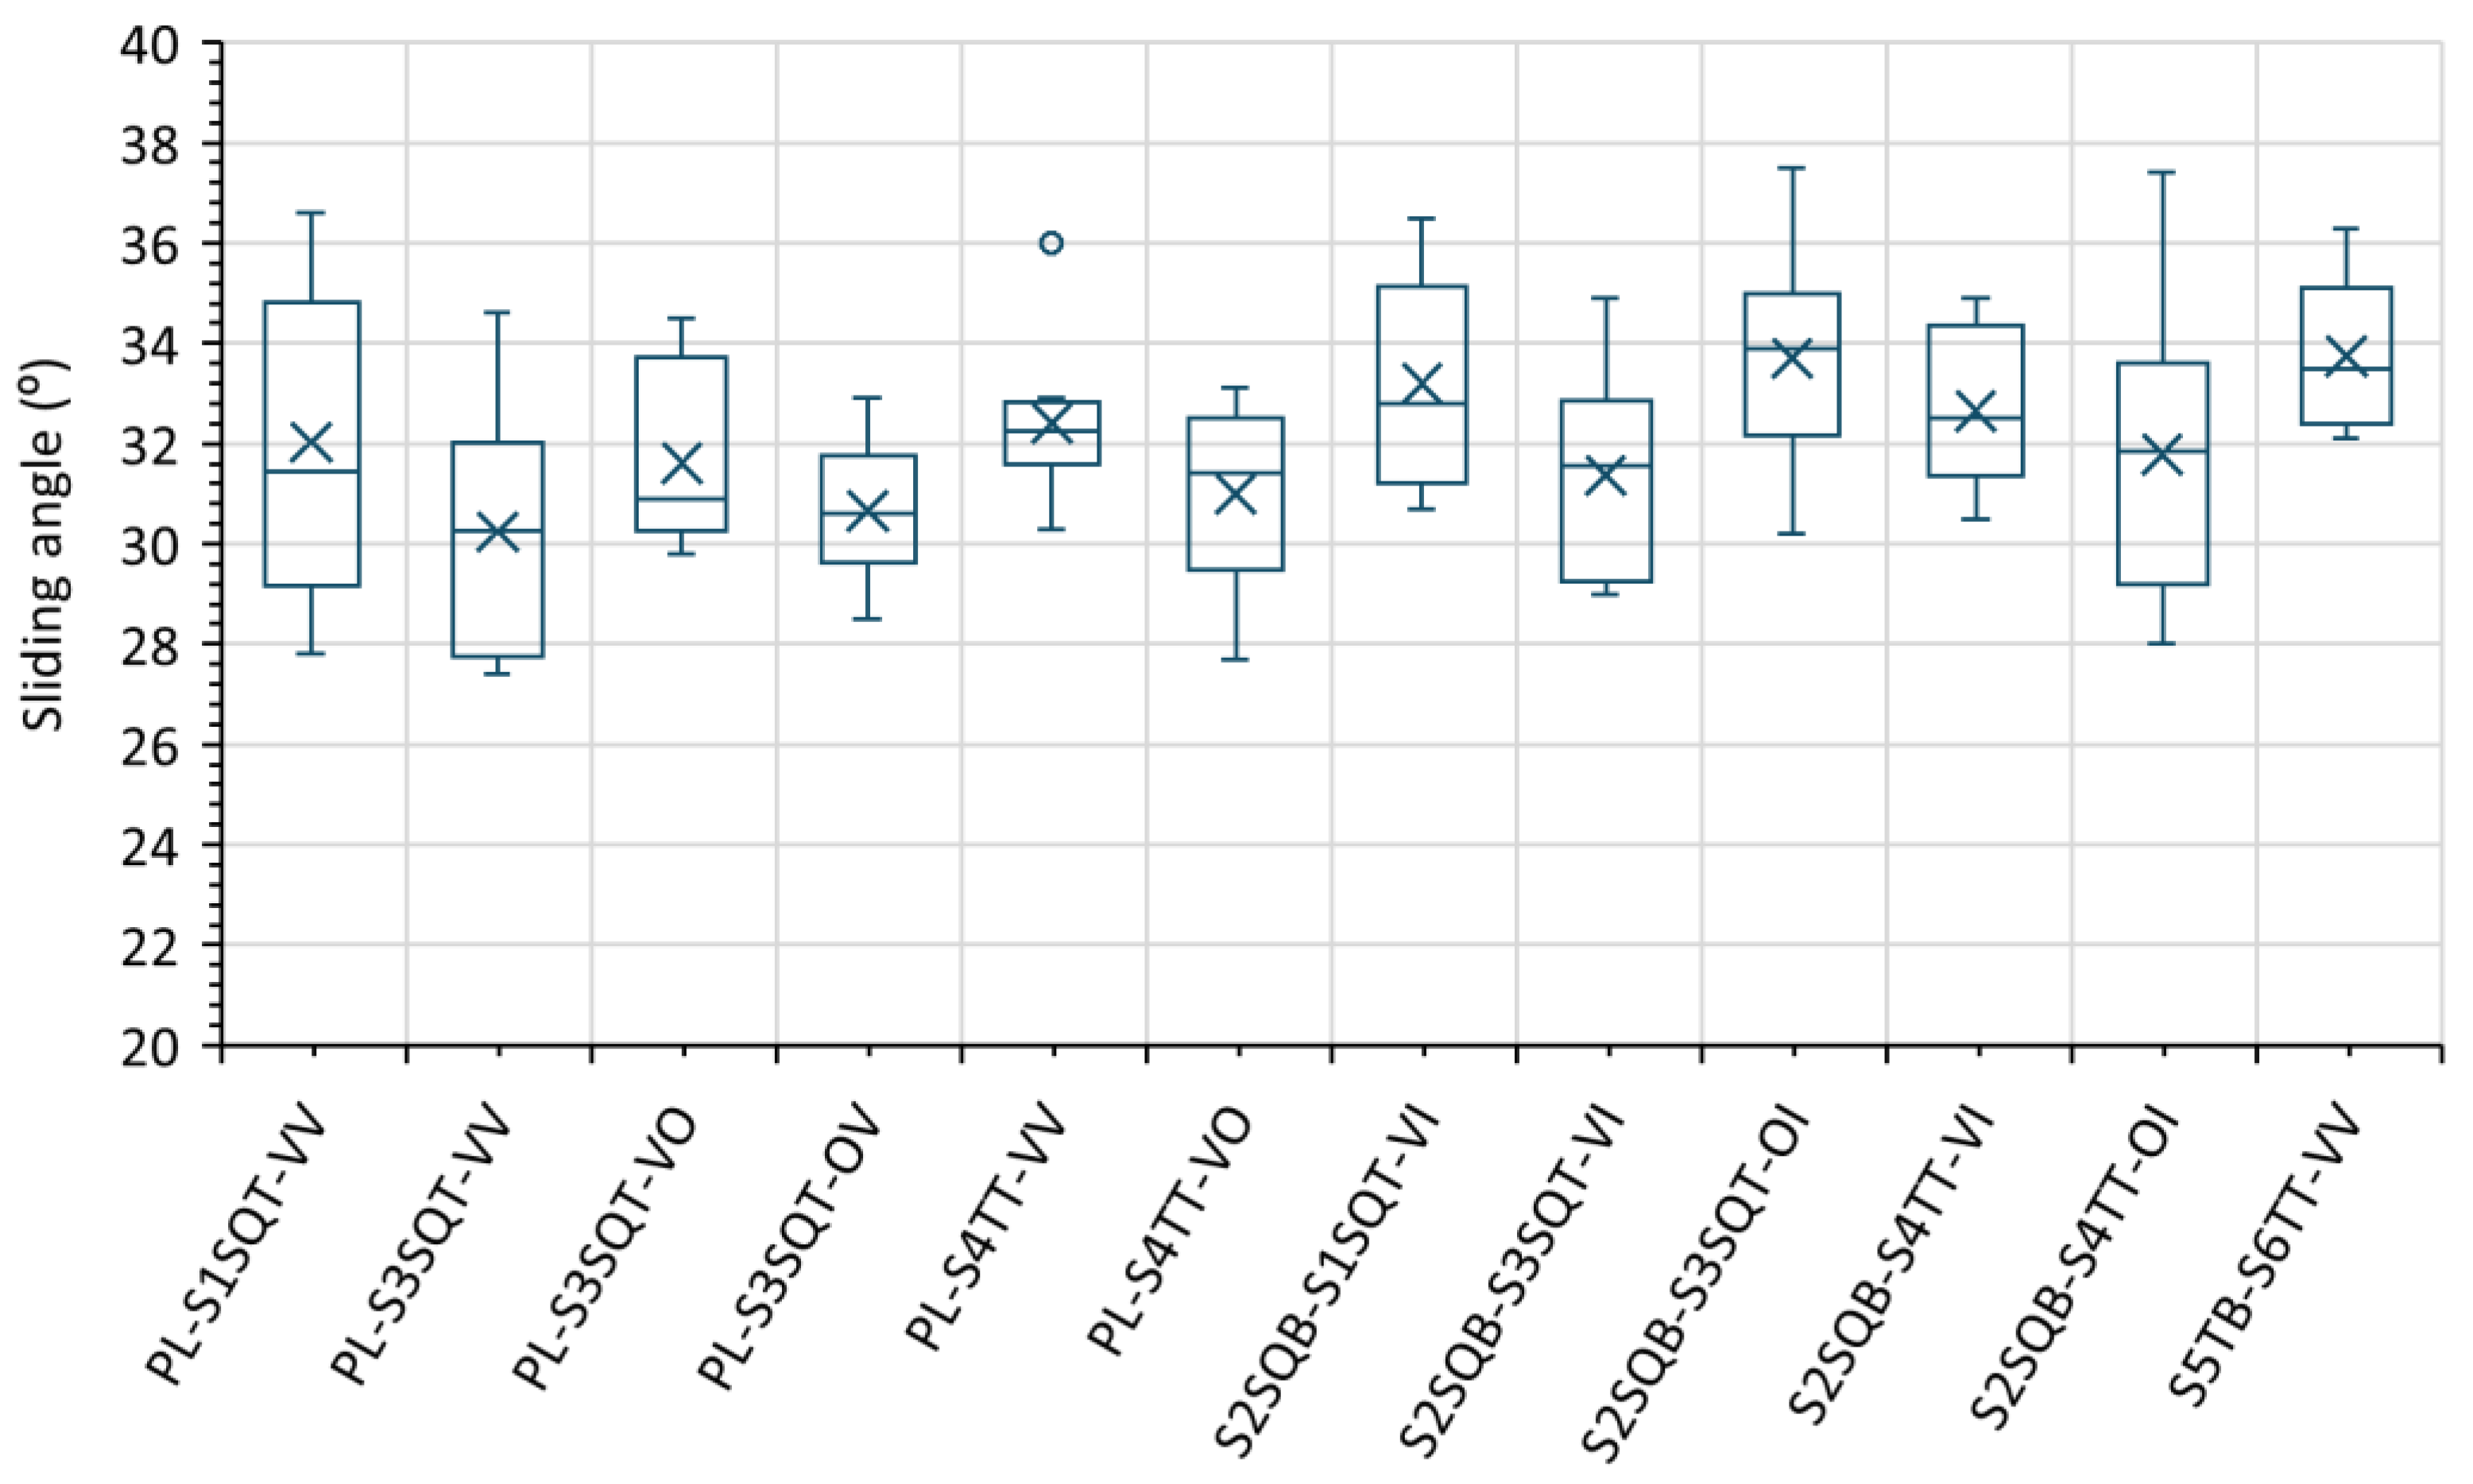
Figure 13 summarizes the results obtained from all twelve tests in a box-and-whisker plot, which included both plate–particle (PL–PAR) and particle–particle (PAR–PAR) samples prepared with square and triangular particle configurations, and tested under vertical, perpendicular, and inclined orientations. The sliding angle values were highly consistent across conditions, with only small deviations observed. The overall relative standard deviation was 3.4%, which demonstrates the reliability of the procedure for determining the particle-to-particle friction coefficient.
Figure 13.
Box-and-whisker plot showing mean values (×), median values (horizontal lines inside the boxes), interquartile ranges (boxes), minimum and maximum non-outlier values (whiskers), and outliers (dots).
In these tests the actuator was operated at a very low and constant tilting rate of approximately 1.2°/s to ensure quasi-static loading conditions. Under such slow tilting, sliding initiates when the static friction threshold is reached, without appreciable inertial overshoot or dynamic effects. Although the tilt rate was not systematically varied in this study, no qualitative evidence of dynamic response was observed, and the low scatter in the measured sliding angles supports that the tests operated under quasi-static regimes. Future research may investigate the sensitivity to tilt rate in order to formally define limits for dynamic influence.
Regarding DEM simulations, the slight differences observed between tests fall within commonly accepted tolerance ranges and are unlikely to produce significant deviations in simulated granular flow behaviour.
4.5. Overall Evaluation
The repeatability of the sliding angle measurements achieved with the proposed apparatus and the prescribed test procedure was satisfactory and comparable to values reported in interlaboratory studies using ring shear testers. Although the testing principle differs (inclined plane vs. shear cell), Schulze [] reported in a round robin test with more than 20 laboratories that the relative standard deviation of shear stress measurements was about 1–3% for ring shear testers, whereas the Jenike shear tester exhibited much larger deviations (5–11%) []. These results confirm that the present setup provides reproducible and reliable measurements of sliding angle, with a level of repeatability consistent with internationally established devices and suitable for determining particle-scale friction parameters.
While the proposed device provides a practical and repeatable means to estimate particle-to-particle and particle-to-wall friction angles, it is important to acknowledge its limitations. The present configuration was tested using particles approximately 6 mm in size, for which controlled manual placement and bonding were feasible. For much smaller particles, especially sands or powders in the sub-millimetre range, the preparation of representative test specimens becomes substantially more challenging. Additionally, highly irregular or broadly graded particle systems may complicate the formation of representative specimen surfaces.
The present study has focused on developing a robust test method using one granular material with limited variation in particle size and morphology to validate the method. While the inclined-plane method demonstrated robust repeatability under these conditions, its general applicability across granular systems remains to be quantified. Future work should therefore include materials with a wider range of particle sizes, shapes, and surface properties to define the operational limits and scaling behavior of the device.
Compared to micro-tribometric rigs [], the present method offers operational simplicity. Micro-tribometric rigs are typically more complex to set up and to operate, and their applicability can be more restrictive with respect to particle shapes. However, for particle systems where the friction coefficient is strongly dependent on the magnitude of the applied normal load, micro-tribometers allow a more accurate determination by explicitly controlling the contact force and resolving force–displacement behavior at the single-contact scale.
4.6. Friction Coefficient
The friction coefficient for clay to clay, was determined from the average sliding angle obtained in the twelve tests (Table 2). The mean sliding angle was 32°, which corresponds to a friction coefficient of 0.62.
5. Conclusions
The experimental apparatus designed and constructed for measuring the sliding angle of granular particles demonstrated to be both easy-to-use and reliable. Its performance was primarily ensured by the negligible vibrations generated by the electric actuator and the capability to operate at a constant inclination rate, which together provided stable testing conditions.
Although sample preparation can represent a critical and challenging step, especially when dealing with irregularly shaped or anisotropic particles, the results obtained in this study indicate that the methodology is robust. The comparison of clay-to-clay friction tests conducted with different orientations and particle configurations yielded a high repeatability, with a standard deviation ≈ 1° across all plate-spherical particles (P–S) and spherical particles-spherical particles (S–S) samples. This level of consistency can be regarded as a validation of the proposed experimental protocol and apparatus.
Beyond the specific case of clay particles, the method can be applied to a wide variety of granular materials such as agricultural seeds (e.g., maize, chickpeas, beans), industrial pellets (e.g., plastics), or spherical particles (e.g., steel or glass beads).
From a numerical modelling perspective, the proposed methodology is especially useful for the application of Discrete Element Method (DEM) simulations. By providing reliable values of the particle-to-particle friction coefficients under controlled conditions, the apparatus enables the determination of DEM input parameters with improved confidence. Additionally, the possibility of testing under different normal loads allows for the assessment of load-dependent frictional behaviour, further enhancing the representativeness of the DEM models.
In summary, the apparatus and methodology presented here offer a simple, reproducible, and versatile approach for quantifying interparticle and particle-to-wall friction. This provides a valuable tool for model validation in particle mechanics and bulk solids handling. Future work should be oriented to testing a wider range of particle sizes, shapes, and surface properties to define the operational limits of the test method.
Author Contributions
Conceptualization, J.N.; methodology, Á.R.-G.; validation, J.N., Á.R.-G., L.A. and M.P.; formal analysis, J.N., Á.R.-G., L.A. and M.P.; investigation, J.N., Á.R.-G., L.A. and M.P.; resources, Á.R.-G.; data curation, Á.R.-G., L.A. and M.P.; visualization, L.A. and M.P.; writing—original draft preparation, J.N., Á.R.-G., L.A. and M.P.; writing—review and editing, J.N., Á.R.-G., L.A. and M.P.; supervision, J.N. and Á.R.-G. All authors have read and agreed to the published version of the manuscript.
Funding
This research does not received funding.
Institutional Review Board Statement
Not applicable.
Informed Consent Statement
Not applicable.
Data Availability Statement
The original contributions presented in this study are included in the article. Further inquiries can be directed to the corresponding author.
Conflicts of Interest
The authors declare no conflicts of interest.
References
- Brown, C.J.; Nielsen, J. Silos: Fundamentals of Theory, Behaviour and Design; CRC Press: London, UK, 1998; ISBN 9780429078637. [Google Scholar]
- Cundall, P.A.; Strack, O.D.L. A Discrete Numerical Model for Granular Assemblies. Géotechnique 1979, 29, 47–65. [Google Scholar] [CrossRef]
- Goda, T.J.; Ebert, F. Three-Dimensional Discrete Element Simulations in Hoppers and Silos. Powder Technol. 2005, 158, 58–68. [Google Scholar] [CrossRef]
- Ramírez, A.; Nielsen, J.; Ayuga, F. On the Use of Plate-Type Normal Pressure Cells in Silos. Comput. Electron. Agric. 2010, 71, 64–70. [Google Scholar] [CrossRef]
- Kobyłka, R.; Molenda, M. DEM Simulations of Loads on Obstruction Attached to the Wall of a Model Grain Silo and of Flow Disturbance around the Obstruction. Powder Technol. 2014, 256, 210–216. [Google Scholar] [CrossRef]
- Coetzee, C.J.; Els, D.N.J. Calibration of Discrete Element Parameters and the Modelling of Silo Discharge and Bucket Filling. Comput. Electron. Agric. 2009, 65, 198–212. [Google Scholar] [CrossRef]
- Ketterhagen, W.R.; Curtis, J.S.; Wassgren, C.R.; Kong, A.; Narayan, P.J.; Hancock, B.C. Granular Segregation in Discharging Cylindrical Hoppers: A Discrete Element and Experimental Study. Chem. Eng. Sci. 2007, 62, 6423–6439. [Google Scholar] [CrossRef]
- Combarros, M.; Feise, H.J.; Zetzener, H.; Kwade, A. Segregation of Particulate Solids: Experiments and DEM Simulations. Particuology 2014, 12, 25–32. [Google Scholar] [CrossRef]
- Balevičius, R.; Kačianauskas, R.; Mróz, Z.; Sielamowicz, I. Discrete-Particle Investigation of Friction Effect in Filling and Unsteady/Steady Discharge in Three-Dimensional Wedge-Shaped Hopper. Powder Technol. 2008, 187, 159–174. [Google Scholar] [CrossRef]
- Parafiniuk, P.; Molenda, M.; Horabik, J. Discharge of Rapeseeds from a Model Silo: Physical Testing and Discrete Element Method Simulations. Comput. Electron. Agric. 2013, 97, 40–46. [Google Scholar] [CrossRef]
- Ramírez-Gómez, Á. The Discrete Element Method in Silo/Bin Research. Recent Advances and Future Trends. Part. Sci. Technol. 2018, 38, 210–227. [Google Scholar] [CrossRef]
- ASAE S368.4; Compression Test of Food Materials of Convex Shape. American Society of Agricultural and Biological Engineers (ASABE): St. Joseph, MI, USA, 2006.
- D854-10; Standard Test Methods for Specific Gravity of Soil Solids by Water Pycnometer. American Society for Testing and Materials (ASTM): West Conshohocken, PA, USA, 2010.
- Ramírez-Gómez, Á.; Gallego, E.; Fuentes, J.M.; González-Montellano, C.; Ayuga, F. Values for Particle-Scale Properties of Biomass Briquettes Made from Agroforestry Residues. Particuology 2014, 12, 100–106. [Google Scholar] [CrossRef]
- Katterfeld, A.; Coetzee, C.; Donohue, T.; Fottner, J.; Grima, A.R.; Ilic, D.; Kačianauskas, R.; Nečas, J.; Schott, D.L.; Williams, K.; et al. Calibration of DEM Parameters for Cohesionless Bulk Materials Under Rapid Flow Conditions and Low Consolidation; Delft University of Technology: Delft, The Netherlands, 2019. [Google Scholar]
- Schulze, D. Powders and Bulk Solids; Springer: Berlin/Heidelberg, Germany, 2008; ISBN 978-3-540-73767-4. [Google Scholar]
- Zegzulka, J.; Gelnar, D.; Jezerska, L.; Ramirez-Gomez, A.; Necas, J.; Rozbroj, J. Internal Friction Angle of Metal Powders. Metals 2018, 8, 255. [Google Scholar] [CrossRef]
- Chung, Y.-C. Discrete Element Modelling and Experimental Validation of a Granular Solid Subject to Different Loading Conditions. Ph.D. Thesis, University of Edinburgh, Edinburgh, UK, 2006. [Google Scholar]
- ASTM-Method-G99-95A; Standard Test Method for Wear Testing with a Pin-on-Disk Apparatus. American Society for Testing and Materials (ASTM): West Conshohocken, PA, USA, 2000.
- Hancock, B.C.; Mojica, N.; John-Green, K.S.; Elliott, J.A.; Bharadwaj, R. An Investigation into the Kinetic (Sliding) Friction of Some Tablets and Capsules. Int. J. Pharm. 2010, 384, 39–45. [Google Scholar] [CrossRef] [PubMed]
- Grima, A.P.; Wypych, P.W. Development and Validation of Calibration Methods for Discrete Element Modelling. Granul. Matter 2011, 13, 127–132. [Google Scholar] [CrossRef]
- Cavarretta, I.; Rocchi, I.; Coop, M.R. A new interparticle friction apparatus for granular materials. Can. Geotech. J. 2011, 48, 1829–1840. [Google Scholar] [CrossRef]
- Senetakis, K.; Coop, M.R. The development of a new micro-mechanical inter-particle loading apparatus. Geotech. Test. J. 2014, 37, 1028–1039. [Google Scholar] [CrossRef]
- Li, Y.; Chan, D.; Nouri, A. Measuring Interparticle Friction of Granules for Micromechanical Modeling. Energies 2022, 15, 3967. [Google Scholar] [CrossRef]
- Jones, R. From single particle AFM studies of adhesion and friction to bulk flow: Forging the links. Granul. Matter 2003, 5, 191–204. [Google Scholar] [CrossRef]
- Schulze, D. Round robin test on ring shear testers. Adv. Powder Technol. 2011, 22, 197–202. [Google Scholar] [CrossRef]
Disclaimer/Publisher’s Note: The statements, opinions and data contained in all publications are solely those of the individual author(s) and contributor(s) and not of MDPI and/or the editor(s). MDPI and/or the editor(s) disclaim responsibility for any injury to people or property resulting from any ideas, methods, instructions or products referred to in the content. |
© 2025 by the authors. Licensee MDPI, Basel, Switzerland. This article is an open access article distributed under the terms and conditions of the Creative Commons Attribution (CC BY) license (https://creativecommons.org/licenses/by/4.0/).