Abstract
The recommendation of electricity retail packages is challenged by diversified user demands and the complexity of evaluation information in liberalized electricity markets. Existing approaches are often limited by the subjectivity of user clustering and the difficulty of accurately capturing cognitive fuzziness and dynamic weight variations in the decision-making process. To address these challenges, this paper proposes a novel recommendation framework that integrates Improved Density Peaks Clustering (IDPC) with group decision-making based on trapezoidal fuzzy numbers. First, an IDPC-based model is constructed to objectively identify and partition users into homogeneous groups based on similar electricity consumption characteristics. Subsequently, a dynamic multi-attribute group decision-making model, which synergizes trapezoidal fuzzy numbers and the Multi-Criteria Compromise Ranking Method (MCRM), is designed to aggregate evaluation information from these user groups and to score the retail packages. Furthermore, a full-ranking recommendation strategy is established based on group satisfaction levels. Finally, a case study using a real-world dataset from a region in Eastern China is conducted. The empirical results demonstrate the framework’s superior performance: the IDPC algorithm achieves a stable Davies–Bouldin index of approximately 1.4, and the final recommendation ranking yields a Spearman correlation coefficient of 0.9 against simulated actual choices, significantly outperforming benchmark methods. This study shows that the proposed method can effectively enhance the precision and relevance of package recommendations, providing crucial decision support for electricity retailers in implementing refined marketing strategies.
1. Introduction
With the continuation of electricity market reform [] and the steady progress toward carbon neutrality, the electricity retail sector is undergoing a profound transformation—from a traditional, monopolistic supply system to a diversified and integrated energy service model. At the same time, recent studies have emphasized that this transition is increasingly shaped by systemic risks and structural barriers within the broader energy landscape [,]. In this context, the design and recommendation of electricity retail packages have emerged as a pivotal issue for electricity retailers aiming to enhance their market competitiveness and user loyalty. These packages serve as a critical link between supply and demand and are instrumental in achieving refined energy management. However, the proliferation of retail packages, while offering consumers a wider array of choices, has also significantly increased their decision-making costs. Consequently, establishing a recommendation mechanism that can accurately match the needs of both suppliers and consumers has become a key challenge that urgently needs to be addressed.
Extensive explorations have been carried out in this field worldwide. Differentiated development paths have been formed in different countries according to the characteristics of their respective electricity markets. Typical practices can be observed, such as the step-pricing bundle model in Japan [,], the modular design in the United Kingdom [,], and the collaborative filtering recommendation based on comparison platforms in Australia [,]. In China, active efforts have also been undertaken. For instance, a hybrid clustering method was employed in [] to segment users and to establish a two-layer optimization model that incorporates user behavior, while a pricing optimization model adapted to the spot market was constructed in [] with the objective of achieving a balance between electricity retailers and consumers. Through these studies, useful insights have been provided for the personalized recommendation of electricity retail packages.
However, two key limitations remain in existing recommendation methods when the complexity of real decision-making scenarios is addressed. First, existing user clustering methods lack adaptability, relying on static data and manually set parameters, which limit their ability to capture dynamic and diverse consumption behaviors. Traditional methods, such as the K-means algorithm adopted in [], are mostly based on static data, while critical parameters, including the number of clusters and the cutoff distance, must be preset manually. This practice not only introduces strong subjectivity but also limits the adaptability to market dynamics, resulting in clustering outcomes with poor flexibility and robustness that fail to fully capture the spatiotemporal complexity of electricity consumption behavior. Second, current studies oversimplify users’ evaluation information, ignoring its fuzziness and heterogeneity, leading to information distortion and biased recommendation results. For example, the fuzzy C-means clustering algorithm introduced in [], combined with a user regulation potential index system, was utilized to identify several typical user groups for refined package recommendations. In [], a differentiated package pricing model based on comprehensive user satisfaction was established, aiming to maximize satisfaction while ensuring reasonable profits for electricity retailers. The core assumption underlying such methods is that all users are able to provide precise and standardized evaluations for a predetermined set of attributes. In practical decision-making scenarios, however, this assumption is difficult to hold. Users often remain uncertain when faced with complex package terms, making it impossible to represent their judgments with exact numerical values. Moreover, users with different backgrounds and concerns tend to employ heterogeneous information to express preferences. If such fuzzy and heterogeneous information is forcibly unified into standardized and precise inputs, serious information distortion is likely to be caused, ultimately leading to recommendation results that deviate from users’ true intentions.
Based on these identified limitations, this study aims to answer the following research questions: How can a more objective and adaptive user clustering method be developed to better capture the spatiotemporal complexity of electricity consumption behavior? And how can a recommendation framework effectively integrate heterogeneous and fuzzy user evaluation information while accounting for dynamic preferences in multi-attribute group decision-making?
To address the aforementioned issues, this study proposes a multi-attribute dynamic group decision-making recommendation framework that integrates Improved Density Peak Clustering (IDPC) with trapezoidal fuzzy numbers. In Section 2, the methodological framework is presented in detail. At the user segmentation level, an IDPC-based similar-user identification model is developed, in which the Particle Swarm Optimization (PSO) algorithm is incorporated to adaptively tune key parameters, thereby enhancing the flexibility and robustness of the clustering outcomes. At the evaluation information processing level, a trapezoidal fuzzy number-based multi-attribute transformation and normalization method is designed to preserve the inherent fuzziness and heterogeneity of user preferences. At the group decision-making level, a three-dimensional dynamic weighting model integrating user, attribute, and temporal dimensions is constructed. The Dynamic Trapezoidal Fuzzy Weighted Geometric (DTFWG) operator is subsequently employed to aggregate multi-source information and derive comprehensive evaluations of power package alternatives within similar user groups. Finally, the MCRM is applied to compute the group utility and individual regret values, thereby producing a ranking of packages that balances overall efficiency and individual preference satisfaction. In Section 3, a case study utilizing real electricity consumption data from a regional Chinese market is conducted to validate the effectiveness, robustness, and practical applicability of the proposed framework. This method is specifically optimized to align with the practical characteristics of the electricity package recommendation scenario, ensuring a strong correspondence with the research objective and achieving substantial improvements in both recommendation accuracy and matching performance.
2. Methods
2.1. Multi-Attribute Customer Decision-Making System Establish
2.1.1. Establishment of User Profiling and Labeling System
The significant differences in load characteristics and electricity consumption habits among users are recognized as the fundamental reasons for the diversification of their preferences in electricity tariff packages. To address this, a user profiling system is established, where electricity consumption features are characterized based on behavioral data. This system enables the identification of similar users and supports the recommendation of appropriate electricity tariff packages.
For the set of users the quarterly load dataset is denoted as . Each element represents the load data of user during the time periods in the quarter, where corresponds to the load of user in the -th hourly period. The selection of a quarterly basis for defining user load profiles is driven by several practical considerations. Firstly, a quarter provides a sufficiently long observation window to capture typical seasonal variations and long-term consumption trends, which are crucial for identifying stable and representative user segments. Shorter periods, such as monthly or weekly, might be overly sensitive to transient fluctuations or short-term anomalies, leading to less robust user profiles. Conversely, longer periods, like a full year, might obscure important intra-annual behavioral shifts that are relevant for dynamic package recommendations. Secondly, from a business perspective, electricity retailers often align their pricing strategies and package offerings with quarterly cycles, making quarterly profiles a natural and practical choice for aligning recommendation models with market operations. This temporal aggregation balances the need for capturing detailed consumption patterns with the stability required for effective user segmentation and package design.
Five indicators are selected to construct a quarterly electricity consumption label system, including quarterly electricity consumption, quarterly consumption volatility, quarterly load factor, average peak load ratio, and average valley load ratio. Based on these indicators, the profile vector of user is constructed as , where and denote the quarterly electricity consumption, quarterly consumption volatility, quarterly load factor, average peak load ratio, and average valley load ratio of user , respectively. The specific physical meanings and definitions of these indicators are provided in Table 1.
Table 1.
User Profiling and Labeling System.
2.1.2. Similar User Identification Based on IDPC
Electricity consumption data of individual users usually exhibit substantial randomness and fluctuations [,]. If tariff recommendations are directly generated from individual profiles, the results may be easily distorted by occasional behaviors. Moreover, significant heterogeneity exists among users’ consumption patterns, which are influenced by various factors such as lifestyle habits, energy-using appliances, and consumption environments. By clustering similar users [], common features can be extracted from large-scale user groups, thereby reducing the interference of individual randomness and noise. This process enables effective dimensionality reduction and feature extraction of large-scale user profiles, while simultaneously decreasing the computational complexity of subsequent recommendation models. Consequently, clustering similar users serves not only as the foundation for personalized tariff recommendations but also as a critical step to improve recommendation accuracy.
To achieve this, an Improved Density Peaks Clustering (IDPC) algorithm is applied to the user profiles. This algorithm maintains the advantage of the traditional Density Peaks Clustering (DPC) [] in automatically identifying the number of clusters, while incorporating Particle Swarm Optimization (PSO) for global optimization of key parameters. As a result, the stability and accuracy of clustering are significantly enhanced, providing reliable data support for subsequent tariff recommendations based on similar user groups.
The core concept of the IDPC algorithm is to exploit the global search capability of PSO [] to automatically determine the optimal parameter combination for DPC, with the maximization of the Silhouette Coefficient (SC) [] as the objective function.
First, “density” and “distance” are employed as the core criteria to identify the centers of user groups that represent distinct electricity consumption patterns. Cluster centers are generally characterized by both a relatively high local density and a large distance from other points with similarly high densities. For each user , the local density denotes the number of neighboring users within a predefined electricity-feature distance threshold . A larger indicates that the corresponding consumption pattern is more representative. The local density is commonly calculated using a cut-off kernel function as follows:
where represents the Euclidean distance between user and user after normalization, and is the cut-off distance that determines the range of density calculation.
For each user , the parameter reflects the dissimilarity between this user’s consumption pattern and that of more representative patterns. Specifically, is defined as the relative distance to the nearest point with a higher local density, given by the following:
Cluster centers are thus identified as points with both high local density and large relative distance. A composite index is defined as
By selecting users with large values, the centers of typical user groups can be automatically identified without predefining the number of clusters. The remaining samples are then assigned to the clusters of their nearest neighbors with higher density.
To achieve adaptive optimization of the cut-off distance, the Particle Swarm Optimization (PSO) algorithm is introduced. In this process, each candidate value of is treated as a “particle,” and the optimal solution is searched through iterative updates of particle velocity and position.
where and denote the velocity and position of the -th particle in the -th dimension during the -th iteration, respectively. represents the individual historical best position of the particle, while represents the global historical best position of the swarm. denotes the inertia weight, and are the learning factors, and are random numbers uniformly distributed in the interval [].
To enhance both the convergence performance and the global search capability of the algorithm, the inertia weight and the learning factors are dynamically adjusted at each iteration.
where represents the minimum value of the inertia weight, and denote the initial and final values of the learning factor, is the current iteration, and is the maximum number of iterations.
In the process of clustering users for electricity tariff recommendation, the design of the fitness function for the clustering algorithm is critical to the accuracy and business relevance of the resulting similar user groups. In this study, the Silhouette Coefficient (SC) is introduced as the fitness evaluation metric for clustering:
The SC comprehensively considers intra-cluster compactness (the similarity of electricity consumption patterns within the same group) and inter-cluster separation (the differences in consumption patterns between groups), effectively reflecting the quality of clustering. A higher SC value indicates better clustering performance, with clearer and more representative group profiles. The calculation is given as follows:
where denotes the average distance between sample and all other samples within the same cluster, and represents the average distance between sample and the nearest neighboring cluster.
In summary, based on the principles of the IDPC algorithm, the specific steps for clustering similar users are as follows:
Step 1: Parameter Initialization. The PSO population size, maximum number of iterations, convergence threshold , inertia weight , and dynamic ranges of learning factors and are set. The search range for the cut-off distance is also determined as .
Step 2: Population Initialization and Global Best Determination. An initial particle swarm (i.e., a set of candidate values) is randomly generated within the search interval, and their positions are assigned as individual best positions . For each particle, DPC is performed and the fitness is calculated according to Equation (8). The particle with the highest fitness is designated as the initial global best .
Step 3: Iterative Optimization. The velocities and positions of all particles are updated according to Equation (4), and the fitness corresponding to the new values is recalculated.
Step 4: Individual and Global Best Updates. For each particle, the current fitness is compared with its historical best . If the current fitness is superior, is updated. Subsequently, the fitness of all particles is compared with the global best , and if a better solution exists, is updated.
Step 5: Termination Criteria. The PSO iteration stops and the optimal is output if the improvement in global best fitness is insignificant (i.e., when and the change rate is less than ) or the maximum number of iterations is reached. Otherwise, Step 3 is repeated.
Step 6: Final Clustering. The optimal cut-off distance is used to perform a complete DPC. All user samples are assigned to corresponding clusters according to the density propagation rule, forming the final similar user groups.
Using the IDPC algorithm, the global user set is partitioned into disjoint similar user groups , where each group is represented as This clustering satisfies and .
2.2. Electricity Tariff Satisfaction Evaluation Based on Dynamic Fuzzy Group Decision
The recommendation method proposed in this chapter is applicable to any similar user group. For clarity, a generic similar user group is denoted as , defined as where , and represents the total number of users within the group. denotes the -th user in this group.
2.2.1. Integration of Heterogeneous User Evaluation Information Based on Trapezoidal Fuzzy Numbers
In multi-attribute decision-making problems, due to differences in user preferences and cognitive uncertainty, heterogeneous information is often employed by different users in various forms, such as real numbers, interval numbers, triangular fuzzy numbers [], intuitionistic fuzzy numbers [], interval fuzzy numbers, multi-granularity linguistic values, and binary semantics. To effectively integrate such heterogeneous information, trapezoidal fuzzy numbers are adopted as a unified representation of evaluation information in this study [,].
Let the set of electricity retail packages be denoted as and the set of new users as The attribute set for evaluating electricity packages is defined as where denotes the -th electricity package, represents the -th user, and corresponds to the -th attribute evaluated by the user. The considered package attributes include unit price, green energy proportion, contract flexibility, value-added services, and incentive mechanisms. Evaluation information types are represented by covering real numbers, interval numbers, triangular fuzzy numbers, intuitionistic fuzzy numbers, interval fuzzy numbers, multi-granularity linguistic values, and binary semantics. Temporal information is denoted as where is the total number of time periods. The original evaluation provided by user for package on attribute during period is denoted as , and its attribute type is represented by .
A gradient transformation is applied to information from different attributes to obtain a gradient fuzzy number evaluation matrix. The specific transformation method is presented in Table 2 [].
Table 2.
Gradient Fuzzy Number Transformation Method.
After the above transformation, all original evaluation information is unified into trapezoidal fuzzy numbers . To standardize the scales of different evaluation attributes, the trapezoidal fuzzy number decision matrix is normalized to obtain the standardized gradient fuzzy number evaluation matrix , whose elements are denoted as .
For benefit-type attributes (the larger the value, the better):
For cost-type attributes (the smaller the value, the better):
2.2.2. Determination of Group Decision Weights Based on Dynamic Assignment
In group decision-making, the contributions of information from different users, evaluation attributes, and time periods to the final result vary. To address this, a dynamic multi-dimensional weight integration model is constructed, incorporating three dimensions: user, package attribute, and time.
- 1.
- Determination of User Weights Based on the Minimum Proximity Method.
To quantify the influence of each user’s evaluation in the group decision-making process, user weights are determined using the minimum proximity method. If a user’s evaluation is generally closer to the evaluations of all other users in the group, it indicates that the user’s preferences have higher representativeness and should be assigned a higher weight.
The weight of user is determined inversely proportional to the overall deviation , which is defined as follows:
- 2.
- Determination of Attribute Weights Based on the Maximum Deviation Method.
To objectively assess the importance of each evaluation attribute in the decision-making process, attribute weights are determined using the maximum deviation method []. This method considers that if an attribute exhibits larger differences among all candidate electricity packages, it can more effectively distinguish between the alternatives and thus plays a greater role in the final decision. Consequently, a higher weight should be assigned to such attributes.
The weight of attribute is obtained by constructing an optimization model that maximizes the overall deviation of all alternatives under this attribute, expressed as follows:
The results obtained from the above model are normalized to yield the final attribute weights.
- 3.
- Determination of Time Weights Based on Subjective–Objective Integration.
To reflect the temporal dynamics of evaluation information, time weights are determined by integrating the entropy weight method (objective weighting) [] and the Orness measure method (subjective weighting) [].
The entropy weight method is used to measure the objective dispersion of evaluation information across different time periods. If the evaluation values of all packages in a given time period are more dispersed, the information entropy of that period is smaller, indicating that it contains more effective decision-making information and should be assigned a higher objective weight.
For time periods and electricity packages, a decision matrix is constructed based on the comprehensive utility values of each package in each period, where denotes the group decision comprehensive evaluation of the -th package in the -th period:
The entropy values and the corresponding entropy weights for each time period are calculated as follows:
The Orness measure method is employed to reflect the subjective preference of decision-makers toward time. By adjusting the Orness parameter , users’ emphasis on recent data () or historical data () can be flexibly expressed, yielding the subjective weight :
Finally, the objective weight and the subjective weight are integrated to obtain the final weight for each time period:
2.2.3. Comprehensive Evaluation of Package Satisfaction Based on MCRM
After information preprocessing and weight calculation, information aggregation and comprehensive evaluation of each candidate package are performed. Traditional multi-attribute decision-making (MADM) methods commonly rely on weighted summation to derive a total score for each alternative. However, this aggregative approach inherently risks masking critical deficiencies in specific attributes of certain packages, consequently impeding the identification of truly balanced and robust solutions. More precisely, by consolidating all attribute scores into a singular utility value, these methods make it challenging to discern whether a package, despite performing commendably on several aspects, suffers from a severe shortfall in another. For instance, a high aggregate score might misleadingly endorse an option with inadequate service quality or rigid contractual terms, representing a significant, unaddressed weakness in a vital dimension. Such a limitation can result in suboptimal recommendations. To circumvent this inherent shortcoming, a comprehensive evaluation method based on the Multi-Criteria Compromise Ranking Method (MCRM) is adopted in this section. By systematically aggregating information and employing a compromise ranking strategy, the MCRM effectively assesses user satisfaction for each package, ensuring a more holistic and reliable outcome.
Firstly, the previously determined user weights are applied to aggregate the fuzzy evaluations of all users in a similar user group for each package attribute during the period, using the trapezoidal fuzzy weighted averaging operator. This results in the user-integrated package evaluation matrix for the period, :
where , , , .
On this basis, the MCRM [] method is applied to calculate the comprehensive performance of each package during the period. For each user-integrated package evaluation matrix , the positive and negative ideal solutions for the period are first determined:
Using the attribute weights (see Section 2.2.2), the group utility value and the individual regret value of each package in period are calculated as follows:
Subsequently, the comprehensive compromise value of each package in period is obtained as follows:
Due to variations in energy consumption behaviors across different time periods, evaluation information is aggregated along the temporal dimension. By incorporating the time weights (see Section 2.2.2), the dynamic trapezoidal fuzzy weighted geometric (DTFWG) operator [] (as shown in Equation (27)) is applied to integrate information from multiple periods. Through time-weighted aggregation of the group utility values , individual regret values , and compromise values of each package , the final comprehensive utility value , comprehensive regret value , and comprehensive compromise value are obtained.
Upon completion of dynamic aggregation across users, package attributes, and time periods, the final comprehensive compromise value for each package is obtained. This value serves as the core indicator for measuring package satisfaction and represents the quantitative satisfaction of a similar user group toward each package.
2.3. Package Recommendation Based on Satisfaction of Similar User Groups
In the previous sections, complete models for user profiling, similar user group segmentation, and dynamic evaluation of package satisfaction have been established. This section describes how the final package recommendation for a new user is generated based on these results.
For any new user , a standardized user profile vector is first constructed based on electricity consumption data (or obtained via load forecasting methods), according to the label system defined in Section 2.2.1 Subsequently, the distance between this vector and the cluster centers of each similar user group is calculated, and the most similar group is identified.
Once the most similar group for the new user is determined, the recommendation generation relies on the package satisfaction evaluations of that group. For group , the final satisfaction values of all candidate packages are obtained through aggregation of user, package attribute, and temporal weights, followed by the MCRM. These comprehensive satisfaction values represent the overall preference of the most similar group toward each package. By ranking these satisfaction values in ascending order, a full ranking of packages for the group is produced. Given the high similarity in electricity consumption characteristics between the new user and the group, this ranking can be directly mapped to the personalized recommendation list for the new user .
In summary, the proposed recommendation process involves two core steps: first, matching the new user to the most similar group based on the user profile; second, generating the recommendation results based on the group satisfaction. The workflow is illustrated in Figure 1. The final full-ranking package list not only ensures personalized and accurate recommendations but also provides electricity retailers with flexible decision support.
Figure 1.
Workflow of Electricity Retail Package Recommendation Integrating Improved Density Peaks Clustering and Trapezoidal Fuzzy Number-Based Group Decision-Making.
3. Results
3.1. Introduction to the Arithmetic Example
This case study validates the proposed electricity retail package recommendation method using electricity consumption data from a region in Eastern China. The dataset encompasses three types of users—industrial, commercial, and residential—and includes five core features: quarterly electricity consumption, consumption volatility, load factor, average peak load rate, and average off-peak load rate. The data were collected over the four quarters of 2024 with hourly sampling granularity. The dataset also contains users’ actual evaluations and preference information for various packages and their attributes (e.g., tiered pricing, green electricity subsidies) gathered during the pilot period. The electricity packages offered by the utility are listed in Table 3. The case study and all computational analyses were conducted using Python 3.10 (Python Software Foundation, Wilmington, DE, USA) for algorithmic simulation, while Microsoft Excel 2021 (Microsoft Corporation, Redmond, WA, USA) was used for data storage and management.
Table 3.
Electricity Package Set Provided by the Retail Company.
3.2. Analysis of User Clustering Results
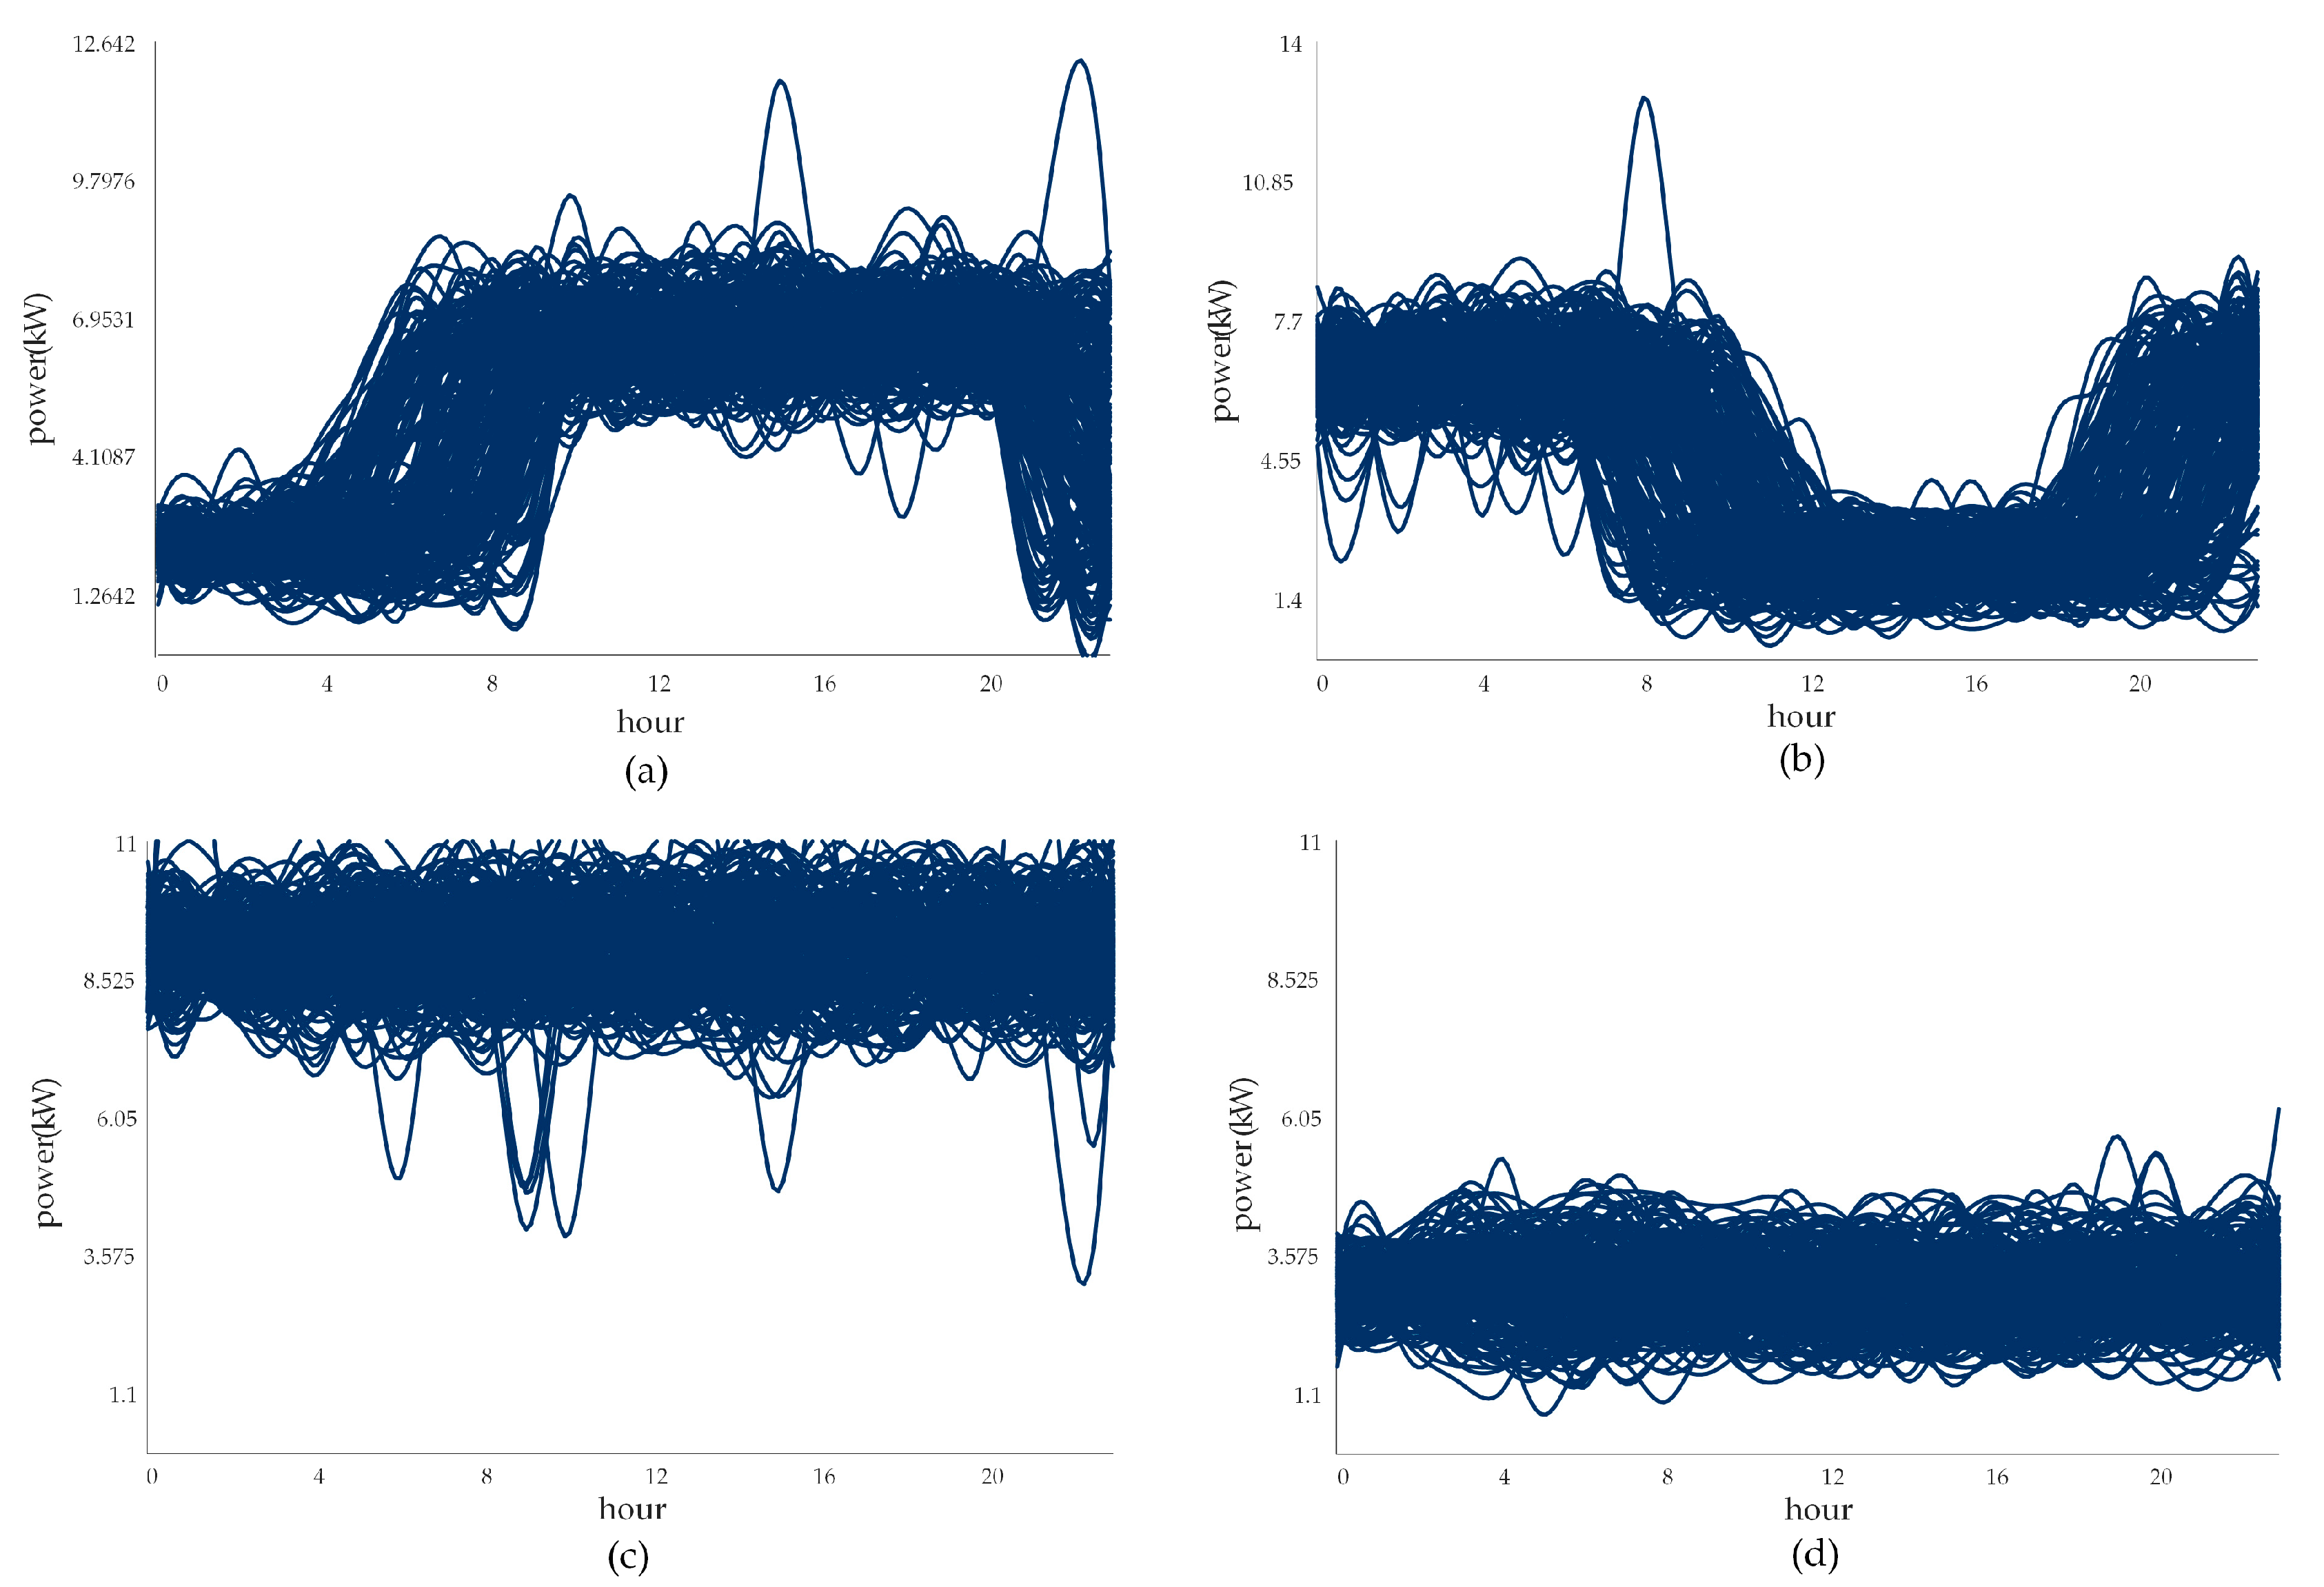
The user set was clustered using the IDPC algorithm. Based on the 24 h daily electricity load patterns across four quarters, users were classified into four categories: peak-type users, off-peak-type users, low-consumption balanced users, and high-consumption balanced users. The detailed results are shown in Figure 2, and the coarse average load curves are presented in Figure 3.
Figure 2.
(a) Illustrative Power Load Curve of Peak-Type Users; (b) Illustrative Power Load Curve of Valley-Type Users; (c) Illustrative Power Load Curve of High-Consumption Balanced Users; (d) Illustrative Power Load Curve of Low-Consumption Balanced Users.
Figure 3.
Comparison of Average Load Curves for the Four User Categories.
The clustering results indicate that distinct differences exist in electricity consumption patterns among the four user categories. Peak-type users exhibit significantly higher power consumption during peak hours, primarily comprising commercial users. Off-peak-type users show elevated consumption during off-peak hours, mainly including residential users with concentrated nighttime usage and some industrial users. Low-consumption balanced users display minimal fluctuations in power consumption and maintain a relatively low overall load, predominantly representing ordinary residential users. High-consumption balanced users maintain a stable yet high load, primarily consisting of continuous-production industrial users. These clustering results provide a reference for designing personalized electricity retail packages tailored to the diverse consumption behaviors of different user groups.
Based on the electricity consumption characteristics of a new user, the distributions of the existing clusters were fitted. The probabilities of this user belonging to the peak-type, off-peak-type, low-consumption balanced, and high-consumption balanced clusters were calculated as 0.08, 0.28, 0.15, and 0.79, respectively. Therefore, the user was classified as a high-consumption balanced user.
3.3. Performance Evaluation of the Electricity Package Recommendation Method
3.3.1. Quantitative Assessment and Effectiveness Analysis of Recommendation Results
A quantitative evaluation of the five electricity packages was conducted based on the group utility values , individual regret values , and compromise values . According to the MCRM compromise minimization criterion, the recommended priority ranking of the packages was determined as A4 > A5 > A2 > A3 > A1. The detailed results are presented in Table 4 and Figure 4.
Table 4.
Comprehensive Evaluation Results of Electricity Packages.
Figure 4.
Multi-Dimensional Comparison of Electricity Packages.
The ranking results demonstrate a high degree of logical consistency. For instance, Package A4, with its flexible contract period and high-quality value-added services, effectively reduces the risk of users’ decision-making. Its minimum compromise value (0.030) aligns closely with the MCRM’s principle of “minimizing individual regret.” In contrast, Package A1, despite achieving the highest group utility due to its lowest unit price, exhibits the lowest levels in green electricity proportion, service, and discounts, resulting in a pronounced shortfall in user experience and the highest individual regret. Consequently, it ranks last in the overall compromise-based sorting. These results strongly validate that the proposed model can effectively avoid the pitfalls of single-dimension optimization and achieve a coordinated balance between collective benefits and individual preferences.
3.3.2. Comparison with Simulated Actual Choices
Since the actual ranking of the packages is difficult to obtain directly, a simulation-based validation framework was designed to verify the effectiveness of the evaluation model. This framework is built upon five core principles reflecting typical user consumption behavior:
- Users sensitive to contract flexibility tend to prefer packages with shorter contract periods.
- When price differences are small, users pay more attention to the freedom of contract adjustments.
- Users with high quarterly electricity consumption are particularly sensitive to incentive discounts.
- The quality of value-added services has a greater impact on individual decision-making than minor price fluctuations (within ±0.05 CNY/kWh).
- Users with high load volatility value stability-related services, whereas users with low load volatility tend to prioritize cost-optimization services.
The simulated actual ranking generated for new users based on these principles is compared with the model-recommended ranking in Table 5.
Table 5.
Comparison between Model-Recommended Ranking and Simulated Actual Ranking.
The results indicate that the overall consistency between the model-recommended ranking and the simulated actual ranking reaches 80%, with a root mean square error (RMSE) of 0.6325. Only the rankings of A2 and A3 are swapped. A deeper analysis reveals that this is due to the model assigning a slightly higher weight to the “green electricity” attribute compared to the “contract flexibility” preference in the simulation framework, which places A2 slightly ahead. In contrast, in the simulated actual ranking, users prioritize A3’s on-demand contract flexibility, which better suits short-term electricity planning needs, over green electricity preferences, resulting in A3 ranking higher. This deviation objectively reflects the dynamic trade-off between collective benefits and individual preferences, validating both the rationality of the model and its adaptability to real-world business scenarios.
3.4. Algorithmic Complexity Analysis
In this case study, the dataset comprises a specific number of users , five core features , five electricity packages , multiple evaluation attributes , and data from four quarters representing four time periods .
Within the proposed framework, the most computationally intensive stage is the user segmentation process, which employs an Improved Density Peak Clustering (IDPC) algorithm integrated with Particle Swarm Optimization (PSO). The computational complexity of this stage can be expressed as . where and denote the number of PSO iterations and particles, respectively. This complexity is primarily determined by the quadratic dependency arising from pairwise similarity calculations among users.
After clustering, the dynamic multi-attribute group decision-making phase involves computing user, attribute, and temporal weights, followed by the application of the MCRM-based optimization. The computational complexity of this phase can be approximated as , where is the number of clusters and represents the average number of users per cluster.
Overall, the proposed model exhibits a quadratic growth pattern with respect to the number of users, primarily due to the pairwise similarity computations in the clustering stage. Nevertheless, by employing efficient algorithmic design, matrix sparsification strategies, and careful parameter tuning, the computational cost remains acceptable for medium-scale datasets. Furthermore, the substantial improvements in recommendation accuracy and relevance confirm that the computational overhead is well justified, demonstrating that the model achieves a desirable balance between scalability, precision, and practical applicability.
3.5. Performance Comparison of Different Methods
3.5.1. Comparison of Clustering Algorithm Performance
This study compares IDPC with K-means, traditional DPC, and EDPC algorithms, evaluating performance from two dimensions: clustering quality and robustness against interference.
For clustering quality, internal validity indices are used to assess the clustering results by jointly considering intra-cluster compactness and inter-cluster separation. Specifically, the silhouette coefficient (SC) and Davies–Bouldin index (DB) are employed. The SC measures how similar a user is to its own cluster compared to neighboring clusters, with higher values indicating better clustering results. The DB index represents the ratio of intra-cluster dispersion to inter-cluster similarity, with lower values indicating better clustering quality.
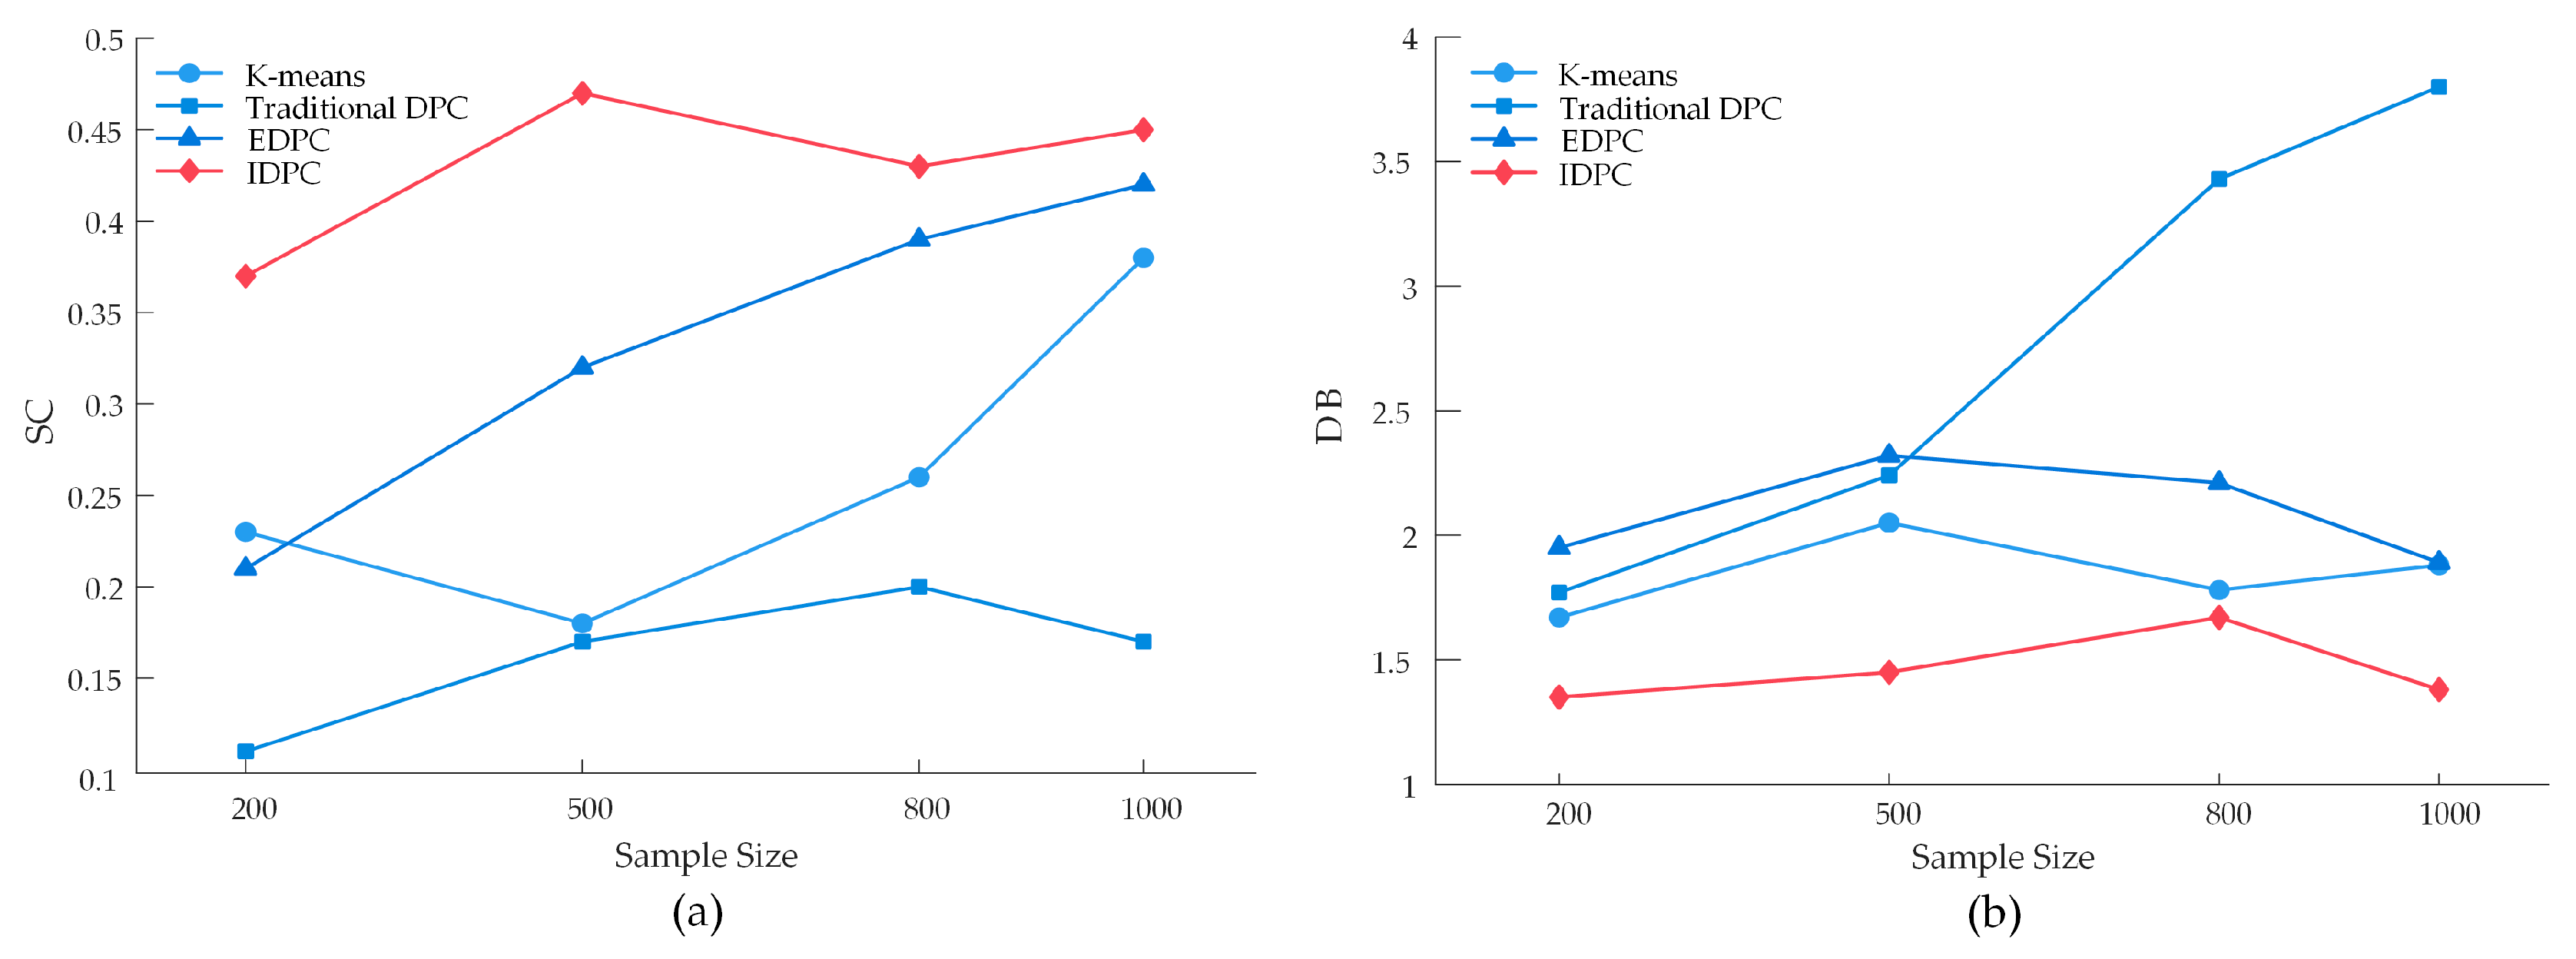
To simulate dynamic changes in user data scale in practical business scenarios, experiments were conducted with sample sizes of 200, 500, 800, and 1000. Each clustering algorithm was independently tested three times to eliminate random errors. The detailed results are shown in Figure 5.
Figure 5.
(a) Comparison of Silhouette Coefficients Across Multiple Algorithms; (b) Comparison of Davies–Bouldin Index Across Multiple Algorithms.
IDPC outperforms the other algorithms across all sample sizes in terms of both SC and DB values. Its SC values are consistently the highest, indicating that the clusters formed by IDPC have more homogeneous internal characteristics and more distinct inter-cluster differences. Simultaneously, IDPC maintains the lowest DB values with minimal fluctuation as the sample size increases.
In contrast, traditional DPC experiences a sharp increase in DB value to 3.43 when the sample size exceeds 800. This is due to its sensitivity to variations in data density, which can result in issues such as “small clusters being absorbed by larger ones” or “excessive dispersion within clusters” in large-scale datasets. IDPC, by optimizing the density peak calculation method, enhances robustness against changes in data distribution. Even as the sample size increases from 200 to 1000, DB values fluctuate only slightly around 1.4, demonstrating the robustness of its clustering structure.
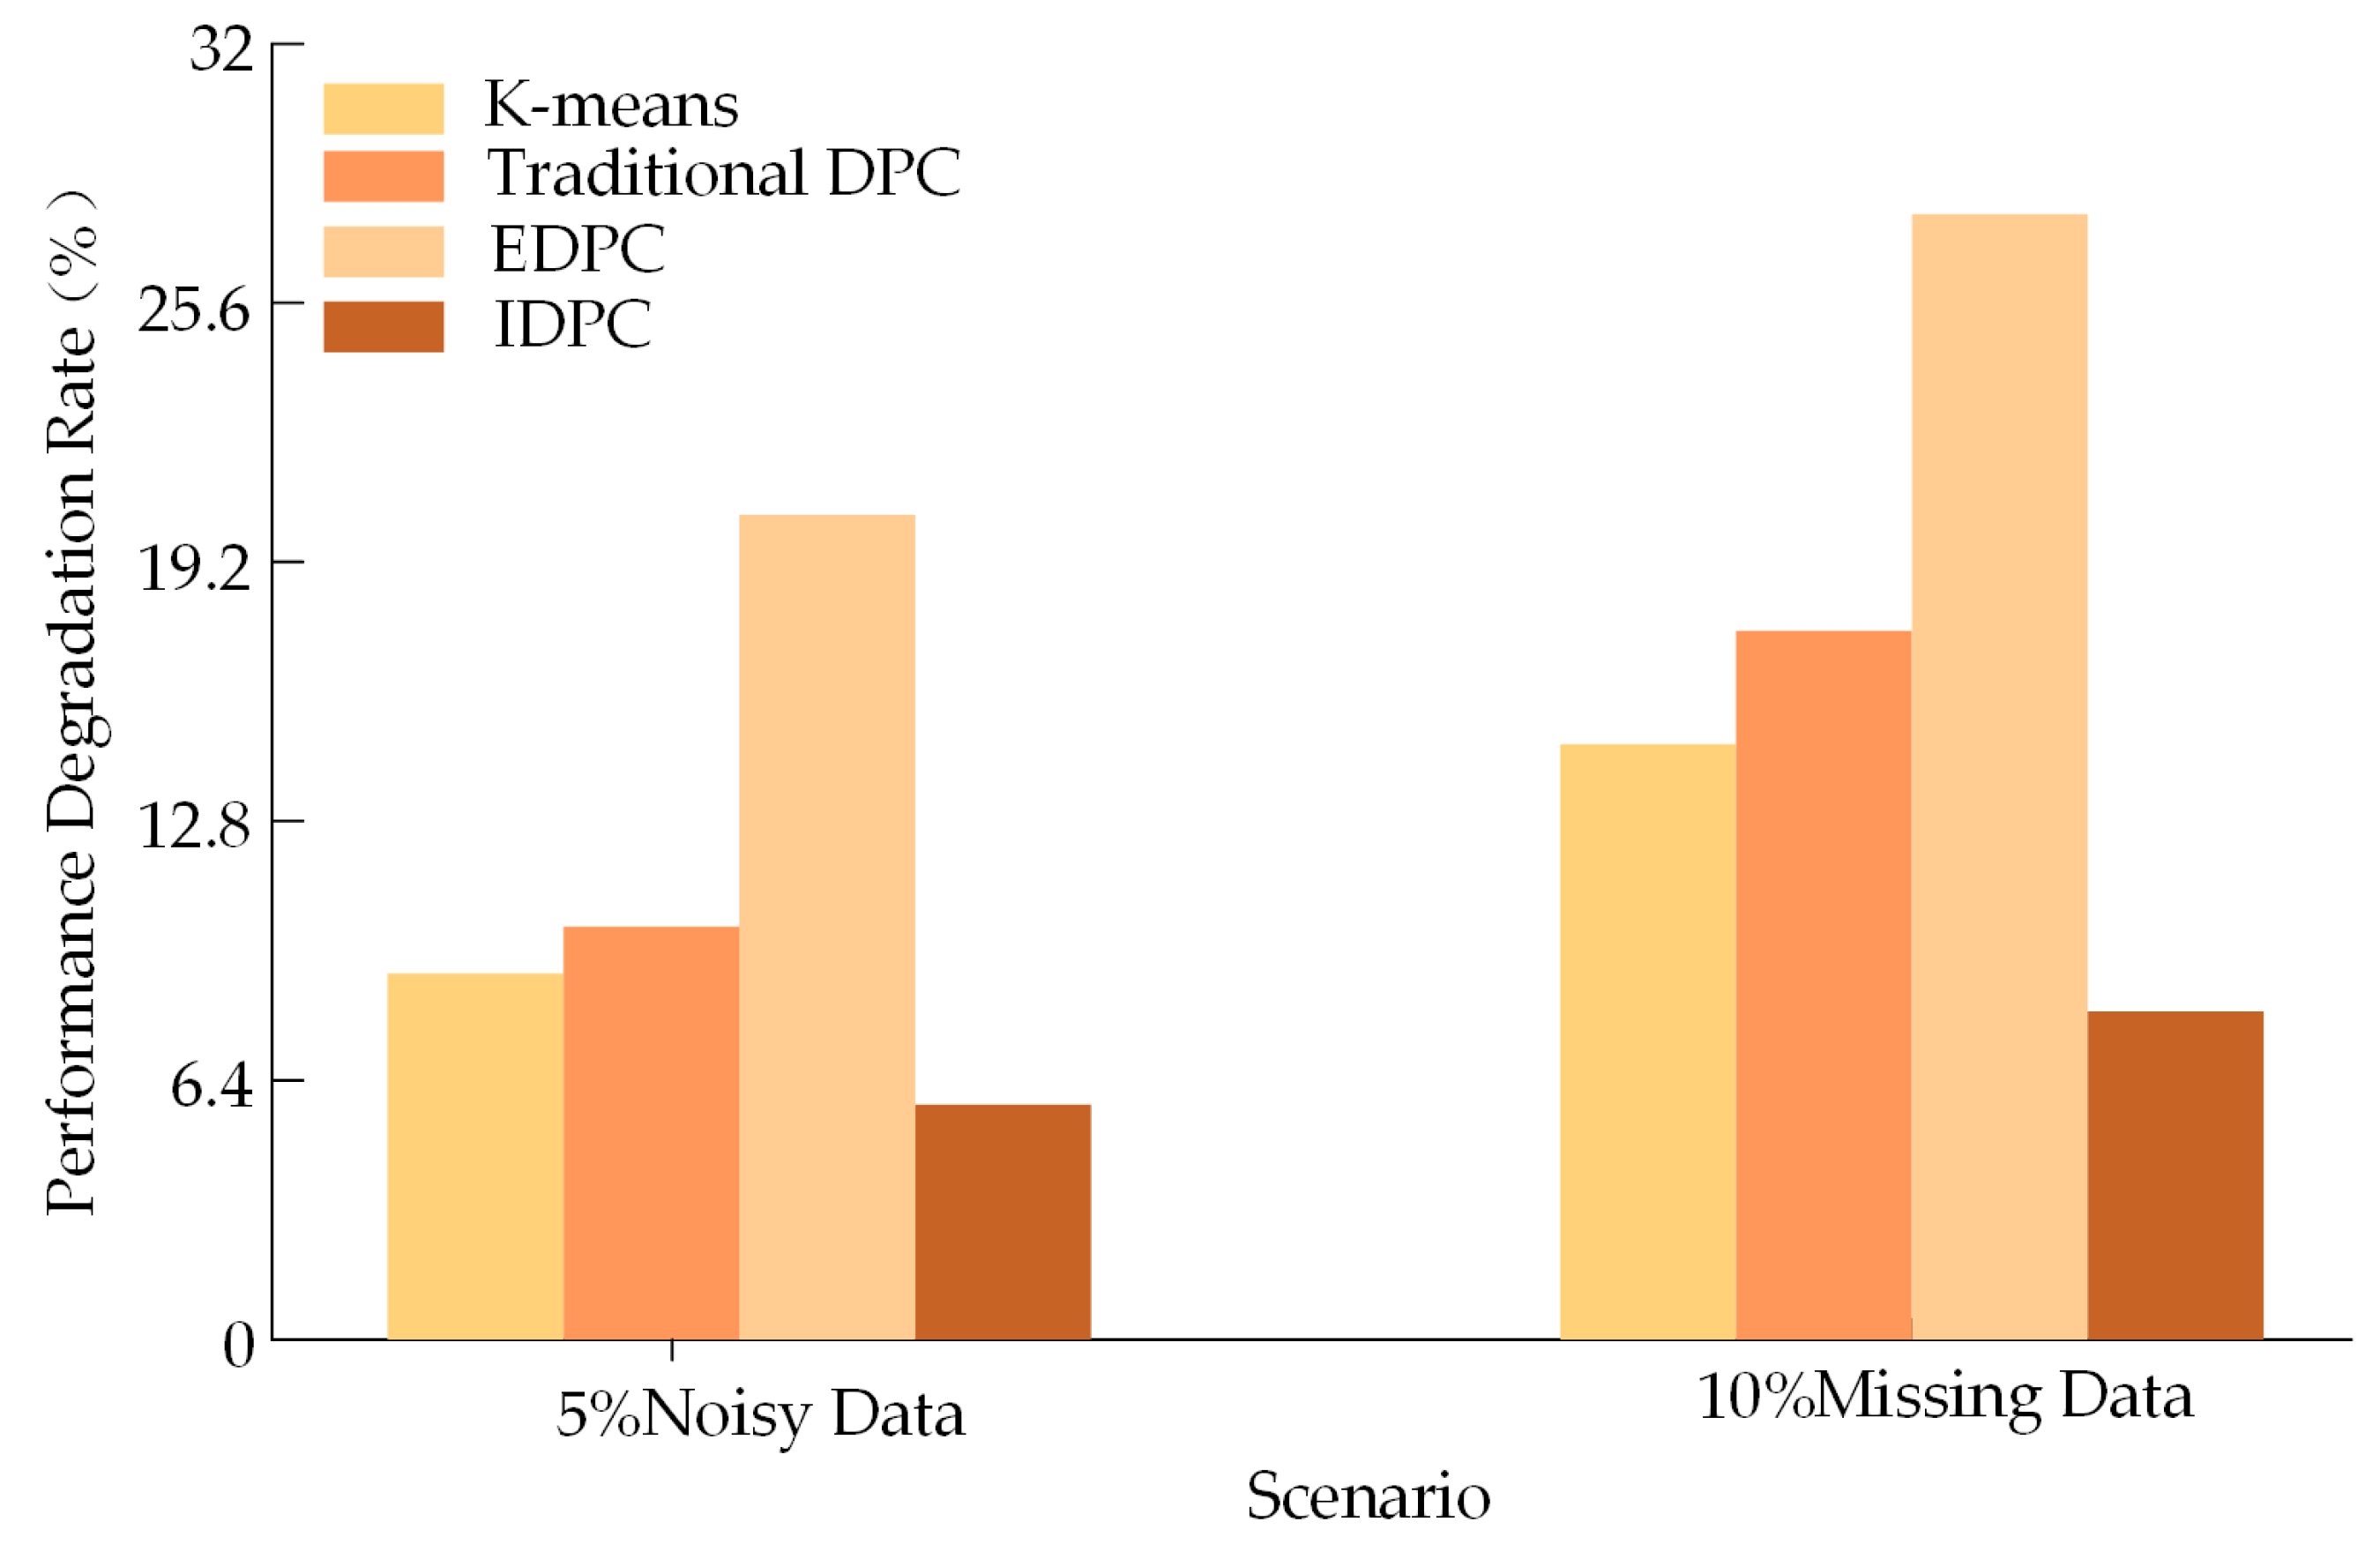
Regarding clustering robustness against interference, the algorithms were tested under simulated practical scenarios involving data noise (5% random perturbation of feature values) and data missingness (10% random missing values). The stability results are illustrated in Figure 6.
Figure 6.
Comparison of Performance Degradation Rates of Four Algorithms under Different Scenarios.
As shown in Figure 6, the performance degradation rate of the IDPC algorithm under both scenarios is significantly lower than that of the other algorithms (5.8–8.1%). This advantage stems from the dynamic weight adjustment mechanism introduced during clustering, which effectively mitigates the interference of outliers or missing values on cluster center identification. This demonstrates that IDPC exhibits the strongest stability when handling real-world data with quality fluctuations.
3.5.2. Comparison of Recommendation Strategies
To further validate the effectiveness and superiority of the proposed electricity package recommendation method, three alternative recommendation strategies were designed for comparison. Spearman’s rank correlation coefficient is adopted as the core evaluation metric, measuring the degree of consistency between the recommended ranking and actual user preferences. A value closer to 1 indicates higher alignment and better recommendation accuracy.
- Method 1: This method only uses group utility values as the evaluation criterion.
- Method 2: This method has no user clustering; recommendations are based directly on the average evaluations of all users.
- Method 3: This method employs equal weighting and does not differentiate attribute priorities dynamically.
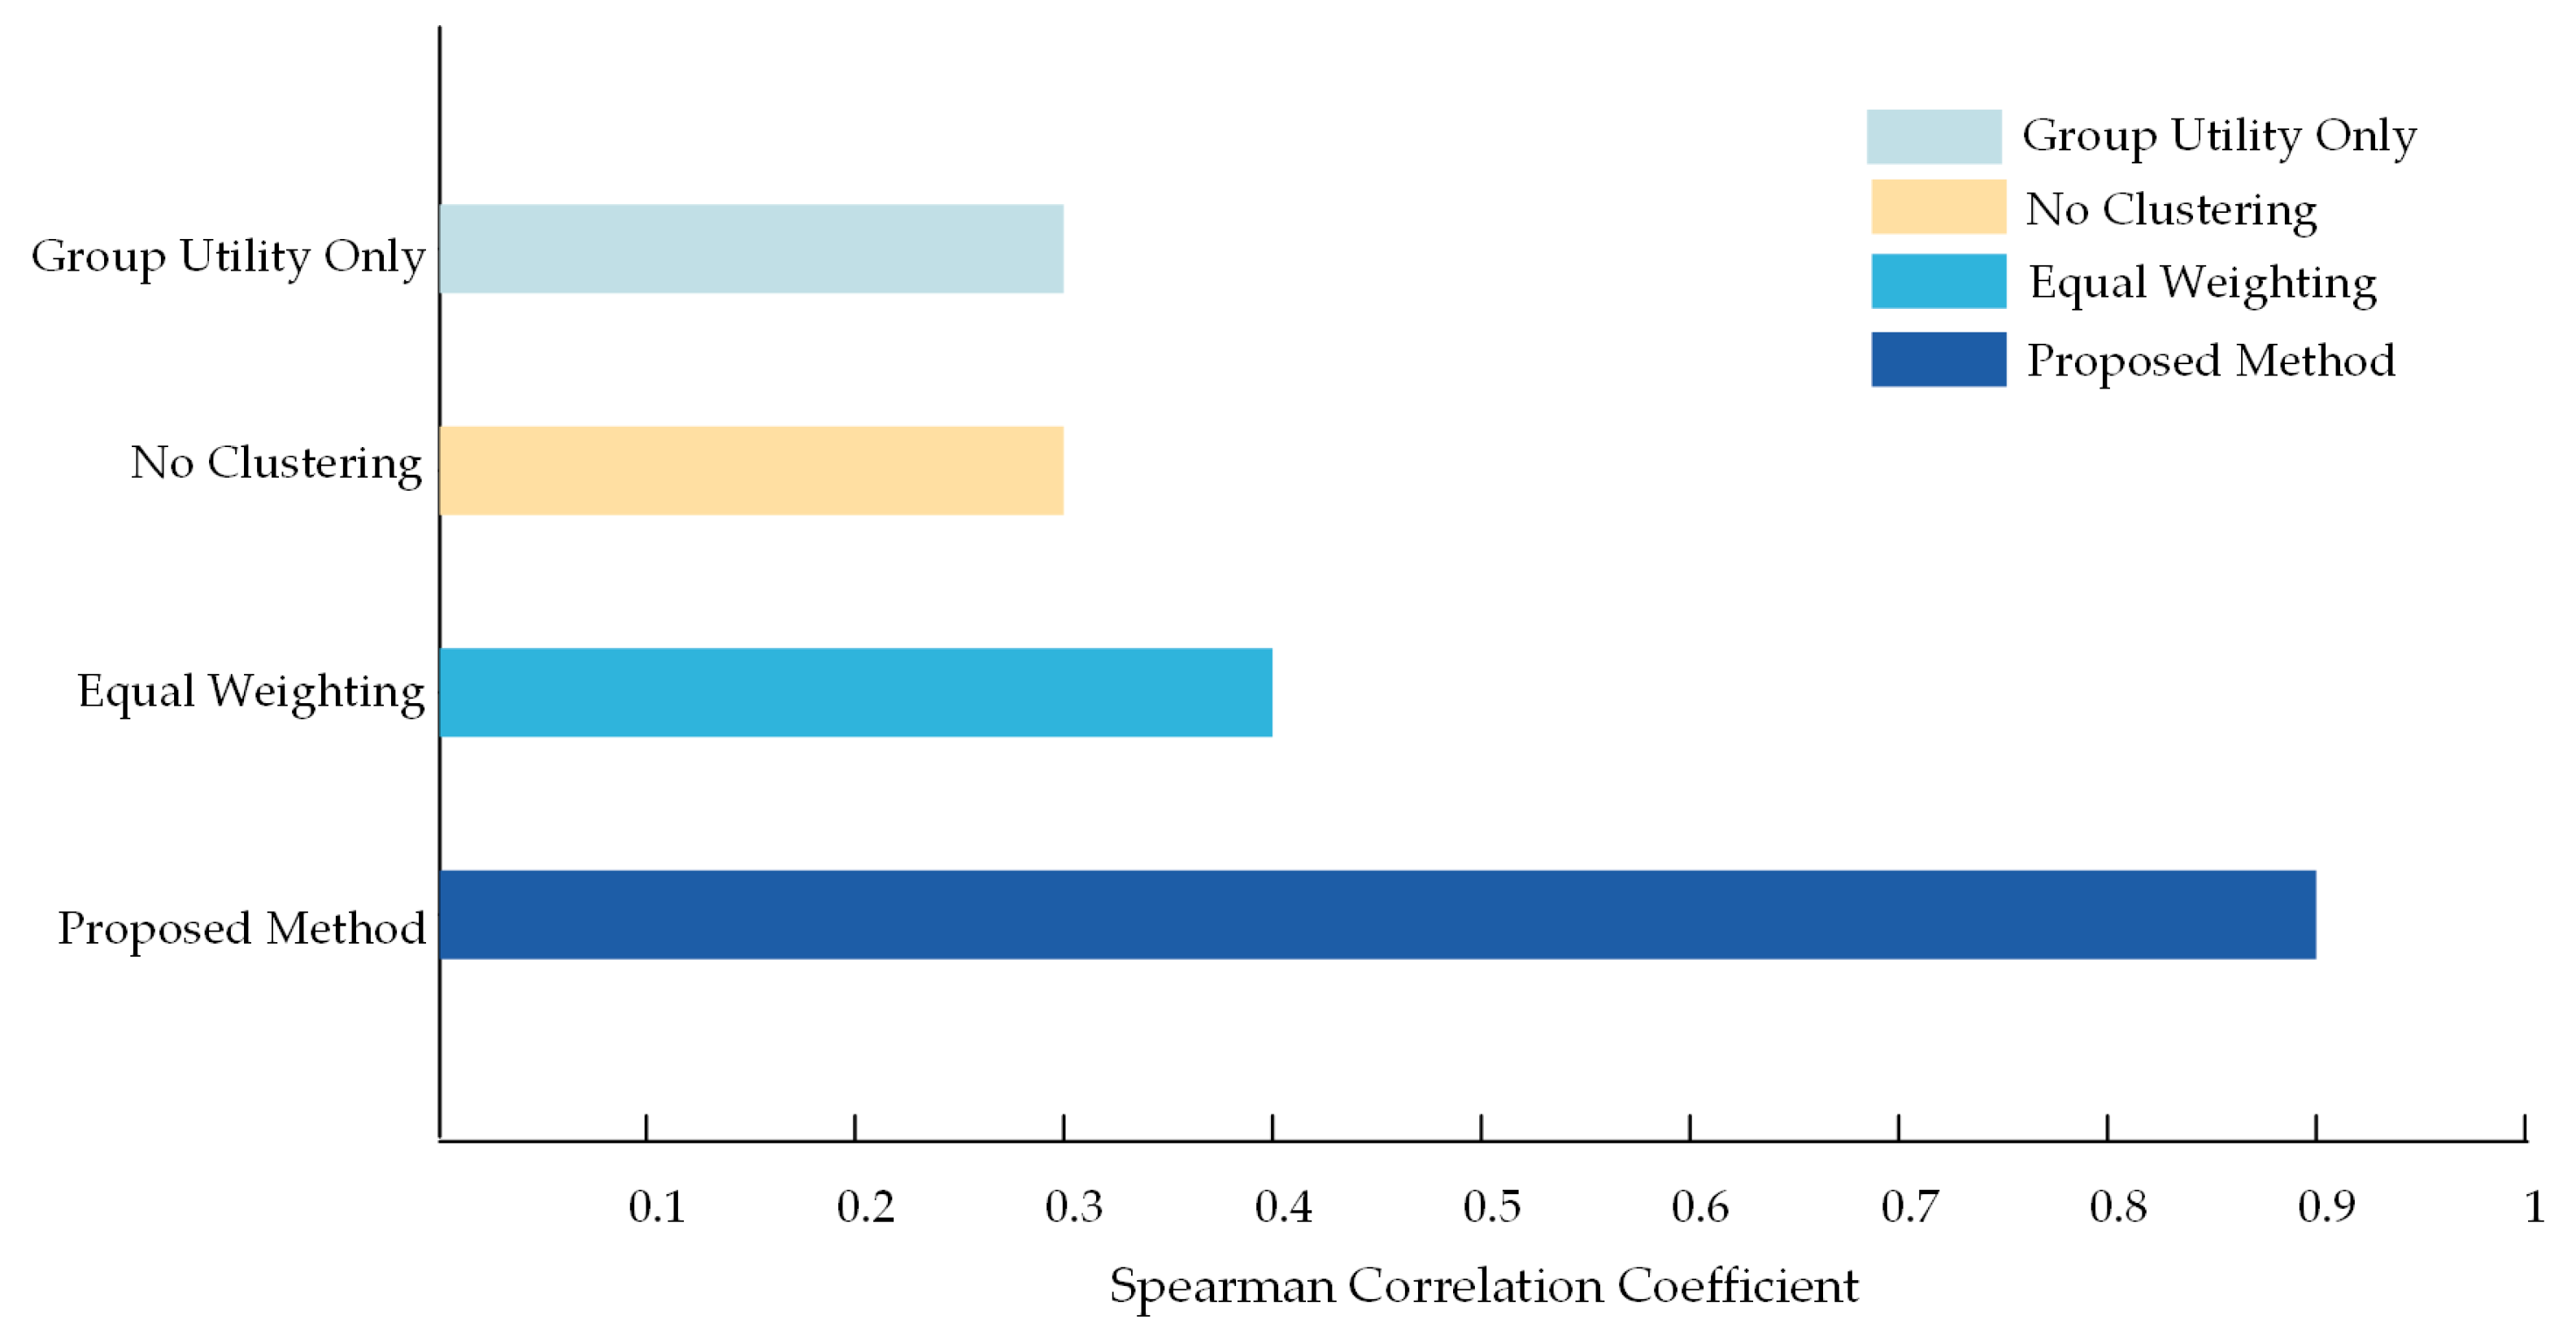
- The comparison of Spearman correlation coefficients between these three methods and the proposed method is illustrated in Figure 7.
Figure 7. Comparison of Spearman Correlation Coefficients of Different Recommendation Methods.
The results indicate that the Spearman correlation coefficient of the proposed method is significantly higher than that of the other methods, demonstrating that its recommended ranking deviates least from actual user preferences. A deeper analysis reveals the following:
Method 1 focuses solely on maximizing group utility, which marginalizes individual user needs and results in higher individual regret values, underscoring the necessity of the MCRM-based comprehensive evaluation.
Method 2 ignores user heterogeneity. In electricity retail scenarios, industrial, commercial, and residential users have fundamentally different consumption requirements (e.g., industrial users prioritize supply stability, whereas residential users are more price-sensitive). Aggregating all users leads to recommendation logic that diverges from real needs, highlighting that accurate user segmentation is a key prerequisite for personalized recommendations.
Method 3, although an improvement over the first two, uses equal weighting, which fails to adapt to different user priorities across attributes, making it unable to accurately capture the true ranking logic and leading to overall deviations from actual preferences. This demonstrates the core value of the dynamic weight model in capturing real user preferences.
In summary, the comparative analysis confirms that the proposed method significantly outperforms single-dimension, non-clustered, or equal-weight approaches in both recommendation accuracy and the coordinated optimization of group and individual needs, providing electricity retailers with a more scientifically grounded recommendation strategy.
4. Discussion
Empirical results based on a real-world user dataset from a region in Eastern China demonstrate the robustness, generalization capacity, and scenario-specific appropriateness of the proposed approach. Compared with conventional clustering and recommendation algorithms, the Improved Density Peak Clustering (IDPC) model delivers marked improvements in clustering accuracy, recommendation precision, and robustness against data interference. Across datasets of various scales, IDPC consistently maintains a high Silhouette Coefficient and a stable Davies–Bouldin Index of around 1.4, suggesting that it effectively distinguishes user feature groups with clear and well-defined boundaries. Even when 5% noise and 10% missing data are introduced, its performance degradation remains within 5.8–8.1%, clearly surpassing that of K-means, traditional DPC, and Enhanced Density Peak Clustering (EDPC).
The proposed recommendation framework achieved a Spearman correlation coefficient of 0.9 between predicted rankings and simulated actual selections, substantially higher than three benchmark approaches: “group utility only,” “average evaluation without clustering,” and “equal weight balance.” This high correlation demonstrates that the method effectively balances collective utility and individual regret while accurately reflecting user heterogeneity and dynamic preferences.
Importantly, the framework is specifically designed to match the characteristics of electricity retail package recommendation scenarios. IDPC captures diverse consumption patterns, automatically identifying arbitrary-shaped clusters corresponding to industrial, residential, or mixed users. Dynamically adjusted weights represent attribute importance and temporal evolution, while trapezoidal fuzzy numbers integrated with the Multi-Criteria Compromise Ranking Method (MCRM) [,] formally handle cognitive fuzziness and dynamic weight variations. This design ensures that the framework not only produces high-performance results but is inherently suitable for addressing the research question: personalized, accurate package recommendations in a complex, uncertain, and multi-criteria decision environment.
Compared with existing studies, the contributions of this work are distinctive. Many prior works rely on collaborative filtering or traditional recommendation algorithms [], which often struggle with the “cold start” problem and do not explicitly model multi-criteria preferences. Other studies employ MCDM methods [] but assume precise, deterministic user inputs. By introducing trapezoidal fuzzy numbers, our framework formally captures the inherent uncertainty and ambiguity of user evaluations—a key challenge recognized in behavioral decision-making but often neglected in electricity retail research. While previous clustering studies [,] effectively identify load patterns, they do not fully integrate dynamic preference modeling and fuzzy evaluations into recommendation generation. The proposed IDPC-MCRM framework combines clustering and fuzzy multi-criteria decision-making, achieving a Spearman correlation coefficient of 0.9—a notable improvement of over 10 percentage points compared with baseline clustering–recommendation models []. These results indicate that the approach not only strengthens theoretical integration but also provides tangible gains in recommendation accuracy, precision, and interpretability.
5. Conclusions
With the continuous liberalization of the electricity retail market and the intensifying competition, electricity retailers face not only diversified user demands but also the challenge of balancing multi-dimensional decision factors in a dynamic environment when designing personalized package strategies. Accurate recommendation of electricity retail packages has become essential for improving user satisfaction and enhancing the competitiveness of retailers. This study addresses limitations in existing approaches, including the subjectivity of user clustering, the fuzziness of decision-making information, and insufficient consideration of temporal dynamics, and proposes a novel recommendation framework integrating the Improved Density Peaks Clustering (IDPC) and a trapezoidal fuzzy multi-attribute group decision-making model based on the Multi-Criteria Compromise Ranking Method (MCRM). This framework provides a systematic solution for user segmentation and optimal package recommendation under complex conditions.
The core contribution of this study lies in achieving personalized and precise electricity retail package recommendations. Firstly, an adaptive IDPC model improved by Particle Swarm Optimization (PSO) is proposed to objectively identify similar users and form homogeneous user groups, overcoming the subjectivity of conventional clustering methods. Secondly, a dynamic multi-attribute group decision-making framework integrating user weights, attribute weights, and time weights is constructed, incorporating trapezoidal fuzzy numbers to address the fuzziness and heterogeneity of evaluation information, thereby better capturing the complexity of user cognition and behavior. Furthermore, the proposed framework applies the Multi-Criteria Compromise Ranking Method (MCRM) to comprehensively evaluate trade-offs between group utility and individual satisfaction for each candidate package, producing a full ranking of package recommendations that balances collective benefit and personalized relevance. The case study results demonstrate that the proposed method achieves superior recommendation accuracy and consistency compared to benchmark approaches, confirming its effectiveness in enhancing decision support for electricity retailers.
Future research can be extended in several directions. First, user behavior prediction and load dynamic modeling should be integrated to enable adaptive updating of user profiles and similar user groups, thereby better addressing the time-varying characteristics of electricity markets. Second, additional psychological, environmental, and personalized factors should be introduced to enhance the interpretability and applicability of the model. Third, cold-start strategies based on broader market data should be explored to tackle recommendation challenges for newly registered users or scenarios with sparse evaluation data, thereby improving the generalization capability and practical applicability of the framework.
Author Contributions
Conceptualization, X.J. and Y.Z.; methodology, X.J. and Y.Z.; validation, X.J. and Y.Z.; formal analysis, X.J.; investigation, Y.Z.; resources, X.J.; data curation, Y.M.; writing—original draft preparation, X.J. and Y.Z.; writing—review and editing, X.J. and Y.Z.; visualization, Y.M.; supervision, Y.M.; project administration, Y.M.; funding acquisition, Y.M. All authors have read and agreed to the published version of the manuscript.
Funding
This is supported by the Natural Science Foundation of China (No. 72301248).
Institutional Review Board Statement
Not applicable.
Informed Consent Statement
Not applicable.
Data Availability Statement
The data that support the findings of this study are available from the corresponding author upon reasonable request.
Conflicts of Interest
The authors declare no conflicts of interest.
Abbreviations
| Set of electricity retail packages | |
| Set of evaluation attributes | |
| Set of all users | |
| The -th similar user group | |
| Learning factors for the PSO algorithm | |
| Cut-off distance for the DPC algorithm | |
| Quarterly electricity consumption of user | |
| Quarterly consumption volatility of user | |
| Quarterly load factor of user | |
| Average peak load ratio of user | |
| Average valley load ratio of user | |
| Inertia weight for the PSO algorithm | |
| Profile vector of user | |
| Trapezoidal fuzzy evaluation value | |
| Weight of user within a group | |
| Weight of evaluation attribute | |
| Weight of time period | |
| Fuzzy positive and negative ideal solutions for attribute | |
| Comprehensive compromise value of package in period | |
| Final comprehensive compromise value of package | |
| Individual regret value of package in period | |
| Group utility value of package in period | |
| Relative distance of user | |
| Local density of user |
References
- Wang, L. International Energy Agency: The outline of an “electrified world” is gradually becoming clear. China Energy News, 4 November 2024. [Google Scholar]
- Fotis, G.; Maris, T.I.; Mladenov, V. Risks, Obstacles and Challenges of the Electrical Energy Transition in Europe: Greece as a Case Study. Sustainability 2025, 17, 5325. [Google Scholar] [CrossRef]
- Anderson, E.; Ferris, M.; Philpott, A.; Anitescu, M.; Cramton, P.; Geng, S.; Green, R.; Homem-de-Mello, T.; Huber, O.; Leclère, V.; et al. Ten Challenges for Mathematical Modeling of the Green-Energy Transition. Curr. Sustain./Renew. Energy Rep. 2025, 12, 26. [Google Scholar] [CrossRef]
- Wang, M.; He, Y.; Lu, Y. Experience and enlightenment of retail electricity price package system design in Japan’s electricity market. J. North China Electr. Power Univ. (Soc. Sci. Ed.) 2021, 1, 48–55. [Google Scholar]
- Tokyo Electric Power Company Holdings, Inc. Available online: https://www.tepco.co.jp (accessed on 25 July 2025).
- Ye, Y.; He, Y.; Chen, F.; Liu, P. Development experience and enlightenment of retail electricity price package system in the UK. Electr. Power Demand Side Manag. 2020, 22, 97–100. [Google Scholar]
- Office of Gas and Electricity Markets (Ofgem). Available online: https://www.ofgem.gov.uk (accessed on 25 July 2025).
- He, Y.; Chen, F.; Ye, Y.; Liu, P.; Gao, X. Experience and enlightenment of retail electricity price packages in the Australian market. Smart Power 2019, 47, 19−23+28. [Google Scholar]
- iSelect. Available online: https://www.iselect.com.au/energy/ (accessed on 25 July 2025).
- Wang, X.; Liu, C.; Wu, B.; Wang, W.; Sun, Y.; Peng, J.; Liu, X.; Zhang, K. Design strategy of electricity purchase and sale combination package based on the characteristics of electricity prosumers in power system. Processes 2024, 12, 2836. [Google Scholar] [CrossRef]
- Han, X. Research on Demand-Side Electricity Retail Operation Strategies Adapting to the New Electricity Market. Master’s Thesis, Shenyang University of Technology, Shenyang, China, 2023. [Google Scholar]
- Yang, T. Research on Electricity Sales Strategy for Users Participating in Ancillary Services. Master’s Thesis, Southeast University, Nanjing, China, 2023. [Google Scholar]
- Li, T. Research on Differentiated Pricing of Electricity Retail Packages. Master’s Thesis, North China Electric Power University, Beijing, China, 2023. [Google Scholar]
- Anvari, M.; Proedrou, E.; Schäfer, B.; Beck, C.; Kantz, H.; Timme, M. Data-driven load profiles and the dynamics of residential electricity consumption. Nat. Commun. 2022, 13, 4593. [Google Scholar] [CrossRef]
- Jin, L.; Spurlock, A.; Borgeson, S.; Fredman, D.; Hans, L.; Patel, S.; Todd-Blick, A. Load Shape Clustering Using Residential Smart Meter Data: A Technical Memorandum; Lawrence Berkeley National Laboratory: Berkeley, CA, USA, 2016. [Google Scholar]
- Ma, Y.; Li, Q.; Chen, H.; Zhang, Z.; Lin, Z.; Yang, L. Recommendation method for electricity retail plan based on BLAP clustering and multigranular hesitant fuzzy sets. Autom. Electr. Power Syst. 2023, 47, 96–104. [Google Scholar]
- Yang, J.; Wang, G.; Pang, Z. Research on issues related to density peak clustering. J. Nanjing Univ. (Nat. Sci.) 2017, 53, 791–801. [Google Scholar]
- Gao, Z.; Du, K. Improved research based on particle swarm optimization algorithm. Value Eng. 2025, 44, 101–103. [Google Scholar]
- Aranganayagi, S.; Thangevel, K. Clustering categorical data using silhouette coefficient as a relocating measure. In Proceedings of the International Conference on Computational Intelligence and Multimedia Applications (ICCIMA 2007), Sivakasi, India, 13–15 December 2007; pp. 13–17. [Google Scholar]
- Jiang, L.; Liang, J.; Liu, X.; Xu, X. Research on the calculation method of flow through a control gate based on the PSO-SVM model. J. Yellow River Conserv. Technol. Inst. 2023, 35, 6–10. [Google Scholar]
- Wu, Y. Research on Multi-Attribute Group Decision-Making Method Based on Extended Triangular Fuzzy Numbers. Master’s Thesis, Xi’an Technological University, Xi’an, China, 2025. [Google Scholar]
- Zhang, L.; Ni, J. Order priority of interval intuitionistic fuzzy numbers and its application in group evaluation. Math. Pract. Theory 2023, 53, 223–231. [Google Scholar]
- Jin, W. Research on Multi-Attribute Decision-Making Methods Under Multi-Granularity Hesitant Fuzzy Language. Master’s Thesis, East China Jiaotong University, Nanchang, China, 2024. [Google Scholar]
- Fei, T. Research on Multi-Attribute Group Decision-Making Method Based on Probabilistic Interval-Valued Hesitant Fuzzy Information. Master’s Thesis, Sichuan Normal University, Chengdu, China, 2025. [Google Scholar]
- Qi, C. Hybrid multi-attribute group decision-making method based on trapezoidal fuzzy MULTIMOORA. Stat. Decis. 2019, 35, 41–45. [Google Scholar]
- Chen, Y.; Xiao, H.; Xiong, C. Research on objective weighting method based on entropy function and maximizing deviation. Hoist. Convey. Mach. 2020, 7, 75–79. [Google Scholar]
- Zhang, S.; Zhang, M.; Chi, G. Scientific and technological evaluation model based on entropy weight method and its empirical research. Manag. J. 2010, 7, 34–42. [Google Scholar]
- Kishor, A.; Singh, A.K.; Pal, N.R. Orness measure of OWA operators: A new approach. IEEE Trans. Fuzzy Syst. 2014, 22, 1039–1045. [Google Scholar] [CrossRef]
- Yang, W.; Wu, Y. A new improvement method to avoid rank reversal in VIKOR. IEEE Access 2020, 8, 21261–21271. [Google Scholar] [CrossRef]
- Lin, P.; Dong, C.; Liu, P. Dynamic hybrid multi-attribute group decision making method based on trapezoidal fuzzy numbers. J. Hebei Univ. (Nat. Sci. Ed.) 2024, 44, 337–345. [Google Scholar]
- Bao, H.; Li, H.; Liu, T.; Ke, Q.; Zhang, J. A multi-attribute decision-making method for green product design based on P-hesitant fuzzy sets and VIKOR. Comput. Integr. Manuf. Syst. 2024, 30, 3492–3501. [Google Scholar]
- Yang, J.; Li, L. VIKOR method for dynamic disturbing fuzzy multi-attribute decision making. J. Neijiang Norm. Univ. 2024, 39, 32–38. [Google Scholar]
- Wang, B.; Yang, F.; Zhang, S. A method of electricity consumption behaviour clustering and pricing packages based on data mining. Inf. Syst. Signal Process. J. 2020, 5, 18–23. [Google Scholar] [CrossRef]
- Yu, D.; Xu, Y. A VIKOR-based method for group decision making with interval type-2 fuzzy numbers. Appl. Soft Comput. 2018, 63, 152–167. [Google Scholar]
- Jeong, H.C.; Jang, M.; Kim, T.; Joo, S.-K. Clustering of load profiles of residential customers using extreme points and demographic characteristics. Electronics 2021, 10, 290. [Google Scholar] [CrossRef]
- Cen, S.; Yoo, J.H.; Lim, C.G. Electricity pattern analysis by clustering domestic load profiles using discrete wavelet transform. Energies 2022, 15, 1350. [Google Scholar] [CrossRef]
- Tang, Y.; Wu, J.; Guo, X. User behavior clustering and electricity package recommendation based on improved fuzzy c-means. IEEE Access 2019, 7, 124356–124365. [Google Scholar]
Disclaimer/Publisher’s Note: The statements, opinions and data contained in all publications are solely those of the individual author(s) and contributor(s) and not of MDPI and/or the editor(s). MDPI and/or the editor(s) disclaim responsibility for any injury to people or property resulting from any ideas, methods, instructions or products referred to in the content. |
© 2025 by the authors. Licensee MDPI, Basel, Switzerland. This article is an open access article distributed under the terms and conditions of the Creative Commons Attribution (CC BY) license (https://creativecommons.org/licenses/by/4.0/).