Abstract
Authenticating the geographical origin of honey is crucial for ensuring its quality and preventing fraudulent labeling. This study investigates the influence of altitude on the mineral composition of honey and comparatively evaluates the performance of chemometric and machine learning models for its geographic discrimination. Honey samples from three distinct altitude regions in Türkiye were analyzed for their mineral content using Inductively Coupled Plasma-Mass Spectrometry (ICP-MS). Results revealed that Calcium (Ca), Potassium (K), and Sodium (Na) were the predominant minerals. A significant moderate negative correlation was found between altitude and Ca concentration (r = −0.483), alongside a weak negative correlation with Copper (Cu) (r = −0.371). Among the five supervised models tested (Partial Least Squares-Discriminant Analysis (PLS-DA), Random Forest (RF), Support Vector Machine (SVM), Extreme Gradient Boosting (XGBoost), and Artificial Neural Network (ANN)), PLS-DA achieved the highest classification accuracy (94.9%). Variable importance analysis consistently identified Ca as the most influential discriminator across all models, followed by Barium (Ba) and Cu. These minerals, therefore, represent key markers for differentiating honey by geographical origin. This research demonstrates that an integrated model utilizing mineral profiles provides a robust, practical, and reliable method for the geographical authentication of honey.
1. Introduction
Honey is a natural substance valued for its nutritional and therapeutic properties, derived from a complex composition of sugars, water, and minor bioactive components such as phenolic compounds, vitamins, and minerals [,]. These components contribute to its recognized health benefits, including potent antioxidant and anti-inflammatory effects [].
The botanical and geographical origin of honey—influenced by factors like soil composition, climate, and altitude—determines its biochemical profile and commercial value [,,,,,]. This variability makes premium products, such as monofloral or Protected Designation of Origin (PDO) and Protected Geographical Indication (PGI) honeys, susceptible to economically motivated adulteration and fraudulent labeling [,,,]. Consequently, developing reliable and precise analytical methods to verify honey authenticity is essential for ensuring consumer safety and fair trade [,,].
Among the various chemical markers used for authentication, mineral elements are particularly effective. Their profile in honey reflects the geochemistry of the local environment (soil and nectar sources) and can also serve as an indicator of environmental or anthropogenic pollution [,,,,]. Advanced analytical techniques, particularly Inductively Coupled Plasma-Mass Spectrometry (ICP-MS), are increasingly employed for their ability to simultaneously quantify multiple elements at low detection limits [,,,]. The resulting complex datasets are well-suited for analysis with chemometric and machine learning (ML) models—such as Principal Component Analysis (PCA), Partial Least Squares-Discriminant Analysis (PLS-DA), Random Forest (RF), and Artificial Neural Networks (ANN)—to identify discriminant markers and classify samples by origin [,,,,,,,,,,,,]. Over the past decade, several studies have shown that mineral and trace element profiles, combined with chemometric and machine learning (ML) techniques, can effectively discriminate the geographical origin of honey. Batista et al. [] used Support Vector Machines (SVMs), Multilayer Perceptron (MLP), and RF, achieving 66–83% accuracy. Fechner et al. [] applied Linear Discriminant Analysis (LDA) on honey from Northeast Argentina, achieving 76% accuracy. Drivelos et al. [] employed Probabilistic Neural Networks (PNN) and Partial Least Squares (PLS), reaching 85% and over 95% accuracy, respectively. Hategan et al. [] compared ANN, SVM, and K-Nearest Neighbors (KNN), with the best ANN-based models achieving 95% accuracy for intercountry classification; 99% of Romanian samples and 73% of samples from other countries were correctly predicted. Mara et al. [] differentiated honey from Italy and Spain using LDA and RF, achieving 90% accuracy. These studies demonstrate the robustness and effectiveness of machine learning methods in accurately classifying honey according to its geographical origin.
Türkiye is the world’s second-largest honey producer [], yet studies on the mineral composition of honey from its Southeastern Anatolia Region remain scarce. This region, particularly the provinces of Siirt and Şırnak, has a long tradition of apiculture and is a key area for organic honey production, with local varieties like Pervari honey (PDO) and Beytülşebap honey (PGI) holding significant cultural and economic value [,,,]. Establishing a robust verification model for honeys from this unique and under-researched area is therefore a critical need.
This study addresses this gap by examining honey samples from three major bee-keeping zones in Siirt and Şırnak at varying altitudes. The primary objectives were to: (1) Quantify the concentration of 16 mineral and heavy metal elements using ICP-MS; (2) Investigate the relationship between apiary altitude and the mineral profile of honey; and (3) Evaluate and compare the performance of five supervised machine learning models for creating a precise and reliable geographic classification model. The ultimate goal is to support honey authentication, ensure safe consumption, and promote equitable food commerce.
2. Materials and Methods
2.1. Sample Collection and Study Area
This investigation focused on multifloral honey specimens collected from three principal apicultural zones in the Siirt and Şırnak provinces of Southeastern Anatolia, Türkiye. Collection sites were selected to represent distinct elevation ranges relevant to regional beekeeping practices. Honey produced outside these designated altitudes was excluded. A total of 39 honey samples were used in the study, and the sample size was determined based on a power analysis to ensure adequate statistical power.
The sampling zones were categorized as follows:
Low-elevation zone (500–900 m a.s.l.): Comprised 12 specimens collected from the Siirt Merkez district.
Mid-elvation zone (1000–1800 m a.s.l.): Comprised 10 specimens collected from apicultural locations in Pervari (Siirt). High-elevation zone (2000–3700 m a.s.l.): Comprised 17 specimens collected from locations in Beytüşşebap (Şırnak).
In the region, the harvesting period occurs between late August and mid-November. During this period, the climatic conditions in the sampling regions, based on official data from the Türkiye State Meteorological Service (1970–2024), were as follows: in Siirt province, the average temperatures were 30.4, 25.6, 18.3, and 10.6 °C, while the average precipitation values were 1.9, 7.0, 49.6, and 81.4 mm, respectively []. In Şırnak province, the average temperatures during the same period were 29.0, 24.6, 17.5, and 9.9 °C, and the average precipitation values were 0.6, 9.5, 45.9, and 82.8 mm, respectively []. The dominant beekeeping flora in Siirt consists mainly of species belonging to the Fabaceae, Lamiaceae, and Asteraceae families [], while in Şırnak, it is characterized by species from the Caryophyllaceae, Fabaceae, Rosaceae, and Apiaceae families [].
Honey specimens (200–300 g) were obtained directly from local apiculturists during the November-December period, following the harvesting season, with logistical support from the Şırnak and Siirt Beekeepers Associations. The locations and altitudes of the honey samples used in this study are provided in Supplementary Material, Table S1. Samples were immediately transferred into sterilized, labeled glass containers. All samples were transported to the laboratory and stored in darkness at 4 °C. Analyses were completed within three months of collection.
2.2. Mineral Content Analysis by ICP-MS
For the analysis of mineral and heavy metal content, each honey specimen (0.2 g) was accurately weighed into a Falcon tube. Sample digestion was performed by adding 65% nitric acid (9 mL) and hydrogen peroxide (1 mL) to each tube. The mixtures were then processed using a microwave extraction system (Cem Mars 5, Matthews, Newyork, NY, USA) at 1200 W power. After cooling, the digested solutions were quantitatively transferred to 20 mL volumetric flasks and diluted to volume with ultrapure water.
Elemental concentrations were determined using an Agilent 7700× Inductively Coupled Plasma-Mass Spectrometer (ICP-MS) (Agilent, Tokyo, Japan). The instrument operating parameters were configured as follows:
- Plasma Power: 1550 W
- Plasma Mode: Normal
- Plasma Gas Flow Rate: 15.0 L/min
- Auxiliary Gas Flow Rate: 1.0 L/min
- Carrier Gas Flow Rate: 0.89 L/min
- Dilution Gas Flow Rate: 0.15 L/min
- Sample Depth: 8.0 mm
- Spray Chamber Temperature: 2 °C
- Kinetic Energy Discrimination: 3 V
- Helium Gas Flow Rate: 4.5 mL/min
Each specimen was analyzed in duplicate to ensure measurement reliability.
2.3. Data Analysis and Machine Learning
All data analyses were performed using IBM SPSS Statistics V23 and the R software environment (v4.5.1). The suitability of the data for normal distribution was assessed using the Shapiro–Wilk test. For normally distributed data across three or more categories, a one-way ANOVA with Tamhane’s T2 post hoc test was employed. For non-normally distributed data, the Kruskal–Wallis test with Dunn’s multiple comparison test was used. The relationship between altitude and mineral content was evaluated using Spearman’s rho correlation coefficient. A significance threshold of p < 0.05 was established for all statistical tests.
To explore the underlying patterns in the mineral data, Principal Component Analysis (PCA) was employed as an unsupervised method. All element concentrations were log-transformed (ln) and autoscaled to ensure zero mean and unit variance. Principal Component Analysis was performed in R using the FactoMineR and factoextra packages. Components with eigenvalues greater than 1 were considered.
To evaluate the discriminatory capability of the mineral profiles for classifying honey by altitude zone, five supervised machine learning models were implemented: Partial Least Squares-Discriminant Analysis (PLS-DA), Random Forest (RF), Support Vector Machine (SVM), Artificial Neural Network (ANN), and Extreme Gradient Boosting (XGBoost).
Partial Least Squares-Discriminant Analysis was applied using the mixOmics package in R. All variables were autoscaled prior to modeling. The optimal number of components was determined using 5-fold cross-validation, with three components selected for the final model. Model performance was evaluated via 10 repeated 5-fold cross-validations using the perf() function.
Random Forest modeling was performed using the caret and randomForest packages. The mtry parameter was optimized using 5-fold cross-validation, and performance was assessed based on out-of-fold predictions.
Support Vector Machines with a Radial Basis Function (RBF) kernel were implemented using the caret and pROC packages. Hyperparameters C (cost) and sigma were optimized over a wide range, and 5-fold cross-validation was used to evaluate model performance.
Extreme Gradient Boosting was applied for geographical classification using the “xgbTree” method in caret and pROC. Hyperparameters eta, max_depth, gamma, colsample_bytree, and min_child_weight were optimized via 5-fold cross-validation.
Finally, an ANN was constructed using the caret and nnet packages. All variables were autoscaled, and 5-fold cross-validation was applied. Different numbers of hidden neurons (3, 5, and 7) and weight decay values (0, 0.001, 0.01, and 0.1) were tested to optimize performance.
Model performance was assessed using a 5-fold cross-validation (CV) procedure with out-of-fold (OOF) predictions. In each iteration, four folds were used for training and one for testing, so that every sample contributed once as test data and four times as training data. This strategy was applied consistently across all supervised chemometric models (PLS-DA, SVM, RF, XGBoost, and ANN), allowing each sample to participate in both training and evaluation, which provides more reliable performance estimates and minimizes generalization error. The effectiveness of each model was then compared using multiple performance metrics, including accuracy, recall (True Positive Rate, TPR), precision (Positive Predictive Value, PPV), F1 score, specificity (True Negative Rate, TNR), Matthews Correlation Coefficient (MCC), and the area under the ROC curve (AUC). Furthermore, variable importance scores were calculated for each classification method to identify the most significant minerals for geographical discrimination.
3. Results
3.1. Mineral Composition of Honey
The mineral profiles of honey specimens from low-, mid-, and high-altitude apicultural zones were determined. A summary of the mean and median concentrations for each element is presented in Table 1. The total mean mineral content was 366.18 mg/kg for the low-altitude zone, 409.32 mg/kg for the mid-altitude zone, and 265.98 mg/kg for the high-altitude zone. Notably, the mid-altitude area exhibited the highest overall mineral levels, whereas the high-altitude area was characterized by the lowest concentrations. Statistical analysis revealed significant differences among the regions for Barium (Ba; p = 0.032), Calcium (Ca; p = 0.002), and Copper (Cu; p = 0.033).

Table 1.
Comparison of minerals in honey samples from three different altitudes. Values are presented as mean and median, in mg/kg.
3.1.1. Macro Elements
The mean concentrations of macro elements varied according to the altitude of the collection region. In both the low- and mid-altitude zones, the decreasing order of concentration was Ca > K > Na > Mg. In contrast, honey from the high-altitude zone exhibited a different pattern: K > Ca > Mg > Na. A distinct trend was observed where increasing altitude corresponded with a decrease in Ca concentration.
The mean potassium (K) concentration across the sampled regions ranged from 108 to 123.6 mg/kg (Table 1). Although the absolute K level was lowest in the high-altitude zone, its relative contribution to the total mineral content was highest in this group (40.75%). For comparison, K has been reported to constitute up to 84.04% of the total mineral content in Romanian honeys []. The K levels determined in this study were lower than values previously documented for Turkish honeys [,,,], as well as for honeys from Saudi Arabia and Spain [,]. However, they were higher than those reported by Kılıç Altun et al. [].
Calcium (Ca) levels in honey from the high-altitude zone were significantly lower than those from the other zones. The highest Ca concentration (187.96 mg/kg), representing 45% of the total mineral content, was observed in honey from the mid-altitude zone. This value is comparable to concentrations reported for Spanish [], Italian [], and other Turkish honeys [,,].
Regarding sodium (Na) and magnesium (Mg), no significant differences were observed among the regions. Nevertheless, the Na levels were lower than those reported in certain previous Turkish studies [,,], while Mg levels were similar to those documented by Yılmaz and Yavuz [] and Yücel and Sultanoğlu [].
3.1.2. Trace Elements
Among the analyzed trace elements, Ba was found at its highest median concentration (0.39 mg/kg) in honey from the mid-altitude zone, which was significantly different from the low-altitude zone. Copper exhibited its highest concentration (0.46 mg/kg) in the low-altitude zone, a level that was statistically different from that of the high-altitude zone.
When considering all 39 honey specimens collectively, the median concentrations of trace elements followed the decreasing order: Zn > Fe > Al > Cu > Mn > Ni > Cr > Ba > Sr > Co. The corresponding values were 4.17, 3.46, 2.85, 0.37, 0.35, 0.32, 0.31, 0.21, 0.20, and 0.02 mg/kg, respectively (Supplementary Material, Table S2).
The concentrations of Al, Co, Cu, Fe, and Ni determined in this investigation are consistent with those documented for Argentine honeys; however, Ba and Zn concentrations were higher, while Mn concentrations were lower in comparison []. Additionally, the Zn values align with those reported for honeys from Saudi Arabia and six other countries [].
3.1.3. Heavy Metals
Lead (Pb), a key indicator of environmental contamination, was detected at its lowest concentration in the mid-altitude zone (0.07 mg/kg) and highest in the low-altitude zone (0.11 mg/kg). Although this highest observed value is lower than concentrations reported in previous studies [,,,], it exceeds the maximum permissible level of 0.10 mg/kg established by the European Union for honey due to potential consumer toxicity []. The location associated with this elevated value, Siirt Merkez, is a residential area with industrial and agricultural activities. This finding underscores the importance of conducting beekeeping operations at a distance from potential sources of heavy metal contamination to ensure honey safety.
In contrast, cadmium (Cd), another important pollution marker, exhibited similar concentrations across all three zones. The Cd values determined in this study were higher than those reported for Swiss honeys (0.003 mg/kg) [] but were generally lower than values obtained from honeys across seven countries, including Saudi Arabia (0.00–0.16 mg/kg) [].
3.2. Relationship Between Altitude and Mineral Level
Spearman’s correlation coefficient was used to assess the relationship between the altitude of the apicultural zones and the mineral content of the honey specimens. A statistically significant, moderate negative correlation was identified between altitude and Ca concentrations (r = −0.483; p = 0.002). This aligns with the observation from statistical analyses (Table 1) that Ca concentrations in honey from low- and mid-altitude zones were comparable, while Ca levels in honey from high-altitude zones were significantly lower. In a study conducted in the Silopi district of Şırnak (510 m a.s.l.), Ca levels in 40% of the analyzed soils were reported as “high,” and in the remaining as “very high” [] supporting our finding of elevated Ca levels in honey samples collected from low-altitude areas.
Additionally, a statistically significant, weak negative correlation was detected between altitude and Cu concentrations (r = −0.371; p = 0.020), which is consistent with the significant difference observed between the low- and high-altitude zones. No statistically significant associations were identified between altitude and the remaining minerals analyzed (p > 0.05) (Supplementary Material, Table S3).
These findings differ partially from a study by Grassi et al. [], which documented positive correlations between altitude and Mg, Al, Mn, and Pb, and negative correlations for Na, Cr, V, Co, and Cd in multifloral honeys. While our investigation similarly demonstrated that overall mineral levels were lower in high-altitude honeys, the specific elemental correlations varied.
Although this study establishes a relationship between mineral composition and altitude, it is well-recognized that mineral content is also influenced by other environmental, geographical, and botanical factors [,]. For instance, the mineral composition of honey has been associated with the soil and water characteristics of beekeeping zones [], and levels of elements like Ca, Fe, and Mn can be related to soil and pasture conditions []. Therefore, future studies incorporating floral, soil, and water analyses are recommended to provide a more comprehensive understanding of the factors influencing honey mineral composition.
3.3. Geographical Discrimination of Honey
3.3.1. Principal Component Analysis (PCA)
Prior to analysis, mineral concentrations were transformed using the natural logarithm (ln) to normalize their distribution, and the data were auto-scaled to ensure equal contribution from all variables. The unsupervised PCA method yielded six components with eigenvalues exceeding 1. The first component (PC1) explained 31.99% of the total variance and showed high positive loadings for K, Mg, Fe, Sr, Ba, and Mn. The second component (PC2) accounted for 11.40% of the variance, with positive associations for Ca, Co, and Pb, and negative associations for Cr, Ni, and Zn. Collectively, the first six components explained 73.46% of the total variance, indicating that they substantially captured the principal differences in the mineral dataset (Supplementary Material, Table S4). This level of explained variance is considered highly satisfactory, particularly given the geographical proximity of the sampling zones and the multifloral nature of the honey, which can enhance the effectiveness of geographical differentiation in PCA [].
In a study by Zhou et al. [] examining seven broad geographic groups, the first six components explained a comparable 77.2% of total variance. However, similar to our findings illustrated in the PCA biplot (Figure 1), they observed no clear visual separation of honey specimens by geographic origin in the first two components, highlighting the need for supervised classification methods.
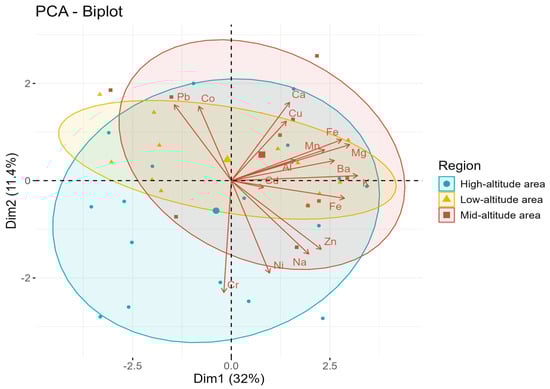
Figure 1.
Biplot of the Principal Component Analysis (PCA).
3.3.2. Supervised Machine Learning Classification Methods
To overcome the limitations of unsupervised analysis, five supervised machine learning models were evaluated for their ability to classify honey by geographical origin. The performance metrics are summarized in Table 2.
Table 2.
Comparative classification performance of different machine learning algorithms.
The Partial Least Squares-Discriminant Analysis (PLS-DA) model exhibited the highest overall performance, achieving an accuracy of 94.9%. The model also demonstrated high sensitivity (recall) and specificity (TNR) across all three zones, with an Area Under the Curve (AUC) of 0.926, indicating robust discriminatory capability.
In contrast, the Random Forest (RF) method yielded the lowest classification accuracy (48.7%). It performed particularly poorly for the low-altitude zone, with low precision (0.182) and recall (0.167), suggesting that RF was inadequate for distinguishing honey specimens in this classification task.
The Support Vector Machine (SVM) model achieved moderate success, with an overall accuracy of 66.7% and an AUC of 0.769. While recall for the mid-altitude group was relatively high (0.667), lower precision constrained the model’s overall performance.
The XGBoost model performed slightly lower than SVM, with an accuracy of 61.5% and an AUC of 0.686, indicating its discriminative ability remained limited.
The Artificial Neural Network (ANN) method outperformed both SVM and XGBoost, achieving 69.2% accuracy and an AUC of 0.820, representing the second-highest performance after PLS-DA. Notably, the ANN model demonstrated high precision (0.824) and recall (0.824) for high-altitude honeys, suggesting it was particularly effective in identifying specimens from this region.
Overall, PLS-DA proved to be the most reliable and effective approach for differentiating honey by geographic origin in this study. Analysis of the Variable Importance in Projection (VIP) scores from the PLS-DA model revealed that Ca, Cu, Fe, and Sr were the most influential minerals for group separation. Specifically, Ca consistently exhibited high VIP scores across all components (Comp1 = 2.44; Comp2 = 2.02; Comp3 = 1.75), confirming its critical role in geographical discrimination. Chromium (Cr) and Ba also contributed significantly to certain components (VIP > 1), whereas Al, Cd, K, Mg, Mn, Na, Ni, Pb, and Zn generally had VIP scores below 1, indicating a limited contribution to group differentiation (Supplementary Material, Table S5). These findings suggest that focusing on Ca, Cu, Fe, and Sr as key discriminatory markers can enhance the efficiency and reliability of geographical authentication models.
3.3.3. Identification of Key Discriminatory Minerals
To identify the most influential minerals driving the classification, variable importance scores were calculated for each supervised model. Across all methods, a consistent pattern emerged, highlighting a small subset of minerals as primary discriminators.
Calcium (Ca) was unequivocally the most important mineral in all models. In the Random Forest (RF) analysis, Ca (Overall importance = 64.43) was followed by Cu (51.37) and Ba (48.65) (Supplementary Material, Table S6). Similarly, in the Support Vector Machine (SVM) model, Ca demonstrated the highest importance across all zones and overall (89.74), again followed by Ba (69.27) and Cu (56.67) (Supplementary Material, Table S7). The XGBoost and Artificial Neural Network (ANN) models reinforced this finding, with Ca receiving the highest importance score (100.00 in both), followed by Ba and Cu (Supplementary Material, Tables S8 and S9). The XGBoost algorithm evaluates variable importance across the entire dataset; hence, separate scores for individual zones were not generated.
Secondary contributors were also identified consistently. Minerals such as Fe, Pb, and Sr provided moderate contributions to classification across most models. For example, in the RF model, Fe, Mn, and Pb showed moderate importance, while in the SVM model, Pb (51.33) and Sr (48.42) were moderately influential.
Several minerals had a negligible impact. Elements like Zn and Ni consistently showed low importance scores, indicating they have limited value for discriminating honey from these specific geographical origins.
In summary, despite the different algorithmic approaches, the models converged on the same key elements. Calcium was consistently identified as the primary discriminative marker for classifying honey according to geographical origin. Barium and Cu were consistently the second and third-most important markers. These findings strongly suggest that Ca, Ba, and Cu can serve as primary indicators for the geographical authentication of honey from this region.
3.3.4. Interpretation of Model Performance Differences
The observed performance disparities among the applied machine learning methods, a phenomenon documented in previous studies [,,], can be attributed to several factors. The relatively small dataset size and the limited variance between the classes (given their geographical proximity) may have favored certain models over others. Furthermore, the inherent characteristics of each algorithm likely contributed to the different outcomes. Among the supervised chemometric algorithms tested, PLS-DA achieved the highest classification performance (94.9% accuracy, AUC = 0.926), demonstrating strong suitability for high-dimensional datasets with limited sample sizes. Its robustness in handling multicollinearity and minimizing overfitting through variance-based component extraction and cross-validation makes it the most stable and generalizable method. In comparison, SVM moderately captured nonlinear patterns, RF and XGBoost were sensitive to class imbalance, and ANN performance was limited by the small sample size. These findings highlight PLS-DA as the most appropriate model for geographical authentication of honey [].
4. Conclusions
This study has demonstrated the influence of altitude on honey mineral composition and developed a robust model for geographical discrimination. Significant regional differences were observed for Ca, Ba, and Cu, with Ca, K, and Na being the most abundant minerals. A moderate negative correlation between altitude and Ca, and a weaker negative correlation with Cu, confirms a distinct mineral profile at higher elevations.
Among five supervised machine learning algorithms, PLS-DA achieved the highest discrimination performance (94.9% accuracy). Ca, followed by Ba and Cu, was consistently identified as the most important marker for geographic differentiation. Overall, combining ICP-MS mineral profiling with machine learning provides a reliable and cost-effective approach for honey origin authentication. Future studies incorporating analyses of local flora, soil, and water are recommended to further enhance predictive power.
Supplementary Materials
The following supporting information can be downloaded at: https://www.mdpi.com/article/10.3390/app152211859/s1, Table S1: Sampling List; Table S2: Descriptive Statistics; Table S3: Examination of the Relationship between Altitude and Minerals; Table S4: PCA Results for Mineral; Table S5: VIP (Variable Importance in Projection) Results for Minerals from PLS-DA; Table S6: Importance of Minerals According to Random Forest Analysis; Table S7: Importance of Minerals According to SVM (Support Vector Machine) Analysis; Table S8: Importance of Minerals According to XGBoost (Extreme Gradient Boosting) Analysis; Table S9: Importance of Minerals According to ANN (Artificial Neural Network) Analysis.
Author Contributions
Conceptualization, S.G.; methodology, Ş.K.; software, Ş.K.; validation, Ş.K.; formal analysis, S.G.; investigation, S.G.; resources, S.G.; data curation, S.G.; writing—original draft preparation, S.G.; writing—review and editing, Ş.K.; project administration, S.G.; funding acquisition, S.G. All authors have read and agreed to the published version of the manuscript.
Funding
This research was funded by the Southeastern Anatolia Project Regional Development Administration, Organic Agriculture Project, grant number (2015A020020).
Institutional Review Board Statement
Not applicable.
Data Availability Statement
The original contributions presented in the study are included in the article/Supplementary Materials; further inquiries can be directed to the corresponding author.
Acknowledgments
We would like to express our endless gratitude to the Beekeepers Associations of Siirt and Şırnak provinces for their support in collecting the honey samples used in this study, and to Sibel Derviş from Mardin Artuklu University for her contributions to the supervision of the article.
Conflicts of Interest
The authors declare no conflicts of interest.
References
- Soares, S.; Amaral, J.S.; Oliveira, M.B.P.P.; Mafra, I. A Comprehensive Review on the Main Honey Authentication Issues: Production and Origin. Compr. Rev. Food Sci. Food Saf. 2017, 16, 1072–1100. [Google Scholar] [CrossRef] [PubMed]
- Grassi, G.; Capasso, G.; Cillo, A.; Miedico, O.; Pompa, C.; Nardelli, V.; Perna, A.M. Effect of Altitude on Polyphenol Content, Antioxidant Activity and Multi-Element Composition of Wildflower Honey. Appl. Sci. 2025, 15, 3255. [Google Scholar] [CrossRef]
- Barreiros, J.; Cepeda, A.; Franco, C.; Nebot, C.; Vázquez, B. Analysis of minerals in honey and their nutritional implications. J. Food Compos. Anal. 2024, 136, 106733. [Google Scholar] [CrossRef]
- Bogdanov, S.; Haldimann, M.; Luginbühl, W.; Gallmann, P. Minerals in honey: Environmental, geographical and botanical aspects. J. Apic. Res. 2007, 46, 269–275. [Google Scholar] [CrossRef]
- Baroni, M.V.; Podio, N.S.; Badini, R.G.; Inga, M.; Ostera, H.A.; Cagnoni, M.; Gautier, E.A.; García, P.P.; Hoogewerff, J.; Wunderlin, D.A. Linking soil, water, and honey composition to assess the geographical origin of Argentinean honey by multielemental and isotopic analyses. J. Agric. Food Chem. 2015, 63, 4638–4645. [Google Scholar] [CrossRef]
- Rivera-Mondragón, A.; Marrone, M.; Bruner-Montero, G.; Gaitán, K.; de Núñez, L.; Otero-Palacio, R.; Añino, Y.; Wcislo, W.T.; Martínez-Luis, S.; Fernández-Marín, H. Assessment of the Quality, Chemometric and Pollen Diversity of Apis mellifera Honey from Different Seasonal Harvests. Foods 2023, 12, 3656. [Google Scholar] [CrossRef]
- Tlak Gajger, I.; Pavliček, D.; Oreščanin, V.; Varenina, I.; Sedak, M.; Bilandžić, N. Mineral Concentrations in Different Types of Honey Originating from Three Regions of Continental Croatia. Foods 2024, 13, 2754. [Google Scholar] [CrossRef]
- Silva, B.; Gonzaga, L.V.; Maltez, H.F.; Samochvalov, K.B.; Fett, R.; Costa, A.C.O. Exploring the impact of harvest year on the mineral composition of Mimosa scabrella Bentham honeydew honey from Santa Catarina (Brazil) using ICP-MS and chemometric tools. Int. J. Food Sci. Technol. 2024, 59, 5420–5429. [Google Scholar] [CrossRef]
- Drivelos, S.A.; Danezis, G.P.; Halagarda, M.; Popek, S.; Georgiou, C.A. Geographical origin and botanical type honey authentication through elemental metabolomics via chemometrics. Food Chem. 2021, 338, 127936. [Google Scholar] [CrossRef]
- Maione, C.; Barbosa, F., Jr.; Barbosa, R.M. Predicting the botanical and geographical origin of honey with multivariate data analysis and machine learning techniques: A review. Comput. Electron. Agric. 2019, 157, 436–446. [Google Scholar] [CrossRef]
- Cosmina, M.; Gallenti, G.; Marangon, F.; Troiano, S. Reprint of “Attitudes towards honey among Italian consumers: A choice experiment approach”. Appetite 2016, 106, 110–116. [Google Scholar] [CrossRef]
- Danezis, G.P.; Tsagkaris, A.S.; Brusic, V.; Georgiou, C.A. Food authentication: State of the art and prospects. Curr. Opin. Food Sci. 2016, 10, 22–31. [Google Scholar] [CrossRef]
- Everstine, K.D.; Chin, H.B.; Lopes, F.A.; Moore, J.C. Database of Food Fraud Records: Summary of Data from 1980 to 2022. J. Food Prot. 2024, 87, 100227. [Google Scholar] [CrossRef] [PubMed]
- Geana, E.I.; Ciucure, C.T. Establishing authenticity of honey via comprehensive Romanian honey analysis. Food Chem. 2020, 306, 125595. [Google Scholar] [CrossRef] [PubMed]
- Ligor, M.; Kowalkowski, T.; Buszewski, B. Comparative Study of the Potentially Toxic Elements and Essential Microelements in Honey Depending on the Geographic Origin. Molecules 2022, 27, 5474. [Google Scholar] [CrossRef] [PubMed]
- Terrab, A.; González, A.G.; Díez, M.J.; Heredia, F.J. Mineral content and electrical conductivity of the honeys produced in Northwest Morocco and their contribution to the characterisation of unifloral honeys. J. Sci. Food Agric. 2003, 83, 637–643. [Google Scholar] [CrossRef]
- Pohl, P. Determination of metal content in honey by atomic absorption and emission spectrometries. TrAC Trends Anal. Chem. 2009, 28, 117–128. [Google Scholar] [CrossRef]
- Batista, B.L.; da Silva, L.R.S.; Rocha, B.A.; Rodrigues, J.L.; Berretta-Silva, A.A.; Bonates, T.O.; Gomes, V.S.D.; Barbosa, R.M.; Barbosa, F. Multi-element determination in Brazilian honey samples by inductively coupled plasma mass spectrometry and estimation of geographic origin with data mining techniques. Food Res. Int. 2012, 49, 209–215. [Google Scholar] [CrossRef]
- Di Bella, G.; Lo Turco, V.; Potortì, A.G.; Bua, G.D.; Fede, M.R.; Dugo, G. Geographical discrimination of Italian honey by multi-element analysis with a chemometric approach. J. Food Compos. Anal. 2015, 44, 25–35. [Google Scholar] [CrossRef]
- Georgiou, C.A.; Danezis, G.P. Elemental and isotopic mass spectrometry. In Advanced Mass Spectrometry for Food Safety and Quality; Pico, Y., Ed.; Elsevier: Amsterdam, The Netherlands, 2015; pp. 131–243. [Google Scholar] [CrossRef]
- Magdas, D.A.; Guyon, F.; Puscas, R.; Vigouroux, A.; Gaillard, L.; Dehelean, A.; Feher, I.; Cristea, G. Applications of emerging stable isotopes and elemental markers for geographical and varietal recognition of Romanian and French honeys. Food Chem. 2021, 334, 127599. [Google Scholar] [CrossRef]
- Mara, A.; Migliorini, M.; Ciulu, M.; Chignola, R.; Egido, C.; Núñez, O.; Sentellas, S.; Saurina, J.; Caredda, M.; Deroma, M.A.; et al. Elemental Fingerprinting Combined with Machine Learning Techniques as a Powerful Tool for Geographical Discrimination of Honeys from Nearby Regions. Foods 2024, 13, 243. [Google Scholar] [CrossRef] [PubMed]
- Hernández, O.M.; Fraga, J.M.G.; Jiménez, A.I.; Jiménez, F.; Arias, J.J. Characterization of honey from the Canary Islands: Determination of the mineral content by atomic absorption spectrophotometry. Food Chem. 2005, 93, 449–456. [Google Scholar] [CrossRef]
- Fechner, D.C.; Hidalgo, M.J.; Ruiz Díaz, J.D.; Gil, R.A.; Pellerano, R.G. Geographical origin authentication of honey produced in Argentina. Food Biosci. 2020, 33, 100483. [Google Scholar] [CrossRef]
- Zhou, X.; Taylor, M.P.; Salouros, H.; Prasad, S. Authenticity and geographic origin of global honeys determined using carbon isotope ratios and trace elements. Sci. Rep. 2018, 8, 14639. [Google Scholar] [CrossRef]
- Pellerano, R.G.; Uñates, M.A.; Cantarelli, M.A.; Camiña, J.M.; Marchevsky, E.J. Analysis of trace elements in multifloral Argentine honeys and their classification according to provenance. Food Chem. 2012, 134, 578–582. [Google Scholar] [CrossRef]
- Pavlin, A.; Kočar, D.; Imperl, J.; Kolar, M.; Marolt, G.; Petrova, P. Honey Origin Authentication via Mineral Profiling Combined with Chemometric Approaches. Foods 2023, 12, 2826. [Google Scholar] [CrossRef]
- Mateo, F.; Tarazona, A.; Mateo, E.M. Comparative Study of Several Machine Learning Algorithms for Classification of Unifloral Honeys. Foods 2021, 10, 1543. [Google Scholar] [CrossRef]
- Hategan, A.R.; Magdas, D.A.; Puscas, R.; Dehelean, A.; Cristea, G.; Simionescu, B. Machine Learning Algorithms in Corroboration with Isotope and Elemental Profile—An Efficient Tool for Honey Geographical Origin Assessment. Appl. Sci. 2022, 12, 10894. [Google Scholar] [CrossRef]
- Food and Agriculture Organisation of the United Nations. Crops and Livestock Products. Available online: https://www.fao.org/faostat/en/#data/QCL (accessed on 21 March 2025).
- UNDP Türkiye. Organic Agriculture Cluster. Available online: https://www.undp.org/turkiye/projects/organic-agriculture-cluster (accessed on 16 August 2025).
- Republic of Türkiye Ministry of Agriculture and Forestry Apiculture Research Institute. Beekeeping Statistics by Province in Türkiye. 2024. Available online: https://arastirma.tarimorman.gov.tr/aricilik/Link/2/Aricilik-Istatistikleri (accessed on 16 August 2025).
- Turkish Patent and Trademark Office. Official Statistics. Available online: https://ci.turkpatent.gov.tr/cografi-isaretler/detay/37928 (accessed on 16 August 2025).
- Turkish Patent and Trademark Office. Official Statistics. Available online: https://ci.turkpatent.gov.tr/cografi-isaretler/detay/8563 (accessed on 16 August 2025).
- Turkish State Meteorological Service. Statistics by Provinces and Districts—Siirt. Available online: https://mgm.gov.tr/veridegerlendirme/il-ve-ilceler-istatistik.aspx?k=A&m=SIIRT (accessed on 30 October 2025).
- Turkish State Meteorological Service. Statistics by Provinces and Districts—Şırnak. Available online: https://mgm.gov.tr/veridegerlendirme/il-ve-ilceler-istatistik.aspx?k=A&m=SIRNAK (accessed on 30 October 2025).
- Gürbüz, S.; Özenirler, Ç.; Mayda, N.; Gençay Çelemli, Ö.; Özkök, A. Pollen spectrum of some honey samples produced in Siirt-Turkey. Hacet. J. Biol. Chem. 2019, 47, 295–303. [Google Scholar] [CrossRef]
- Gürbüz, S.; Gençay Çelemli, Ö.; Özenirler, Ç.; Mayda, N.; Özkök, A.; Sorkun, K. Melissopalynological analysis of honey samples collected from Şırnak City. Uludag Bee J. 2019, 19, 126–135. [Google Scholar]
- Bora, F.D.; Andrecan, A.F.; Călugăr, A.; Bunea, C.I.; Popescu, M.; Petrescu-Mag, I.V.; Bunea, A. Comprehensive Elemental Profiling of Romanian Honey: Exploring Regional Variance, Honey Types, and Analyzed Metals for Sustainable Apicultural and Environmental Practices. Foods 2024, 13, 1253. [Google Scholar] [CrossRef]
- Ertop, U.; Şevik, H.; Hendek Ertop, M. Mineral composition and heavy metal contents of chestnut honey collected from Kastamonu region. J. Apitherapy Nat. 2023, 6, 73–87. [Google Scholar] [CrossRef]
- Çobanoğlu, D.N.; Temizer, İ.K.; Felek, İ.; Şimşek, A.; Dündar, O. Botanical origin of honey: Implications for mineral composition and potential toxic element safety. Chem. Biodivers. 2025, 22, e00318. [Google Scholar] [CrossRef] [PubMed]
- Yılmaz, H.; Yavuz, Ö. Content of some trace metals in honey from south-eastern Anatolia. Food Chem. 1999, 65, 475–476. [Google Scholar] [CrossRef]
- Yücel, Y.; Sultanoğlu, P. Characterization of Hatay honeys according to their multi-element analysis using ICP-OES combined with chemometrics. Food Chem. 2013, 140, 231–237. [Google Scholar] [CrossRef]
- Alqarni, A.S.; Owayss, A.A.; Mahmoud, A.A.; Hannan, M.A. Mineral content and physical properties of local and imported honeys in Saudi Arabia. J. Saudi Chem. Soc. 2014, 18, 618–625. [Google Scholar] [CrossRef]
- Terrab, A.; Recamales, A.F.; Hernanz, D.; Heredia, F.J. Characterisation of Spanish thyme honeys by their physicochemical characteristics and mineral contents. Food Chem. 2004, 88, 537–542. [Google Scholar] [CrossRef]
- Kılıç Altun, S.; Dinç, H.; Paksoy, N.; Temamoğulları, F.K.; Savrunlu, M. Analyses of mineral content and heavy metal of honey sample from South and East Region of Turkey by using ICP-MS. Int. J. Anal. Chem. 2017, 2017, 6391454. [Google Scholar] [CrossRef]
- Altundag, H.; Bina, E.; Altıntıg, E. The levels of trace elements in honey and molasses samples that were determined by ICP-OES after microwave digestion method. Biol. Trace Elem. Res. 2016, 170, 508–514. [Google Scholar] [CrossRef]
- Demir Kanbur, E.; Yuksek, T.; Atamov, V.; Özcelik, A.E. A comparison of the physicochemical properties of chestnut and highland honey: The case of Senoz Valley in the Rize province of Turkey. Food Chem. 2021, 345, 128864. [Google Scholar] [CrossRef]
- European Commission. Commission Regulation (EU) 2023/915 of 25 April 2023 on Maximum Levels for Certain Contaminants in Food and Repealing Regulation (EC) No 1881/2006. Available online: https://eur-lex.europa.eu/eli/reg/2023/915/oj (accessed on 10 July 2025).
- Bilir, B.; Irmak, S.; Doğan, M. Determination of Some Properties and Nutrient Element Levels of Agricultural Soils in Silopi District, Şırnak Province. Yüzüncü Yıl Univ. J. Inst. Sci. 2023, 28, 1174–1186. [Google Scholar] [CrossRef]
- Schmidlová, S.; Javůrková, Z.; Tremlová, B.; Hernik, J.; Prus, B.; Marcinčák, S.; Marcinčáková, D.; Štarha, P.; Čížková, H.; Kružík, V.; et al. Exploring the Influence of Soil Types on the Mineral Profile of Honey: Implications for Geographical Origin Prediction. Foods 2024, 13, 2006. [Google Scholar] [CrossRef]
- Song, W.; Wang, H.; Maguire, P.; Nibouche, O. Spectral Data Classification Using Locally Weighted Partial Least Squares Classifier. In Data Science and Knowledge Engineering for Sensing Decision Support: Proceedings of the 13th International FLINS Conference (FLINS 2018), Belfast, Northern Ireland, UK, 21–24 August 2018; World Scientific: Singapore, 2018; pp. 700–707. [Google Scholar]
Disclaimer/Publisher’s Note: The statements, opinions and data contained in all publications are solely those of the individual author(s) and contributor(s) and not of MDPI and/or the editor(s). MDPI and/or the editor(s) disclaim responsibility for any injury to people or property resulting from any ideas, methods, instructions or products referred to in the content. |
© 2025 by the authors. Licensee MDPI, Basel, Switzerland. This article is an open access article distributed under the terms and conditions of the Creative Commons Attribution (CC BY) license (https://creativecommons.org/licenses/by/4.0/).