Abstract
With the widespread use of audio editing software and artificial intelligence, it has become very easy to forge audio files. One type of these forgeries is copy-move forgery, which is achieved by copying a segment from an audio file and placing it in a different place in the same file, where the aim is to take the speech content out of its context and alter its meaning. In practice, forged recordings are often disguised through post-processing steps such as lossy compression, additive noise, or median filtering. This distorts acoustic features and makes forgery detection more difficult. This study introduces a robust keypoint-based approach that analyzes Mel-spectrograms, which are visual time-frequency representations of audio. Instead of processing the raw waveform for forgery detection, the proposed method focuses on identifying duplicate regions by extracting distinctive visual patterns from the spectrogram image. We tested this approach on two speech datasets (Arabic and Turkish) under various real-world attack conditions. Experimental results show that the method outperforms existing techniques and achieves high accuracy, precision, recall, and F1-scores. These findings highlight the potential of visual-domain analysis to increase the reliability of audio forgery detection in forensic and communication contexts.
1. Introduction
Advances in digital technology have facilitated the development and widespread accessibility of audio editing software. Although these tools enable valuable applications in media production, communication, and entertainment, they also introduce serious risks when misused. Manipulating audio recordings has become surprisingly easy, even non-expert users. As a result, verifying the authenticity and preserving the integrity of digital audio have turned into pressing concerns in forensic analysis, investigative journalism, and cybersecurity practice [1].
In the age of fast-developing digital media, even a brief manipulated audio clip can trigger serious consequences in the real world. Forged recordings have already been exploited to spread false information, discredit individuals, and sway public opinion or legal outcomes. As voice-based authentication and digital evidence gain prominence in areas such as law enforcement, politics, and online communication, the credibility of audio data becomes more than a technical concern—it turns into a question of social trust and ethical accountability. Reliable audio forgery detection systems are therefore essential for protecting privacy, curbing misinformation, and strengthening the integrity of digital forensics.
To address these challenges, researchers have developed various audio verification techniques in the literature. These techniques are generally classified into active and passive methods [2] as shown in Figure 1. In active approaches, the sending side embeds watermarks in the original record, and later the receiving side verifies authenticity through watermark extraction. Despite being effective for controlled scenarios, such methods require pre-embedded information and cannot detect tampering in arbitrary recordings. In contrast, passive authentication examines intrinsic characteristics of the audio without prior modification. They include container-based analysis, which focuses on file structures and metadata, and content-based analysis, which inspects acoustic or spectral features for signs of tampering. In modern forensic applications, content-based strategies dominate, since they are capable of revealing manipulation traces directly in the temporal–spectral domain.
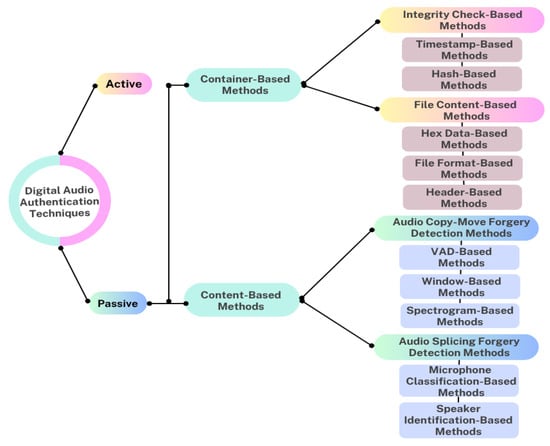
Figure 1.
Classification of digital audio verification techniques (adapted and redrawn based on [2]).
In content-based approaches, forgery detection strategies focus on two types of manipulation: audio splicing and audio copy–move forgeries. Splicing combines segments from different sources. This process often leaves detectable inconsistencies such as abrupt noise transitions, spectral discontinuities, or mismatches in recording conditions. Copy–move forgery, by contrast, reuses material from the same recording. A segment is copied and repositioned to another location within the signal to insert, repeat, or mask certain content. In practice, this manipulation can replicate a speaker’s phrase to alter context or overwrite sensitive portions with neutral audio.
Figure 2 shows a typical audio copy–move forgery created using Audacity software (https://www.audacityteam.org/). In this instance, a short spoken part is duplicated and reinserted into another location of the same recording. Such tamperings may alter the perceived meaning of a conversation while maintaining acoustic consistency. This makes manual detection highly unreliable.
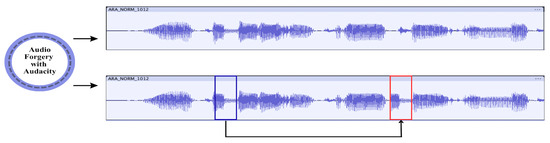
Figure 2.
Example of an audio copy–move forgery created using Audacity. The region enclosed in the blue box was copied and pasted into the region enclosed in the red box.
To handle this issue, some researchers have focused on spectral features. The spectral features of an audio signal are obtained by transforming the signal from the time domain to the frequency domain. Mel-Frequency Cepstral Coefficients (MFCCs) are one of the most well-known spectral features. While such features provide compact frequency-domain representations, they often lose local structural details that may reveal duplicated or tampered regions. To address this limitation, in some recent studies, keypoint-based approaches including Scale-Invariant Feature Transform (SIFT) [2,3], Speeded-Up Robust Features (SURF) [4], and Binary Robust Independent Elementary Features (BRIEF) [5] have been presented to detect audio copy-move forgery. Keypoints mentioned here are the distinctive points in an image that are invariant to various transformations, such as scaling and rotation. Keypoint detector is used to identify these keypoints in an image, whereas keypoint descriptors are feature vectors that describe the local appearance around each keypoint. Key points, which are unique to the image and are therefore interesting, are extracted from images called spectrograms, not from the raw audio file. These images are visual representations of how the frequencies of an audio signal vary over time. A Mel spectrogram is similar to a standard spectrogram, but the frequency scale is converted to the Mel scale, which better represents human auditory perception. In addition to spectral features and keypoint descriptors, statistical modeling in both the time and frequency domains has also been applied to detect anomalies [6]. Nonetheless, when forged audio is further subjected to post-processing—such as additive noise, lossy compression, or filtering—the traces of manipulation become more deeply embedded and difficult to uncover.
Anti-forensic techniques, which are methods used to obstruct, complicate, or mislead digital forensic studies, can conceal alterations in an audio signal. This makes forgery detection more challenging. As illustrated in Figure 3, even simple manipulations may leave subtle spectral artifacts that are not easily perceived by the human auditory system. This observation underscores the importance of computational methods capable of revealing tampering patterns beyond auditory perception. Because of this, robust audio forensic analysis requires automated approaches such as keypoint-based detection rather than relying on manual evaluation.
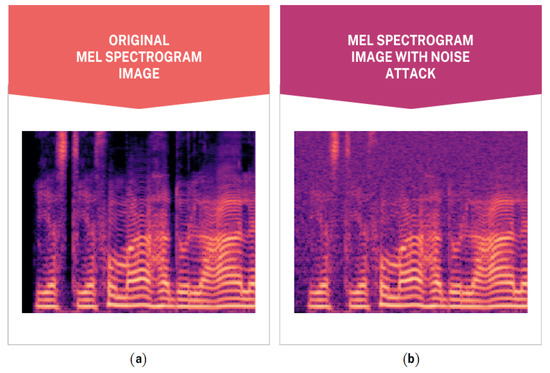
Figure 3.
Example Mel-spectrograms: (a) original recording; (b) recording with additive noise attack.
In this paper, we present a novel keypoint-based approach for detecting copy-move forgeries in audio recordings. Our method uses both SIFT and Features from Accelerated Segment Test (FAST) [7] as keypoint detectors, with descriptors derived from SIFT and Fast Retina Keypoint (FREAK) algorithms. The major contributions can be summarized as follows:
- 1.
- In this study, we introduce an innovative approach by converting digital audio data into Mel spectrograms and processing them in the visual (image) domain. Unlike traditional methods that operate directly on raw audio signals, this technique integrates visual processing techniques for audio forgery detection. Such approaches remain relatively underexplored in the literature.
- 2.
- Instead of relying on a single keypoint detector and descriptor, the proposed method combines SIFT and FAST for keypoint detection, followed by SIFT and FREAK for descriptor generation. This hybrid feature extraction approach improves the robustness against forgery artifacts.
- 3.
- The method maintained stable detection accuracy across different distortion types, including additive noise, lossy compression, and filtering.
- 4.
- The experimental results show that our method performs better than existing approaches across all evaluation metrics. This finding highlights its potential as a dependable tool for forgery detection.
The remainder of this paper is organized as follows: Section 2 reviews relevant literature and summarizes existing approaches. Section 3 describes the audio datasets and their characteristics. Section 4 presents the proposed methodology in detail, while Section 5 provides experimental results and discusses their implications. Finally, Section 6 concludes the paper with findings and future research directions.
2. Related Work
Existing research has extensively investigated audio copy-move forgery detection, with current approaches generally falling into three main categories: (1) Voice Activity Detection (VAD) based methods, (2) window-based analysis techniques, and (3) spectrogram-based approaches.
VAD-based detection approaches aim to isolate voiced regions from silence or noise, and then assess similarities among the extracted speech segments. Voiced speech regions are isolated using either VAD or the Yet Another Algorithm for Pitch Tracking (YAAPT). Next, feature similarity analysis is applied to these extracted voiced components. Finally, segments with high similarity scores are classified as duplicated audio regions.
For example, Yan et al. [8] combined pitch and formant sequences with Dynamic Time Warping (DTW) for similarity analysis, Imran et al. [6] utilized Local Binary Pattern (LBP) histograms on Arabic speech data to detect duplicated segments. Wang et al. [9] extracted Discrete Cosine Transform (DCT) and Singular Value Decomposition (SVD) features from syllables segmented by VAD, and Xie et al. [10] combined multiple features—Mel-Frequency Cepstral Coefficients (MFCC), gammatone, pitch, and Discrete Fourier Transform (DFT)—with decision tree classification. More recently, Akdeniz et al. [11,12] employed YAAPT-based segmentation with deep learning classifiers such as Recurrent Neural Networks (RNNs), Long Short-Term Memory (LSTM), and Artificial Neural Networks (ANNs), while Wang et al. [13] introduced Cochlear Filter Cepstral Coefficients (CFCC) features for forgery detection. Although VAD-based methods are effective in isolating speech, their performance is highly sensitive to background noise, silence misclassification, and post-processing operations.
Window-based methods partition audio signals into fixed-length overlapping segments and extract discriminative features for similarity analysis. Xiao et al. [14] pioneered T-period segmentation with fast convolution, while Su et al. [15] optimized Constant Q Spectral Sketches (CQSS) using a Genetic Algorithm (GA) and classified them using a Support Vector Machine (SVM). In a later study, Su et al. [16] applied Constant-Q Cepstral Coefficients (CQCC) with Pearson Correlation Coefficients (PCC) on Librispeech and Chinspeech datasets, also testing robustness under multiple attacks. Window-based approaches are computationally efficient but rely heavily on fixed thresholds, limiting robustness when attacks such as compression or noise are present.
With the increasing success of computer vision techniques, recent studies have turned toward spectrogram-based representations. Spectrogram-based approaches transform audio into visual representations, thereby enabling the application of computer vision techniques. Several works have applied deep learning: Ustubioglu [17] used Convolutional Neural Networks (CNNs), while Dincer [18] combined EfficientNet and Capsule Networks. Other studies adopted handcrafted feature extraction. Yazici [19] divided Mel spectrograms into sub-blocks and applied Binary Gradient Patterns (BGP), whereas Ustubioglu et al. [2] and Gucc et al. [3] employed SIFT keypoints. Ulutas et al. [4] explored SURF, and Ustubioglu [5] utilized BRIEF with Ordering Points To Identify the Clustering Structure (OPTICS) clustering. High-resolution spectrograms with Accelerated-KAZE (AKAZE) features have also been tested [20]. Spectrogram-based approaches have shown strong robustness against post-processing attacks and allow for keypoint-based analysis. Nevertheless, many rely on a single descriptor or require large training datasets, leaving room for hybrid methods that integrate multiple feature extraction techniques.
Table 1 presents a summary of existing studies on audio copy-move forgery detection, including their methodological approaches, datasets, and reported performance metrics. This review provides a comparative perspective of current techniques in the literature.

Table 1.
A summary of existing studies addressing the detection of audio copy-move forgery.
3. Dataset
3.1. Dataset 1 (Arabic Speech-Based Copy–Move Set)
The first audio copy–move forgery dataset, given in [17], derived from the Arabic Speech Corpus [25]. It is publicly available at https://ceng2.ktu.edu.tr/~csrg (accessed on 1 November 2025). As described by the dataset creators, the Arabic Speech Corpus consists of WAV-format utterances that were first segmented into voiced parts using their proposed VAD method [17]. A randomly selected voiced segment, typically between 0.2 s and 0.6 s, was then copied and pasted at a randomly chosen position within the same utterance to produce the forged samples. This process resulted in 715 forged audio files derived from 1001 authentic utterances. To enhance diversity, the forged samples were further subjected to post-processing operations identical to those used in Dataset 2—namely, 64 kbps MP3 compression, median filtering, and additive Gaussian noise at 30 dB and 20 dB SNR levels—yielding a total of 3575 samples, including both the original forged and their post-processed variants.
3.2. Dataset 2 (Turkish Speech in Three Environments)
The second dataset is described in [26] and available at https://ceng2.ktu.edu.tr/~csrg. It consists of Turkish speech recordings collected under three acoustic conditions: office, cafeteria, and quiet room, each containing 200 original utterances.
To create forged samples, the start and end boundaries of the words in each utterance were first determined using Matlab’s speech2text tool, as described in the original dataset publication [26]. After identifying word boundaries, word pairs were deliberately selected. Then, they were copied and pasted to form semantically meaningful forged sentences. This design choice distinguishes the corpus from most existing resources, which typically produce meaningless word repetitions that can easily expose manipulation. By ensuring linguistic coherence in the forged speech, the dataset provides a more realistic and challenging evaluation scenario for copy–move detection methods.
As summarized in [26], 1046 forged utterances were generated from the 600 originals (200 per environment). Each forged file was then represented under five conditions—the original forged version without any attack and four post-processing attacks identical to those used in Dataset 1—resulting in a total of 5230 samples (1046 × 5). This design allows the results to be compared across datasets and keeps the evaluation consistent under different acoustic environments.
4. Proposed Method
Audio copy–move manipulations create localized repetitions in the time–frequency plane. Representing audio with Mel spectrograms preserves this spatial locality. This enables mature image-based correspondence techniques to operate on duplicated patterns. For this reason, we adopted a hybrid keypoint strategy combining two complementary detector–descriptor pairs: SIFT–SIFT and FAST–FREAK. SIFT provides scale- and contrast-invariant features that are robust to local intensity and minor spectral variations. FAST efficiently detects high-density corner-like structures. The FREAK descriptor offers a compact and noise-tolerant binary representation. Hence, it improves matching efficiency. This hybrid configuration enhances detection reliability under typical post-processing conditions (compression, filtering, and additive noise). At the same time, it maintains computational efficiency for file-level decisions.
The workflow involves four major stages. First, the input audio is transformed into Mel-spectrograms, followed by image preprocessing and keypoint extraction. The final stage performs feature matching and filtering. The following subsections detail each computational stage.
Before detailing the computational stages, it is essential to clarify the key terms used throughout this section. In this study, the term manipulation refers to a copy–move forgery in which a continuous segment of an audio recording is duplicated and pasted into another position within the same file. The modified recording is treated as a forged sample, whereas the original unaltered files are regarded as authentic. In contrast, attacks such as lossy compression, additive Gaussian noise, or median filtering are not manipulations themselves. They are post-processing operations applied to evaluate the robustness of the proposed method against real-world degradations.
4.1. Generation of Mel Spectrogram Images
In this work, the Mel spectrogram serves as a perceptually motivated, time-frequency representation for facilitating the detection of copy-move forgeries in audio signals. These manipulations often involve duplicated temporal segments that manifest as recurring spectral patterns in the Mel domain. By converting audio into a two-dimensional image-like format, the Mel spectrogram enables the adaptation of image-based techniques—such as keypoint matching and block-based correlation—for audio forgery detection [2,3,17,19].
To generate the Mel spectrogram, the audio waveform is first divided into overlapping 30-ms frames, each multiplied by a Hamming window to mitigate spectral leakage. The short-time Fourier transform (STFT) is then applied to extract the time-frequency representation as defined in Equation (1) [17]:
where is the Hamming window function, is the input speech signal for frame t, is the sampling frequency, and N is the number of samples in per frame. The STFT output is then passed through a Mel-frequency filter bank that compresses high-frequency content and models the nonlinear frequency sensitivity of human hearing. The resulting Mel spectrogram coefficients are computed using Equation (2) [17]:
where L is the number of frequency bins in the STFT, and is the response of the k-th filter in the Mel filter bank. This compact representation captures both spectral and temporal features critical for detecting duplicated or inconsistent regions—especially in complex acoustic environments—while simultaneously providing dimensionality reduction and perceptual alignment with human auditory sensitivity.
4.2. Preprocessing of Spectrogram Images
In the presented approach, the input Mel spectrogram is first converted to the hue-saturation-value (HSV) color space, and only the V (value) channel is retained for further analysis. Since Mel spectrograms encode information primarily through intensity rather than color, isolating the V channel—which represents brightness—enhances the detection of structurally duplicated regions while mitigating chromatic distortions. This approach also reduces computational complexity, benefiting both block-based and keypoint-based forgery detection techniques. Building on the insights of Prakash et al. [27] and Hosny et al. [28], who highlight the significance of perceptually meaningful color models, this work adopts the HSV space to improve the identification of recurring patterns. SIFT and FAST are intensity-based detectors. They rely on pixel brightness gradients rather than color information. Working directly in RGB space introduces chromatic noise. In contrast, converting an image to grayscale merges color and luminance components, thereby reducing edge saliency. The HSV color space isolates luminance from chromaticity. Also, the V channel directly represents brightness contrast. Prior studies have shown that using the V-channel improves the stability of keypoint detection and robustness against color distortions in forgery detection tasks [27,29]. Empirically, V-channel normalization yielded more stable keypoints and fewer false correspondences than grayscale preprocessing. This justifies the choice of the HSV color model.
After converting to the HSV color space, the V channel is normalized to enhance the dynamic range, particularly for low-contrast images. Normalization, which may introduce abrupt brightness variations, is followed by Gaussian blurring (to smooth high-frequency noise) and morphological opening (to eliminate minor irregularities). Together, these preprocessing operations enhance contrast, suppress noise, and remove artifacts, yielding a more uniform spectrogram image. This improves the reliability of subsequent keypoint detection and matching.
4.3. Keypoints Detection and Description
The subsequent stage of the proposed framework involves extracting keypoints from the preprocessed Mel spectrogram image and measure similarity between described points. For this purpose, a hybrid method based on SIFT, FAST, and FREAK is presented in this paper.
Most feature extraction algorithms for analyzing images involve two key steps: (1) detecting centralized interest points, followed by (2) constructing robust local descriptors that maintain invariance to orientation and scaling. SIFT [30] is a feature extraction algorithm that both detects and describes local keypoints invariant to scale, rotation, and illumination changes. It operates in four stages:
- Scale-space extrema detection: A Gaussian pyramid is constructed by convolving the input image () with Gaussian filters at varying scales (), as defined in Equation (3) [31].where denotes the scale-space representation of the input image, ∗ is the convolution operator, and is a Gaussian kernel defined in Equation (4) [31].where represents the spatial coordinates and is the scale parameter. Once the scale space is constructed, the Difference-of-Gaussian (DoG) images are obtained by subtracting adjacent Gaussian-blurred images within the same octave, as expressed in Equation (5) [31]:In this formulation, and denote the Gaussian images at scales and , respectively. Stable features are detected in the DoG images by comparing each pixel with its eight neighboring pixels at the same scale, as well as with nine neighbors in the scale above and nine in the scale below. A pixel is identified as a candidate keypoint if it constitutes a local extremum, either a maximum or a minimum. Unstable extrema are subsequently eliminated through a refinement procedure involving contrast thresholding and edge-response elimination.
- Keypoint localization: Candidate keypoints are refined by eliminating low-contrast points and edge responses using a Hessian matrix-based criterion [32] (analogous to the Harris corner detector [33]).
- Orientation assignment: Each keypoint is assigned a dominant orientation based on local gradient directions, ensuring rotation invariance.
- Descriptor generation: A 128-dimensional feature vector is computed for each keypoint by partitioning its neighborhood into 4 × 4 subregions and calculating gradient histograms.
This comprehensive pipeline enables SIFT to generate highly distinctive and repeatable features, making it suitable for diverse computer vision applications. The extrema obtained through scale-space extrema detection are invariant to both scale and orientation, which makes them particularly effective for identifying duplicated regions even under transformations such as translation, scaling, or slight distortions commonly introduced in copy–move forgeries.
The SIFT descriptor further encodes gradient orientations within a local neighborhood, yielding a highly discriminative representation that is resilient to noise, compression, and other post-processing operations. When applied to Mel spectrograms, this property enables reliable matching of duplicated time–frequency patterns, thereby facilitating the detection of copy–move manipulations.
In our implementation, we employed OpenCV’s SIFT algorithm [34] with optimized parameters: a contrast threshold (contrastThreshold) of 0.05 to preserve low-contrast features and an edge threshold (edgeThreshold) of 15 to enhance tolerance for edge regions.
FAST [7] is a high-speed corner detection method designed for real-time applications but is also widely used in standard image processing. Unlike some feature detectors, FAST only performs keypoint detection and does not include an inherent descriptor.
The FAST algorithm examines circular neighborhoods (typically 16 pixels at radius 3–4) around candidate pixels as illustrated in Figure 4. A pixel p with intensity is classified as a corner if at least N contiguous pixels on its Bresenham circle [35] are either all brighter than or all darker than , where t is a threshold defining significant intensity differences. Here, denotes the intensity of the n-th pixel located on the 16-point Bresenham circle surrounding the candidate pixel p. Following the original FAST detector [7], the parameter N is commonly set to 12, as this choice enables a high-speed test that efficiently excludes a large number of non-corner points [36]. This condition is formalized in Equation (6) [7].
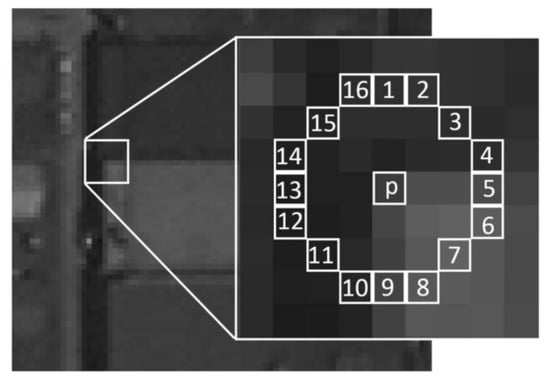
Figure 4.
FAST detector (reproduced from [36], © 2018 by the authors. Licensee MDPI, Basel, Switzerland. This article is an open access article distributed under the terms and conditions of the Creative Commons Attribution (CC BY) license (http://creativecommons.org/licenses/by/4.0/, accessed on 1 November 2025)).
Equation (6) defines the individual intensity test for each neighboring pixel, while the final corner decision is made if at least N contiguous pixels on the circle satisfy this condition. For computational efficiency, FAST first checks the 1st, 5th, 9th, and 13th pixels on the Bresenham circle. If fewer than three of these satisfy the intensity condition, the candidate pixel p is immediately rejected [7]. In the initial stage of the algorithm, all pixels are tested and corner candidates are identified. On the other hand, in textured regions, multiple corners may cluster in close proximity. To retain only the most stable and distinctive corners, a non-maximal suppression strategy is applied as a post-detection step. In this procedure, a score value is assigned to each detected corner. Corners within the same neighborhood are then compared, and only those with the highest scores are preserved, while those with lower scores are discarded. This reduces redundancy and enhances the robustness of the final set of keypoints.
Although originally designed for natural image analysis, the FAST detector can also be applied to time-frequency representations of audio signals, such as Mel spectrograms. Copy–move manipulations introduce duplicated patterns in the spectrogram domain, and FAST captures these by extracting distinctive local keypoints. When paired with suitable descriptors (e.g., FREAK) and matching techniques, duplicated segments can be reliably detected even under noise or compression.
FREAK descriptor [37] is a binary feature descriptor inspired by the human visual system, particularly the retinal sampling pattern. It constructs a circular sampling grid around each detected keypoint, with concentric rings symmetrically distributed such that the sampling density is highest at the center and decreases exponentially toward the periphery, closely mimicking the structure of the human retina. Each sampling location is smoothed using a Gaussian kernel, where the radius of the circle determines the standard deviation of the kernel.
The descriptor is constructed by comparing the intensity values of predefined receptive field pairs. This process is formalized as shown in Equation (7) (see [37]), where denotes a pair of points, N is the descriptor size, and T is a thresholding function:
In Equation (8), following [37], and are the smoothed intensities of the two points in the pair . If the first point has higher intensity than the second, the corresponding bit is set to 1; otherwise, it is set to 0. By repeating this process across 512 preselected sampling pairs, FREAK produces a compact and highly discriminative binary string representation of the local image structure.
In practice, descriptor distinctiveness can be enhanced by varying the Gaussian kernel sizes or by overlapping receptive fields, the latter of which allows richer information capture and improved distinctiveness. Compared with classical descriptors such as SIFT, SURF, or other binary descriptors like Binary Robust Invariant Scalable Keypoints (BRISK), FREAK is faster to compute, requires less memory, and offers improved robustness [37]. In this work, the OpenCV implementation of the FREAK descriptor with default parameters is utilized.
FREAK can be effectively applied to time–frequency visual representations such as Mel spectrograms. Copy–move forgeries in audio introduce duplicated time–frequency patterns, which can be represented as repeated local structures in the spectrogram domain. By combining FAST for efficient keypoint detection with FREAK for robust binary description, these duplicated regions can be characterized with high precision. FREAK’s compact binary representation enables efficient matching, while its high sensitivity to local intensity variations ensures robustness against distortions such as noise, compression, or minor frequency shifts. As a consequence, FAST–FREAK provides a reliable framework for detecting copy–move forgeries in Mel spectrograms.
By integrating SIFT and FAST as keypoint detectors with SIFT and FREAK as feature descriptors, the proposed hybrid scheme leverages complementary strengths—scale and rotation invariance from SIFT, efficiency from FAST, and compact binary robustness from FREAK—thereby enhancing the reliability of audio copy–move forgery detection.
4.4. Matching and Filtering of Keypoints
To identify potential tampering in an audio file, SIFT and FAST algorithms are applied to extract distinctive keypoints from the input spectrogram. These keypoints capture unique frequency-time patterns that are then cross-matched to detect duplicated regions—a sign of copy-move forgery.
If a significant number of keypoint matches are found, it indicates that portions of the spectrogram have been copied and pasted elsewhere, suggesting manipulation. The results are visualized by overlaying the matched regions on the spectrogram, highlighting areas with suspiciously similar energy distributions.
After extracting keypoints using SIFT (with 128-dimensional descriptors) and FAST (with 64-dimensional FREAK descriptors), we resolved the dimensionality mismatch by augmenting the FREAK descriptors to 128 dimensions via replication. This alignment allowed a unified feature space that preserves the complementary strengths of both descriptors.
In our methodology, keypoint matching is performed by locating the nearest neighbor for each descriptor using Euclidean distance. To improve robustness, Lowe’s ratio test is applied, accepting a match only if the distance ratio between the closest and second-closest neighbors falls below the predefined threshold .
This threshold parameter directly influences the matching performance: Lower values increase the precision of the match by rejecting ambiguous matches, albeit at the cost of a reduced match quantity. Higher values preserve more matches while potentially compromising accuracy.
The optimal threshold selection thus represents a critical trade-off between match density and matching accuracy. Additionally, it requires careful calibration to minimize false correspondences while preserving a sufficient number of feature pairs for robust analysis. Since nearest-neighbor search in high-dimensional spaces is computationally expensive, we adopt the recursive partitioning strategy of Huang et al. [38], which splits the descriptor set and performs Brute-Force (BF) matching [39] within smaller subsets. This divide-and-conquer approach reduces the complexity of classical BF matching.
The keypoint matching pipeline consists of the following steps:
- ✓
- Partitioning the Descriptor Set: The descriptor set (K) is evenly split by index into two subsets, and , to balance the computational load in subsequent matching.
- ✓
- BF Matcher and Lowe’s Ratio Test: For each descriptor in , the two best matches (m and n) within are identified using OpenCV’s BFMatcher with the L2 norm (Euclidean distance). A match is considered valid only if it satisfies Lowe’s ratio test [31], which filters ambiguous matches by comparing the distances of the best and second-best candidates, as shown in Equation (9) (see also [40]):
Here, denotes the feature descriptor of the i-th keypoint in set , and represent the first and second nearest descriptors in set , respectively, and indicates the Euclidean (L2) norm. We determined the ratio threshold in Lowe’s test () empirically through several preliminary runs on a small validation subset. During these trials, different values between 0.45 and 0.60 were tested to see which produced the highest file-level F1-score under compression, noise, and filtering attacks. A value of gave the most reliable trade-off—lower thresholds removed too many valid matches, while higher ones allowed more false correspondences. Once identified, this setting was kept the same for all datasets and attack conditions to ensure consistency in evaluation.
Matches failing this test (i.e., when distances are too similar) are discarded as unreliable. The iteration proceeds until all descriptor pairs in have been processed, at which point the matching loop terminates. Following the ratio test, pairs whose keypoint coordinates are closer than a preset threshold are discarded.
- ✓
- Recursive Partitioning: The recursive matching routine proceeds on the branch until the current subset contains fewer than two descriptors. This divide-and-conquer strategy reduces computational complexity for large descriptor sets.
- ✓
- Outlier Rejection with RANSAC: Finally, Random Sample Consensus (RANSAC) [41] is employed to eliminate residual false matches that may arise from repetitive patterns in the spectrogram. RANSAC iteratively estimates the dominant homography transformation between matched keypoints and evaluates their geometric consistency. Keypoint pairs whose reprojection error exceeds a predefined threshold (e.g., 3 pixels) are labeled as outliers and discarded, while consistent correspondences are retained as inliers. This filtering step ensures that only reliable matches are preserved, thereby improving the robustness of the tampering localization process.
Finally, a file is labeled as forged if the number of RANSAC inliers exceeds the threshold value (). This threshold remains constant across all datasets and attack conditions.
An overview of the proposed workflow is provided in Figure 5. The diagram highlights the sequential steps from spectrogram generation and keypoint detection to descriptor matching and RANSAC-based outlier rejection, which ultimately support the final decision between authentic and tampered recordings.
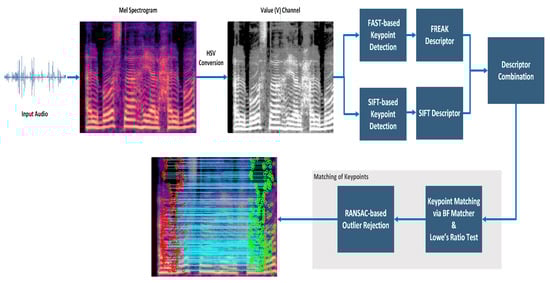
Figure 5.
Workflow of the proposed hybrid keypoint-based method.
5. Experimental Results
This section evaluates the performance of the proposed approach on two publicly available audio copy–move forgery datasets, detailed in Section 3. The first dataset, referred to as Dataset 1, was introduced in [17] and is derived from the Arabic Speech Corpus [25]. The second dataset, referred to as Dataset 2 and described in [26], consists of Turkish speech recordings. Both datasets include authentic and forged samples subjected to common post-processing attacks, enabling consistent cross-dataset evaluations. We begin by describing the post-processing scenarios applied to the datasets before presenting the evaluation metrics and experimental results.
5.1. Post-Processing Attacks
Both datasets include original recordings and their corresponding forged versions. Each forged audio file was further subjected to common post-processing operations, including the addition of white Gaussian noise at 30 dB and 20 dB SNR, median filtering, and 64 kbps compression.
Table 2 presents examples of forged spectrogram images from Dataset 1, illustrating the effects of different post-processing attacks. The abbreviations represent the following attack conditions: NA for baseline (no attack), COM for 64 kbps compression, MDF for median filtering, GN20 for additive white Gaussian noise at 20 dB SNR, and GN30 for noise at 30 dB SNR.
Table 2.
Matched keypoints and the counts of matched keypoints on Mel spectrogram images.
In the images, the lines connect matched keypoints between the copied and pasted regions, highlighting detectable traces of copy-move forgery. The table further quantifies the detection robustness by listing: (1) the total detected keypoints, (2) the number of matched keypoints after BF-Matcher processing, and (3) the remaining true matches post-RANSAC-based outlier removal.
5.2. Evaluation Metrics
We performed all experiments on a PC with an Intel Core i5 CPU and 8 GB of RAM. For the implementation, we utilized Python 3.12 with OpenCV 4.11. The decision threshold was fixed at and remained unchanged across all datasets and attack conditions. File-level predictions were evaluated in terms of accuracy, precision, recall, and F1-score. They were computed using scikit-learn functions [42]. These metrics are defined in Equations (10)–(13) (see [43,44]), respectively. True Positives (TP) represent correctly identified forged audio samples, False Positives (FP) denote genuine samples erroneously classified as forged, False Negatives (FN) occur when forged samples remain undetected, and True Negatives (TN) correspond to genuine samples correctly recognized as authentic.
Accuracy measures the overall proportion of correct predictions (TP and TN) among all predictions, but may be misleading in imbalanced datasets. Precision quantifies the proportion of correctly detected forged samples among all predicted forgeries, whereas Recall (TPR) reflects the proportion of actual forgeries that are correctly identified. The -score is the harmonic mean of Precision and Recall, providing a balanced measure that accounts for both FP and FN errors. All metrics range between 0 and 1, with higher values indicating stronger detection performance.
5.3. Results and Discussion
Table 3 reports the baseline (no-attack) performance of our approach on both datasets, according to the metrics defined earlier. On Dataset 1 (Arabic), the method achieved an accuracy of 0.9505, precision of 0.9968, recall of 0.8839, and an -score of 0.9370. On Dataset 2 (Turkish), the method yielded an accuracy of 0.9192, precision of 0.9247, recall of 0.9503, and an -score of 0.9373.
Table 3.
Baseline (no-attack) performance of the proposed method on both datasets.
These results highlight the robustness of the proposed approach across languages and acoustic conditions. While precision was higher on Dataset 1, recall improved on Dataset 2, suggesting complementary strengths. Importantly, the consistently high scores in both datasets confirm the balanced ability of the method to minimize false positives and false negatives in various attack scenarios.
Table 4 and Table 5 present the performance of the presented method under various post-processing operations for both datasets. Although the system maintains consistently high precision across all conditions, the recall values reveal the specific weaknesses of the method under heavy distortions.
Table 4.
Performance under various post-processing attacks—Dataset 1 (Arabic).
Table 5.
Performance under various post-processing attacks—Dataset 2 (Turkish).
On Dataset 1 (Arabic), our approach performed best under median filtering, achieving an accuracy of 0.9499 and an -score of 0.9362. Compression at 64 kbps yielded relatively weaker performance, with recall dropping to 0.6476 and the -score to 0.7847. Gaussian noise addition was the most challenging attack, particularly at 20 dB SNR, where recall fell to 0.6252 and the -score to 0.7680. At 30 dB SNR, performance improved slightly ( = 0.8646), though noise still posed significant difficulties. These results suggest that the method can effectively handle filtering and moderate compression. But its recall sensitivity to strong noise conditions remains a limiting factor.
For Dataset 2 (Turkish), the method again demonstrated robustness under median filtering (accuracy = 0.9162, = 0.9348) and compression (accuracy = 0.8834, = 0.9069). As with Dataset 1, Gaussian noise degraded performance most severely: recall decreased to 0.7314 at 20 dB and 0.8671 at 30 dB, with corresponding -scores of 0.8087 and 0.8918. Despite these challenges, the method consistently achieved -scores above 0.80 across all attack scenarios. These findings indicate a relatively stable detection capability even under adverse conditions.
Overall, the comparative analysis reveals that the proposed framework maintains high robustness to compression and filtering attacks, while exhibiting greater vulnerability to additive Gaussian noise. Precision values consistently exceed 0.91 across all cases. It highlights the ability of the method to avoid false alarms. On the contrary, recall values demonstrate that noisy environments remain the most critical challenge for copy–move forgery detection, emphasizing the need for further refinement in noise-resilient feature extraction.
We compare our hybrid method with related studies in the literature to demonstrate its effectiveness. For Dataset 1, Table 6 compares the accuracy values under different attack conditions against prior approaches based on formant sequences [8], LBP [6], DCT-SVD [9], and DFT [22].
Table 6.
Accuracy comparison of the proposed approach and existing methods on Dataset 1.
Under 64 kbps compression, conventional methods show a substantial drop in accuracy, with values ranging between 0.20 and 0.57. In contrast, our approach achieves a markedly higher accuracy of 0.8520. This result highlights its robustness against lossy audio compression. Similarly, under median filtering, which often disrupts subtle spectral patterns, this technique attains an accuracy of 0.9499, significantly surpassing the best competing baseline (0.57).
The results under Gaussian noise attacks further reinforce the superiority of our approach. At 20 dB SNR, existing methods achieve accuracies in the range of 0.20–0.63. Our method maintains an accuracy of 0.8427. When the noise level is 30 dB SNR, the performance of traditional methods remains limited (0.16–0.60). In contrast, our method sustains a high accuracy of 0.9003. This consistent improvement demonstrates the resilience of the proposed V-channel–driven keypoint extraction and hybrid feature description strategy, even in noisy environments.
For Dataset 2, Table 7 summarizes the accuracy comparison under four attack conditions. Traditional approaches demonstrate limited robustness, with accuracy values mostly below 0.55. In contrast, the proposed framework consistently outperforms these baselines across all scenarios.
Table 7.
Accuracy comparison of the proposed approach and existing methods on Dataset 2.
Under 64 kbps compression, our work achieves an accuracy of 0.8834, whereas reference studies remain between 0.18 and 0.49. Median filtering produces a similar trend: whereas the best competing accuracy is 0.5328, we achieve an accuracy score of 0.9162, which nearly doubles the detection performance.
Noise attacks further highlight the method’s resilience. At 20 dB SNR, existing methods achieve accuracies up to 0.5243, while the proposed approach maintains 0.7801. At 30 dB SNR, accuracy remains high at 0.8663, significantly exceeding the baselines (0.23–0.53). These findings confirm that the proposed hybrid framework offers robustness against post-processing operations in more challenging, real-world acoustic conditions.
Overall, the experimental results empirically demonstrate the effectiveness and robustness of the proposed hybrid approach. Across both Arabic and Turkish datasets, the method consistently achieved high accuracy, precision, recall, and -scores, outperforming conventional techniques under diverse post-processing operations. While Gaussian noise remained the most challenging scenario—particularly at lower SNR levels—the proposed framework still maintained reliable detection performance, with -scores above 0.80 in all cases. Even under strong Gaussian noise, the system maintains high precision but exhibits some recall, since noise distorts local gradient structures and reduces the number of stable keypoint matches after RANSAC filtering. In our current setup, the descriptors are fused in parallel without adaptive weighting, so the binary features become less effective at low SNR levels. Future work may address this issue by introducing confidence-based weighting or by adding a denoising step to improve robustness while keeping precision stable.
The proposed method generalizes well because it relies on spectral–structural similarity rather than on language-specific cues. Mel-spectrograms describe how spectral energy changes over time, allowing duplicated regions to be detected regardless of phonetic or linguistic differences. We used the same fixed threshold () and parameter set for both the Arabic and Turkish datasets, without any dataset-specific tuning. The consistent performance across these linguistically and acoustically different corpora supports the robustness of the method across languages and recording conditions.
From a computational perspective, two main bottlenecks arise: recursive descriptor partitioning and RANSAC-based outlier elimination. As the speech duration increases, the Mel-spectrogram expands along the time axis, producing more keypoints and descriptors. Consequently, processing time grows because brute-force matching scales quadratically with the number of descriptors, while RANSAC introduces additional latency depending on its iteration count. Both modules include early-stopping rules—descriptor partitioning halts when subsets contain fewer than two descriptors, and RANSAC terminates once a consistent model is found—keeping the computation practical for offline forensic analysis. Future work may explore approximate nearest-neighbor search, GPU-accelerated RANSAC, or adaptive time–frequency windowing to further enhance efficiency.
Beyond its technical contributions, this work also sheds light on the ethical and communicative questions it raises. Automatic detection of forgery in audio recordings can increase the reliability of digital evidence. But once attackers learn how to detect forgery, they can develop more sophisticated forgery tools to “evade” this detection. This dual use of technology undermines public trust in audio recordings. Therefore, transparent reporting and the responsible application of detection technologies are crucial to maintaining media integrity and credibility. These concerns necessitate further interdisciplinary research, particularly in the areas of media ethics, AI accountability, and digital communication [45,46,47].
Although our proposed method demonstrates competitive performance under various attack conditions on two different datasets, it unfortunately has some limitations. The method exhibits some sensitivity to very low-SNR conditions, and its performance also depends on spectrogram resolution. These factors may reduce its robustness in extremely noisy or bandwidth-limited recordings.
6. Conclusions
This work presents a hybrid keypoint-based method for detecting audio copy-move forgeries using Mel-spectrogram representations. Unlike most approaches in the literature, this approach does not focus on the raw waveform. Instead, it analyzes how the energy of an audio signal changes over time and frequency. By combining complementary visual features, the method achieves balanced performance in terms of accuracy, efficiency, and robustness in forgery detection.
Experiments were conducted on two publicly available datasets containing Arabic and Turkish speech recorded in different acoustic environments. The proposed approach was evaluated under both forgery and post-processing attack conditions, such as compression, filtering, and noise injection, achieving high accuracy, precision, recall, and F1-scores. These findings demonstrate that the system generalizes well across languages and acoustic environments and can be applied to a variety of forensic and security scenarios where verifying the authenticity of recorded evidence is crucial.
Future research will focus on improving robustness to strong noise conditions, integrating deep learning with keypoint-based analysis, and extending the framework to detect other types of audio manipulation. Overall, this work contributes not only to technical advances in audio forensics but also to broader efforts to ensure authenticity and trust in digital communications.
Author Contributions
Conceptualization, E.O. and S.Y.A.; methodology, E.O. and S.Y.A.; software, E.O.; validation, E.O. and S.Y.A.; formal analysis, E.O. and S.Y.A.; investigation, E.O. and S.Y.A.; resources, S.Y.A.; data curation, E.O. and S.Y.A.; writing—original draft preparation, E.O. and S.Y.A.; writing—review and editing, E.O. and S.Y.A.; visualization, E.O. and S.Y.A.; supervision, S.Y.A.; project administration, S.Y.A.; funding acquisition, S.Y.A. All authors have read and agreed to the published version of the manuscript.
Funding
This study is supported by the Scientific Research Projects Coordination Unit of Atatürk University with a project number of FYL-2025-15112.
Institutional Review Board Statement
Not applicable.
Informed Consent Statement
Not applicable.
Data Availability Statement
The original data presented in the study are openly available at https://ceng2.ktu.edu.tr/~csrg (accessed on 1 November 2025).
Acknowledgments
During the preparation of this work, the authors used ChatGPT 5 to improve language and readability. After using this tool, the authors reviewed and edited the content as needed and take full responsibility for the content of the publication.
Conflicts of Interest
The authors declare no conflicts of interest.
References
- Zakariah, M.; Khan, M.K.; Malik, H. Digital multimedia audio forensics: Past, present and future. Multimed. Tools Appl. 2018, 77, 1009–1040. [Google Scholar] [CrossRef]
- Ustubioglu, B.; Tahaoglu, G.; Ulutas, G. Detection of audio copy-move-forgery with novel feature matching on Mel spectrogram. Expert Syst. Appl. 2023, 213, 118963. [Google Scholar] [CrossRef]
- Güç, H.K.; Üstübioğlu, B.; Üstübioğlu, A.; Ulutaş, G. Audio Forgery Detection Method with Mel Spectrogram. In Proceedings of the 2023 16th International Conference on Information Security and Cryptology (ISCTürkiye), Ankara, Turkiye, 18–19 October 2023; IEEE: Piscataway, NJ, USA, 2023; pp. 1–6. [Google Scholar]
- Ulutas, G.; Tahaoglu, G.; Ustubioglu, B. Forge audio detection using keypoint features on mel spectrograms. In Proceedings of the 2022 45th International Conference on Telecommunications and Signal Processing (TSP), Virtual, Online, Czech Republic, 13–15 July 2022; IEEE: Piscataway, NJ, USA, 2022; pp. 413–416. [Google Scholar]
- Ustubioglu, B.; Tahaoglu, G.; Ulutas, G.; Ustubioglu, A.; Kilic, M. Audio forgery detection and localization with super-resolution spectrogram and keypoint-based clustering approach. J. Supercomput. 2024, 80, 486–518. [Google Scholar] [CrossRef]
- Imran, M.; Ali, Z.; Bakhsh, S.T.; Akram, S. Blind detection of copy-move forgery in digital audio forensics. IEEE Access 2017, 5, 12843–12855. [Google Scholar] [CrossRef]
- Rosten, E.; Drummond, T. Machine Learning for High-Speed Corner Detection. In Computer Vision—ECCV 2006, Proceedings of the 9th European Conference on Computer Vision, Graz, Austria, 7–13 May 2006; Leonardis, A., Bischof, H., Pinz, A., Eds.; Springer: Berlin/Heidelberg, Germany, 2006; pp. 430–443. [Google Scholar]
- Yan, Q.; Yang, R.; Huang, J. Robust copy–move detection of speech recording using similarities of pitch and formant. IEEE Trans. Inf. Forensics Secur. 2019, 14, 2331–2341. [Google Scholar] [CrossRef]
- Wang, F.; Li, C.; Tian, L. An algorithm of detecting audio copy-move forgery based on DCT and SVD. In Proceedings of the 2017 IEEE 17th International Conference on Communication Technology (ICCT), Chengdu, China, 27–30 October 2017; IEEE: Piscataway, NJ, USA, 2017; pp. 1652–1657. [Google Scholar]
- Xie, Z.; Lu, W.; Liu, X.; Xue, Y.; Yeung, Y. Copy-move detection of digital audio based on multi-feature decision. J. Inf. Secur. Appl. 2018, 43, 37–46. [Google Scholar] [CrossRef]
- Akdeniz, F.; Becerikli, Y. Recurrent neural network and long short-term memory models for audio copy-move forgery detection: A comprehensive study. J. Supercomput. 2024, 80, 17575–17605. [Google Scholar] [CrossRef]
- Akdeniz, F.; Becerikli, Y. Detecting audio copy-move forgery with an artificial neural network. Signal Image Video Process. 2024, 18, 2117–2133. [Google Scholar] [CrossRef]
- Wang, D.; Li, X.; Shi, C.; Niu, X.; Xiong, L.; Wu, H.; Qian, Q.; Qi, C. Robust copy-move detection and localization of digital audio based CFCC feature. Multimed. Tools Appl. 2024, 84, 9573–9589. [Google Scholar] [CrossRef]
- Xiao, J.-n.; Jia, Y.-z.; Fu, E.-d.; Huang, Z.; Li, Y.; Shi, S.-p. Audio authenticity: Duplicated audio segment detection in waveform audio file. J. Shanghai Jiaotong Univ. (Sci.) 2014, 19, 392–397. [Google Scholar] [CrossRef]
- Su, Z.; Li, M.; Zhang, G.; Wu, Q.; Li, M.; Zhang, W.; Yao, X. Robust audio copy-move forgery detection using constant Q spectral Sketches and GA-SVM. IEEE Trans. Dependable Secur. Comput. 2022, 20, 4016–4031. [Google Scholar] [CrossRef]
- Su, Z.; Li, M.; Zhang, G.; Wu, Q.; Wang, Y. Robust audio copy-move forgery detection on short forged slices using sliding window. J. Inf. Secur. Appl. 2023, 75, 103507. [Google Scholar] [CrossRef]
- Ustubioglu, A.; Ustubioglu, B.; Ulutas, G. Mel spectrogram-based audio forgery detection using CNN. Signal Image Video Process. 2023, 17, 2211–2219. [Google Scholar] [CrossRef]
- Dincer, S.; Ustubioglu, B.; Ulutas, G.; Tahaoglu, G.; Ustubioglu, A. Robust Audio Forgery Detection Method Based on Capsule Network. In Proceedings of the 2023 International Conference on Electrical and Information Technology (IEIT), Malang, Indonesia, 14–15 September 2023; IEEE: Piscataway, NJ, USA, 2023; pp. 243–247. [Google Scholar]
- Yazici, S.; Üstübioğlu, B.; Kiliç, M.; Ulutaş, G. Block-Based Forgery Detection with Binary Gradient Model. In Proceedings of the 2022 15th International Conference on Information Security and Cryptography (ISCTURKEY), Ankara, Turkey, 19–20 October 2022; IEEE: Piscataway, NJ, USA, 2022; pp. 38–43. [Google Scholar]
- Üstübioğlu, B.; Tahaoglu, G. Yüksek çözünlüklü spektrogram görüntülerinden akaze yöntemi ile ses sahteciliği tespiti. Kahramanmaraş Sütçü İmam Üniv. Mühendis. Bilim. Derg. 2023, 26, 961–972. [Google Scholar] [CrossRef]
- Ustubioglu, B.; Küçükuğurlu, B.; Ulutas, G. Robust copy-move detection in digital audio forensics based on pitch and modified discrete cosine transform. Multimed. Tools Appl. 2022, 81, 27149–27185. [Google Scholar] [CrossRef]
- Huang, X.; Liu, Z.; Lu, W.; Liu, H.; Xiang, S. Fast and effective copy-move detection of digital audio based on auto segment. In Digital Forensics and Forensic Investigations: Breakthroughs in Research and Practice; IGI Global: Hershey, PA, USA, 2020; pp. 127–142. [Google Scholar]
- Üstübioğlu, B.; Üstübioğlu, A. Görsel kelime tabanlı ses sahteciliği tespit yöntemi. Niğde Ömer Halisdemir Üniv. Mühendis. Bilim. Derg. 2024, 13, 350–358. [Google Scholar] [CrossRef]
- Ustubioglu, B. An Attack-Independent Audio Forgery Detection Technique Based on Cochleagram Images of Segments With Dynamic Threshold. IEEE Access 2024, 12, 82660–82675. [Google Scholar] [CrossRef]
- Arabic Speech Corpus. Available online: https://en.arabicspeechcorpus.com/ (accessed on 1 November 2025).
- Ustubioglu, B.; Tahaoglu, G.; Ayaz, G.O.; Ustubioglu, A.; Ulutas, G.; Cosar, M.; Kılıc, E.; Kılıc, M. KTUCengAudioForgerySet: A new audio copy-move forgery dataset. In Proceedings of the 2024 47th International Conference on Telecommunications and Signal Processing (TSP), Prague, Czech Republic, 10–12 July 2024; IEEE: Piscataway, NJ, USA, 2024; pp. 123–129. [Google Scholar]
- Prakash, C.S.; Panzade, P.P.; Om, H.; Maheshkar, S. Detection of copy-move forgery using AKAZE and SIFT keypoint extraction. Multimed. Tools Appl. 2019, 78, 23535–23558. [Google Scholar] [CrossRef]
- Hosny, K.M.; Hamza, H.M.; Lashin, N.A. Copy-move forgery detection of duplicated objects using accurate PCET moments and morphological operators. Imaging Sci. J. 2018, 66, 330–345. [Google Scholar] [CrossRef]
- Panzade, P.P.; Prakash, C.S.; Maheshkar, S. Copy-move forgery detection by using HSV preprocessing and keypoint extraction. In Proceedings of the 2016 Fourth International Conference on Parallel, Distributed and Grid Computing (PDGC), Waknaghat, India, 22–24 December 2016; pp. 264–269. [Google Scholar]
- Lowe, D.G. Object recognition from local scale-invariant features. In Proceedings of the Seventh IEEE International Conference on Computer Vision, Kerkyra, Greece, 20–27 September 1999; Volume 2, pp. 1150–1157. [Google Scholar]
- Lowe, D.G. Distinctive image features from scale-invariant keypoints. Int. J. Comput. Vis. 2004, 60, 91–110. [Google Scholar] [CrossRef]
- Bay, H.; Tuytelaars, T.; Van Gool, L. Surf: Speeded up robust features. In Proceedings of the European Conference on Computer Vision, Graz, Austria, 7–13 May 2006; Springer: Berlin/Heidelberg, Germany, 2006; pp. 404–417. [Google Scholar]
- Harris, C.G.; Stephens, M.J. A Combined Corner and Edge Detector. In Proceedings of the Alvey Vision Conference, Manchester, UK, 31 August–2 September 1988. [Google Scholar]
- Developers, O. OpenCV SIFT Feature Detector and Descriptor. 2025. Available online: https://docs.opencv.org/4.x/da/df5/tutorial_py_sift_intro.html (accessed on 22 October 2025).
- Bresenham, J. A linear algorithm for incremental digital display of circular arcs. Commun. ACM 1977, 20, 100–106. [Google Scholar] [CrossRef]
- Huang, J.; Zhou, G.; Zhou, X.; Zhang, R. A New FPGA Architecture of FAST and BRIEF Algorithm for On-Board Corner Detection and Matching. Sensors 2018, 18, 1014. [Google Scholar] [CrossRef]
- Alahi, A.; Ortiz, R.; Vandergheynst, P. Freak: Fast retina keypoint. In Proceedings of the 2012 IEEE Conference on Computer Vision and Pattern Recognition, Providence, RI, USA, 16–21 June 2012; pp. 510–517. [Google Scholar]
- Huang, H.; Guo, W.; Zhang, Y. Detection of copy-move forgery in digital images using SIFT algorithm. In Proceedings of the 2008 IEEE Pacific-Asia Workshop on Computational Intelligence and Industrial Application, Wuhan, China, 19–20 December 2008; Volume 2, pp. 272–276. [Google Scholar]
- Developers, O. OpenCV Brute-Force Feature Matching. 2025. Available online: https://docs.opencv.org/4.x/dc/dc3/tutorial_py_matcher.html (accessed on 22 October 2025).
- Hammoud, M.; Getahun, M.; Lupin, S. Comparison of Outlier Filtering Methods in Terms of Their Influence on Pose Estimation Quality. Int. J. Open Inf. Technol. 2023, 11, 1–5. [Google Scholar]
- Fischler, M.A.; Bolles, R.C. Random sample consensus: A paradigm for model fitting with applications to image analysis and automated cartography. Commun. ACM 1981, 24, 381–395. [Google Scholar] [CrossRef]
- Pedregosa, F.; Varoquaux, G.; Gramfort, A.; Michel, V.; Thirion, B.; Grisel, O.; Blondel, M.; Prettenhofer, P.; Weiss, R.; Dubourg, V.; et al. Scikit-learn: Machine learning in Python. J. Mach. Learn. Res. 2011, 12, 2825–2830. [Google Scholar]
- Çoban, Ö. An assessment of nature-inspired algorithms for text feature selection. Comput. Sci. 2022, 23, 179–204. [Google Scholar] [CrossRef]
- Çoban, Ö.; Yücel Altay, Ş. Arming text-based gender inference with partition membership filtering and feature selection for online social network users. Comput. J. 2025, 68, 1208–1224. [Google Scholar] [CrossRef]
- Broussard, M.; Diakopoulos, N.; Guzman, A.L.; Abebe, R.; Dupagne, M.; Chuan, C.H. Artificial intelligence and journalism. J. Mass Commun. Q. 2019, 96, 673–695. [Google Scholar] [CrossRef]
- Chesney, B.; Citron, D. Deep fakes: A looming challenge for privacy, democracy, and national security. Calif. Law Rev. 2019, 107, 1753. [Google Scholar] [CrossRef]
- Vaccari, C.; Chadwick, A. Deepfakes and disinformation: Exploring the impact of synthetic political video on deception, uncertainty, and trust in news. Soc. Media Soc. 2020, 6, 2056305120903408. [Google Scholar] [CrossRef]


Disclaimer/Publisher’s Note: The statements, opinions and data contained in all publications are solely those of the individual author(s) and contributor(s) and not of MDPI and/or the editor(s). MDPI and/or the editor(s) disclaim responsibility for any injury to people or property resulting from any ideas, methods, instructions or products referred to in the content. |
© 2025 by the authors. Licensee MDPI, Basel, Switzerland. This article is an open access article distributed under the terms and conditions of the Creative Commons Attribution (CC BY) license (https://creativecommons.org/licenses/by/4.0/).