Abstract
This research aimed to improve our understanding of how ash and slag waste (ASW) could be used in civil engineering. The present study concentrated on the utilisation of bottom sand (ASW) in cement composites as a replacement for a part of aggregate and the evaluation of the pozzolanic properties of the material. This would enable its use as a binder in non-cementitious or cementitious composites. The basic properties of the modified mortars were investigated. The pozzolanic activity index (PAI) of the bottom sand was also tested using two methods. Analysis of the test results shows that we can replace natural aggregate with 25% bottom sand without significantly impairing the properties of the modified composites. However, the tested ASW does not exhibit pozzolanic activity. Consequently, it should not be used as a binder substitute in cementitious or non-cementitious composites.
1. Introduction
In recent years, continuous developments in construction technologies and ever-increasing environmental protection requirements have led to efforts to develop innovative solutions that meet environmental standards.
Cementitious and non-cementitious composites are an important element of modern construction due to their high physical and mechanical properties and versatile applications [1,2,3,4,5,6,7]. It is evident that a number of intriguing, innovative solutions for modifying composites can be distinguished.
The first of these is the use of new supplementary cementitious materials (SCM) [8,9,10,11,12,13], such as palm oil fuel ash in concrete or calcined clay in limestone calcined clay cement (LC3) [13,14]. A variety of alternative aggregates can also be utilised. It is a common occurrence that these consist of a variety of waste materials or by-products from industrial processes. These include, but are not limited to, ceramic waste, recycled aggregates, and municipal solid waste incineration (MSWI) [12,15,16,17,18]. The term “green concrete” is also becoming increasingly common [19,20,21,22,23,24].
Ash and slag waste (ASW) constitutes a by-product that can also be used in the field of civil engineering in diverse ways. It is imperative to distinguish between the two concepts.
The initial material under consideration is an ash–slag mixture, hereinafter referred to as ash–slag waste (ASW), i.e., waste material from combustion. In accordance with the Minister of Climate Regulation on the Waste Catalogue [25], this waste material is assigned the code “10 01 80—Ash–slag mixtures from wet disposal of combustion waste”. A classification of ash and slag wastes as alternative aggregates is also proposed by Kozioł et al. [26], who consider them power plant wastes.
The second concept is a mixture of ash and slag (MAS), referred to as such, i.e., a combination of ash (e.g., fly ash or bottom ash from fluidized bed furnaces) and slag (e.g., blast furnace slag) in selected proportions.
Some publications do not clearly state which waste material is being referred to: ASW or MAS. For instance, in the study by Aldungarova et al. [27], an ash–slag mixture is initially mentioned. However, when describing the materials used in the study, three are listed: fly ash from Pavlodar, bauxite sludge, and metallurgical slag. Blends of these materials, again termed ash-and-slag waste, were utilised in the production of hollow wall stones [27].
Menshov et al. [28] also proposed the possible use of a mixture of ash and slag. Following the grinding of these two materials, which were produced from coal combustion, they can be utilised in the production of wall materials. The main focus of this study was the use of the mixture as an expanded clay sand in building blocks [28].
The term ash–slag materials is also frequently referenced [29]. However, it should be noted that this refers to the use of ash from various sources as an additive to concrete and various types of slag as aggregates. Evidence suggests that these materials possess a significantly broader range of applications, including, but not limited to, use in the construction of asphalt pavements and cement-based concrete roads, as well as use as an additive in building products such as ceramic bricks [29,30,31].
In general, ash and slag waste with code “10 01 80” is used, among other things [28,31,32,33,34,35] for the following purposes:
- Backfilling mines;
- The hardening of land surfaces;
- As a seal to prevent sewage seepage from the landfills;
- As a material incorporated into the lower layers of road and railway embankments, provided that they are stored in dry places or isolated from water;
- As a valuable construction material for the creation of earth embankments;
- As materials for the construction of non-reinforced layers in the base of the road surface;
- In the cores of hydrotechnical and other structures, including foundations;
- As a base for temporary and improved light road surfaces of categories IV–V;
- As a material used in lower layers of the base for improved light and permanent road surfaces of category III.
In their publications, Zawisza et al. [36,37] examined the possibility of using a mixture of ash and slag stabilised with hydraulic binders for the construction of embankment slopes. With the use of a suitable binder, ASW can even be used in the upper layers of road embankments.
Meanwhile, Bieliatynskyi et al. [33] described how ash and slag waste can be employed in concrete technology. It can be used as a substitute for part of the binder or sand. In addition, ASW can act as an active micro-filler. The use of ash and slag waste as a substitute for cement or aggregate depends primarily on its lime content. Provided that the level is sufficiently high, the substance may be utilised to replace a part of the binder. Concrete that has been modified by ash and slag waste can subsequently be implemented as a repair material in road construction. In addition, ASW can be used as an aggregate in lightweight concrete or as thermal and acoustic insulation [33].
Kalinowska-Wichrowska et al. [38] proposed the utilisation of a mixture of ash and slag in prefabricated geopolymer concrete elements. These elements, which exhibit high thermal properties, incorporate a mixture of fly ash and slag from wet storage deslaggers. The MAS was used as part of a fly ash-based binder, while the aggregate was an artificial fly ash aggregate [38].
A comparable application is proposed by Yatsenko and Goltsman et al. [31], wherein a mixture of fly ash and boiler slag is employed as a binder in foamed geopolymers. The addition of aluminium powder to the geopolymer results in a structure that is similar to aerated or foam concrete [31].
In another study, Yatsenko et al. [39] put forward the proposition of employing ash and slag wastes in the production of glass–ceramic composite construction materials. ASW was one of the synthetic components of cellular glass and slag–sital, which can be used to make heat-insulating decorative glass composite materials [39].
On the other hand, Rudenko et al. [40] proposed the utilisation of ash and slag waste in non-autoclaved aerated concrete (NAAC). ASW was added in quantities ranging from 25.5% to 31.5% by weight. The most favourable outcomes were achieved with the highest additive content [40].
Tkaczewska, in her research [41], tested a mixture of fly ash and slag as a pozzolan additive in cement. The pozzolanic activity index (PAI) was analyzed in accordance with EN 450-1 [42]. The chemical composition of the materials used is presented in Table 1. For the mixtures AS, AS_0–15, and AS_15–30, PAI28 was found to be 72%, 90% and 72%, respectively. In contrast, PAI90 for these sample series was 81%, 108% and 84%, respectively. As outlined in point 3, the material can be classified as pozzolanic if PAI28 > 75% and PAI90 > 85%. Consequently, solely the mixture of AS fraction 0–15 μm was categorised as pozzolanic material. The other two mixtures should not be used as a substitute for part of the cement. The remaining test results also confirmed the most favourable effect of adding AS_0–15 mixture in an amount of 25% of the cement mass. The compressive strength of the samples was measured after a period of 28 days, with a result of 43 MPa. In the control unmodified series, approximately 48 MPa was achieved. It was also established that an increase in water demand was associated with a higher mixture of ash and slag content [41].

Table 1.
Chemical and granulometric compositions of ASW and MAS, along with their applications.
However, the composition of ash–slag wastes can vary greatly depending on their origin, with different types of ash–slag mixtures having different properties [31,32,36,37,39,40,41]. The differences in the granulometric and chemical composition of ash and slag wastes (ASW) or mixtures of ash and slag (MAS), together with their applications, are presented in Table 1.
As demonstrated in Table 1, ash and slag wastes typically contain approximately 40–60% of silicon dioxide (SiO2) and 15–30% of aluminium oxide (Al2O3). The presence of these oxides in such quantities is of particular significance when utilising ASW in cement or geopolymer concrete [6,7,31,38]. However, it should be noted that there are significant discrepancies in loss on ignition.
In the context of determining the size distribution of particles, factors such as the intended application of ASW and the method of sieve analysis play a pivotal role [32,35,36,37]. The differences in grain size distributions are even more evident when analysing the compositions presented by Klyuev et al. [35], shown in Table 2. However, it is challenging to identify any significant correlations. Consequently, it can be deduced that when investigating the prospective applications of ash and slag wastes, it is imperative to be aware of their chemical and granulometric composition.
Table 2.
Granulometric compositions of ASW (based on [35]).
In summary, the potential utilisation of ash and slag waste is dependent upon the composition of the material used. Furthermore, it is crucial to ascertain whether the substance in question is typical ASW or a mixture of different ashes and slags (MAS).
Studying new waste materials is extremely important, particularly those classified as ash and slag waste. Analysing their composition and pozzolanic activity enables them to be used as a substitute for binders or aggregates in cementitious and non-cementitious composites.
The present study focused on the use of bottom sand, which is classified as ash and slag waste. It is a waste material from the wood-based furniture panel production. The paper primarily explored the use of bottom sand in cement composites as an aggregate substitute and assessed the material’s pozzolanic properties. The latter would enable its application in cementitious or non-cementitious composites as a binder.
2. Materials
Materials such as the following were used to prepare the test samples:
- Portland cement CEM I 42.5R;
- Standard sand;
- Bottom sand;
- Water.
Portland cement CEM I 42.5R was used as a binder material. The material met the requirements of the EN 197-1 standard [43].
Standard sand in the 0–2 mm fraction was used as an aggregate. The material met the requirements of the EN 196-1 standard [44]. The grain size distribution of the standard sand is presented in Table 3.
Table 3.
Grain size distribution of standard and bottom sand (%).
Bottom sand classified as an ash and slag waste (ASW) with code “10 01 80”, fraction 0–2 mm, was used as a substitute for natural aggregate. These are residues from the burning of wood dust from the production of wood-based furniture panels in dryer burners (information provided by the material supplier). The grain size distribution of the bottom sand after sieve analysis is presented in Table 3. Bottom sand contains more fine fractions, especially fractions of 0.250–0.125 mm and 0.50–0.25 mm. Therefore, greater water demand can be expected compared to standard sand. The chemical oxide compositions of the bottom sand are presented in Table 4. The composition shows that the bottom sand is made up of around 86% silicon dioxide. This silica content could indicate that it is a suitable replacement for natural aggregate.
Table 4.
Chemical oxide composition of bottom sand (%).
The water used to prepare fresh mortar is mains water that meets the requirements of the EN 196-1 standard [44].
3. Experimental Procedures
A review of the literature revealed that ash–slag waste is commonly used as a substitute for cement. However, its chemical composition is a crucial factor that must be taken into consideration. According to Kozioł et al. [26], ash–slag waste is considered an alternative aggregate. In addition, the tested bottom sand consists of 86% silica, as shown in Table 4 [26].
In the context of the aforementioned points, the overarching experimental plan involved the evaluation of the potential for utilizing bottom sand as a substitute for standard sand. Consequently, a series of smaller research plans was formulated. This article will present two specific experimental plans:
- SEP1—initial, specific experimental plan—replacing the standard sand with the bottom sand in the mortar samples;
- SEP 2—the second specific experimental plan—replacing the standard sand with the bottom sand in the mortar samples and adjusting the water content to achieve the standard consistency.
The primary objective of the SEP1 was to replace the standard sand with the bottom sand in the mortar samples. The initial experiment was conducted utilising quantities of bottom sand (ASW) ranging from 0% to 100% of the standard sand, with a variation of 25%. The basic composition of the mortars was a recipe in accordance with the EN 196-1 standard [44]. The initial step involved the preparation and presentation of the mix proportions of mortars, as outlined in Table 5.
Table 5.
SEP1 mortar mix proportions (g).
Mortars modified with bottom sand were prepared in accordance with the EN 196-1 standard [44]. The procedure entailed the preparation of the mixture, its subsequent compaction, and the curing of the samples over a period of 28 days, until the tests were conducted. A total of 12 samples were obtained for each series.
In order to assess the impact of bottom sand on the properties of cement composites in SEP1, a series of tests were carried out on the consistency of the fresh mortar (flow table or plunger penetration method), the granulometric composition of the bottom sand (see Table 3), the flexural and compressive strength, the water absorption and apparent density of modified cement mortars. These tests were conducted in accordance with the relevant standards [44,45,46,47,48]. Each test was performed on six specimens.
In SEP2, the mortars were modified not only by bottom sand, but also by adjustment of the water content to achieve the standard consistency. The water content was determined on the basis of consistency tests so that it was similar to the results of the control series, which had not been modified with bottom sand. Mortar mix proportions for SEP2 are shown in Table 6.
Table 6.
SEP2 mortar mix proportions (g).
In the SEP2 study, a similar series of tests was performed in accordance with the methodology employed in the SEP1 study. A review of the extant literature suggests that bottom sand (ASW) can also be utilised as a binder. Consequently, the pozzolanic activity index was analysed. Two methods were employed: physical and chemical.
The physical method involved comparing the compressive strength in accordance with the EN 450-1 [42]. The pozzolanic activity index (PAI) was determined by the equation below:
where the variable A is indicative of the compressive strength of the modified mortar (MM), in which 25% of the cement is substituted with pozzolanic material. The variable B denotes the compressive strength of a control mortar (CM). In order for the mineral addition to be regarded as pozzolanic, PAI must be 75% at 28 days of age and 85% at 90 days. Control mortars and those modified with 25% of bottom sand were prepared in accordance with the EN 196-1 standard [44].
PAI = A/B × 100%,
The chemical method involved performing thermal analysis. The analysis is performed using both differential thermal analysis (DTA) and thermogravimetric analysis (TG). The pozzolanicity of a material is determined by the quantity of calcium hydroxide that is bound in the pozzolanic reaction. Subsequent to physical testing, the samples were utilised for the purpose of thermal analysis.
The statistical analyses were conducted using the programme Microsoft Excel, specifically the Data Analysis ToolPak component [49]. Statistical analysis of the test results was performed based on single-factor analysis of variance (ANOVA), which was used to assess the significance of the influence of the tested factor on the variability of the analysed properties. The results of the analysis of variance (ANOVA) can be presented in tabular form, as illustrated in Table 7.
Table 7.
Single factor ANOVA results (SS—sum of squares, df—degrees of freedom for each source of variation, MS—mean square, p—quantity of samples, r—total number of observations).
The tables containing the analysis results also include the p-value and Fcrit values. If the p-value is less than the significance level (usually 0.05) and F is greater than Fcrit, this indicates that the differences between the groups are statistically significant.
4. Results and Discussion
4.1. Consistency of the Fresh Mortar
Consistency of the fresh mortar results in SEP1 (see Table 8) demonstrated a substantial effect of bottom sand addition on the parameter under investigation. As the percentage of ASW increased, the fresh mortar became noticeably denser and less plastic, which clearly restricted penetration and flow. The incorporation of bottom sand, equivalent to one-quarter of the aggregate, resulted in a substantial reduction in penetration, reaching nearly fifty percent. The substitution of standard sand with bottom sand resulted in a decline of penetration depth to 1 mm, accompanied by a decrease in cone spread diameter to 10 cm.
Table 8.
The consistency test results for the fresh mortars modified with bottom sand (SEP1).
The water content was adjusted in SEP2 (see Table 9) to achieve the standard consistency. The focus was mainly on flow table results.
Table 9.
The consistency test results for the fresh mortars modified with bottom sand and adjusted water content (SEP2).
As the bottom sand content increased, the amount of water required to achieve a consistency close to the standard also increased. Replacing 25% of the natural aggregate resulted in an increase in water of only approximately 4%. Conversely, utilising solely bottom sand required approximately 51% more water.
This finding suggests that ASW exhibits a higher water demand in comparison to natural aggregate. This conclusion is further supported by the results of the sieve analysis of the bottom sand, as shown in Table 3. The composition of the ASW is approximately 88% finer fractions (0.125–0.50 mm), in comparison to standard sand. Moreover, analysis of the chemical composition (see Table 4) demonstrates that the bottom sand consists of 86% silica. It can thus be concluded that AWS exhibits a composition comparable to that of standard sand, suggesting its potential as a substitute.
This finding aligns with the higher water demand of bottom sand (ASW), as previously observed by Tkaczewska [41] in her research.
4.2. Flexural Strength
Following the execution of a one-factor analysis of variance (ANOVA), it was determined that the quantity of bottom sand in modified mortars exhibited a statistically significant impact on the 28-day flexural strength in both experimental plans (see Table 10 and Table 11).
Table 10.
ANOVA for flexural strength results of mortars modified with bottom sand (SEP1).
Table 11.
ANOVA for flexural strength results of mortars modified with bottom sand and adjusted water content (SEP2).
In both cases, the calculated F value is greater than the Fcrit value. This claim is further verified by the p-value being less than the significance level.
The mean values of the flexural strength for all the series from both SEP1 and SEP2 are presented in Figure 1.

Figure 1.
Flexural strength results for modified mortars with varying amounts of bottom sand (ASW).
Firstly, despite the identical composition of the control mortar samples (S1ASW0 and S2ASW0), there is an approximate 6% difference in strength results. Secondly, the utilisation of 25% bottom sand in SEP1 resulted in a flexural strength of 7.29 MPa, which surpasses the performance of the control series in SEP2. Consequently, external factors that are not within our control are likely responsible for the fluctuations in strength that may be observed within these 6% differences.
When analysing the mean flexural strength outcomes (see Figure 1), a decline can be observed with an increase in the bottom sand content in modified mortars.
In SEP1, a decrease in the tested parameter was observed with each 0.25 change in the aggregate proportion, by 6%, 20%, 27%, and 49%, respectively, compared to the control series.
The same correlation can be observed in the SEP2 results. As demonstrated in Figure 1, the flexural strength of the series in question exhibited a decrease in comparison with the series without bottom sand, by 6%, 16%, 28%, and 37%, respectively.
On this basis, it can be concluded that the use of bottom sand in an amount of 25% relative to natural aggregate does not cause a significant decrease in flexural strength, in both cases, only by approximately 6%.
4.3. Compressive Strength
As was the case with flexural strength, the effect of ASW modification on compressive strength is also statistically significant. As demonstrated in Table 12 and Table 13, the calculated F value exceeds the Fcrit value, and the p-value is less than the significance level in both SEP1 and SEP2.
Table 12.
ANOVA for compressive strength results of mortars modified with bottom sand (SEP1).
Table 13.
ANOVA for compressive strength results of mortars modified with bottom sand and adjusted water content (SEP2).
The mean values of the compressive strength for all the series (SEP1 and SEP2) are presented in Figure 2.
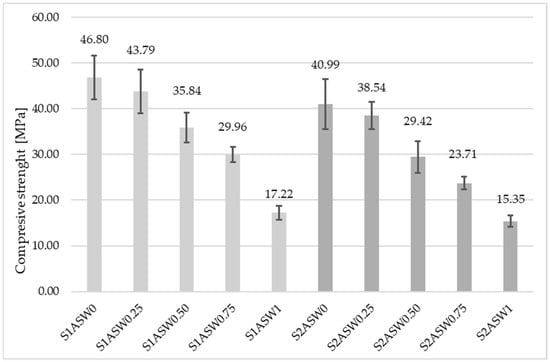
Figure 2.
Compressive strength results for modified mortars with varying amounts of bottom sand (ASW).
The results of the compressive strength tests indicate comparable correlations to those observed for flexural strength.
The highest values of the tested parameter were obtained in the control series in SEP1 (46.8 MPa). The difference between the strengths of the control series is approximately 12%. Therefore, the 6% decrease in compressive strength observed in the use of 25% bottom sand in SEP1 can be considered to be within the margin of statistical error.
In SEP1, a decrease in the tested parameter was observed for every 0.25 change in the aggregate proportion (see Figure 2). This equated to a decrease of 6%, 23%, 36% and 63% compared to the control series, respectively.
In the context of SEP2, a decline in compressive strength was observed in the presence of bottom sand, with a reduction of 6%, 28%, 42%, and 63%, respectively.
It can therefore be deduced that the implementation of bottom sand, in an amount of 25% relative to natural aggregate, reduces compressive strength by only 6% in both cases.
4.4. Water Absorption
The addition of bottom sand also has a statistically significant effect on water absorption, as can be seen in Table 14 and Table 15. It is evident from both requirements that the differences between the groups are statistically significant.
Table 14.
ANOVA for water absorption results of mortars modified with bottom sand (SEP1).
Table 15.
ANOVA for water absorption results of mortars modified with bottom sand and adjusted water content (SEP2).
The mean values for water absorption for both of the experimental plan series are presented in Figure 3.

Figure 3.
Water absorption results for modified mortars with varying amounts of bottom sand (ASW).
The differences in the outcomes are especially pronounced in the water absorption results, despite the control mortars being composed identically.
The lowest values of water absorption were obtained in the control series in SEP1 (8.21%). The discrepancy between the outcomes of the control series is approximately 18%. Therefore, the observed increases in water absorption of 5% or 6% in SEP1, when using 25% or 50% bottom sand, can be considered to be within the margin of statistical error. A similar trend is evident in SEP2. Utilising a ratio of bottom sand to standard sand of 25:75 resulted in a mere 3% increase in water absorption.
As demonstrated by the findings of the experiment (see Figure 3), it can be deduced that modifying the quantity of water in the mortar to attain the requisite standard consistency resulted in a more substantial growth in water absorption, corresponding to an increase in the content of bottom sand. The extent of water absorption increased in proportion to the amount of AWS content present, with increases ranging from 14% to 46% when the content ranged from 50% to 100%, respectively. It was demonstrated that an increase of 15% and 33% was observed at the two highest bottom sand contents in mortars that did not undergo water modification.
Consequently, it can be deduced that the implementation of bottom sand, in an amount of 25% relative to standard sand, resulted in only a 5% increase in water absorption in both experimental plans.
4.5. Apparent Density
In the case of apparent density, the smallest discrepancy in results between the two experiments is observable (see Figure 4).
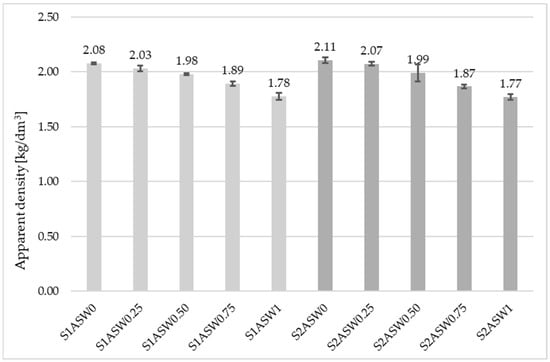
Figure 4.
Apparent density results for modified mortars with varying amounts of bottom sand (ASW).
As demonstrated in Table 16 and Table 17, the statistical analysis revealed a significant effect of the variable bottom sand content.
Table 16.
ANOVA for apparent density results of mortars modified with bottom sand (SEP1).
Table 17.
ANOVA for apparent density results of mortars modified with bottom sand and adjusted water content (SEP2).
The highest apparent density was observed (see Figure 4) in the control series in SEP2 (2.11 kg/dm3).
In SEP1, a slight decrease in the tested property was observed for every 0.25 change in the aggregate proportion. This equated to a decrease of 2%, 5%, 9% and 14% compared to the control series, respectively. A comparable decline in apparent density was observed in SEP2, with a reduction of 2%, 5%, 11%, and 16%, respectively.
In accordance with the other parameters that were the subject of this study, a 25% modification of the bottom sand did not lead to significant alterations in apparent density.
4.6. Pozzolanic Activity Index
The pozzolanic activity index was determined by two methods. The results of the physical method (PAI) according to EN 450-1 [42] are displayed in Table 18. As previously stated, the additive can be considered pozzolanic if the PAI28 value is ≥75% and the PAI90 value is ≥85%. As can be seen in Table 18, neither condition is met. PAI28 is 62%, while PAI90 is 63%. When cement was substituted with 25% bottom sand, a compressive strength of 27 MPa was attained after 28 days. This data definitively shows that this particular bottom sand is not a pozzolanic material.
Table 18.
The pozzolanic activity index (PAI) results of control (CM) and modified (MM) mortars.
The results of the thermal analyses are displayed in Figure 5, Figure 6, Figure 7 and Figure 8. The pozzolanicity of a material is determined by the quantity of calcium hydroxide that is bound during the pozzolanic reaction. The quantity of unbound Ca(OH)2 in the mortar was determined on the basis of TG/DTG thermal tests, comparing the amount of sample weight loss (TG curve—green) in the temperature range corresponding to the endothermic effect recorded at a temperature of approximately 490–510 °C (DTG curve—red). This phenomenon is associated with the thermal decomposition of Ca(OH)2.

Figure 5.
TG/DTA/DTG curves of samples prepared from control mortar (CM_28) after 28 days of curing (prepared by Wioleta Rutkowska). (green arrows–mass losses, pink arrows–LOI).

Figure 6.
TG/DTA/DTG curves of samples prepared from control mortar (CM_90) after 90 days of curing (prepared by Wioleta Rutkowska). (green arrows–mass losses, pink arrows–LOI).
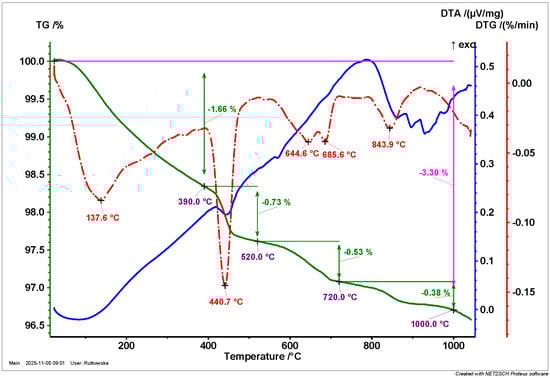
Figure 7.
TG/DTA/DTG curves of samples prepared from modified mortar containing 25% bottom sand (MM_28) after 28 days of curing (prepared by Wioleta Rutkowska). (green arrows–mass losses, pink arrows–LOI).
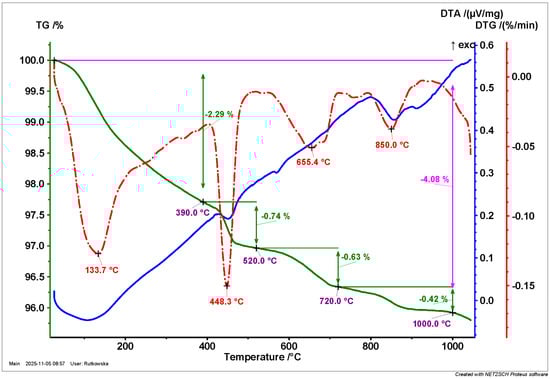
Figure 8.
TG/DTA/DTG curves of samples prepared from modified mortar containing 25% bottom sand (MM_90) after 90 days of curing (prepared by Wioleta Rutkowska). (green arrows–mass losses, pink arrows–LOI).
Thermogravimetry was utilised to analyse the phase composition of hydration products. Within the temperature range of 23–390 °C, mass loss is associated with the dehydration of the C-S(A)-H gel and the hydrated AFt/AFm phases. In the range of 390–520 °C, the effect is attributed to the thermal decomposition of calcium hydroxide. Furthermore, calcium carbonate undergoes decomposition at temperatures ranging from 520 to 1000 °C. As demonstrated in Figure 5, Figure 6, Figure 7 and Figure 8, these three endothermic effects, which are characteristic of cement pastes, are clearly visible.
As presented in Table 19, the mass losses and the loss on ignition are demonstrated. The calculations of calcium hydroxide (Ca(OH)2) and calcium carbonate (CaCO3) can be found in Table 20.
Table 19.
The mass losses and loss on ignition of the control mortar samples and those modified with bottom sand, tested after 28 and 90 days.
Table 20.
Calculations of Ca(OH)2 and CaCO3 quantities for control mortar samples and samples modified with bottom sand, tested after 28 and 90 days.
It can be concluded from the thermal analysis of the mortars presented in Figure 5, Figure 6, Figure 7 and Figure 8 and Table 19 and Table 20 that bottom sand does not exhibit pozzolanic activity. It is evident that no reaction occurs between the bottom sand and calcium hydroxide.
In modified mortar samples, the following observations were made:
- The calcium hydroxide content increased from 2.79% to 3.0% after 28 days and from 2.75% to 3.04% after 90 days (Table 20).
- The content of hydrated calcium silicates decreased from 2.15% to 1.66% after 28 days and from 2.74% to 2.29% after 90 days (Table 19, weight loss in the range of 23–390 °C).
- The calcium carbonate content decreased from 2.47% to 2.07% after 28 days and from 3.16% to 2.38% after 90 days (Table 20).
- The amount of loss on ignition decreased from 3.91% to 3.30% after 28 days and from 4.80% to 4.08% after 90 days (Table 19).
As hydration progressed in both the control mortar and the mortar modified with bottom sand, the following observations were made:
- Calcium hydroxide remained consistent.
- Hydrated calcium silicates increased.
- Calcium carbonate increased.
- Loss on ignition increased.
In light of the aforementioned analysis, it can be concluded that the bottom sand does not demonstrate pozzolanic activity. It is evident that no reaction occurs between the bottom sand and calcium hydroxide.
To summarise the findings of the evaluation of the pozzolanic activity of bottom sand employing two distinct methods, it can be concluded that bottom sand with the previously specified composition, categorised as an ash–slag waste, does not qualify as a pozzolanic active additive.
Therefore, it is not necessarily suitable for use as a binder in cement-free composites, nor as a substitute for cement in cement composites.
5. Conclusions
The present study concentrated on the utilisation of bottom sand (ASW) in cement composites as a replacement for a proportion of the aggregate, and on the evaluation of the pozzolanic properties of the material. Following comprehensive research, the following conclusions were drawn:
- Bottom sand with the specified composition can be utilised as a substitute for aggregate in 25%. The incorporation of the material at this quantity does not result in a statistically significant reduction in flexural strength, compressive strength, water absorption, or apparent density.
- The properties under investigation are negatively impacted by quantities higher than 25%.
- The tested bottom sand is characterised by a higher content of finer fractions, which renders it more water-demanding. The high silica content of this material makes it a valuable substitute for standard sand.
- Adjusting the amount of water to maintain the standard consistency resulted in less favourable test results. Consequently, further studies should assess the impact of adding bottom sand when using admixtures that reduce the amount of water and superplasticisers of various origins.
- The analysis of the pozzolanic activity index confirmed that this particular bottom sand should not be used as a substitute for binder in composites. The material under consideration contains elevated levels of silica, yet it is found to be deficient in aluminium oxide. This combination of properties renders the material unsuitable for utilisation as a pozzolanic additive.
In order to determine the applicability of bottom sand as a new waste material, i.e., ASW, in cementitious or non-cementitious composites, further testing and analysis of their composition in each case is required. Following a series of preliminary tests on mortars, a programme of tests on cement concretes has been planned. A future research direction will involve the assessment of the durability of composites modified with bottom sand. In addition, microstructure tests are required to assess the mechanism of modification of cementitious and non-cementitious composites. On this basis, the potential for incorporating bottom sand as a substitute for quartz sand in various building products, including paving stones and aerated concrete blocks, may be considered.
Author Contributions
Conceptualization, N.S.; methodology, N.S. and W.R.; software, N.S.; validation, N.S.; formal analysis, N.S. and W.R.; investigation, N.S. and W.R.; resources, N.S. and W.R.; data curation, N.S.; writing—original draft preparation, N.S.; writing—review and editing, N.S.; visualization, N.S. and W.R.; supervision, N.S.; project administration, N.S. and W.R. All authors have read and agreed to the published version of the manuscript.
Funding
The study was performed under research project number WZ/WB-IIL/3/2023, funded by the Polish Ministry of Education and Science.
Institutional Review Board Statement
Not applicable.
Informed Consent Statement
Not applicable.
Data Availability Statement
The original contributions presented in this study are included in the article. Further inquiries can be directed to the corresponding author.
Conflicts of Interest
The authors declare no conflicts of interest.
Abbreviations
The following abbreviations are used in this manuscript:
| ASW | Ash and Slag Waste |
| MSWI | Municipal Solid Waste Incineration |
| MAS | Mixture of Ash and Slag |
| SCM | Supplementary Cementitious Materials |
| LC3 | Limestone Calcined Clay Cement |
| LOI | Loss on Ignition |
| PAI | Pozzolanic Activity Index |
| NAAC | Non-Autoclaved Aerated Concrete |
| MM | Modified Mortar |
| CM | Control Mortar |
| AFt | Ettringite |
| AFm | Monosulphate |
References
- Turner, L.K.; Collins, F.G. Carbon Dioxide Equivalent (CO2-e) Emissions: A Comparison between Geopolymer and OPC Cement Concrete. Constr. Build. Mater. 2013, 43, 125–130. [Google Scholar] [CrossRef]
- Singh, B.; Ishwarya, G.; Gupta, M.; Bhattacharyya, S.K. Geopolymer Concrete: A Review of Some Recent Developments. Constr. Build. Mater. 2015, 85, 78–90. [Google Scholar] [CrossRef]
- Ma, C.K.; Awang, A.Z.; Omar, W. Structural and Material Performance of Geopolymer Concrete: A Review. Constr. Build. Mater. 2018, 186, 90–102. [Google Scholar] [CrossRef]
- Huseien, G.F.; Mirza, J.; Ismail, M.; Ghoshal, S.K.; Hussein, A.A. Geopolymer Mortars as Sustainable Repair Material: A Comprehensive Review. Renew. Sustain. Energy Rev. 2017, 80, 54–74. [Google Scholar] [CrossRef]
- Stankiewicz, N. Modified Protective Concrete. Appl. Mech. Mater. 2015, 797, 166–173. [Google Scholar] [CrossRef]
- Stankiewicz, N. Effect of Admixtures on Selected Properties of Fly Ash-Based Geopolymer Composites. Appl. Sci. 2023, 13, 1803. [Google Scholar] [CrossRef]
- Bołtryk, M.; Granatyr, K.; Stankiewicz, N. Ecological Aspects in the Application of Geopolymer Composites on Road Surfaces. Ekon. I Sr. 2019, 68, 10. [Google Scholar] [CrossRef]
- Yagüe-García, S.; García-Giménez, R. Microstructure of Mortar with Ballast Waste as a Cement Replacement. Appl. Sci. 2025, 15, 5605. [Google Scholar] [CrossRef]
- Silva, Y.F.; Burbano-Garcia, C.; Rueda, E.J.; Reyes-Román, A.; Araya-Letelier, G. Short- and Long-Term Mechanical and Durability Performance of Concrete with Copper Slag and Recycled Coarse Aggregate Under Magnesium Sulfate Attack. Appl. Sci. 2025, 15, 8329. [Google Scholar] [CrossRef]
- Alemu, M.Y.; Yehualaw, M.D.; Nebiyu, W.M.; Nebebe, M.D.; Taffese, W.Z. Marble and Glass Waste Powder in Cement Mortar. Appl. Sci. 2025, 15, 3930. [Google Scholar] [CrossRef]
- Kapeluszna, E.; Kotwica, Ł.; Pichór, W.; Nocuń-Wczelik, W. Cement-Based Composites with Waste Expanded Perlite—Structure, Mechanical Properties and Durability in Chloride and Sulphate Environments. Sustain. Mater. Technol. 2020, 24, e00160. [Google Scholar] [CrossRef]
- Li, X.; Qin, D.; Hu, Y.; Ahmad, W.; Ahmad, A.; Aslam, F.; Joyklad, P. A Systematic Review of Waste Materials in Cement-Based Composites for Construction Applications. J. Build. Eng. 2022, 45, 103447. [Google Scholar] [CrossRef]
- Chinnu, S.N.; Minnu, S.N.; Bahurudeen, A.; Senthilkumar, R. Influence of Palm Oil Fuel Ash in Concrete and a Systematic Comparison with Widely Accepted Fly Ash and Slag: A Step towards Sustainable Reuse of Agro-Waste Ashes. Clean. Mater. 2022, 5, 100122. [Google Scholar] [CrossRef]
- Renuka, V.; Rao, S.V.; Tadepalli, T. State-of-the-Art Review on Limestone Calcined Clay Cement (LC3) and Its Recent Advances. Iran. J. Sci. Technol. Trans. Civ. Eng. 2025. [Google Scholar] [CrossRef]
- Collivignarelli, M.C.; Cillari, G.; Ricciardi, P.; Miino, M.C.; Torretta, V.; Rada, E.C.; Abbà, A. The Production of Sustainable Concrete with the Use of Alternative Aggregates: A Review. Sustainability 2020, 12, 7903. [Google Scholar] [CrossRef]
- Kirthika, S.K.; Singh, S.K.; Chourasia, A. Alternative Fine Aggregates in Production of Sustainable Concrete—A Review. J. Clean. Prod. 2020, 268, 122089. [Google Scholar] [CrossRef]
- Dias, S.; Almeida, J.; Tadeu, A.; de Brito, J. Alternative Concrete Aggregates—Review of Physical and Mechanical Properties and Successful Applications. Cem. Concr. Compos. 2024, 152, 105663. [Google Scholar] [CrossRef]
- Luhar, I.; Luhar, S.; Abdullah, M.M.A.B.; Nabiałek, M.; Sandu, A.V.; Szmidla, J.; Jurczyńska, A.; Razak, R.A.; Aziz, I.H.A.; Jamil, N.H.; et al. Assessment of the Suitability of Ceramic Waste in Geopolymer Composites: An Appraisal. Materials 2021, 14, 3279. [Google Scholar] [CrossRef]
- Jha, A.K.; Parihar, R.S.; Lodhi, V.; Misra, R.; Kumar, B.; Udeniya, A. A Review on the Recycling Waste Materials for Green Concrete. Eur. J. Appl. Sci. Eng. Technol. 2024, 2, 74–82. [Google Scholar] [CrossRef]
- Hashmi, A.F.; Khan, M.S.; Bilal, M.; Shariq, M.; Baqi, A. Baqi Green Concrete: An Eco-Friendly Alternative to the OPC Concrete. Construction 2022, 2, 93–103. [Google Scholar] [CrossRef]
- Kalombe, R.M.; Ojumu, V.T.; Eze, C.P.; Nyale, S.M.; Kevern, J.; Petrik, L.F. Fly Ash-Based Geopolymer Building Materials for Green and Sustainable Development. Materials 2020, 13, 5699. [Google Scholar] [CrossRef]
- Liew, K.M.; Sojobi, A.O.; Zhang, L.W. Green Concrete: Prospects and Challenges. Constr. Build. Mater. 2017, 156, 1063–1095. [Google Scholar] [CrossRef]
- Suhendro, B. Toward Green Concrete for Better Sustainable Environment. Procedia Eng. 2014, 95, 305–320. [Google Scholar] [CrossRef]
- Sivakrishna, A.; Adesina, A.; Awoyera, P.O.; Kumar, K.R. Green Concrete: A Review of Recent Developments. Mater. Today Proc. 2020, 27, 54–58. [Google Scholar] [CrossRef]
- Regulation of the Minister of Climate of 2 January 2020 on a Catalog of Waste (Polish Journal of Laws 2020, Item 10). Available online: https://www.sejm.gov (accessed on 3 November 2025).
- Kozioł, W.; Ciepliński, A.; Machniak, Ł.; Borcz, A. Aggregates in Construction Industry. Part 2. Alternative Aggregates. Nowocz. Bud. Inżynieryjne (Mod. Eng. Constr.) 2015, 5, 35–40. [Google Scholar]
- Aldungarova, A.; Aryngazin, K.; Larichkin, V.; Abisheva, A.; Alibekova, K. Modern Trends in the Development of the Construction Industry in the Production of Building Materials. Technobius 2021, 1, 0003. [Google Scholar] [CrossRef]
- Menshov, P.V.; Khlupin, Y.V.; Nalesnik, O.I.; Makarovskikh, A.V. Ash and Slag Waste as a Secondary Raw Material. Procedia Chem. 2014, 10, 184–191. [Google Scholar] [CrossRef]
- Novytskyi, Y.; Yatsenko, V.; Topylko, N. Prerequisites for the Implementation of the European Experience in the Use of Ash-Slag Materials in the Construction of Highways: A Review. Theory Build. Pract. 2022, 2022, 90–97. [Google Scholar] [CrossRef]
- Malchik, A.G.; Litovkin, S.V.; Rodionov, P.V.; Kozik, V.V.; Gaydamak, M.A. Analyzing the Technology of Using Ash and Slag Waste from Thermal Power Plants in the Production of Building Ceramics. IOP Conf. Ser. Mater. Sci. Eng. 2016, 127, 012024. [Google Scholar] [CrossRef]
- Yatsenko, E.A.; Goltsman, B.M.; Izvarin, A.I.; Kurdashov, V.M.; Smoliy, V.A.; Ryabova, A.V.; Klimova, L.V. Recycling Ash and Slag Waste from Thermal Power Plants to Produce Foamed Geopolymers. Energies 2023, 16, 7535. [Google Scholar] [CrossRef]
- Gruchot, A.; Zydroń, T. Geotechnical Parameters of the Ash-Slag Mixture from Hard Coal Burning Concerning Its Usability for Earthworks. Annu. Set. Environ. Prot. 2013, 15, 1719–1737. [Google Scholar]
- Bieliatynskyi, A.; Yang, S.; Pershakov, V.; Akmaldinova, O.; Krayushkina, K.; Shao, M. Prospects for the Use of Ash and Slag Waste in the Construction of Road Pavement. Balt. J. Road Bridge Eng. 2022, 17, 80–94. [Google Scholar] [CrossRef]
- Regulation of the Minister of the Environment of 11 May 2015 on Waste Recovery Outside Installations and Equipment (Polish Journal of Laws 2015, Item 796). Available online: https://www.sejm.gov (accessed on 3 November 2025).
- Klyuev, S.V.; Slobodchikova, N.A.; Saidumov, M.S.; Abumuslimov, A.S.; Mezhidov, D.A.; Khezhev, T.A. Application of Ash and Slag Waste from Coal Combustion in the Construction of the Earth Bed of Roads. Constr. Mater. Prod. 2024, 7, 3. [Google Scholar] [CrossRef]
- Zawisza, E.; Gruchot, A. Shear Strength of Ash-Slag Mixture Stabilised with Hydraulic Binders. J. Civ. Eng. Environ. Archit. 2017, 34, 115–122. (In Polish) [Google Scholar] [CrossRef][Green Version]
- Zawisza, E.; Bigos, M.; Gruchot, A. Stabilisation of Ash–Slag Mixtures with Hydraulic binders for Road Engineering Purposes. Sci. C Rev.-Eng. Environ. Sci. 2018, 27, 123–131. (In Polish) [Google Scholar] [CrossRef]
- Kalinowska-Wichrowska, K.; Pawluczuk, E.; Bołtryk, M.; Nietupski, A. Geopolymer Concrete with Lightweight Artificial Aggregates. Materials 2022, 15, 3012. [Google Scholar] [CrossRef]
- Yatsenko, E.A.; Zubekhin, A.P.; Smolii, V.A.; Grushko, I.S.; Kosarev, A.S.; Gol’tsman, B.M. Resource-Conserving Technology of Heat-Insulation-Decorative Glass-Composite Material Based on Ash-Slag Wastes. Glass Ceram. 2015, 72, 216–219. [Google Scholar] [CrossRef]
- Rudenko, O.; Beisekenov, N.; Sadenova, M.; Galkina, D.; Kulenova, N.; Begentayev, M. Physical–Mechanical and Microstructural Properties of Non-Autoclaved Aerated Concrete with Ash-and-Slag Additives. Sustainability 2024, 17, 73. [Google Scholar] [CrossRef]
- Tkaczewska, E. Application of Ash-and-Slag Mixture Formed during Bituminous Coal Combustion in Cement Production. Ceram. Mater. 2018, 70, 257–266. [Google Scholar]
- EN 450-1:2012; Fly Ash for Concrete—Part 1: Definition. Specifications and Conformity Criteria. European Committee for Standardization: Brussels, Belgium, 2012.
- EN 197-1:2011; Cement—Part 1: Composition, Specifications and Conformity Criteria for Common Cements. European Committee for Standardization: Brussels, Belgium, 2011.
- EN 196-1:2016; Methods of Testing Cement—Part 1: Determination of Strength. European Committee for Standardization: Brussels, Belgium, 2016.
- EN 1015-3:1999/A2:2006; Methods of Test for Mortar for Masonry—Part 3: Determination of Consistence of Fresh Mortar (by Flow Table). European Committee for Standardization: Brussels, Belgium, 2006.
- EN 1015-4:1998; Methods of Test for Mortar for Masonry—Part 4: Determination of Consistence of Fresh Mortar (by Plunger Penetration). European Committee for Standardization: Brussels, Belgium, 1988.
- EN 933-1:2012; Tests for Geometrical Properties of Aggregates—Part 1: Determination of Particle Size Distribution—Sieving Method. European Committee for Standardization: Brussels, Belgium, 2012.
- PN-B-04500:1985; Zaprawy Budowlane—Badania Cech Fizycznych i Wytrzymałościowych. Polish Committee for Standardization: Warsaw, Poland, 1985.
- Microsoft Excel, Microsoft 365 Subscription; Microsoft: Redmond, WA, USA, 2025.


Disclaimer/Publisher’s Note: The statements, opinions and data contained in all publications are solely those of the individual author(s) and contributor(s) and not of MDPI and/or the editor(s). MDPI and/or the editor(s) disclaim responsibility for any injury to people or property resulting from any ideas, methods, instructions or products referred to in the content. |
© 2025 by the authors. Licensee MDPI, Basel, Switzerland. This article is an open access article distributed under the terms and conditions of the Creative Commons Attribution (CC BY) license (https://creativecommons.org/licenses/by/4.0/).