Abstract
Excavation is a common requirement in engineering construction within rock masses. While excavation volumes are generally limited in road slope projects, they may become substantial in large-scale operations such as deep open pit mines. The interaction between time and cost in excavation processes is strongly controlled by rock mass excavatability, which has been recognized as a key factor in project budgets. Since the 1970s, excavatability assessment has therefore attracted considerable research interest in rock mechanics. In this study, the excavatability cases previously plotted on the Geological Strength Index (GSI) versus Uniaxial Compressive Strength of the Rock Mass (σc_rm) diagram in the literature were improved by employing an Artificial Neural Network (ANN). The ANN approach was used to investigate the boundaries between digger, ripper, and hammer+blasting excavation classes within the available case zones defined by GSI–σc_rm data pairs. The prediction performance of the developed rock mass excavatability chart is highly acceptable, with correct classification rates of 91.1% for blasting+hammer and ripper classes, and 87.2% for the ripper class. Considering GSI and σc_rm as the main input parameters, the proposed ANN-oriented excavatability chart is highly acceptable for preliminary equipment selection during the design stage of surface rock mass excavations, including slope cases.
1. Introduction
Design of engineering applications such as tunnels, foundations, and slopes constructed on or in the rock masses are closely related to the engineering properties of rock masses. Engineering applications such as tunnels, foundations, and slopes constructed on or within rock masses are strongly influenced by the engineering properties of those rock masses. Consequently, the engineering parameters of rock masses can vary widely—from very weak to very strong—depending on both the inherent properties of the rock material and the characteristics of discontinuities present. The selection of the economical and safe excavation method is very important at the initial design stage of engineering structures to be constructed on rock masses. As a simple definition of excavatability, Kesimal et al. [1] defined excavatability as a relation between geomechanical, geotechnical parameters, and production rate of excavation. The importance of selection of proper excavation methods by emphasizing the economic value of excavatability was pointed out by Khamehchiyan et al. [2]. A detailed review on excavation of rock mass was provided in the studies performed by MacGregor et al. [3] and Basarir and Karpuz [4].
Although the degree of excavatability difficulty of rock masses depends on mainly the geomechanical parameters of rock material together with properties of the discontinuities, some additional effects such as excavation volume per unit time and excavation costs may play an important role in the process of selecting the excavation method. As a well-known measure of the quality of rock masses, rock mass classifications such as Rock Mass Rating (RMR), Tunneling Quality Index (Q), and Geological Strength Index (GSI) are widely used as fundamental input parameters in predicting the strength and deformation of rock masses [5,6,7,8,9,10]. In addition, some of the newest research related to this study has been incorporated into the Introduction to provide a broader context. For instance, recent studies on thermo-mechanical degradation and fracture evolution in low-permeability coal subjected to cyclic heating–cryogenic cooling (Wang et al. [11]), as well as in situ nuclear magnetic resonance (NMR) observation of pore fractures and permeability evolution in rock and coal under triaxial compression (Teng et al. [12]), highlight the mechanisms of progressive damage and fracture evolution under thermal and mechanical effects, which are relevant to understanding rock mass behavior in excavation applications.
Due to the use of easy inputs in defining the quality of the rock mass by using the rock mass structure and discontinuity surface properties, the GSI chart was also used for selection of excavation type by Tsiambaos and Saroglou [13]. However, Tsiambaos and Saroglou [13] proposed two separate GSI excavatability charts by considering point load index of rock material (Is50), higher and less than 3 MPa. Although a threshold value for Is50 as 3 MPa was taken into consideration by Tsiambaos and Saroglou [13], the use of a continuous scale of Is50 was not included in their study. On the other hand, Pettifer and Fookes [14] emphasized that “the production expenses (excavation rates and costs) should be determined and taken into account before starting the excavation process”. While these two basic GSI excavatability charts may seem sufficient for selecting the excavation type, it includes some deficiencies because two charts do not consider some indirect effects on selection of excavation type such as excavation volume per unit of time and excavation cost per unit volume. As an improvement to this logic gap, Dagdelenler et al. [15] proposed a new innovative approach based on GSI, which considers the optimum excavation methods, together with a flexible structure that includes additional effects such as excavation volume per unit of time and excavation cost per unit volume indirectly through expert opinion. For this aim Dagdelenler et al. [15] introduced two new terms to the literature: the optimum Excavation Power Index (EPIopt), determined by using GSI and Excavation Power Rating (EPR). Dagdelenler et al. [15] effectively used an artificial neural network (ANN), which is a well-known fundamental tool of soft computing, in their study. A chart on the excavatability of rock mass based on GSI was produced by Hoek and Karzulovic [16]. The data collected by Abdullatif and Cruden [17] were only plotted on the graphical presentation having two axes, namely GSI versus uniaxial compressive strength of the rock mass (σc_rm) by Hoek and Karzulovic [16].
A valuable study by Dagdelenler compared the efficiency of selected excavatability assessment methods for surface excavation of rock masses [18]. Optimum EPI (EPIopt) relation proposed by Dagdelenler et al. [15] was introduced to the graphical presentation for assessment of excavatability of rock mass proposed by Hoek and Karzulovic [16]. While the data given by Dagdelenler [8], including the data collected by Abdullatif and Cruden [17], were plotted on the modified graphical presentation, the performance of the use of EPIopt relation proposed by Dagdelenler et al. [15] on the graphical presentation proposed by Hoek and Karzulovic [16] was not investigated in detail by Dagdelenler [18].
In this study, the graphical presentation with the axes GSI and σc_rm, proposed by Hoek and Karzulovic [16], was adapted for determining the EPIopt of rock masses using an Artificial Neural Network (ANN) algorithm. Finally, the obtained EPIopt relation was compared with the original EPIopt relation proposed by Dagdelenler et al. [15].
2. Brief Literature Review on the Excavatability Assessments of Rock Masses
2.1. Early Empirical Approaches
Excavatability of rock masses has been investigated since the 1970s due to its critical impact on excavation time, cost, and equipment selection. Early studies primarily focused on empirical classification systems linking macroscopic rock-mass properties—such as discontinuity spacing, persistence, condition, joint orientation, density, and nature of rock [19,20,21,22,23,24] to excavation ease and likely excavation methods. Consequently, excavatability assessment and the selection of suitable excavation techniques have become a prominent research topic in rock mechanics. In addition to these macroscopic properties, several researchers incorporated strength-related parameters to improve excavatability assessments. Parameters such as uniaxial compressive strength (UCS), point load index (Is50), and seismic velocity (Vs) were used to better characterize rock mass behavior and predict excavation difficulty [25,26,27,28,29]. By incorporating these mechanical and geomechanical parameters, these studies enabled a more quantitative assessment of excavatability, bridging the gap between purely empirical classifications and more sophisticated approaches that consider both rock mass strength and structural features.
Pettifer and Fookes [14] highlighted the importance of economic considerations by stating that “the production expenses (excavation rates and costs) should be determined and taken into account before starting the excavation process.” This perspective is crucial for excavation method selection, since in practice relatively easy-to-excavate rock masses may still require the use of more powerful methods, such as hammer and blasting when large excavation volumes per unit time are involved; whereas, in slope excavations where precision and safety are critical, less aggressive techniques, such as digging, may be more appropriate. Although early empirical systems provided practical and widely applied guidelines, they lacked the flexibility to incorporate such indirect factors as excavation volume, unit cost, and performance optimization. This methodological gap persisted in the literature until the development of more advanced frameworks, such as the GSI-based charts of Hoek and Karzulovic [16] and, more recently, the flexible Excavation Assessment System (EXCASS) introduced by Dagdelenler et al. [15], with a more detailed description of EXCASS provided in the following sections.
2.2. GSI-Based Excavatability Assessments
The Geological Strength Index (GSI), introduced into rock mechanics by Hoek and co-authors, has become an attractive input parameter for defining rock mass quality in terms of the overall structure and the surface properties of discontinuities. This practical tool, widely adopted in rock mechanics applications, was also utilized by Hoek and Karzulovic [16] to propose three excavatability categories—dig, rip, and blast—based on the combination of GSI and the uniaxial compressive strength of the rock mass (σc_rm). Their study employed the dataset originally compiled by Abdullatif and Cruden [17]. Although the plotted data were successfully classified into excavatability categories, no practical guidelines were provided for practitioners on how to apply the graphical chart in excavation method selection.
A subsequent study by Tsiambaos and Saroglou [13] extended this approach by incorporating the point load strength index (Is50) of intact rock, which is a strength index test recommended by ISRM [30], together with GSI. In their chart, only two excavatability classes were presented, with a single Is50 threshold of 3 MPa distinguishing between weak and strong rock. However, the continuous scale of Is50 values was not considered, thereby limiting the applicability of their method. More importantly, both of these GSI-based excavatability assessment charts lacked the flexibility to account for indirect factors that are often critical in practice, such as excavation volume per unit time and excavation cost per unit volume.
2.3. Flexible Approaches: EXCASS
The EXCASS (Excavation Assessment System) is a flexible excavatability assessment approach developed by Dagdelenler et al. [15]. It facilitates the selection of the optimal excavation method by integrating the optimum Excavation Power Index (EPIopt) with the Excavation Performance Rating (EPR), allowing for adjustment of excavation intensity. Its flexible and practical framework also enables the prediction of the degree of disturbance even at the preliminary design stage. The values of GSI and Is50 are used as inputs in EXCASS for the determination of the optimum Excavation Power Index (EPIopt). The EPI value varies between 0 and 100 depending on the difficulty of the excavation method (Table 1). Although the relation for EPIopt is shown as a yellow colored curve in Figure 1 and Equation (1), the flexibility of the proposed EXCASS comes from the use of Excavation Performance Rating (EPR).

Table 1.
Excavation Power Index (EPI) classification based on method of excavation such as blasting, hammer, ripper, and digger (from Dagdelenler et al. [15]).
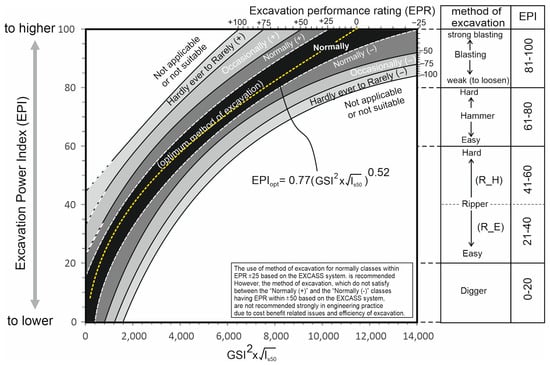
Figure 1.
Excavation assessment system (EXCASS) based on the Excavation Power Index (EPI) and Excavation Performance Rating (EPR) (from Dagdelenler et al. [15]).
The flexibility of EXCASS arises from the excavation performance rating (EPR), which allows practitioners to adjust the excavation method to account for indirect factors. An EPR of zero represents the optimum method of excavation depending on EPIopt, while values ranging from +100 to −100, on either the positive or negative side, indicate the selection of stronger or weaker excavation methods depending on excavation volume or unit cost (Figure 1). Since this study focuses on selecting the optimum excavation method, detailed information on the use of EPR can be found in Dagdelenler et al. [5].
Table 1 presents the EPI classification for different excavation methods (digger, ripper, hammer, blasting) as defined by Dagdelenler et al. [15].
2.4. Graphical Representation of EXCASS
The EPIopt relation proposed by Dagdelenler et al. [15] was incorporated into the graphical excavatability assessment framework of Hoek and Karzulovic [16]. In this study, Dagdelenler [18] plotted the entire dataset, including that collected by Abdullatif and Cruden [17], onto the original chart of Hoek and Karzulovic [16], and then added EPIopt curves corresponding to 20, 40, 60, and 80 (Figure 2). For this purpose, Equation (1) was rearranged by Dagdelenler [18] in terms of GSI and σc_rm, as given in Equations (2)–(5).
where EPIopt is the optimum value of excavation power index defined by Dagdelenler et al. [15], σc_rm and σci are the uniaxial strengths of the rock mass and intact rock, respectively, Is50 is the point load strength index, GSI is the Geological Strength Index, and s and a are coefficients used in the latest Hoek–Brown failure criterion.
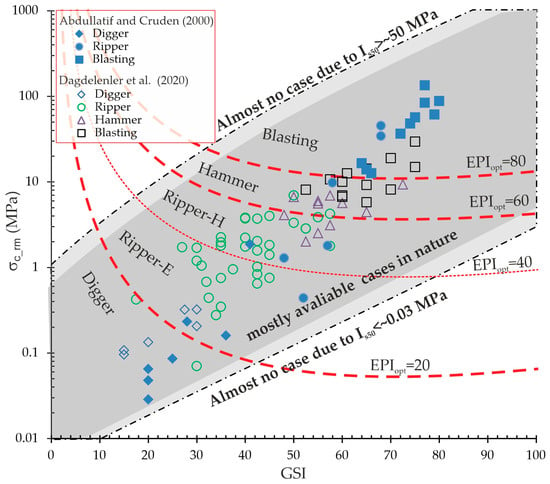
Figure 2.
Modified graphical presentation by Dagdelenler [18] showing the relationship between rock mass strength and GSI for different excavation methods, with the plotted data reported by Abdullatif and Cruden [17] and Dagdelenler et al. [15].
The resulting chart identifies zones for digger, ripper, hammer, and blasting methods, providing a practical and flexible tool for preliminary excavation method selection (Figure 2).
In the context of this study, which aims to re-evaluate excavatability boundaries on the GSI–σc_rm chart originally proposed by Hoek and Karzulovic [16], the EXCASS framework and its slight modifications [15,18] are considered. Detailed discussions of earlier excavatability assessment methods can be found in Dagdelenler [18].
3. Statistical Evaluation of the Database
In this study, the database compiled by Dagdelenler [18] was utilized. This database originally included 73 surface excavation cases from Greece and Turkey, reported in Dagdelenler et al. [15]. Of these, 61 cases from Greece were documented in detail by Tsiambaos and Saroglou [13], while 12 cases from Turkey were presented by Dagdelenler et al. [15]. Since 7 of the Greek cases lacked Is50 values, they were excluded from the present analysis. In addition, Dagdelenler [18] incorporated 23 cases published by Abdullatif and Cruden [17], which had also been employed in the excavatability study of Hoek and Karzulovic [16]. Consequently, a total of 89 datasets were analyzed in this study.
While GSI values of rock masses are available for the data from Greece and Turkey, the 1976 version of RMR (RMR76) and Q values are presented in the datasets collected by Abdulatif and Cruden [17]. The value of GSI and σc_rm are two inputs of the graphical presentation by Hoek and Karzulovic [16]. The details of the conversions from RMR and Q to average values of GSI, as well as the prediction of σc_rm considering rock type and Is50, are not given in this study; however, a comprehensive explanation of these methods is available in Dagdelenler [18]. Histograms of GSI, Is50, σc_rm, and the excavation methods used in the datasets are presented in Figure 3.
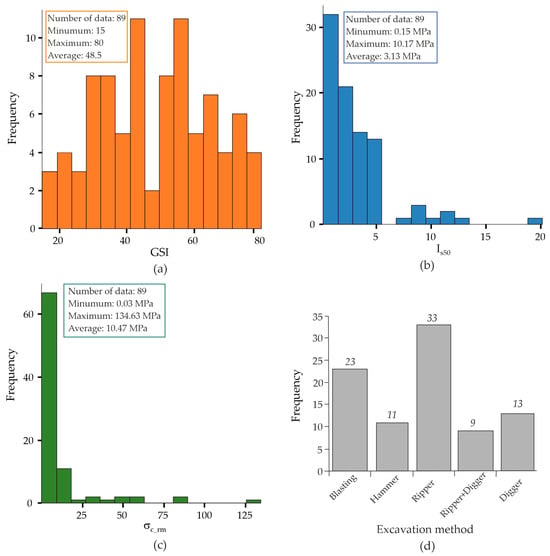
Figure 3.
Frequency histograms of (a) GSI, (b) Is50, (c) σc_rm, and (d) excavation method in the datasets used in this study (modified from Dagdelenler [18]).
4. Development of an ANN-Driven Excavability Chart Integrating GSI and σc_rm
As traditional tools, regression-based statistical methods—where easily available inputs are used as independent variables to predict engineering parameters for design purposes—have been frequently applied in rock engineering practice. However, traditional statistical tools can be inadequate for addressing complex engineering problems, and soft computing techniques have become popular prediction tools across many engineering applications due to their powerful capabilities [31,32,33,34,35,36,37,38]. In this study, the problem to be generalized was addressed using 89 datasets; therefore, an artificial neural network (ANN) was considered a suitable soft computing tool for this purpose. As is well known, the ANN architecture consists of hidden layers situated between the input and output layers. The aim of this study was to develop a new model using GSI and σc_rm as input parameters, based on the graphical presentation proposed by Hoek and Karzulovic [16]. Although more advanced soft computing techniques are available in the literature, in this study the Artificial Neural Network (ANN) was used as a tool to support the main objective rather than being the primary focus. ANN was chosen due to its proven ability to model complex and nonlinear relationships between rock properties and mechanical parameters, as shown in numerous previous studies. Furthermore, its flexibility in capturing interactions among multiple input variables without requiring explicit mathematical formulations made it a suitable complementary approach for this study.
4.1. ANN Analysis for GSI- and σc_rm-Oriented Excavatability Prediction
In general, the number of hidden layers is selected based on the complexity of the problem. For complex problems, several trials with different ANN architectures can be conducted to determine the best solution, as performed by Sonmez et al. [33]. In this study, one hidden layer with two neurons was preferred due to the simple structure of the excavatability classification problem and the relatively small total number of datasets. The back-propagation artificial neural network (BPNN) algorithm, which has been widely used in engineering problems, was selected [15,31,34,35]. The sigmoid transfer function was selected as the activation function. The maximum number of training epochs (cycles) was set to 10,000; however, the training phase of the ANN was stopped when the root mean square error (RMSE) reached 0.001, which was defined as the stopping criterion. Although the stopping criterion was applied during the training phase, the potential for overlearning was also visually evaluated using graphs of the number of training cycles versus RMSE values for both the training and testing datasets. The generalization capability of an ANN is lost during the overlearning stage. As indicated by Basheer and Hajmeer [39], the point on the testing RMSE curve closest to the training RMSE curve can be considered as representing the optimal number of cycles before the onset of overlearning. The other input parameters—the momentum coefficient and the learning rate—were set to 0.95 and 0.1, respectively. The computer code developed by Prof. Harun Sonmez was employed in this study [31,35]. The ANNES program is user-friendly and capable of handling both prediction and classification problems. Input datasets are prepared as a raw data matrix in text format with a “.dat” extension. During each epoch cycle, the signal parameters between neurons—including weight and threshold values—are automatically saved as a text file. This file can later be reloaded to generate outputs while controlling the overlearning stage. ANNES reads the raw data matrix from the “.dat” file, and all subsequent steps are carried out automatically by the program. Finally, the output is saved in “*.txt” format, incorporating the weight and threshold values for every cycle stage.
The ANN structure consists of one input layer and one output layer, in addition to one or more hidden layers. The number of hidden layers and the number of neurons in these layers should be determined based on the complexity of the problem. However, a simple ANN architecture with acceptable prediction capacity should be preferred whenever possible to avoid overlearning [36]. In addition, the number of training datasets significantly affects the complexity of the ANN structure. The problem addressed in this study, however, involves two inputs and one output; therefore, a single hidden layer was employed. The number of neurons in the hidden layer is as important as the number of hidden layers. For this purpose, heuristic recommendations for selection of total number of neurons in hidden layers are also available in the literature (Table 2). The total number of neurons in the hidden layer, calculated using different heuristic approaches, is presented in Table 2. The number of neurons to be used in the hidden layer ranges from 2 to 6. Additionally, Alvarez Grima et al. [40] and Sonmez and Gokceoglu [41] emphasized that using too many neurons may lead to overlearning. ANN structures configured with 2, 3, 4, 5, and 6 neurons in the hidden layer, respectively, were trained using the same train and test datasets for their performance evaluations. An ANN structure with one hidden layer containing two neurons which was employed for the first trials is given as an example in Figure 4.

Table 2.
Heuristic approach for determination of total number of neurons in hidden layers (from Sonmez et al. [31]).
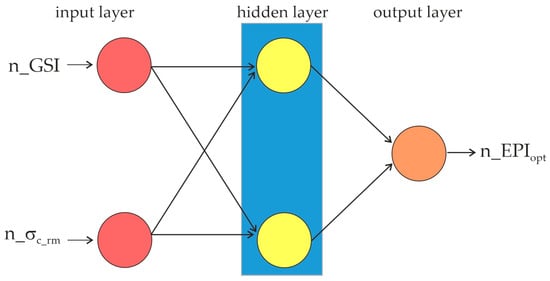
Figure 4.
An example of the ANN structure used in the first trial.
The two inputs (GSI and σc_rm) and the output (EPIopt) values of the datasets used in the ANN analysis need to be normalized between 0 and 1. As is well known, GSI varies between 0 and 100; therefore, GSI values were normalized by dividing by 100. The maximum σc_rm in the dataset is 134.6 MPa, so in principle, σc_rm values could be normalized by dividing by this maximum to achieve a normalized value of 1. Even if the maximum σc_rm in the dataset is 134.6 MPa, it is almost impossible to mention a specific value for the highest σc_rm in nature. For instance, the International Society for Rock Mechanics (ISRM) suggested classification for σc_rm is very low (<5 MPa), low (5–25 MPa), moderate (25–50 MPa), medium (50–100 MPa), high (100–250 MPa), and very high (>250 MPa). On the other hand, it can be said from experience, that more powerful excavation methods will be needed for high and very high values of σc_rm. Therefore, for an upper value exceeding 134.6 MPa, all σc_rm values were normalized by dividing by 150 MPa. However, the output of the study can be expected to be meaningful for normalized σc_rm values assumed to be equal to 1, for rock materials with values exceeding 150 MPa. Although the excavation method in 3 out of the 23 datasets collected by Abdullatif and Cruden [17] was defined as rippers, the GSI and σc_rm values were higher than 50 and 10 MPa, respectively. In order to reduce disturbance to the rock mass during small-volume excavations, excavation methods such as ripping or digging may be preferred based on practical experience, even though more powerful excavation methods are considered optimal. Since this study focuses on the optimum excavation method, these three data were excluded. Therefore, excavation by ripping does not appear to be the optimal method from practical experience for these three cases. In this study, since the aim was to revise the chart presented by Hoek and Karzulovic [16] by considering the excavatability classification of EPIopt, only these 3 contradictory datasets were excluded from the 23 cases collected by Abdullatif and Cruden [17] prior to the ANN analysis (Figure 5). While 70% of the 86 datasets (61 datasets) were randomly selected for the training stage, the remaining datasets were used for testing. When the distribution of the training and test data was compared on the GSI vs. σc_rm plot, it is clearly seen that both sets have a similar distribution, which is important for a successful ANN application (Figure 5).
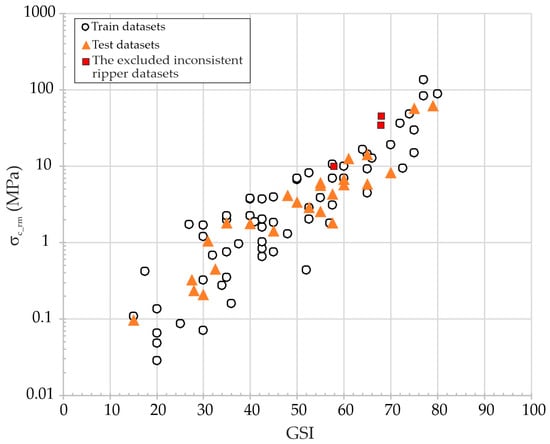
Figure 5.
Distribution of training, testing, and excluding datasets on GSI versus σc_rm graph.
Five ANN structures including 2, 3, 4, 5, and 6 neurons in the hidden layer, respectively, were trained by using the same train and test datasets for their performance comparisons. Since the model outputs continuous values, the use of regression-based performance metrics such as root mean squared error (RMSE), variance accounted for (VAF), mean absolute percentage error (MAPE), and square of the coefficient of correlation (R2) were preferred (Equations (7)–(9)). As can be seen in Figure 6, the decreasing trend in root mean square error (RMSE) values for the five ANN models slows after approximately the 40th epoch (cycle) in both the training and test datasets; therefore, the remaining epochs can be considered as the over-learning stage. For this reason, the 40th epoch was considered as the limit value for the generalization capacity of the five ANN models. ANNES’s computer codes have the ability to revert to any training epoch using the weights and activation thresholds stored in the automatically generated “error_limit.txt” file for the ANN model. To check the prediction capacity of the five ANN models at the 40th epoch, the predicted EPIopt values for both the training and testing datasets were calculated by ANNES considering the 40th epoch (Table 3). As seen in Table 3, performance metrics of the 2–2–1 ANN model such as RMSE, VAF, MAPE, and R2 were slightly better than others. Therefore, the 2–2–1 ANN model was used to develop an ANN–driven a generalized rock mass excavatability chart integrating GSI and σc_rm. The cross-correlation graph of the 2–2–1 ANN model, showing the measured versus the predicted EPIopt was given in (Figure 7).
where ymeasured and ypredicted are the measured and predicted output values, and n is the amount of data.
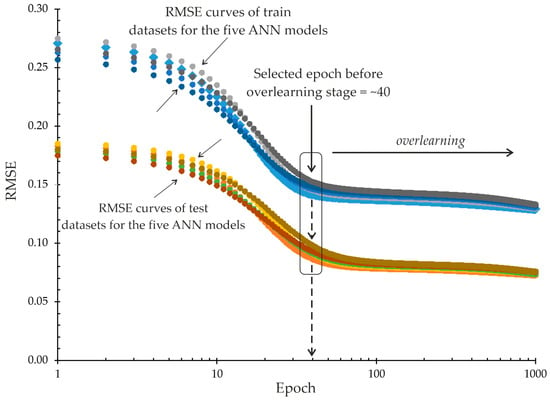
Figure 6.
Relationship between the number of epochs and RMSE for the five ANN models used to determine the optimum training epoch.

Table 3.
Performance metrics such as RMSE, VAF, MAPE, and R2 for the five ANN models.
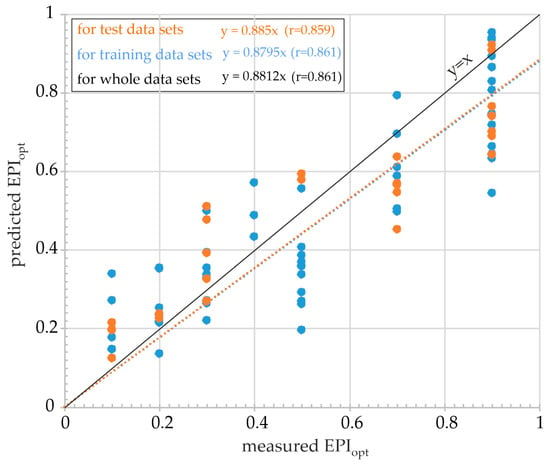
Figure 7.
Cross-correlation graph of the 2–2–1 ANN model showing the relation between measured and predicted EPIopt values.
4.2. Production of GSI- and σc_rm-Oriented Excavatability Prediction Chart
By using the weight and threshold values of the 2–2–1 ANN model at the 40th epoch, the normalized EPIopt can be predicted for the normalized GSI and σc_rm input pairs using an ANN-based computer code such as ANNES. However, to improve the practical value of the 2–2–1 ANN model, an EPIopt prediction chart was prepared using GSI vs. σc_rm input pairs. For this purpose, an input matrix combining GSI and σc_rm was produced, as illustrated in Figure 8a. The GSI vs. σc_rm data pairs of each point in the input matrix were run to determine EPIopt using the weight and threshold values of the 2–2–1 ANN model at the 40th epoch. The determined EPIopt outputs of the 2–2–1 ANN model were contoured using the boundary values of the classification given in Table 1. Then, representative EPIopt curves were drawn in the zones corresponding to the most commonly occurring cases in nature based on these contours (Figure 8b). The representative EPIopt curves were overlaid on the graphical presentation of GSI versus σc_rm to evaluate the prediction performance of excavatability classes (Figure 9).
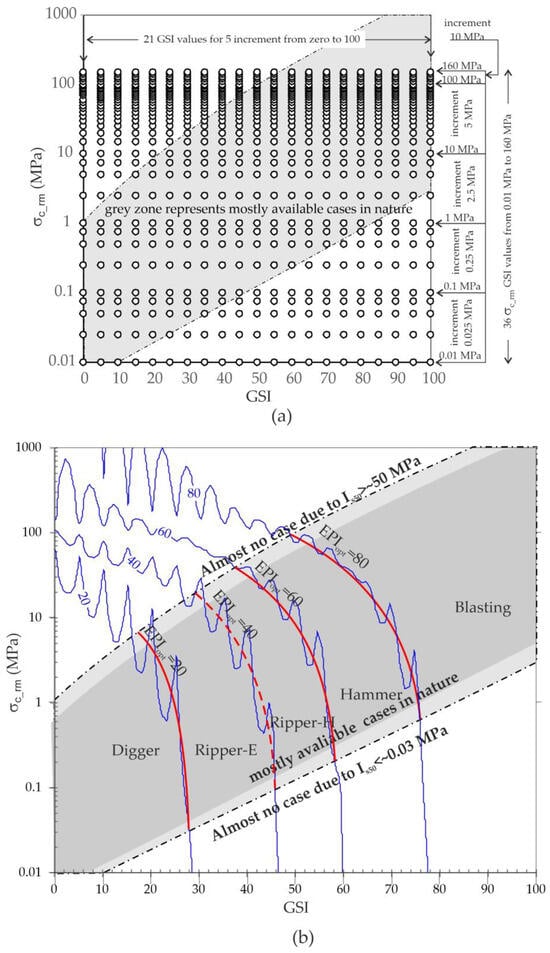
Figure 8.
(a) Input matrix points generated by combining GSI and σc_rm, and (b) contours of 20, 40, 60, and 80 for the 2–2–1 ANN-predicted EPIopt outputs with representative values.
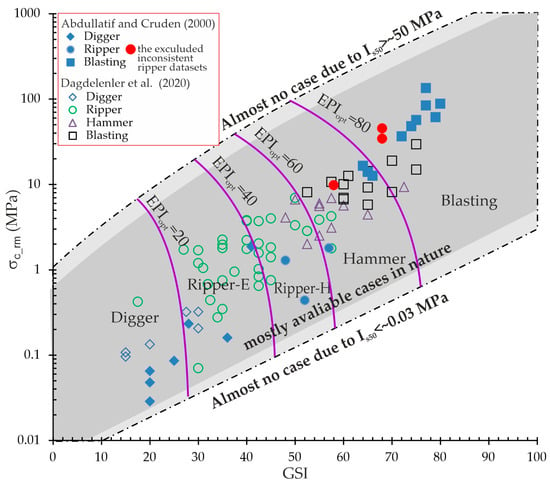
Figure 9.
Graphical presentation of GSI versus σc_rm with the generalized EPIopt curves obtained from the 2–2–1 ANN model, with the plotted data reported by Abdullatif and Cruden [17] and Dagdelenler et al. [15].
The performance evaluation of the graphical presentation of GSI versus σc_rm with the generalized EPIopt curves obtained from the ANN was evaluated using histogram graphics showing the percentage of acceptable predictions. For this purpose, the cases falling into the Ripper-E and Ripper-H classes on the graph were counted together as Ripper, while the Blasting and Hammer classes were counted separately in the first-stage evaluation (Figure 10a). As seen in Figure 10a, Hammer and Ripper cases have acceptable prediction percentages of 63.6% and 87.2%, respectively. However, the predictions for Blasting and Digger cases were of average accuracy, and these cases were generally shared with adjacent excavation methods. In fact, this is a reasonable situation, as factors such as total excavation volume and completion time may often lead to the selection of an excavation method that is one class above or below. As seen in Figure 10b, Blasting and Hammer classes were counted together in the second-stage evaluation due to the lack of separate identification by Hoek and Karzulovic [16]. Hence, the prediction performance of the combined Blasting + Hammer classes increases to 91.2%.
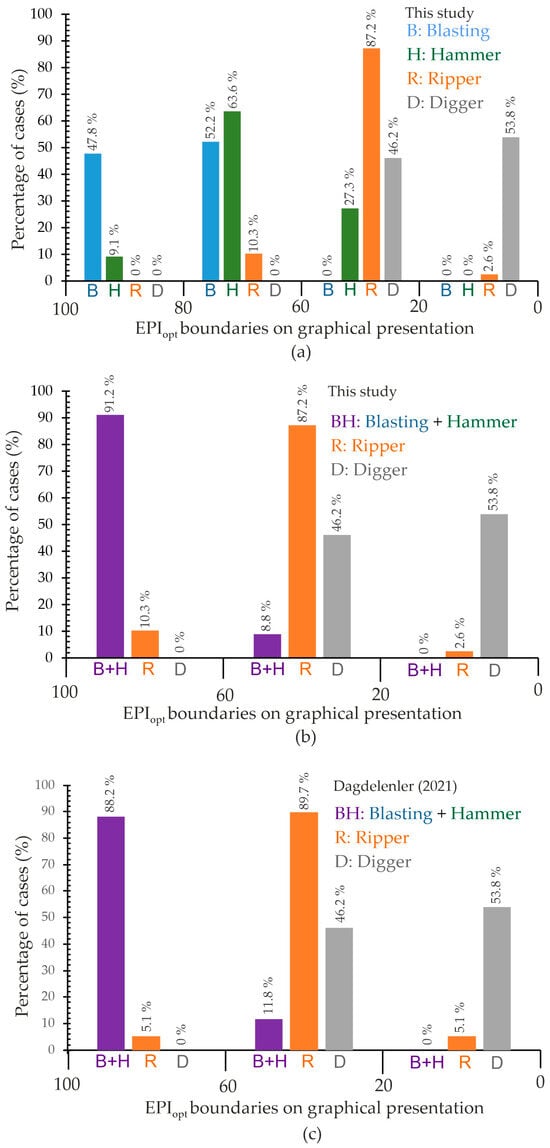
Figure 10.
Performance evaluation of the graphical presentation of GSI versus σc_rm with the generalized EPIopt curves obtained from ANN, using histograms showing the percentage of acceptable predictions for (a) Digger, Ripper, Hammer, and Blasting classes used in this study, (b) Digger, Ripper and combined Blasting and Hammer classes in this study, and (c) Digger, Ripper and combined Blasting and Hammer classes in this study by Dagdelenler [18].
Comparison of the graphical presentation given in Figure 2 and Figure 9 were made due to the use of the same datasets. For this purpose, the same histogram format used in Figure 10b was preserved for comparison with the graphical presentation given in Figure 2. As seen in Figure 10b,c, While the excavation chart produced in this study has slightly better prediction for the BH class, the graphical presentation given in Figure 2 has slightly better prediction for the R class. On the other hand, almost the same predictions were obtained for the D class.
Either Blasting or Hammer can be used for excavations of the same rock mass, depending on factors such as excavation volume and the need to minimize disturbance to the rock mass. For instance, Hammer may be preferred for smaller volume excavations or in cases where disturbance must be minimized. However, Blasting may be preferred for large-volume excavations, such as those in large open-pit mines. Therefore, only the EPIopt curves of 20 and 60 were retained to construct the GSI- and σc_rm-oriented excavatability chart compatible with Hoek and Karzulovic [16]. The Blasting class was renamed the “Blasting or Hammer” class to allow practitioners to select the appropriate method based on excavation conditions and potential disturbance impacts (Figure 11).
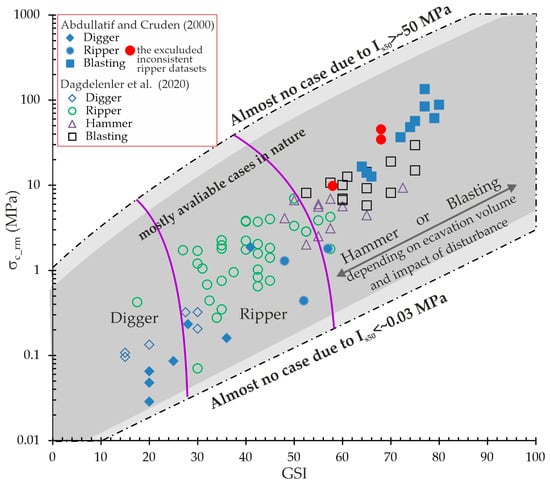
Figure 11.
Graphical representation of the GSI- and σc_rm-oriented rock mass excavatability chart developed with the 2–2–1 ANN model, with the plotted data reported by Abdullatif and Cruden [17] and Dagdelenler et al. [15].
5. Conclusions
Assessment of rock mass excavatability is crucial for selecting appropriate excavation methods, as it is directly linked to the cost–benefit management of the excavation process. Accurately estimating the project budget is particularly important in engineering applications, where the cost of excavation constitutes a significant portion of the overall project expenses, especially during the planning stage.
In this study, excavatability datasets from both Hoek and Karzulovic [16], and Dagdelenler et al. [15] were combined to develop a generalized rock mass excavatability chart using artificial neural network (ANN) analysis. ANN structures composed of 2, 3, 4, 5, and 6 neurons in the hidden layer, respectively, were trained by using the same train and test datasets for their performance evaluations. Based on the performance metrics such as RMSE, VAF, MAPE, and R2, the 2–2–1 ANN model selected to develop an ANN–driven generalized rock mass excavatability chart, integrating GSI and σc_rm. Although σc_rm values were normalized by dividing by 150 MPa as an upper limit, the output of the study can be expected to be meaningful for the normalized σc_rm assumed to be equal to 1, for rock materials with values exceeding 150 MPa. The resulting GSI- and σc_rm-oriented excavatability chart demonstrates high prediction performance, particularly for blasting+hammer and ripper excavation cases, with acceptable prediction percentages of 91.2% and 87.2%, respectively.
The value of GSI does not include anisotropic mechanical behavior of rock masses due to orientations of discontinuities in rock masses. Therefore, a correction parameter based on the relation between orientation of the excavation surface, especially in rocks exhibiting anisotropic mass mechanical behavior, such as sedimentary rocks, could be considered as a new research topic in future studies.
The excavatability chart developed in this study is practical and easy to use, requiring only GSI and σc_rm as input values. Using these parameters, practitioners can readily identify the most appropriate excavation method for a given rock mass. This chart is intended specifically for surface rock mass excavations. It is particularly suitable for applications such as slope cuttings and other open-surface projects.
Funding
This research received no external funding.
Institutional Review Board Statement
Not applicable.
Informed Consent Statement
Not applicable.
Data Availability Statement
The data presented in this study are available on request from the corresponding author.
Acknowledgments
The author sincerely acknowledges Harun Sonmez for his expert advice and technical assistance in the use of the ANNES program.
Conflicts of Interest
The author declares no conflicts of interest.
References
- Kesimal, A.; Karaman, K.; Cihangir, F.; Erçikdi, B. Excavatability Assessment of Rock Masses for Geotechnical Studies. In Handbook of Research on Trends and Digital Advances in Engineering Geology; IGI Global Scientific Publishing: Hershey, PA, USA, 2018; pp. 231–256. [Google Scholar]
- Khamehchiyan, M.; Dizadji, M.R.; Esmaeili, M. Application of rock mass index (RMi) to the rock mass excavatability assessment in open face excavations. Geomech. Geoengin. 2014, 9, 63–71. [Google Scholar] [CrossRef]
- MacGregor, F.; Fell, R.; Mostyn, G.R.; McNelly, G. The estimation of rock rippability. Q. J. Eng. Geol. Hydrogeol. 1994, 27, 123–144. [Google Scholar] [CrossRef]
- Basarir, H.; Karpuz, C. A rippability classification system for marls in lignite mines. Eng. Geol. 2004, 74, 303–318. [Google Scholar] [CrossRef]
- Dinc, O.S.; Sonmez, H.; Tunusluoglu, C.; Kasapoglu, K.E. A new general empirical approach for the prediction of rock mass strengths of soft to hard rock masses. Int. J. Rock Mech. Min. Sci. 2011, 48, 650–665. [Google Scholar] [CrossRef]
- Cui, L.; Sheng, Q.; Zhang, J.; Dong, Y.-K.; Gou, Z.-S. Regression model for predicting tunnel strain in strain-softening rock mass for underground openings. Int. J. Rock Mech. Min. Sci. 2019, 119, 81–97. [Google Scholar] [CrossRef]
- Yertutanol, K.; Akgün, H.; Sopacı, E. Displacement monitoring, displacement verification and stability assessment of the critical sections of the Konak tunnel, İzmir, Turkey. Tunn. Undergr. Space Technol. 2020, 101, 103357. [Google Scholar] [CrossRef]
- Del Pozo, F.; Córdova, E.; Marquardt, C.; Cabezas, G.R.; Benson, P.; Koor, N.; Browning, J.; Rudloff, R. Development of a geomechanical model based on suitable estimations of GSI and UCS in mining production slopes at the TilTil district, central Chile. Int. J. Rock Mech. Min. Sci. 2023, 167, 105390. [Google Scholar] [CrossRef]
- Liu, B.; Wang, R.; Zhao, G.; Guo, X.; Wang, Y.; Li, J.; Wang, S. Prediction of rock mass parameters in the TBM tunnel based on BP neural network integrated simulated annealing algorithm. Tunn. Undergr. Space Technol. 2020, 95, 103103. [Google Scholar] [CrossRef]
- Sonmez, H.; Dagdelenler, G.; Ozcelik, Y.; Ercanoglu, M. A complementary approach to quantify the basic GSI chart considering scale effect on rock structure. J. Rock Mech. Geotech. Eng. 2025, 17, 154–167. [Google Scholar] [CrossRef]
- Wang, L.; Zhu, L.; Cao, Z.; Liu, J.; Xue, Y.; Wang, P.; Cao, X. Thermo-mechanical degradation and fracture evolution in low-permeability coal subjected to cyclic heating–cryogenic cooling. Phys. Fluids 2025, 37, 086617. [Google Scholar] [CrossRef]
- Teng, T.; Chen, Y.; Wang, Y.; Qiao, X. In Situ Nuclear Magnetic Resonance Observation of Pore Fractures and Permeability Evolution in Rock and Coal under Triaxial Compression. J. Energy Eng. 2025, 151, 04025036. [Google Scholar] [CrossRef]
- Tsiambaos, G.; Saroglou, H. Excavatability assessment of rock masses using the geological strength index (GSI). Bull. Eng. Geol. Environ. 2010, 69, 13–27. [Google Scholar]
- Pettifer, G.S.; Fookes, P.G. A revision of the graphical method for assessing the excavatability of rock. Q. J. Eng. Geol. 1994, 27, 145–164. [Google Scholar] [CrossRef]
- Dagdelenler, G.; Sonmez, H.; Saroglou, C. A flexible system for selection of rock mass excavation method. Bull. Eng. Geol. Environ. 2020, 79, 5355–5369. [Google Scholar] [CrossRef]
- Hoek, E.; Karzulovic, A. Rock mass properties for surface mines. In Slope Stability in Surface Mining; Hustralid, W.A., McCarter, M.K., van Zyl, D.J.A., Eds.; Society for Mining Metallurgical and Exploration (SME): Littleton, CO, USA, 2000; pp. 59–70. [Google Scholar]
- Abdullatif, O.M.; Cruden, D.M. The relationship between rock mass quality and ease of excavation. Bull. Eng. Geol. Environ. 1983, 28, 183–187. [Google Scholar] [CrossRef]
- Dagdelenler, G. Comparison of the efficiency evaluations of selected excavatability classifications for rock masses. Arab. J. Geosci. 2021, 14, 1281. [Google Scholar] [CrossRef]
- Franklin, J.A.; Broch, E.; Walton, G. Logging the mechanical character of rock. Trans. Inst. Min. Metall. 1971, 80, 1–9. [Google Scholar]
- Weaver, J.M. Geological factors significant in the assessment of rippability. Civ. Eng. S. Afr. 1975, 17, 313–316. [Google Scholar]
- Kirsten, H.A.D. A classification system for excavation in natural materials. Civ. Eng. S. Afr. 1982, 24, 293–308. [Google Scholar]
- Minty, E.J.; Kearns, G.K. Rock mass workability. In Collected Case Studies in Engineering Geology, Hydrogeology and Environmental Geology; Knight, M.J., Minty, E.J., Smith, R.B., Eds.; Geological Society of Australia. Special Publication: Sydney, Australia, 1983; Volume 11, pp. 59–81. [Google Scholar]
- Hadjigeorgiou, J.; Poulin, R. Assessment of ease of excavation of surface mines. J. Terramech. 1998, 35, 137–153. [Google Scholar] [CrossRef]
- Karpuz, C. A classification system for excavation of surface Coal Measures. Min. Sci. Technol. 1990, 11, 157–163. [Google Scholar] [CrossRef]
- Bailey, A.D. Rock Types and Seismic Velocities versus Rippability. Highway Geol. Symp. Proa. 1975, 26, 135–142. [Google Scholar]
- Müftüoğlu, Y.V.; Scoble, M.J. Kömür açık işletmeciliğinde kazılabilirliği belirleme yöntemleri; Türkiye Madencilik Bilimsel ve Teknik 9. Kongresi: Ankara, Turkey, 1985; pp. 29–37. [Google Scholar]
- Bozdağ, T. Indirect Rippability Assessment of Coal Measure Rocks. Middle East Technical University. 1988. Available online: https://hdl.handle.net/11511/7640 (accessed on 1 November 2025).
- Kramadibrata, S. The Influence of Rock Mass and Intact Rock Properties on The Design of Surface Mines with Particular Reference to The Excavatability of Rock. Ph.D. Thesis, Curtin University of Technology, Bentley, Australia, 1996. [Google Scholar]
- Gurocak, Z.; Alemdag, S.; Zaman, M.M. Rock slope stability and excavatability assessment of rocks at the Kapikaya dam site, Turkey. Eng. Geol. 2008, 96, 17–27. [Google Scholar] [CrossRef]
- ISRM Commission on Testing Methods, Working Group on Revision of the Point Load Test Method. Suggested Method for Determining Point Load Strength (Coordinator Franklin, J.A.). Int. J. Rock Mech. Min. Sci. Geomech. Abstr. 1985, 22, 51–60. [CrossRef]
- Sonmez, H.; Gokceoglu, C.; Medley, E.W.; Tuncay, E.; Nefeslioglu, H.A. Estimating the uniaxial compressive strength of a volcanic bimrock. Int. J. Rock Mech. Min. Sci. 2006, 43, 554–561. [Google Scholar] [CrossRef]
- Dagdelenler, G.; Akcapinar Sezer, E.; Gökceoglu, C. Some non-linear models to predict the weathering degrees of a granitic rock from physical and mechanical parameters. Expert Syst. Appl. 2011, 38, 7476–7485. [Google Scholar] [CrossRef]
- Sonmez, B.; Dagdelenler, G.; Ozcan, N.T.; Ercanoglu, M.; Sonmez, H. Yapay Sinir Ağı Kullanılarak CPT Tabanlı Sıvılaşma Değerlendirme Abağının Geliştirilmesi. Yerbilimleri 2015, 36, 45–60. [Google Scholar] [CrossRef]
- Sonmez, H.; Ercanoglu, M.; Kalender, A.; Dagdelenler, G.; Tunusluoglu, M.C. Predicting uniaxial compressive strength and deformation modulus of volcanic bimrock considering engineering dimension. Int. J. Rock Mech. Min. Sci. 2016, 86, 91–103. [Google Scholar] [CrossRef]
- Yilmazkaya, E.; Dagdelenler, G.; Ozcelik, Y.; Sonmez, H. Prediction of mono-wire cutting machine performance parameters using artificial neural network and regression models. Eng. Geol. 2018, 239, 96–108. [Google Scholar] [CrossRef]
- Asteris, P.G.; Karoglou, M.; Skentou, A.D.; Vasconcelos, G.; He, M.; Bakolas, A.; Zhou, J.; Armaghani, D.J. Predicting uniaxial compressive strength of rocks using ANN models: Incorporating porosity, compressional wave velocity, and schmidt hammer data. Ultrasonics 2024, 141, 107347. [Google Scholar] [CrossRef]
- Sun, J.; Zhang, R.; Zhang, A.; Wang, X.; Wang, J.; Ren, L.; Zhang, Z.; Zhang, Z. Rock strength prediction based on machine learning: A study from prediction model to mechanism explanation. Measurement 2024, 230, 115373. [Google Scholar] [CrossRef]
- Zhao, G.-F.; Wu, Y. Artificial intelligence in rock mechanics. Int. J. Rock Mech. Min. Sci. 2025, 195, 106245. [Google Scholar] [CrossRef]
- Basheer, I.A.; Hajmeer, M. Aritificial neural networks: Fundamentals, computing, design and application. J. Microbiol. Methoda 2000, 43, 3–31. [Google Scholar] [CrossRef] [PubMed]
- Alvarez Grima, M. Neuro-Fuzzy Modeling in Engineering Geology. Doctoral Thesis, Balkema, Rotterdam, The Netherlands, 2000; p. 244. Available online: https://resolver.tudelft.nl/uuid:bfdd88ce-d38b-4be2-be7e-033abfff35b6 (accessed on 1 November 2025).
- Sonmez, H.; Gokceoglu, C. Discussion on the paper by H. Gullu and E. Ercelebi “A neural network approach for attenuation relationships: An application using strong ground motion data from Turkey (in press)”. Eng. Geol. 2008, 97, 91–93. [CrossRef]
- Hecht-Nielsen, R. Kolmogorov’s mapping neural network existence theorem. In Proceedings of the First IEEE International Conference on Neural Networks, San Diego, CA, USA, 21–24 June 1987; pp. 11–14. [Google Scholar]
- Hush, D.R. Classification with neural networks: A performance analysis. In Proceedings of the 1989 International Conference on Systems Engineering, Fairborn, OH, USA, 24–26 August 1989; pp. 277–280. [Google Scholar]
- Ripley, B.D. Statistical aspects of neural networks. In Networks and Chaos—Statistical and Probabilistic Aspects; Barndoff-Neilsen Jensen, O.E., Jensen, J.L., Kendall, W.S., Eds.; Chapman & Hall: London, UK, 1993; pp. 40–123. [Google Scholar]
- Wang, C. A Theory of Generalization in Learning Machines with Neural Application. Ph.D. Thesis, The University of Pennsylvania, Philadelphia, PA, USA, 1994. [Google Scholar]
- Masters, T. Practical Neural Network Recipes in C++; Academic Press: Boston, MA, USA, 1994. [Google Scholar]
- Kaastra, I.; Boyd, M. Designing a neural network for forecasting financial and economic time series. Neurocomputing 1996, 10, 215–236. [Google Scholar] [CrossRef]
- Kanellopoulas, I.; Wilkinson, G.G. Strategies and best practice for neural network image classification. Int. J. Remote Sens. 1997, 18, 711–725. [Google Scholar] [CrossRef]
Disclaimer/Publisher’s Note: The statements, opinions and data contained in all publications are solely those of the individual author(s) and contributor(s) and not of MDPI and/or the editor(s). MDPI and/or the editor(s) disclaim responsibility for any injury to people or property resulting from any ideas, methods, instructions or products referred to in the content. |
© 2025 by the author. Licensee MDPI, Basel, Switzerland. This article is an open access article distributed under the terms and conditions of the Creative Commons Attribution (CC BY) license (https://creativecommons.org/licenses/by/4.0/).