Abstract
Grouted sleeve connections are widely employed in the substructures of prefabricated bridges. After installation, the grout filling condition inside the sleeves cannot be directly inspected, while grouting defects may significantly compromise the mechanical performance of the piers. This study investigates the feasibility of using the non-destructive impact-echo method to detect grouting defects in sleeves. Finite element simulation was conducted to analyze the influence of the distance between the impact point and the signal acquisition point on detection accuracy, revealing that a distance of 40–60 mm yields optimal results. Experimental findings demonstrate that the method can effectively identify grouting defects in double-row sleeves, although it cannot precisely locate the defective sleeve. A novel analytical approach is proposed, using the thickness frequency and its modes of fully grouted specimens as a benchmark. By comparing thickness frequencies at different measurement points, grout quality can be intuitively evaluated. Validation using a six-sleeve model with varying grouting densities confirmed the method’s effectiveness in detecting grouting defects in non-boundary sleeves and its practical applicability in engineering.
1. Introduction
Over the past two decades, significant progress has been made in prefabricated bridge technology. Compared to traditional cast-in-place bridges, the approach of manufacturing components in factories and assembling them on-site not only effectively shortens construction periods and reduces on-site uncertainties, but also improves the uniformity and reliability of construction quality while minimizing disruption to existing traffic [1,2]. Grouted sleeve connections, as one of the common connection forms for prefabricated bridge piers, are widely used due to their reliable performance, ease of construction, and seismic performance comparable to that of cast-in-place structures [3,4,5]. These connections rely on high-strength grout to fill the interior of the sleeve, bonding it to the steel reinforcement and the inner wall of the sleeve to form an integrated whole and facilitate stress transfer. However, uncertainties during construction (such as the presence of debris or inadequate sealing of grouting ports) can easily lead to grouting defects, directly affecting connection performance and structural safety [6]. Given their complex construction and concealed conditions, developing a non-destructive testing method capable of quickly and accurately identifying defects without damaging the structure is of significant engineering importance.
Currently, non-destructive techniques applied to sleeve testing each have their own characteristics, but also certain limitations. For example, while X-ray industrial CT [7,8,9,10] can achieve fine identification and quantitative description of defects, the equipment is bulky, costly, and poses radiation risks, making it difficult to apply for rapid on-site testing. Ultrasonic methods [11,12,13] have the potential for long-distance screening; however, in thick-walled sleeves, high-frequency components attenuate significantly, and due to interface reflections and environmental noise interference, their detection accuracy and depth for minor defects in the core are limited. In contrast, the impact-echo method demonstrates better field applicability. Studies by Yang Hailin et al. [14,15,16] have shown that this method effectively identifies grouting defects in prestressed ducts and internal debonding in concrete; Yao et al. [17] further indicated that it is significantly influenced by the natural vibration frequency in the detection of internal conditions of grouted sleeves. It is worth noting that the impact-echo method is not interfered with by distributed reinforcement, nor is the internal quality information shielded by the metallic material of the sleeve, making it an ideal candidate for on-site testing.
Despite these advantages of the impact-echo method, its detection characteristics in double-row sleeve configurations and rapid judgment criteria suitable for field applications still require in-depth research. To address this, based on actual engineering backgrounds, this paper establishes multiple finite element models to systematically analyze the influence of signal acquisition positions and double-row sleeve arrangements on detection results. Furthermore, model tests are conducted to verify the accuracy and practicality of the method. Additionally, this paper proposes using the thickness frequency and its order of a fully grouted specimen as a benchmark, enabling intuitive assessment of grouting quality by comparing frequency differences at various measurement points. This approach provides a new basis for the quantitative detection of defects in the field, demonstrating promising prospects for engineering applications.
2. Theoretical Basis
2.1. Basic Assumptions
Current research on grouted sleeve connections primarily focuses on bond anchorage mechanisms, joint load-bearing performance, deformation monitoring, component fabrication, and construction techniques. Finite element simulations of grouted regions in rapidly constructed beam-column structures with grouted sleeve connections reveal that beam length influences crack width [18]. The use of various fibers as grouting additives has been demonstrated to enhance bond strength and ductility, thereby preventing rebar pull-out [19]. Although sleeves increase the stiffness of pier columns, they reduce displacement capacity and ductility [20]. The rigid segments in grouted sleeve connections lead to curvature redistribution at the pier base, decreasing the plastic hinge height and ultimate displacement of the pier column [21]. Non-destructive testing of sleeve defects is essential.
Non-destructive testing (NDT) methods play multiple roles in civil engineering structures. Specific point pulse response tests on concrete slabs indicate that the variability of the frequency response function (FRF) increases in the presence of defects [22]. The impact-echo method helps establish frequency thresholds to distinguish between solid and defective concrete, enabling quality assessment of concrete slabs, determination of Poisson’s ratio, and evaluation of the integrity of concrete bridge decks [23,24,25,26].
The impact-echo technique involves generating stress waves on the surface of a specimen and evaluating the internal quality of concrete based on wave propagation characteristics [27]. Typically, a hard hammer impacts the surface to produce stress waves, which are captured by displacement/acceleration sensors. Time-domain signals collected by the sensors are converted into response curves using data analysis methods [28]. By performing finite element analysis and comparing experimental and simulated response curves, the internal grouting quality can be assessed [29].
Previous studies have explored the method’s capability to evaluate defect locations and detect minimum defect sizes [30]. Extensive empirical research has continuously refined the impact-echo method, expanding its practical applications [31,32,33]. Advanced machine learning techniques have been applied to analyze industrial engineering signals, improving detection accuracy [34]. Detection experiments on sleeve grouting compactness models have led to the development of an impact-echo approach integrated with machine learning [35,36]. Finite element analysis has validated the effectiveness of this method in detecting defects in single-row, side-row, and double-row sleeve configurations [37]. Collectively, these studies confirm the feasibility of using the impact-echo method for non-destructive testing of grouted sleeves.
2.2. Basic Principles
According to the theory of stress wave propagation, waves causing particle vibration are mainly divided into longitudinal waves (P-waves), transverse waves (S-waves), and surface waves (Love waves and Rayleigh waves). Longitudinal waves have the same propagation direction as particle motion and exhibit the highest propagation speed. The impact-echo method fundamentally assumes that only structural responses caused by longitudinal wave propagation are considered, ignoring the influence of transverse and surface waves. The acoustic impedance of a solid material refers to the impedance of wave propagation through the material per unit area, measuring the material’s resistance to wave energy propagation. Its specific value is typically determined by the material’s density and wave speed, as in Equation (1):
where is the density of the material, and is the wave propagation speed in the material. From the definition of acoustic impedance, it can be seen that when an stress wave transmits from one material to another, the mismatch in acoustic impedance will cause wave reflection and refraction. When a wave propagates to the interface of two different materials, the proportion of energy reflected back to the original medium can be expressed by the reflection coefficient , as in Equation (2):
where and represent the acoustic impedance of the incident material and the acoustic impedance of the transmitting material, respectively. Obviously, is a coefficient less than or equal to 1. Compared with concrete, the acoustic impedance of air is very small, so when the stress wave enters the concrete and propagates to the air interface, the stress wave is almost completely reflected back into the concrete at the same angle.
When using the impact-echo method for non-destructive testing, a small hammer is used to strike the surface of the concrete structure to generate a stress wave, which propagates through the concrete and is reflected at the air interface on the opposite side of the striking face, and finally captured by a signal receiver located on the same side as the stress wave excitation surface. The effective frequency of the stress wave generated by the hammer striking as shown in Equation (3):
where is the contact time between the hammer and the concrete surface. If the velocity of the excited stress wave is and the size of the component in the direction of wave propagation is , as in Equation (4):
where is the propagation frequency of the longitudinal wave in concrete, which can be obtained by FFT transformation of the received signal, also known as the thickness frequency. is the structural section correlation coefficient that represents the propagation cross-sectional area, and for large structural sections such as walls or plates, can be taken as 0.96. If the path changes during propagation due to some reason, it will lead to a certain degree of decrease in the thickness frequency.
When a stress wave encounters an obstacle or defect, the phenomenon that it continues to propagate by bypassing the obstacle or defect and changing direction is called diffraction. Similarly, when using the impact-echo method to detect a grouting sleeve located on the path of the stress wave movement, if the grouting sleeve has insufficient density and forms a cavity or certain defects, a small part of the energy of the stress wave will be reflected after reaching the surface of the sleeve, and most of it will bypass the sleeve and propagate to the opposite side. Finally, it will be reflected at the air interface on the opposite side and received by the signal receiver located on the same side as the stress wave excitation surface. In this process, due to diffraction, the propagation path and time of the wave increase, which causes the thickness frequency in the received signal to be lower than that in the defect-free case. Figure 1 shows the principle of using the impact-echo method to detect grouting defects in concrete sleeves.
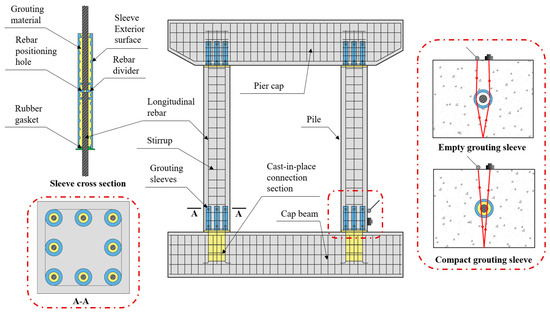
Figure 1.
Stress waves propagation path.
3. Finite Element Analysis
3.1. Creating Components
A finite element model was developed in ABAQUS 2020 to systematically analyze the influence of signal reception range and double-row sleeves on stress wave propagation. Since this study focuses solely on the in-plane stress wave propagation characteristics, two-dimensional plane strain elements were employed to effectively avoid boundary effects associated with stress waves in the thickness direction. The model comprises five types of components: concrete cover, sleeve grouting material, main reinforcement, sleeve body, and confinement stirrups. The stirrups were discretized using truss elements, while the remaining components were modeled with CPE4R solid elements for detailed simulation. The sleeves were made of steel, the grouting material was grade C100, and the reinforcement used in the model was HRB400. The parameters of the components are listed in Table 1.

Table 1.
Material properties used in the FEM.
The meshing of the model took into account both wave simulation accuracy and geometric characteristics. The outer C40 concrete region was discretized with a maximum element size of 10 mm. In the core area containing sleeves, steel reinforcements, and grouting material, local mesh refinement was applied with an element size of 5 mm to accurately capture interface effects and complex wave fields. A free meshing technique was adopted, resulting in a hybrid mesh dominated by quadrilateral elements supplemented by triangular elements. Given that the stress waves generated by the small hammer impact are negligible compared to the small-scale prefabricated pier, fixed constraints were applied at the four corner nodes of the concrete. To simplify the model, the effects of damping and material nonlinearity were not considered in this study.
Point loads were used to simulate the stress waves excited by the hammer impact. The load function was defined as the positive half-cycle of a sine wave, with an impact force magnitude of F = 100 N, simulating a hammer with diameter D = 10 mm. The expression of the load function is given in Equation (5):
The excitation duration is related to the hammerhead diameter D, and the relationship is given by Equation (6):
To clearly distinguish between the load application process and the structural response process, two analysis steps were established: the first analysis step represents the load application phase with a duration of 50 μs, and the second analysis step captures the structural response extraction phase with a duration of 950 μs.
3.2. Signal Reception Range
A model with dimensions of 515 mm × 400 mm was established (Figure 2), with a sleeve diameter of 95 mm and a reinforcement diameter of 40 mm.
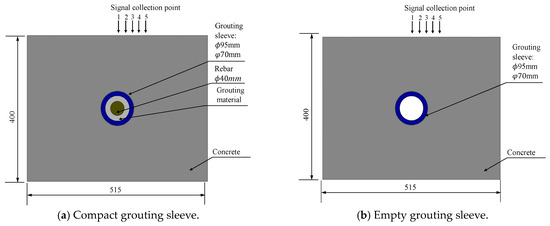
Figure 2.
Analysis of the influence of signal reception range.
In the first group, the sleeve was fully grouted, while the second group had a non-grouted sleeve. For both groups, the excitation load was applied to the concrete surface outside the sleeve’s centerline, and signal collection points were positioned at 20 mm, 40 mm, 60 mm, 80 mm, and 100 mm from the excitation point.
In the first group, the sleeve was fully grouted, while the second group had a non-grouted sleeve. For both groups, the excitation load was applied to the concrete surface outside the sleeve’s centerline, and signal collection points were positioned at 20 mm, 40 mm, 60 mm, 80 mm, and 100 mm from the excitation point. Response cloud diagrams were extracted at three stages: the initial load application, the first arrival of the stress wave at the concrete interface opposite the loading point, and the wave’s return to the vicinity of the detection point. The collected response signals were then subjected to fast Fourier transform (FFT) processing, with specific graphs shown below.
A comparative analysis of the finite element results from Test Group 1 (Figure 3) and Test Group 2 (Figure 4) reveals significant differences in thickness frequency between the two groups. Additionally, the raw signals in Group 2 exhibited more intense responses with higher amplitudes, robustly validating the impact-echo method’s efficacy in detecting ungrouted sleeves.
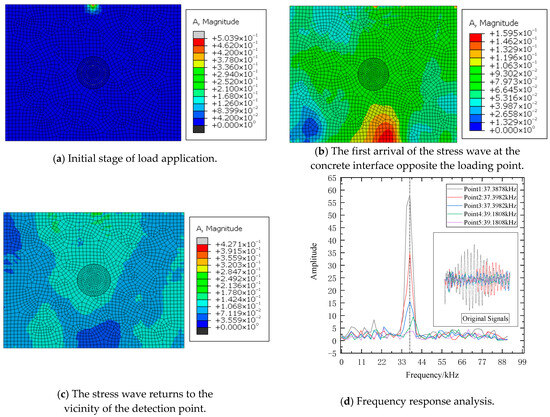
Figure 3.
FEM and FFT results for compact grouting sleeve.
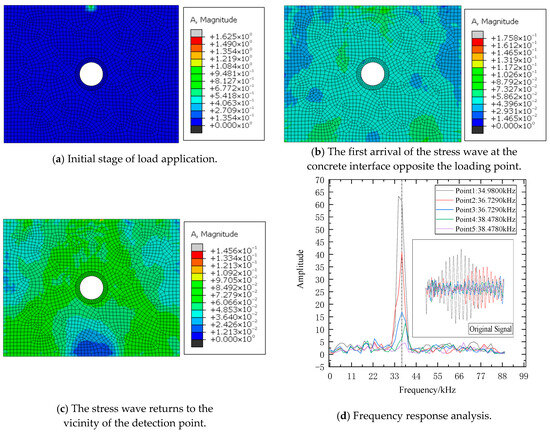
Figure 4.
FEM and FFT results for empty grouting sleeve.
Further analysis of Group 1’s results showed that when the excitation load was applied to the concrete surface outside the sleeve’s centerline, the raw signals at Detection points 1, 2, and 3 differed significantly. However, their frequency-domain responses showed high consistency in thickness frequency, with peak amplitudes decreasing as the distance from the excitation point increased. Notably, discernible deviations in thickness frequency were detected at Points 4 and 5. The observations from Group 1 were further corroborated by Group 2’s results. Considering that signals collected too close to the excitation source may be contaminated by loading interference, a comprehensive analysis indicated that positioning detection points 40–60 mm from the excitation load yielded more accurate and reliable data.
3.3. Double-Row Sleeves
In the wave propagation direction, double-row sleeves were arranged with a center-to-center spacing of 180 mm. Four experimental groups were designed to investigate grouting defects: Group 1 (Figure 5a) had a fully grouted near-end sleeve and an ungrouted far-end sleeve; Group 2 (Figure 5b) reversed this configuration; Group 3 (Figure 5c) had both sleeves ungrouted; Group 4 (Figure 5d) had both sleeves fully grouted. For all groups, the excitation load was applied to the concrete surface outside the sleeve’s centerline, with the signal collection point fixed 40 mm from the load application point to ensure consistent testing conditions.
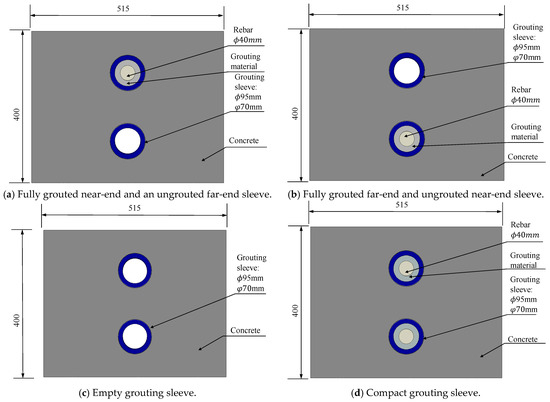
Figure 5.
Analysis of the influence of signal reception range.
Group 1 simulated practical grouting defects by fully grouting the near-end sleeve while leaving the far-end ungrouted. Group 2 mirrored the scenario with a fully grouted far-end and ungrouted near-end sleeve. Group 3 modeled concurrent grouting failures in double-row sleeves by leaving both ungrouted, whereas Group 4 (control) featured fully grouted sleeves. Response contour plots were extracted at three key stages: initial load application, first arrival of the stress wave at the opposite concrete interface, and the wave’s return to the detection point vicinity. Collected signals were then processed via FFT, with results presented below.
Analysis of the four finite element datasets (Figure 6, Figure 7, Figure 8 and Figure 9) indicates that, compared to the fully grouted control group (Group 4, with a thickness frequency of 46.998 kHz), the thickness frequencies of Groups 1, 2, and 3 with grouting defects shift to 46.9563 kHz, 46.9563 kHz, and 51.3369 kHz, respectively, with an average shift of 1.4 kHz. This validates the effectiveness of the impact-echo method in detecting grouting defects in sleeves. However, it should be specifically noted that the data characteristics of Group 1 and Group 2 are highly similar, making it difficult to accurately locate the defects based solely on the existing results. This limitation suggests that future research should further optimize the detection methods and analysis techniques to improve the accuracy of defect localization.
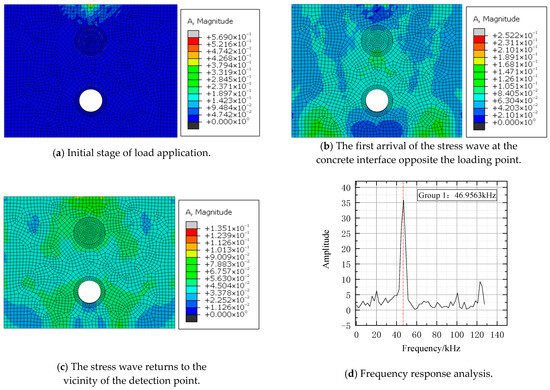
Figure 6.
Group1 FEM and FFT results.
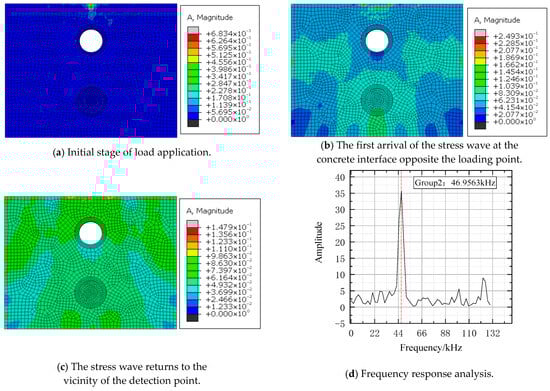
Figure 7.
Group2 FEM and FFT results.
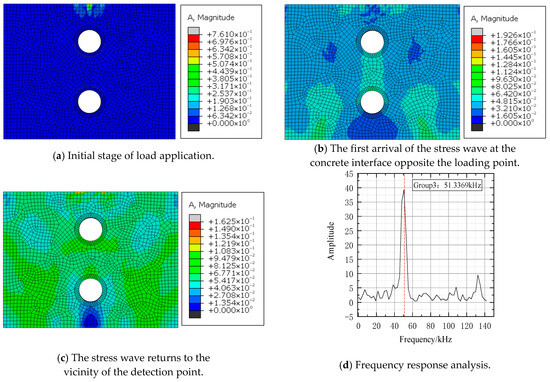
Figure 8.
Group3 FEM and FFT results.
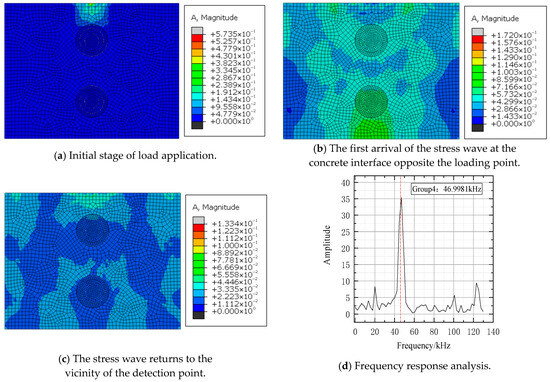
Figure 9.
Group4 FEM and FFT results.
4. Experimental Research
4.1. Specimen Preparation
The focus of the laboratory’s non-destructive testing on grouting sleeve joints of prefabricated bridge piers is to investigate the impact-echo method’s capability to detect grouting defects in practical engineering scenarios. The test feasibility is evaluated by designing sleeves with large dimensions, substantial thickness, and symmetric arrangements, while accounting for the influence of stirrups on test results. In actual construction, outer concrete pouring is performed before sleeve grouting. However, in this experiment, we predetermined the locations of defects and prioritized sleeve grouting to ensure grouting quality and prevent the introduction of new defects during testing, followed by outer concrete pouring.
The test model has a cross-sectional dimension of 515 mm × 400 mm and a height of 1010 mm. The model is embedded with six GTZQ4-40 steel sleeves, arranged symmetrically in two rows with three sleeves per row. The center-to-center spacing between sleeves in the same row is 180 mm, and the distance between the two rows is 240 mm. Both the outer stirrups and longitudinal reinforcement are made of HRB400 hot-rolled ribbed steel bars with a diameter of 10 mm, and the concrete cover thickness is 20 mm. The configuration is shown in Figure 10.
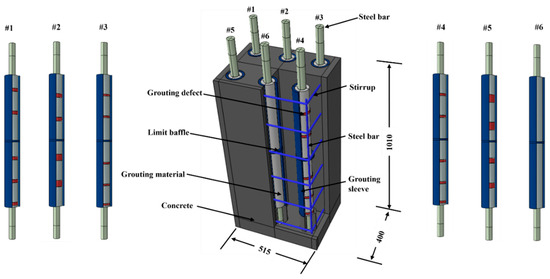
Figure 10.
Diagram of defect layout in the experimental models.
Six sleeves were designed with different grouting conditions, using foam tape to simulate grouting defects with sizes of 12 mm, 15 mm, 20 mm, 24 mm, 32 mm, 40 mm, and 48 mm, respectively. The sleeve numbering and defect configurations are shown in Table 2.
Table 2.
Designed grouting defect locations and sizes.
The sleeves are then assembled and grouted. Prior to grouting, the grouting inlet and outlet of the sleeves should be carefully inspected to ensure they are unobstructed. Equipment such as the mixer and grouting machine must be pre-tested, and tools like rubber plugs should be prepared. The C100 grouting material is first dry-mixed for 2 min according to the standard ratio, followed by sequential addition of 70% and 30% of the total water volume, with mixing durations of 1 min and 2 min, respectively. After standing for 2 min for deaeration, the mixture is poured into the grouting machine. During grouting, the material is slowly and continuously injected from the grouting inlet. Once a uniform slurry flows out from the outlet, both ends are immediately sealed with rubber plugs. The entire process must be carried out continuously to prevent initial setting of the slurry.
After the initial setting of the grouting material, the sleeves are placed within the stirrups, and their positions are fixed to prevent displacement during subsequent concrete pouring. The stirrup-sleeve assembly is hoisted into the formwork to the designed position, after which the outer concrete is prepared and poured. C40 concrete is mixed according to the designed mix ratio and poured in layers, with each layer being 300–500 mm thick. Upon completion of concrete pouring, timely curing is implemented, including covering with plastic film and regular watering to maintain moisture, for a duration of 28 days. As shown in Figure 11.
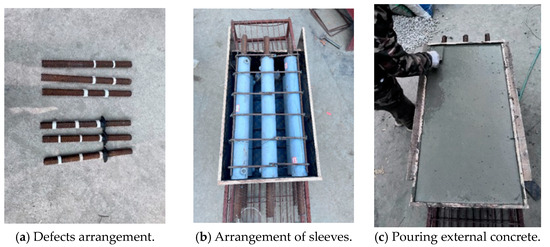
Figure 11.
Impact-echo experimental procedure.
After curing was completed, the measurement points were arranged. As shown in Figure 12, the measurement points on the specimen comprehensively covered all sleeve defect areas. Taking Sleeve No. 1 as an example: the measurement points started from the grouting port end (lower end) as point 1 (minimum value) and ended at the opposite grout outlet end (upper end) as point 25 (maximum value), with a consistent interval of 1 cm between adjacent measurement points. Except for Sleeve #1, which contains 25 measurement points, the analysis of all other sleeves is based on 24 measurement points.
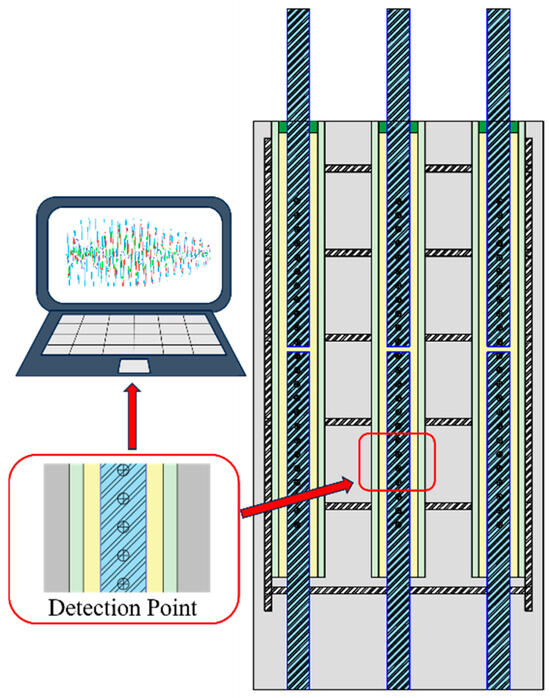
Figure 12.
Distribution of detection points in the test model.
4.2. Data Processing
The signal acquisition was performed using the Sichuan Lutong SPC-MATS testing system, which integrates an S31SC piezoelectric accelerometer and a 24-bit high-precision data acquisition unit. The acquisition unit supports IEPE power supply and offers a minimum sampling interval of 1 μs (corresponding to a maximum sampling rate of 1 MHz). In this study, the sampling rate was set to 500 kHz to ensure complete capture of transient impact signals. The sensitivity of the sensor is 20 mV/g.
Based on the thickness of the structure under test, a steel ball with a diameter of 10 mm was selected as the impact source. The steel ball has a mass of approximately 4.1 g, and this configuration can generate transient stress waves containing the main frequency components required for detection. The impact was applied at a distance of 20 mm from the signal acquisition point to ensure consistency and repeatability of the excitation process.
Prior to the formal tests, a standard 150 mm concrete test block was used for verification. The analysis of the impact-elastic wave signals showed that the back-calculated detection path matched the actual dimensions of the test block, confirming the method’s effectiveness in detecting targets and acquiring clear signals. Subsequently, the system’s built-in self-calibration function was initiated. The instrument automatically monitored waveform stability and background noise, and upon confirming that the noise level was below the specified limit, it completed the calibration of the sensors and acquisition channels to ensure signal acquisition accuracy.
This pre-test verification confirmed the validity of the method, and the automatic calibration ensured that the equipment was in an optimal working state, laying a solid foundation for the formal experiments.
During data acquisition, repeated measurements were conducted under the same working conditions to reduce the influence of random errors. The test and data acquisition are illustrated in Figure 13.
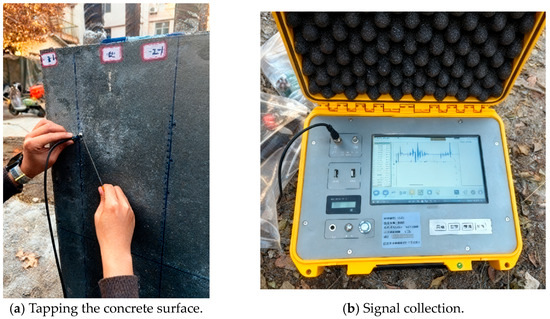
Figure 13.
The test and data acquisition.
FFT was applied to convert time-domain signals to the frequency domain, thereby extracting frequency characteristics. Figure 14 is a schematic diagram of signal conversion.
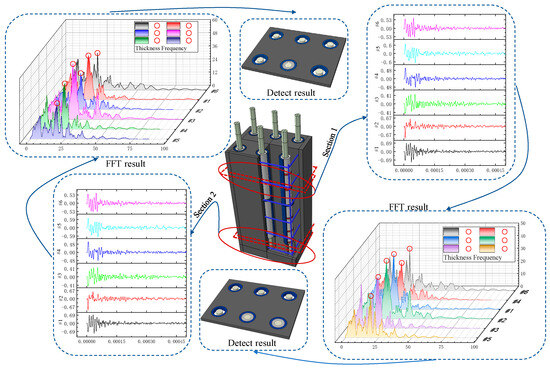
Figure 14.
Schematic diagram of signal conversion.
Initial experimental tests yield raw and intuitive data in the form of time-domain signals. These signals undergo Fast Fourier Transform (FFT) to obtain frequency-domain data, where the prominent peak corresponds to the thickness frequency at the measurement point. Since the frequency axis generated by FFT spans an extensive range with values approaching zero at higher frequencies, these negligible portions are truncated to achieve data reduction. The processed data is then visualized using the “contour map” function in Origin 2025 software, generating comprehensive graphical representations.
Frequency order is a concept introduced for experimental data analysis. The results obtained through FFT transformation exhibit discrete characteristics, and connecting these discrete points forms a frequency spectrum. Since the spacing between these discrete points is equal and the valid data are concentrated within the first few hundred points, each discrete point is defined as one “order.” This approach intuitively describes the thickness frequency at each measurement point and enables comparative analysis of thickness frequencies across different measurement points.
The entire data processing workflow is summarized in the following flowchart. As shown in Figure 15.
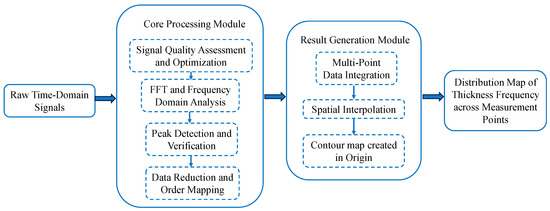
Figure 15.
Flowchart of data processing.
4.3. Results Analysis
The time-domain signals from the test group were transformed using FFT, and the first 600 frequency-domain orders along with their corresponding amplitudes from each measurement point were selected to generate the figure above. As Sleeve #6 was designed as a fully grouted specimen, its frequency-domain response was analyzed first. The color depth in the legend represents amplitude intensity, with the darkest color at each measurement point indicating the peak frequency. As shown in Figure 16, statistical analysis revealed that among the total 24 measurement points, except for points 12, 16, and the missing point 18, the thickness frequency orders of the remaining points were consistently clustered around the 430th order, accounting for 88% of the total. Therefore, the range near the 430th order was established as the benchmark for determining full grouting in Test Group 1, providing a quantitative basis for subsequent defect identification. In Figure 16, Figure 17, Figure 18, Figure 19, Figure 20 and Figure 21, red circles are used to mark the location of the 430th order.
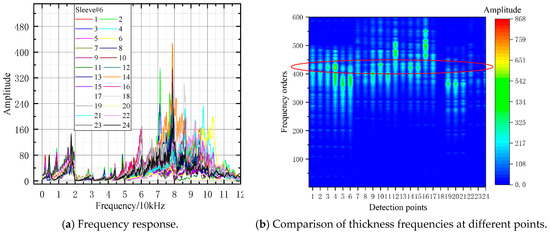
Figure 16.
FFT analysis result of sleeve#6.
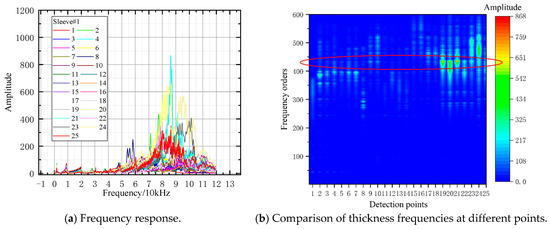
Figure 17.
FFT analysis result of sleeve#1.
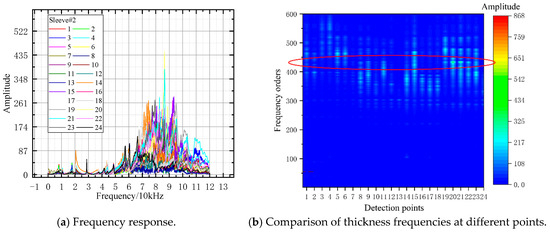
Figure 18.
FFT analysis result of sleeve#2.
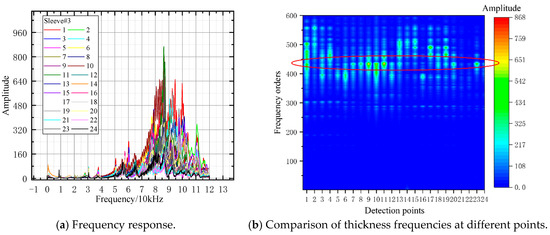
Figure 19.
FFT analysis result of sleeve#3.
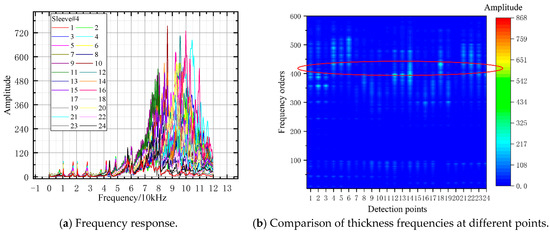
Figure 20.
FFT analysis result of sleeve#4.
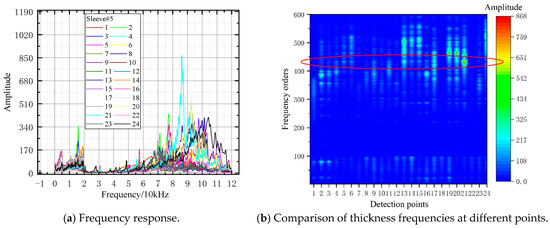
Figure 21.
FFT analysis result of sleeve#5.
In this study, the identification of defects was based on the frequency order shift in the thickness peak in the spectrum, using a fully grouted sleeve as the baseline. The specific criteria are as follows: a peak shift exceeding 30 orders, consistently observed across multiple consecutive measurement points in a given area, was defined as a confirmed defect. A shift between 10 and 30 orders was classified as a suspected defect, requiring comprehensive judgment considering adjacent points.
Analysis of Specimen #1 (Figure 17): Thickness frequencies of Points 1–7 appeared at the 400th order with slight deviation. Points 8–11 exhibited 430th-order frequencies, consistent with full grouting, confirming sound grouting quality in this range. Points 12–14 had roughly estimated 400th-order frequencies, deviating slightly from the full-grouting reference. Given Test Group’s double-row sleeve arrangement, potential defects in the opposite sleeve at these positions rendered grouting fullness unconfirmable. Points 15–18 showed obvious frequency deviations, indicating defects. Points 19–22 had 400th-order frequencies, again attributed to possible opposite-sleeve defects (due to double-row arrangement), precluding grouting quality confirmation. Points 23–25 exhibited significant frequency shifts, confirming grouting defects.
Analysis of Specimen #2 (Figure 18): Points 14–18 and 1–7 had 370th-order thickness frequencies with obvious deviations, indicating grouting defects in these zones. Points 20–24 showed 430th-order frequencies (consistent with full grouting), confirming good quality. Except for Points 8, 9, and 11 (400th-order frequencies), no full-grouting thickness frequencies were observed. Despite three repeated tests, results remained inconclusive.
Analysis of Specimen #3 (Figure 19): Notably, Points 7–12 showed stable 430th-order thickness frequencies, reflecting good grouting quality. All other points exhibited deviations, indicating extensive defects.
Analysis of Specimen #4 (Figure 20): Points 1–3 had thickness frequencies significantly below the 430th order, confirming grouting defects. Points 4–6 matched the full-grouting benchmark. Points 7–20 failed to meet the 430th-order criterion, while Points 21–24 roughly matched it, highlighting stark grouting quality variations.
Analysis of Specimen #5 (Figure 21): The thickness frequency comparison chart showed disordered frequency distributions, with only Point 21 clearly at the 430th order. Comprehensive sleeve layout analysis revealed that Specimens #1, #3, #4, and #5 were positioned on the component’s outer side, close to the air interface, potentially causing chaotic frequency responses. More importantly, the double-row arrangements of #1–#5 and #3–#4 matched the experimental design’s pre-set interference conditions—thickness frequency responses from all detection points of these four sleeves incorporated cross-talk from opposite sleeves, making it impossible to determine which row contained defects. This finding aligns with finite element simulation conclusions.
5. Conclusions
(1) When employing the impact-echo method, the concrete surface outside the sleeve centerline should be struck with a small hammer. Finite element simulation results demonstrate that signal collection points must be positioned 40–60 mm from the impact point to achieve optimal detection performance.
(2) During experimental defect detection, selecting reference measurement points and comparing their thickness frequencies with other test points can effectively evaluate the overall grouting quality of sleeves. This method combines intuitive results with operational convenience, fulfilling practical engineering application requirements.
(3) The impact-echo method can reliably identify defects in double-row grouted sleeves. However, when defects exist in only one row, precise localization becomes unachievable. Stress wave reflections and refractions at concrete–air interfaces interfere with detection signals, resulting in compromised effectiveness in boundary regions compared to other areas. Under such complex conditions, implementing multi-directional testing combined with three-dimensional waveform analysis is recommended for reliable defect localization.
(4) Defect detection accuracy proves superior at the grouting end (specimen bottom) compared to the outflow end (specimen top), necessitating repeated testing at the outflow end. Notably, no defects were detected at the grouting ends of any sleeves, potentially because defects near grouting ports were filled with grouting material. Consequently, grouting quality assessment should prioritize the outflow end.
(5) For subsequent research, the following directions are recommended: systematically expanding the sample database to establish more universal defect identification thresholds; introducing machine learning methods for intelligent defect recognition and classification; and optimizing detection strategies for multi-row sleeves by combining multi-directional excitation with time-domain waveform depth localization to enhance defect positioning accuracy in both longitudinal and transverse directions.
Author Contributions
Conceptualization, A.S., Y.L., H.Z. and Y.D.; methodology, H.Z. and Y.D.; software, A.S.; investigation, A.S.; data curation, A.S.; writing—original draft preparation, A.S. and Y.L.; writing—review and editing, A.S., Y.L., H.Z., Y.D. and M.Z.; supervision, H.Z.; project administration, H.Z.; resources, H.Z.; funding acquisition, H.Z. and M.Z. All authors have read and agreed to the published version of the manuscript.
Funding
This work was supported by Key R&D Program Projects in Shaanxi Province (grant 2024SF-YBXM-644), Shaanxi Provincial Department of Transportation and Communications Transportation Research Project (grant 22-05K), Shanxi Province Transportation Science and Technology Project (grant 2021-02-03), Power China Northwest Engineering Corporation Limited Science and Technology Project (grant XBY-YBKJ-2023-2).
Institutional Review Board Statement
Not applicable.
Informed Consent Statement
Not applicable.
Data Availability Statement
The original contributions presented in this study are included in the article. Further inquiries can be directed to the corresponding author.
Conflicts of Interest
Anfan Shang and He Zhang are employees of Power China Northwest Engineering Corporation Limited. This research received funding from Power China Northwest Engineering Corporation Limited (among other funders). The remaining authors declare that the research was conducted in the absence of any commercial or financial relationships that could be construed as a potential conflict of interest. The sponsors had no role in the design, execution, interpretation, or writing of the study.
References
- Shoushtari, E.; Saiidi, M.S.; Itani, A.; Moustafa, M.A. Seismic performance of a two-span steel girder bridge with ABC connections. Eng. Struct. 2021, 241, 112502. [Google Scholar] [CrossRef]
- Kenarkoohi, M.; Hassan, M. Review of accelerated construction of bridge piers—Methods and performance. Adv. Bridge Eng. 2024, 5, 3. [Google Scholar] [CrossRef]
- Ameli, M.J.; Pantelides, C.P. Seismic Analysis of Precast Concrete Bridge Columns Connected with Grouted Splice Sleeve Connectors. J. Struct. Eng. 2017, 143, 04016176. [Google Scholar] [CrossRef]
- Qu, H.-Y.; Fu, J.-X.; Li, T.-T.; Wu, C.; Sun, X.; Wei, H.; Wang, Z. Experimental and Numerical Assessment of Precast Bridge Columns with Different Grouted Splice Sleeve Coupler Designs Based on Shake Table Test. J. Bridge Eng. 2021, 26, 04021055. [Google Scholar] [CrossRef]
- Qing, Y.; Yuan, Y.; Wang, C.-L.; Meng, S.; Zeng, B. Experimental study of precast columns with a hybrid joint incorporating bolted couplers and grouted sleeves. J. Build. Eng. 2023, 74, 106878. [Google Scholar] [CrossRef]
- Wang, T.; Zhou, Z.; Yuan, K.; Jiang, R.; Ma, X.; Li, L. Evaluation of common defects of grouted sleeve connectors. Case Stud. Constr. Mater. 2022, 17, e01605. [Google Scholar] [CrossRef]
- Xu, G.D.; Xiang, Q.D.; Zhao, G.Z.; Sun, Z.H. Experimental study on construction quality of grouting sleeve detected by X-ray digital radiography technology. Build. Struct. 2020, 50, 11–15+6. [Google Scholar] [CrossRef]
- Liao, C.; Deng, C.F.; Li, Q.; Li, S.; Liu, R. Analysis and research on non-destructive testing technology of grouting quality based on X-ray absorption contrast imaging improvement. Build. Struct. 2023, 53, 1311–1317. [Google Scholar]
- Tao, L.; Lu, L.F.; Xu, W.J. Experimental study of testing defects in grout sleeve pieces by X-ray. Sichuan Build. Sci. 2018, 44, 49–51. [Google Scholar]
- Cao, D.; Pan, Z.F.; Zhang, Z.; Zeng, B. Study on non-destructive testing method of grouting sleeve compactness with wavelet packet energy ratio change. Constr. Build. Mater. 2023, 389, 131750. [Google Scholar] [CrossRef]
- Zhang, Y.J.; Chen, X.J.; Zhu, W.F. Ultrasonic guided wave detection of weak bond interface defects in steel-concrete structures. J. Appl. Acoust. 2020, 39, 379–385. [Google Scholar]
- Hu, N.; Liu, Y.L.; Zhao, Y.X.; Zhang, J.; Liu, X.Y. On-line Monitoring Technologies for Complex Structural Damage Identification Based on Low-frequency Structural Dynamic Signals and Ultrasonic Guided Waves. Chin. J. Solid Mech. 2017, 38, 312–347. [Google Scholar]
- Liu, H.; Li, Z.W.; Fan, G.P.; Zhu, W.F.; Zhang, H.; Xu, J.C.; Zhang, H.Y. Study on low frequency ultrasonic array imaging method for defects of concrete structures. J. Railw. Sci. Eng. 2023, 20, 12. [Google Scholar] [CrossRef]
- Yang, H.L.; Zhang, H.X. Research on identification of grouting defect size based on impact—Echo method. Build. Struct. 2023, 53, 97–104. [Google Scholar]
- Yao, F.; Lu, X.Q.; Chen, G.Y. Experimental and signal processing research on concrete-rock structural defects by impact-echo method. J. Railw. Sci. Eng. 2021, 18, 2316–2323. [Google Scholar]
- Geng, H.J.; Liu, R.G.; Cai, D.S.; Xie, F.Z.; Tang, X.W.; Zhou, H.J. Study on quantitative detection of defects of concrete members by impact-echo method. Concrete 2021, 2021, 150–154+160. [Google Scholar] [CrossRef]
- Yao, F.; Abulikemu, A. Effect of impact source on detection quality in impact echo testing of sleeve grouting. Mater. Test. 2020, 62, 927–935. [Google Scholar]
- Lu, Z.; Wu, B.; Sakata, H.; Huang, J.; Zhang, M. Mechanical performance of prefabricated concrete beam-column joints with double-grouted sleeve connectors: A numerical and theoretical study. Structures 2023, 56, 104870. [Google Scholar] [CrossRef]
- Zhang, P.; Su, Y.-L.; Fan, J.-J.; Feng, H.; Shao, J.; Guo, H.; Gao, D.-Y.; Sheikh, S.A. Experimental research on the mechanical behavior of grouted sleeves with fiber-reinforced grouting material under cyclic loading. Structures 2021, 34, 2189–2204. [Google Scholar] [CrossRef]
- Wang, R.; Ma, B.; Chen, X. Seismic performance of pre-fabricated segmental bridge piers with grouted splice sleeve connections. Eng. Struct. 2021, 229, 111668. [Google Scholar] [CrossRef]
- Xu, W.-J.; Ma, B.; Huang, H.; Su, J.; Li, J.-Z.; Wang, R.-L. The seismic performance of precast bridge piers with grouted sleeves. Eng. Mech. 2020, 37, 93–104. [Google Scholar]
- Sajid, S.; Taras, A.; Chouinard, L. Detect defections in concrete plates with impulse-response test and statistical pattern recognition. Mech. Syst. Signal Process. 2021, 161, 107948. [Google Scholar] [CrossRef]
- Coleman, Z.W.; Schindler, A.K. Investigation of Ground-Penetrating Radar, Impact-echo, and Infrared Thermography Methods to Detect Defects in Concrete Bridge Decks. Transp. Res. Rec. 2022, 2679, 169–182. [Google Scholar] [CrossRef]
- Wan, L.; Han, X.; Wang, B.; Yang, F.; Feng, J.Q. Experimental study on the impact-echo test for the flaw detection of concrete structure. Concrete 2012, 2012, 8–10. [Google Scholar] [CrossRef]
- Dethof, F.; Kessler, S. Explaining impact-echo geometry effects using modal analysis theory and numerical simulations. NdtE Int. 2024, 143, 103035. [Google Scholar] [CrossRef]
- Coleman, Z.W.; Schindler, A.K. Automated Procedure to Identify Concrete Defects from Impact-echo Data. Aci Mater. J. 2023, 120, 95–106. [Google Scholar]
- Ning, J.-G.; Huang, Q.; Li, X.-H. Detection of concrete structures using the Impact-echo method. J. China Univ. Min. Technol. 2004, 33, 97–101. [Google Scholar]
- Cao, D.; Pan, Z.; Zhang, Z.; Zeng, B. Experimental and numerical study on detection of sleeve grouting defect with impact-echo method. Structures 2023, 52, 632–650. [Google Scholar] [CrossRef]
- Lin, W.; Wang, H.; Chen, S.; Lin, X.; Huang, J.; Wang, R. Time Reversal Method for Lamb−Wave−Based Diagnostics of Multiple−Sleeve Grouting Connections. Buildings 2023, 13, 2824. [Google Scholar] [CrossRef]
- Chiamen, H.; Chia-chi, C.; Tzunghao, L.; Juang, Y. Detecting flaws in concrete blocks using the impact-echo method. NDT E Int. 2008, 41, 98–107. [Google Scholar] [CrossRef]
- Yan-hong, H.; Sheng-huoo, N.; Kuo-feng, L.; Charng, J.-J. Assessment of identifiable defect size in a drilled shaft using sonic echo method: Numerical simulation. Comput. Geotech. 2010, 37, 757–768. [Google Scholar] [CrossRef]
- Xu, J.-C.; Ren, Q.-W.; Shen, Z.-Z. Prediction of the strength of concrete radiation shielding based on LS-SVM. Ann. Nucl. Energy 2015, 85, 296–300. [Google Scholar] [CrossRef]
- Zhang, J.-K.; Yan, W.; Cui, D.-M. Concrete Condition Assessment Using Impact-echo Method and Extreme Learning Machines. Sensors 2016, 16, 447. [Google Scholar] [CrossRef] [PubMed]
- Liu, H.; Li, X.-M.; Xu, Q.-F. Experiment on grout sleeve compactness detection using the Impact-echo method. Nondestruct. Test. 2017, 39, 12–16. [Google Scholar]
- Liu, Z.H. The Testing Technology of Sleeves Grouting Defect Based on the Impact-Echo Method. Master’s Thesis, Anhui Jianzhu University, Hefei, China, September 2017. [Google Scholar]
- Wuj, Y.; An, X.-H. Current status and progress of concrete nondestructive testing technology. J. Sichuan Univ. Sci. Eng. 2009, 22, 4–7. [Google Scholar]
- Jiang, Y.; Sun, Z.; Wei, X.; Zhang, R.T.; Gu, S. Experimental study on testing grouting quality of grouted and splicing joints in precast concrete structure using impact-echo method. Build. Struct. 2018, 48, 22–27. [Google Scholar]
- Ministry of Housing and Urban-Rural Development of the People’s Republic of China. GB 50010-2010; Code for Design of Concrete Structures. China Architecture & Building Press: Beijing, China, 2010.
- Ministry of Housing and Urban-Rural Development of the People’s Republic of China. GB 50017-2017; Standard for Design of Steel Structures. China Architecture & Building Press: Beijing, China, 2017.
- Ministry of Housing and Urban-Rural Development of the People’s Republic of China. GB/T 50448-2015; Technical Code for Application of Cementitious Grout. China Planning Press: Beijing, China, 2015.
Disclaimer/Publisher’s Note: The statements, opinions and data contained in all publications are solely those of the individual author(s) and contributor(s) and not of MDPI and/or the editor(s). MDPI and/or the editor(s) disclaim responsibility for any injury to people or property resulting from any ideas, methods, instructions or products referred to in the content. |
© 2025 by the authors. Licensee MDPI, Basel, Switzerland. This article is an open access article distributed under the terms and conditions of the Creative Commons Attribution (CC BY) license (https://creativecommons.org/licenses/by/4.0/).