Article

Parkinson’s Disease Classification Using Gray Matter MRI and Deep Learning: A Comparative Framework

1
Graduate School of Engineering, Nippon Institute of Technology, 4-1 Gakuendai, Miyashiro-machi, Saitama 345-8501, Japan
2
Graduate School of Health Data Science, Juntendo University, 2-1-1 Hongo, Bunkyo-ku, Tokyo 113-8421, Japan
3
Department of Rehabilitation, Nihon Institute of Medical Science, 1276 Shimogawara, Moroyama-machi, Iruma-gun, Saitama 350-0435, Japan
4
Department of Information Technology and Media Design, Nippon Institute of Technology, 4-1 Gakuendai, Miyashiro-machi, Saitama 345-8501, Japan
*
Author to whom correspondence should be addressed.
Appl. Sci. 2025, 15(21), 11812; https://doi.org/10.3390/app152111812
Submission received: 12 September 2025 / Revised: 30 October 2025 / Accepted: 30 October 2025 / Published: 5 November 2025
(This article belongs to the Special Issue Pattern Recognition Applications of Neural Networks and Deep Learning)

Abstract

In this study, we propose multiple deep learning models for classifying gray matter MRI images of healthy individuals, prodromal Parkinson’s disease (PD) subjects, and diagnosed PD patients. The two proposed models extend conventional deep learning architectures—MedicalNet3D and 3D ResNet18—by performing feature extraction separately for each class and inputting these features into distinct multilayer perceptron (MLP) classifiers constructed via fine-tuning. To mitigate overfitting problem and improve generalizability, we introduce a training method based on group-wise feature fusion, in which subject IDs are separated to avoid data leakage during training. Through comparative experiments using the PPMI database, the effectiveness of the proposed approach was validated.

1. Introduction

Parkinson’s disease (PD) is a prototypical neurodegenerative disorder characterized by the progressive loss of dopaminergic neurons in the substantia nigra [1]. As the disease progresses, symptoms such as resting tremor, slowed movement, muscle rigidity, and impaired balance develop. Motor symptoms commonly appear during the advanced stages of Parkinson’s disease, at which point significant neurodegeneration is believed to have taken place. In contrast, non-motor symptoms—including olfactory dysfunction, constipation, rapid eye movement sleep behavior disorder (RBD), anxiety, and depression—may manifest several years earlier during the prodromal phase, a preclinical stage. Early diagnosis and intervention during this period are considered critical for delaying disease onset and mitigating symptom severity [2,3]. Recent advances in magnetic resonance imaging (MRI) have enabled the visualization of subtle structural changes in the brain. In particular, gray matter atrophy and morphological alterations have been reported to be useful for the early detection of PD [4,5,6,7,8]. Moreover, automated analysis of MRI data using deep learning techniques has garnered attention as a promising approach for developing objective biomarkers that are independent of human visual assessment [9,10,11,12]. However, medical imaging datasets are generally limited in sample size and are subject to class imbalance and inter-individual variability. These factors can exacerbate the issue of data leakage, wherein the same subject appears in both training and validation sets, potentially leading to artificially inflated performance metrics in conventional deep learning models [13,14,15].
In this study, we developed a comparative framework to systematically evaluate the impact of model architecture and training strategy on classification performance in a three-class task involving gray matter MRI images: healthy controls, prodromal PD, and clinically diagnosed PD. Specifically, we compared the performance of two models: MedicalNet3D (a medically pre-trained model) and ResNet18 (a standard 3D convolutional neural network). To prevent subject overlap between training and validation sets, we implemented subject ID-based indexing to ensure strict separation at the individual level. Additionally, we explored a group-wise feature extraction and fusion strategy using MedicalNet3D to investigate the potential for clinically coherent model design.
The primary contributions of this study are twofold: (1) we demonstrate the superior performance of the medically pre-trained MedicalNet3D model in classifying PD using gray matter MRI data; and (2) we propose a robust validation framework that eliminates ID leakage, thereby enhancing the reliability of performance evaluation. These findings are expected to contribute to the development of a solid foundation for the clinical application of AI-based technologies in the early diagnosis and staging of Parkinson’s Disease.
Previous studies have explored various deep learning frameworks for MRI-based diagnosis of Parkinson’s disease. Conventional convolutional architectures, such as 3D ResNet and VGG variants, have shown potential in identifying structural abnormalities associated with neurodegenerative conditions [9,16,17]. However, these generic models often suffer from limited transferability across medical imaging datasets. To mitigate this issue, domain-specific pretrained models such as MedicalNet3D [18] have been proposed, which leverage feature representations learned from multiple medical imaging modalities and organs, offering improved generalization.
More recently, transformer-based approaches have been introduced into medical image analysis for their ability to capture long-range spatial dependencies. Nevertheless, their application to Parkinson’s disease remains limited, especially in the prodromal stage. Moreover, the problem of data leakage—where MRI scans from the same subject appear in both training and validation sets—has been increasingly recognized as a major confounding factor [19,20]. To address this, recent studies advocate for subject-level cross-validation using GroupKFold or StratifiedGroupKFold strategies [21].
Building upon these insights, our work proposes a comparative framework combining domain-specific pretrained models and strict ID-based validation to ensure reliable and reproducible evaluation of early-stage PD classification.

2. Data and Methods

2.1. Early Diagnosis and Disease Stage Classification of Parkinson’s Disease

Parkinson’s disease (PD) is a progressive neurodegenerative disorder, and its early detection and stage classification are critically important for enabling appropriate therapeutic interventions [22]. Numerous studies have explored methods for distinguishing PD patients from healthy controls using neuroimaging data and clinical information. However, most existing research has been limited to binary classification tasks between Healthy Controls (HCs) and PDs, with only a few studies focusing on the crucial pre-diagnostic phase known as “Prodromal Parkinson’s Disease (Prodromal).” In fact, only Refs. [13,14] explicitly addressed the prodromal stage among the related studies as we investigated. Furthermore, classification tasks involving HC vs. Prodromal or Prodromal vs. PD are exceedingly rare.

2.2. Dataset Used (PPMI)

The dataset used in this study was obtained from the Parkinson’s Progression Markers Initiative (PPMI) database (https://www.ppmi-info.org (accessed and downloaded on 1 March 2018) [23,24]. All participants provided informed consent prior to enrollment, and reuse of the data was approved by the Research Ethics Board at McGill University.
Subjects included in the analysis were limited to those with structural T1-weighted MRI scans and complete clinical evaluation data (See Figure 1). Individuals with missing key variables or poor image quality were excluded. As a result, data from a total of 783 participants across the following three groups were used (see Table 1). However, the data used in the experiments did not necessarily consist of a single record per subject; some participants underwent multiple follow-up examinations. Therefore, the actual number of data entries used is shown in Table 2.

2.3. Image Preprocessing and Feature Extraction

All MRI image data were resampled to isotropic voxels of 1 mm3 and underwent skull-stripping, bias field correction, and tissue segmentation into gray matter (GM) and white matter (WM). Finally, spatial normalization to the MNI152 [25] standard space was performed (Figure 1). This preprocessing pipeline was implemented using CAT12 (Computational Anatomy Toolbox, developed by C. Gaser and R. Dahnke, Department of Psychiatry and Department of Neurology, Jena University Hospital, Friedrich Schiller University, Jena, Germany) [26] within the SPM12 [27] environment. Following segmentation, probabilistic maps of GM and WM were extracted for each subject and fed into separate feature extraction pipelines, enabling the acquisition of complementary anatomical information related to brain structure. This approach is expected to facilitate the detection of subtle structural changes associated with the progression of Parkinson’s disease pathology.

2.4. Model Architectures for Feature Extraction

In this study, two representative 3D convolutional neural network architectures were selected—MedicalNet3D and 3D ResNet18—to ensure both domain relevance and experimental controllability. MedicalNet3D was chosen for its pretraining on 23 large-scale medical imaging datasets, which provides domain-specific initialization and enhanced feature generalization for volumetric MRI analysis [22]. On the other hand, 3D ResNet18, a lightweight and widely adopted baseline model, was employed as a general-purpose convolutional framework to provide a fair comparison with MedicalNet3D under identical classifier conditions.
Deeper models such as 3D ResNet50, DenseNet121, or transformer-based networks were intentionally excluded at this stage because of the limited sample size (n = 979) and the risk of overfitting inherent to high-capacity architectures. Moreover, using these two structurally comparable backbones allows us to isolate the effect of medical-domain pretraining rather than confounding it with architectural depth or parameter count. This design ensures that the comparison focuses purely on domain transferability and model stability under identical experimental settings.
Following the standardization of gray matter MRI images, the model selection phase focused on the feature modeling capabilities of different neural network architectures for three-dimensional medical imaging. Given that Parkinson’s disease-related imaging features are anatomically rich and spatially distributed, we adopted three structurally distinct 3D neural network models to evaluate their respective performance and architectural suitability for gray matter MRI classification. These models represent three major paradigms: a transfer learning-based architecture tailored for medical imaging, a conventional convolutional neural network (CNN), and an emerging attention-based framework. MedicalNet3D is a pretrained model whose parameters have been initialized through multiple medical imaging tasks, offering strong feature transferability and generalization performance. Its architecture is based on deep residual convolutional blocks, which are well-suited for extracting localized anatomical features and hierarchical patterns in three-dimensional space. The model has demonstrated stability and practical utility in clinical applications. The MedicalNet3D model was pretrained on 23 large-scale medical imaging datasets covering multiple organs and modalities, providing domain-specific initialization for volumetric MRI [18].
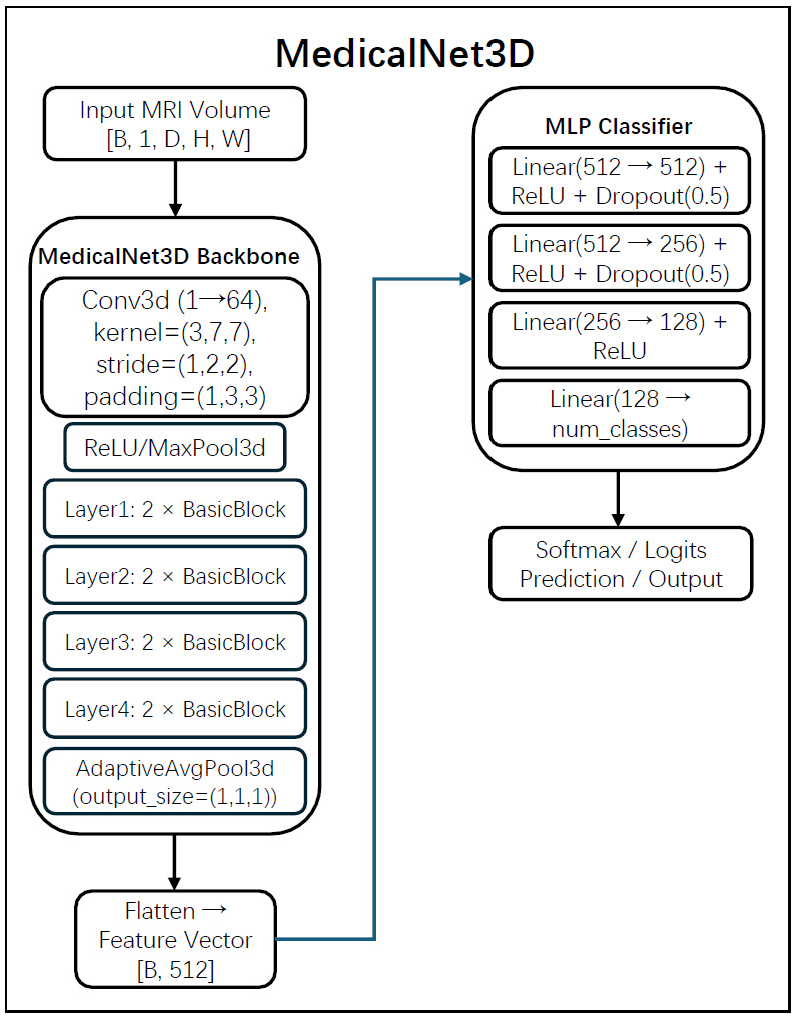
In this study, MedicalNet3D—pretrained specifically for medical image analysis—was employed for feature extraction from gray matter MRI scans (see Figure 2). Built upon the 3D ResNet18 backbone, the model begins with a 3D convolutional layer (kernel size = (3,7,7), stride = (1,2,2)), followed by ReLU activation and MaxPool3D. Subsequently, four residual blocks (Layer1 to Layer4) progressively extract spatial features along the three axes of volumetric MRI data. These features are then compressed via AdaptiveAvgPool3D to a spatial dimension of (1,1,1), yielding a final 512-dimensional feature vector. The extracted features are input into a shared multilayer perceptron (MLP) classifier, identical for both MedicalNet3D and 3D ResNet18, to ensure fair performance comparison. The classifier consists of four fully connected layers (512 → 512 → 256 → 128 → num_classes), incorporating ReLU activations and dropout (rate = 0.5).
The 3D ResNet18 model [16] inherits the design principles of conventional ResNet architecture and is relatively simple in structure, making it suitable for rapid training on medium-sized datasets and for use as a baseline in CNN-based model comparisons. The 3D ResNet18 model was pretrained on the Kinetics-400 video dataset.
In this study, we employed the 3D ResNet18 (r3d_18 [28]) model—originally designed for video recognition—for feature extraction from gray matter MRI scans (see Figure 3). The initial input layer was modified to accommodate single-channel MRI data. Input images were processed through a sequence of 3D convolution, ReLU activation, residual blocks (Layer1 to Layer4), and adaptive average pooling, ultimately yielding a 512-dimensional feature vector. The extracted features were subsequently fed into a multilayer perceptron (MLP) classifier, identical in structure to that used with MedicalNet3D, to ensure consistency in comparative evaluation. The classifier comprises three fully connected layers (512 → 512 → 256 → 128 → num_classes), and was standardized to facilitate fair performance comparison between models.

2.5. Feature Learning Strategies Based on Subject-Wise Data Splits

After completing the construction of the model architecture, this study designed two distinct feature extraction and learning strategies to evaluate modeling stability and generalization capability at the subject level. These strategies are compared from two perspectives: unified modeling using all samples, and group-wise feature fusion.
(1) Global Feature Learning Strategy: In this approach, MRI images from all subjects are input into the classification models without categorization by diagnostic group. Feature extraction is performed collectively, and the resulting three-dimensional feature vectors from each of the three aforementioned classification models are integrated. These integrated features are then used for subsequent classification training and validation via a multilayer perceptron (MLP).
Since all data are processed within a single feature space, this method offers a streamlined workflow and high computational efficiency, making it suitable for large-scale, rapid experimentation. However, if the same subject appears in both the training and validation datasets (i.e., subject ID duplication), the model may inadvertently learn subject-specific, non-generalizable features. This can lead to an overestimation of performance metrics, posing a risk to the validity of the evaluation.
(2) Group-wise Feature Extraction with MLP Fusion Strategy: To investigate the impact of subject ID leakage on model performance, two feature fusion strategies were designed. The first strategy does not restrict duplication of subject IDs, allowing features extracted based on diagnostic labels (Control, Prodromal, PD) to be directly used for training and validation. As a result, the same subject may appear in both datasets, introducing a risk of information leakage and potentially inflating evaluation metrics.
The second strategy introduces a strict ID separation protocol during cross-validation. Based on index files, each subject is assigned exclusively to either the training or validation set, ensuring no overlap. In this approach, feature vectors obtained from the three diagnostic groups are concatenated or stacked and input into an MLP for fused modeling and prediction. This method effectively mitigates ID leakage and is expected to enhance generalization to unseen subjects, as well as improve structural clarity in multi-class classification.
For all experiments, a unified multilayer perceptron (MLP) architecture was employed as the classifier following feature extraction. While the overall structure of the MLP remains consistent, the input layer is adjusted according to the output dimensionality of each model (512 dimensions for both MedicalNet3D and ResNet18). The MLP consists of four linear transformation layers:
-
The first two layers (Input → 512, 512 → 256) incorporate ReLU activation and Dropout (p = 0.5).
-
The third layer (256 → 128) uses ReLU only.
-
The final layer (128 → num_classes) produces outputs corresponding to three-class classification.
Outputs are treated either as probability distributions via Softmax or as raw logits. The classifier outputs both the raw logits and the Softmax-normalized class probabilities. In this study, the term “Prediction” refers to the Softmax-normalized output, while “Logits” indicate the unnormalized linear outputs before Softmax normalization. During training, the Softmax probabilities are passed to the cross-entropy (CE) loss function, whereas in the validation stage, class decisions are based on the maximum logit value, which corresponds to the highest Softmax probability. To ensure training stability, all MLPs share the same number of epochs, optimization method, and learning rate schedule.

2.6. Evaluation Methodology

In all experiments, a five-fold cross-validation [21] strategy was employed to assess the stability and generalization performance of different model architectures and feature extraction methods. For performance evaluation, three primary metrics were used:
-
Accuracy, representing overall classification correctness.
-
F1 score, measuring discriminative power across classes.
-
AUC (Area Under the Curve), indicating the model’s ability to distinguish between categories.
In the fusion strategy based on group-wise feature extraction, subject-level information leakage was explicitly prevented. Each subject ID was assigned to an index file to ensure complete separation between training and validation datasets at the individual level.
It is important to note that the dataset used in this study exhibits class imbalance, with the distribution of Healthy Control (HC), Prodromal, and PD groups approximately 1:1:3.6 (Table 2). To minimize potential bias arising from this imbalance, all cross-validation experiments employed a StratifiedGroupKFold strategy to ensure that each fold maintained consistent class proportions while preserving subject-level separation.
In addition, model performance was evaluated using F1 score and AUC, which are more robust to imbalanced data compared with overall accuracy. No explicit re-sampling or class weighting was applied in this study in order to retain the natural data distribution of the PPMI cohort. Future work may incorporate cost-sensitive learning or oversampling techniques to further address class imbalance and improve model sensitivity for minority classes, particularly the Prodromal group.

3. Experiments and Results

In this study, we constructed three experimental workflows to examine how different model architectures and feature processing strategies affect the classification performance of three-dimensional gray matter MRI images in Parkinson’s disease.
(1) Global Feature Learning Strategy: All samples were integrated and input into the model regardless of diagnostic labels, enabling unified feature extraction and classification. In this strategy, subject ID duplication was not restricted, allowing the same individual to appear in both the training and validation sets.
(2) Group-wise Feature Fusion Strategy: Data were divided according to diagnostic categories (Control, Prodromal, PD), and features were extracted independently for each group. The extracted features were then merged for classification. However, this strategy still allows for the possibility that the same subject ID may be present in both training and validation sets.
(3) ID-Separated Group-wise Fusion Strategy: Building upon the framework of (2), this strategy enforces strict subject-level separation. All brain image data including multiple follow-up scans from the same individual were partitioned by subject ID. During cross-validation, each subject was assigned exclusively to either the training or validation set to prevent overlap.
In all workflows, feature extraction was performed using three-dimensional deep neural network architectures: MedicalNet3D and 3D ResNet18 [17]. A unified four-layer multilayer perceptron (MLP) classifier was applied across both models. Model evaluation was conducted using five-fold cross-validation, with Accuracy, F1 Score, and Area Under the Curve (AUC) as the primary performance metrics.

3.1. Global Feature Learning

In this strategy, two proposed models based on MedicalNet3D and 3D ResNet18 were employed to extract unified feature representations from all gray matter MRI images, followed by classification using a multilayer perceptron (MLP). The average performance metrics obtained through five-fold cross-validation are presented in Figure 4.
Among the models, the MedicalNet3D-based approach demonstrated the highest performance, achieving an average accuracy of 0.8077, an AUC of 0.8591, and an F1 score of 0.8005. These results indicate superior classification accuracy and training stability. In contrast, the model based on ResNet18 yielded substantially lower performance, with an accuracy of 0.5454, an F1 score of 0.3857, and an AUC of 0.5708.
These findings highlight the advantage of MedicalNet3D, which incorporates a pretraining structure specifically designed for medical imaging tasks, making it well-suited for extracting structural information relevant to neurodegenerative diseases. While ResNet18 is widely adopted as a standard CNN architecture, its representational capacity for three-dimensional medical images appears limited.

3.2. Group-Wise Feature Fusion Strategy

In this experimental setting, we adopted the Group-wise Feature Fusion Strategy, in which feature vectors were independently extracted from each diagnostic group—Control, Prodromal, and PD. The resulting features from the three groups were concatenated and input into a shared multilayer perceptron (MLP) classifier for integrated modeling. Notably, subject-level separation between training and validation sets was not enforced, allowing the possibility of the same individual appearing in both sets. Model performance was evaluated using five-fold cross-validation.
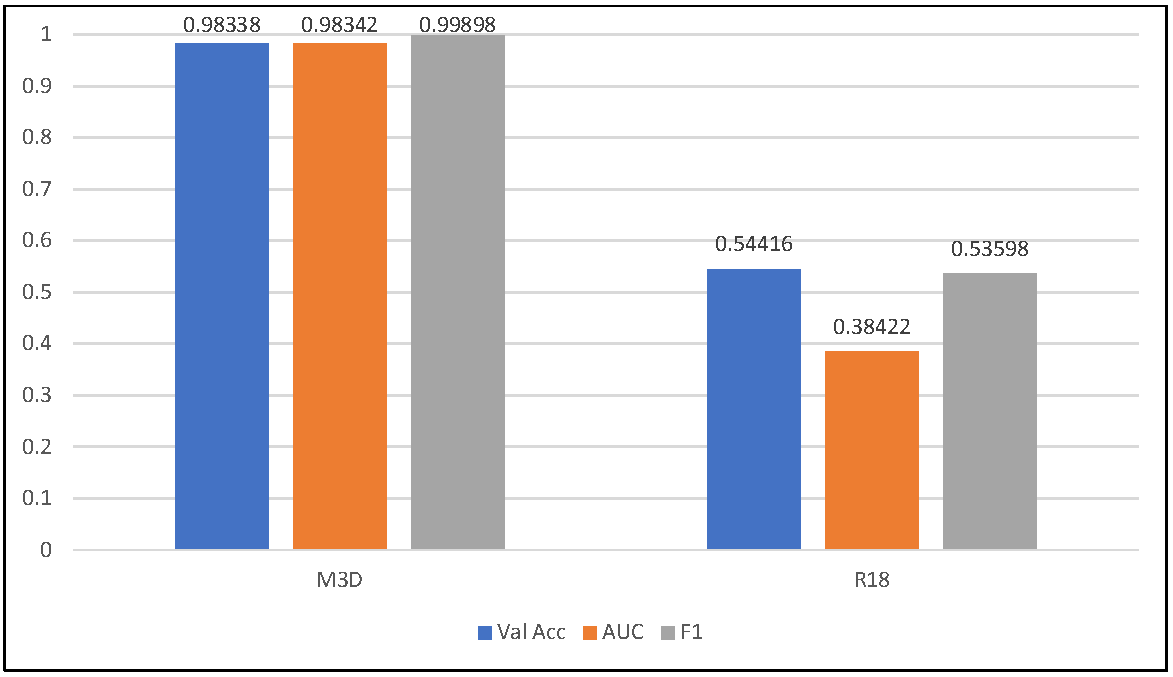
Figure 5 presents the classification results obtained from each feature extraction model. Specifically, the MedicalNet3D (M3D)-based model achieved the highest overall performance, with validation accuracy, AUC, and F1 score reaching 0.9383, 0.9842, and 0.9988, respectively. In contrast, the 3D ResNet18 (R18) model implemented via torchvision yielded substantially lower metrics: accuracy of 0.5446, AUC of 0.3482, and F1 score of 0.3598.
In this experiment, subject-level separation between training and validation sets was not enforced, raising the likelihood of individual-level information leakage. Consequently, the model performance may be substantially overestimated [29,30,31].
Nevertheless, the experiment provides preliminary evidence that group-wise feature fusion may contribute positively to model learning. As such, it serves as a valuable baseline for future studies employing stricter validation frameworks. In the next phase, we will implement a cross-validation strategy with complete subject-level separation to more accurately assess each model’s generalization capability and potential for clinical application.

3.3. ID-Separated Group-Wise Feature Fusion Strategy

To more realistically assess the adaptability of classification models in clinical settings, we implemented the Group-wise Feature Fusion Strategy with a rigorous subject-level data separation mechanism. Specifically, feature vectors were independently extracted from each of the three diagnostic categories—HC (Control), Prodromal, and PD—and subsequently concatenated along the sample dimension. These fused features were then input into a shared MLP classifier for training.
During five-fold cross-validation, we employed index files to ensure complete non-overlap between training and validation sets at the subject level. This strict separation effectively mitigated the risk of performance inflation due to individual-level information leakage, thereby enabling a more reliable evaluation of model generalizability [19].
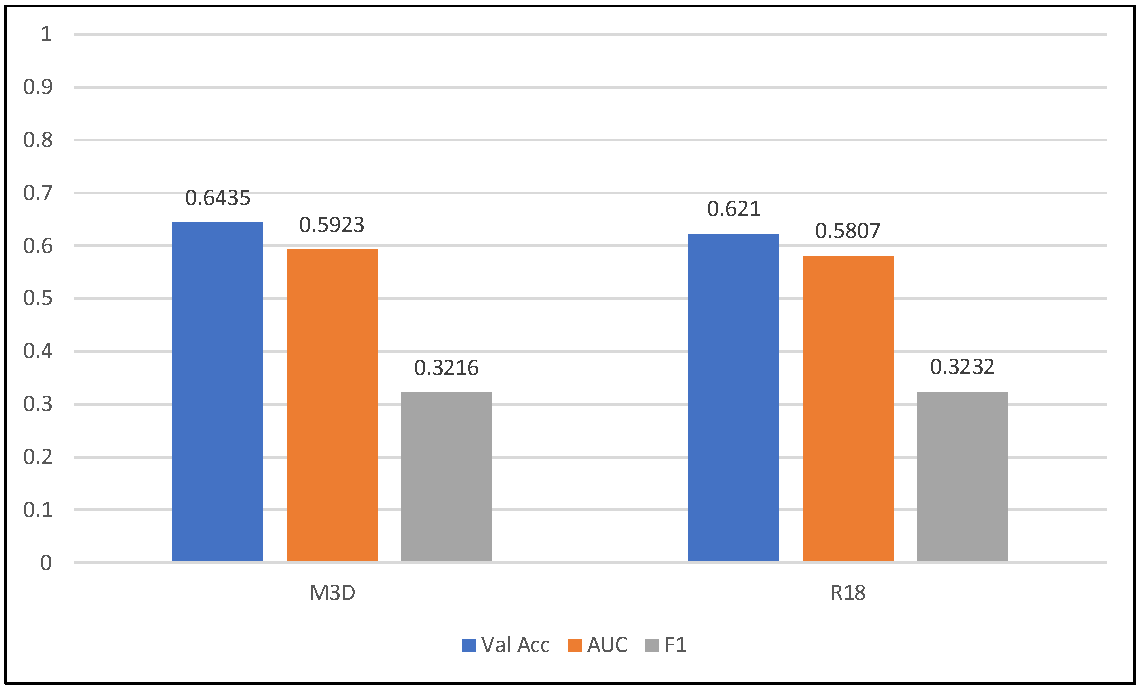
The classification results for each model under this strategy are presented in Figure 6.
The MedicalNet3D (M3D) model achieved the highest performance, with an accuracy of 0.6435, an AUC of 0.5923, and an F1 score of 0.3216. The 3D ResNet18 (R18) model followed with moderate performance, recording an accuracy of 0.6210, an AUC of 0.5807, and an F1 score of 0.3232.
The relatively lower evaluation values of the 3D ResNet18 model can be explained by the architectural characteristics of this network. Originally designed for video understanding tasks, 3D ResNet18 performs convolutions simultaneously along spatial and temporal dimensions to capture motion-related spatiotemporal features. Such design is well suited for dynamic sequential inputs but becomes partially redundant when applied to static volumetric data such as brain MRI. As a result, the model’s temporal convolution components do not effectively contribute to discriminative feature extraction in this context. In contrast, MedicalNet-3D, which was developed as a medical-domain adaptation of the ResNet architecture and pretrained on 23 large-scale medical imaging datasets, benefits from domain-specific parameter initialization and voxel-scale adaptation. These characteristics enhance its feature representation and generalization for static MRI classification, making it inherently more suitable for this task than the generic 3D ResNet18.
In contrast, the M3D model demonstrated stable performance across all evaluation metrics, with a robust and consistent training trajectory. This can be attributed to its architecture, which is specifically designed for medical imaging (MRI/CT), and its strong adaptability in modeling spatial structures. The ResNet18 (R18) model, despite its general-purpose design, also maintained moderate yet stable performance, indicating a degree of robustness in the medical imaging domain.
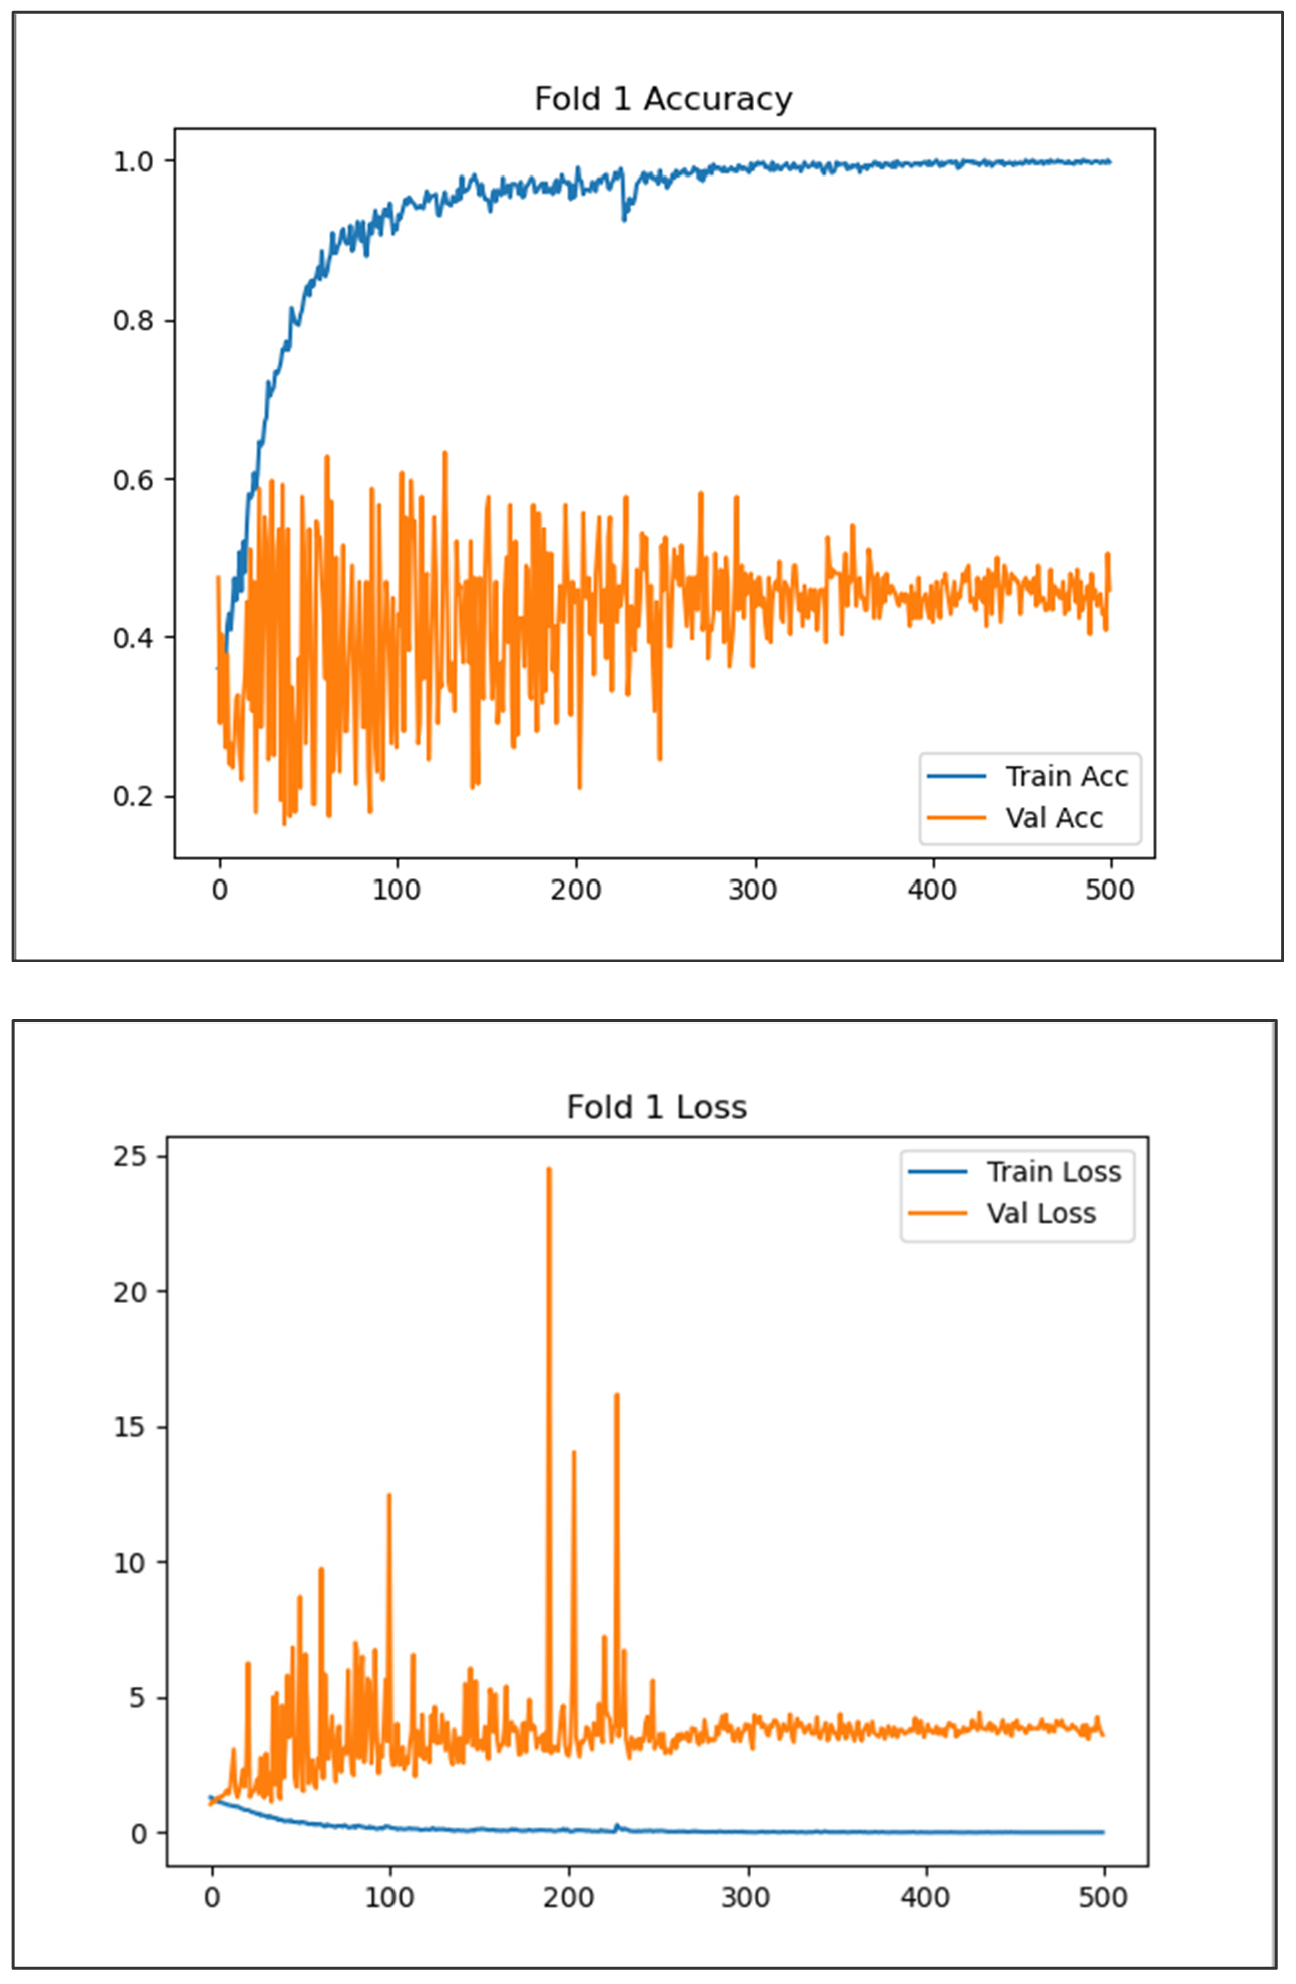
To visually demonstrate the stability of the training process described in Section 3, Figure 7 illustrates the training and validation accuracy and loss curves for one representative fold using the MedicalNet3D model. The training accuracy rapidly converged to approximately 1.0 within the first 100 epochs and remained stable thereafter, whereas the validation accuracy fluctuated around 0.45 to 0.55 throughout the training period. The corresponding loss curves show that the training loss steadily decreased and stabilized near 0.1, while the validation loss exhibited oscillations without significant divergence.
These results confirm that the model training process itself was stable and free from gradient explosions or collapse phenomena, even though the validation performance indicates potential limitations in generalization. This visual evidence supports the discussion that MedicalNet3D achieved consistent convergence behavior during the learning process.
Regarding the classification of the Parkinson’s disease (PD) group, both M3D and R18 achieved relatively high F1 values (up to 0.98 in certain folds), which were consistent with their F1 performance trends. Several folds approached F1 scores near 0.9, indicating effective detection of disease-related structural patterns in gray matter MRI features. This suggests that the group-wise feature fusion strategy effectively emphasized structural features associated with disease progression. However, the differentiation between Control and Prodromal groups remained challenging, highlighting the limitations of classification based solely on gray matter MRI [20].
The observed class-wise imbalance in performance can be attributed to both data distribution and neuroanatomical variability. The PD group, which represents the majority of the dataset (approximately 64% of total samples), provides the model with a larger number of examples for learning discriminative patterns, resulting in higher recall and F1 scores. In contrast, the Prodromal and Control groups contain fewer samples and exhibit more subtle structural changes, which makes accurate classification more difficult. Furthermore, gray matter alterations in prodromal PD are typically regionally distributed and less pronounced than in fully developed PD, further increasing intra-class variability.
From a methodological perspective, the current study intentionally refrained from applying class balancing or reweighting in order to evaluate the intrinsic learning bias of the model under natural class distributions. However, the results clearly suggest that future research should adopt cost-sensitive learning, class-balanced sampling, or data augmentation to improve the recognition of minority categories. Incorporating multimodal data such as diffusion or functional MRI may also enhance sensitivity to early-stage structural variations that are difficult to detect using gray matter MRI alone.
Future work should explore more sophisticated fusion architectures and incorporate additional modalities, such as clinical indicators and functional imaging, to enhance diagnostic precision. Overall, the modeling strategy based on group-wise feature fusion and strict ID-based separation proved effective in ensuring training validity and enabling comprehensive evaluation of model generalizability and clinical applicability. Notably, the M3D model demonstrated superior performance in both practicality and stability, indicating its potential as a foundational component for clinically implementable AI-assisted diagnostic systems.

4. Conclusions

This study investigates the impact of model architecture selection and feature processing strategies on classification performance in a three-class task for Parkinson’s disease. A comparative experimental framework was constructed based on three-dimensional gray matter MRI images, and classification models were developed using MedicalNet3D and 3D ResNet18. Performance evaluation was conducted using a unified global feature extraction pipeline.
Additionally, a diagnosis-specific feature fusion strategy was introduced, and individual IDs were managed via index files to enhance the reliability of classification results.
Experimental results showed that the model based on MedicalNet3D achieved the highest performance under the global feature learning strategy. On the other hand, although the surface-level evaluation metrics slightly declined when using diagnosis-group-specific feature extraction and MLP-based fusion, this approach effectively avoided the occurrence of deceptively high scores and demonstrated stability, particularly in the identification of the PD class. Therefore, it is considered a promising method in terms of generalization capability and class interpretability.
Building upon these findings, future research will aim to broaden the comparative framework to include additional 3D deep learning architectures such as DenseNet, EfficientNet [32], and Swin Transformer [33], enabling a more comprehensive analysis of spatial representation capabilities across models. Moreover, further improvement will be sought through optimization of 3D embedding structures and the incorporation of attention mechanisms (e.g., SE-block, CBAM) to strengthen the model’s focus on disease-relevant regions. Visualization-based interpretability analyses using Grad-CAM and Attention Maps will also be introduced to better elucidate morphological changes in gray and white matter related to Parkinson’s disease progression [34]. These developments are expected to enhance both the transparency and clinical applicability of deep learning–based diagnostic frameworks for neuroimaging analysis.
Therefore, it is considered a promising method in terms of generalization capability and class interpretability.
To ensure transparency and reproducibility of this research, additional information regarding code availability and data access is provided as follows. The source code used in this study will be made publicly available after necessary revisions and translation of internal annotations to English. However, the MRI data employed in this research were obtained from the Parkinson’s Progression Markers Initiative (PPMI) database, which is a controlled-access and partially paid resource. Due to data use agreements and ethical restrictions, the raw dataset cannot be redistributed directly. Instead, the detailed preprocessing scripts, model configurations, and training protocols will be provided to facilitate reproducibility, and the dataset can be accessed independently through the official PPMI platform (“https://www.ppmi-info.org” (accessed on 12 September 2025)).

Author Contributions

Conceptualization, H.L., T. L., R.Y., and T.K.; methodology, H.L. and T.K.; software, H.L.; validation, T.L., R.Y., and T.K.; formal analysis, H.L. and T.L.; investigation, T. L., H.L., and R.Y.; resources, T.L. and T.K.; data curation, H.L.; writing—original draft preparation, H.L. and T.K.; writing—review and editing, H.L. and T.K.; visualization, H.L. and T.K.; supervision, T.K. and R.Y.; project administration, T.K.; funding acquisition, T.K. All authors have read and agreed to the published version of the manuscript.

Funding

This research was funded by Grants-in-Aid for Scientific Research from the Japan Society for the Promotion of Science (JSPS), under Grant Numbers 19H03402, 20K07724, 22K12152, and 22H03709.

Data Availability Statement

The original contributions presented in this study are included in the article. Further inquiries can be directed to the corresponding author(s).

Conflicts of Interest

The authors declare no conflict of interest.

References

  1. Welton, T.; Hartono, S.; Lee, W.; Teh, P.Y.; Hou, W.; Chen, R.C.; Chen, C.; Lim, E.W.; Prakash, K.M.; Tan, L.C.S.; et al. Classification of Parkinson’s Disease by Deep Learning on Midbrain MRI. Front. Aging Neurosci. 2024, 16, 1425095. [Google Scholar] [CrossRef] [PubMed]
  2. Dentamaro, V.; Impedovo, D.; Musti, L.; Pirlo, G.; Taurisano, P. Enhancing early Parkinson’s disease detection through multimodal deep learning and explainable AI: Insights from the PPMI database. Sci. Rep. 2024, 14, 20941. [Google Scholar] [CrossRef] [PubMed]
  3. Makarious, M.B.; Leonard, H.L.; Vitale, D.; Iwaki, H.; Sargent, L.; Dadu, A.; Violich, I.; Hutchins, E.; Saffo, D.; Bandres-Ciga, S.; et al. Multi-modality machine learning predicting Parkinson’s disease. npj Park. Dis. 2022, 8, 35. [Google Scholar] [CrossRef] [PubMed]
  4. Li, S.; Lei, H.; Zhou, F.; Gardezi, J.; Lei, B. Longitudinal and Multi-modal Data Learning for Parkinson’s Disease Diagnosis via Stacked Sparse Auto-encoder. In Proceedings of the 2019 IEEE 16th International Symposium on Biomedical Imaging (ISBI 2019), Venice, Italy, 8–11 April 2019; pp. 384–387. [Google Scholar]
  5. Pahuja, G.; Prasad, B. Deep learning architectures for Parkinson’s disease detection by using multi-modal features. Comput. Biol. Med. 2022, 146, 105610. [Google Scholar] [CrossRef]
  6. Makarious, M.B.; Leonard, H.L.; Vitale, D.; Iwaki, H.; Sargent, L.; Dadu, A.; Violich, I.; Hutchins, E.; Saffo, D.; Bandres-Ciga, S.; et al. Multimodal phenotypic axes of Parkinson’s disease. npj Park. Dis. 2021, 7, 6. [Google Scholar] [CrossRef]
  7. Huang, Z.; Lei, H.; Zhao, Y.; Zhou, F.; Yan, J.; Elazab, A.; Lei, B. Longitudinal and multi-modal data learning for Parkinson’s disease diagnosis. In Proceedings of the 2018 IEEE 15th International Symposium on Biomedical Imaging (ISBI 2018), Washington, DC, USA, 4–7 April 2018; pp. 1411–1414. [Google Scholar] [CrossRef]
  8. Xu, Y.; Yang, J.; Hu, X.; Shang, H. Voxel-Based Meta-Analysis of Gray Matter Volume Reductions Associated with Cognitive Impairment in Parkinson’s Disease. J. Neurol. 2016, 263, 1178–1187. [Google Scholar] [CrossRef]
  9. Calomino, C.; Bianco, M.G.; Oliva, G.; Laganà, F.; Pullano, S.A.; Quattrone, A. Comparative Analysis of Cross-Validation Methods on PPMI Dataset. In Proceedings of the 2024 IEEE International Symposium on Medical Measurements and Applications (MeMeA), Eindhoven, The Netherlands, 26–28 June 2024; pp. 1–5. [Google Scholar] [CrossRef]
  10. Li, J.; Yang, J.; Gan, H.; Huang, Z. Parkinson’s Disease Diagnosis with Sparse Learning of Multi-Modal Adaptive Similarity. In Proceedings of the 2024 IEEE International Symposium on Biomedical Imaging (ISBI), Athens, Greece, 27–30 May 2024; pp. 1–5. [Google Scholar] [CrossRef]
  11. Qiu, S.; Miller, M.I.; Joshi, P.S.; Lee, J.C.; Xue, C.; Ni, Y.; Wang, Y.; De Anda-Duran, I.; Hwang, P.H.; Cramer, J.A.; et al. Multimodal deep learning for Alzheimer’s disease dementia assessment. Nat. Commun. 2022, 13, 3404. [Google Scholar] [CrossRef]
  12. Cui, X.; Zhou, Y.; Zhao, C.; Li, J.; Zheng, X.; Li, X.; Shan, S.; Liu, J.-X.; Liu, X. A Multiscale Hybrid Attention Networks Based on Multiview Images for the Diagnosis of Parkinson’s Disease. IEEE Trans. Instrum. Meas. 2024, 73, 2501011. [Google Scholar] [CrossRef]
  13. Camacho, M.; Wilms, M.; Almgren, H.; Amador, K.; Camicioli, R.; Ismail, Z.; Monchi, O.; Forkert, N.D.; Alzheimer’s Disease Neuroimaging Initiative. Exploiting macro- and micro-structural brain changes for improved Parkinson’s disease classification from MRI data. npj Park. Dis. 2024, 10, 43. [Google Scholar] [CrossRef]
  14. Zhang, J. Mining imaging and clinical data with machine learning approaches for the diagnosis and early detection of Parkinson’s disease. npj Park. Dis. 2022, 8, 13. [Google Scholar] [CrossRef]
  15. Camacho, M.; Wilms, M.; Mouches, P.; Almgren, H.; Souza, R.; Camicioli, R.; Ismail, Z.; Monchi, O.; Forkert, N.D. Explainable Classification of Parkinson’s Disease Using Deep Learning Trained on a Large Multi-Center Database of T1-Weighted MRI Datasets. NeuroImage Clin. 2023, 38, 103405. [Google Scholar] [CrossRef] [PubMed]
  16. Hara, K.; Kataoka, H.; Satoh, Y. Can Spatiotemporal 3D CNNs Retrace the History of 2D CNNs and ImageNet? In Proceedings of the IEEE/CVF Conference on Computer Vision and Pattern Recognition (CVPR), Salt Lake City, UT, USA, 18–22 June 2018; pp. 6546–6555. [Google Scholar] [CrossRef]
  17. Chakraborty, S.; Aich, S.; Kim, H.-C. Detection of Parkinson’s Disease from 3T T1-Weighted MRI Scans Using 3D Convolutional Neural Network. Diagnostics 2020, 10, 402. [Google Scholar] [CrossRef] [PubMed]
  18. Chen, S.; Ma, K.; Zheng, Y. Med3D: Transfer Learning for 3D Medical Image Analysis. arXiv 2019, arXiv:1904.00625. [Google Scholar] [CrossRef]
  19. scikit-learn. GroupKFold (and StratifiedGroupKFold)—Documentation. Available online: https://scikit-learn.org/stable/modules/generated/sklearn.model_selection.GroupKFold.html (accessed on 17 September 2025).
  20. Bu, S.; Pang, H.; Li, X.; Zhao, M.; Wang, J.; Liu, Y.; Yu, H. Multi-Parametric Radiomics of Conventional T1-Weighted and Susceptibility-Weighted Imaging for Differential Diagnosis of Idiopathic Parkinson’s Disease and Multiple System Atrophy. BMC Med. Imaging 2023, 23, 204. [Google Scholar] [CrossRef]
  21. Bradshaw, T.J.; Huemann, Z.; Hu, J.; Rahmim, A. A Guide to Cross-Validation for Artificial Intelligence in Medical Imaging. Radiol. Artif. Intell. 2023, 5, e220232. [Google Scholar] [CrossRef]
  22. Yan, J.; Luo, X.; Xu, J.; Li, D.; Qiu, L.; Li, D.; Cao, P.; Zhang, C. Unlocking the Potential: T1-Weighted MRI as a Powerful Predictor of Levodopa Response in Parkinson’s Disease. Insights Imaging 2024, 15, 141. [Google Scholar] [CrossRef]
  23. Marek, K.; Jennings, D.; Lasch, S.; Siderowf, A.; Tanner, C.; Simuni, T.; Coffey, C.; Kieburtz, K.; Flagg, E.; Chowdhury, S.; et al. The Parkinson Progression Marker Initiative (PPMI). Prog. Neurobiol. 2011, 95, 629–635. [Google Scholar] [CrossRef]
  24. Marek, K.; Chowdhury, S.; Siderowf, A.; Lasch, S.; Coffey, C.S.; Caspell-Garcia, C.; Simuni, T.; Jennings, D.; Tanner, C.M.; Trojanowski, J.Q.; et al. The Parkinson’s Progression Markers Initiative (PPMI)—Establishing a PD Biomarker Cohort. Ann. Clin. Transl. Neurol. 2018, 5, 1460–1477. [Google Scholar] [CrossRef]
  25. Fonov, V.S.; Evans, A.C.; McKinstry, R.C.; Almli, C.R.; Collins, D.L. Unbiased Nonlinear Average Age-Appropriate Brain Templates from Birth to Adulthood. NeuroImage 2009, 47, S102. [Google Scholar] [CrossRef]
  26. Gaser, C.; Dahnke, R.; Thompson, P.M.; Kurth, F.; Luders, E. Computational Anatomy Toolbox 12: Isotropic Surfaces, Sulcal Depth, and Developmental Data. GigaScience 2024, 13, giae049. [Google Scholar] [CrossRef]
  27. SPM12 Manual Wellcome Centre for Human Neuroimaging, U.C.L. Available online: https://www.fil.ion.ucl.ac.uk/spm/doc/manual.pdf (accessed on 17 September 2025).
  28. Torchvision: r3d_18—Video Models, A.P.I. Available online: https://docs.pytorch.org/vision/main/models/generated/torchvision.models.video.r3d_18.html (accessed on 17 September 2025).
  29. Rumala, D.J. How You Split Matters: Data Leakage and Subject Characteristics Studies in Longitudinal Brain MRI Analysis. arXiv 2023, arXiv:2309.00350. [Google Scholar] [CrossRef]
  30. Hu, J.; Shen, L.; Sun, G. Squeeze-and-Excitation Networks. In Proceedings of the IEEE/CVF Conference on Computer Vision and Pattern Recognition (CVPR), Salt Lake City, UT, USA, 18–22 June 2018; pp. 7132–7141. [Google Scholar] [CrossRef]
  31. Woo, S.; Park, J.; Lee, J.-Y.; Kweon, I.S. CBAM: Convolutional Block Attention Module. In Proceedings of the European Conference on Computer Vision (ECCV), Munich, Germany, 8–14 September 2018; pp. 3–19. [Google Scholar] [CrossRef]
  32. Tan, M.; Le, Q. EfficientNet: Rethinking Model Scaling for Convolutional Neural Networks. In Proceedings of the International Conference on Machine Learning (ICML), Long Beach, CA, USA, 9–15 June 2019; pp. 6105–6114. [Google Scholar] [CrossRef]
  33. Liu, Z.; Lin, Y.; Cao, Y.; Hu, H.; Wei, Y.; Zhang, Z.; Lin, S.; Guo, B. Swin Transformer: Hierarchical Vision Transformer Using Shifted Windows. In Proceedings of the IEEE/CVF International Conference on Computer Vision (ICCV), Online, 11–17 October 2021; pp. 10012–10022. [Google Scholar] [CrossRef]
  34. Selvaraju, R.R.; Cogswell, M.; Das, A.; Vedantam, R.; Parikh, D.; Batra, D. Grad-CAM: Visual Explanations from Deep Networks via Gradient-Based Localization. In Proceedings of the IEEE International Conference on Computer Vision (ICCV), Venice, Italy, 22–29 October 2017; pp. 618–626. [Google Scholar] [CrossRef]
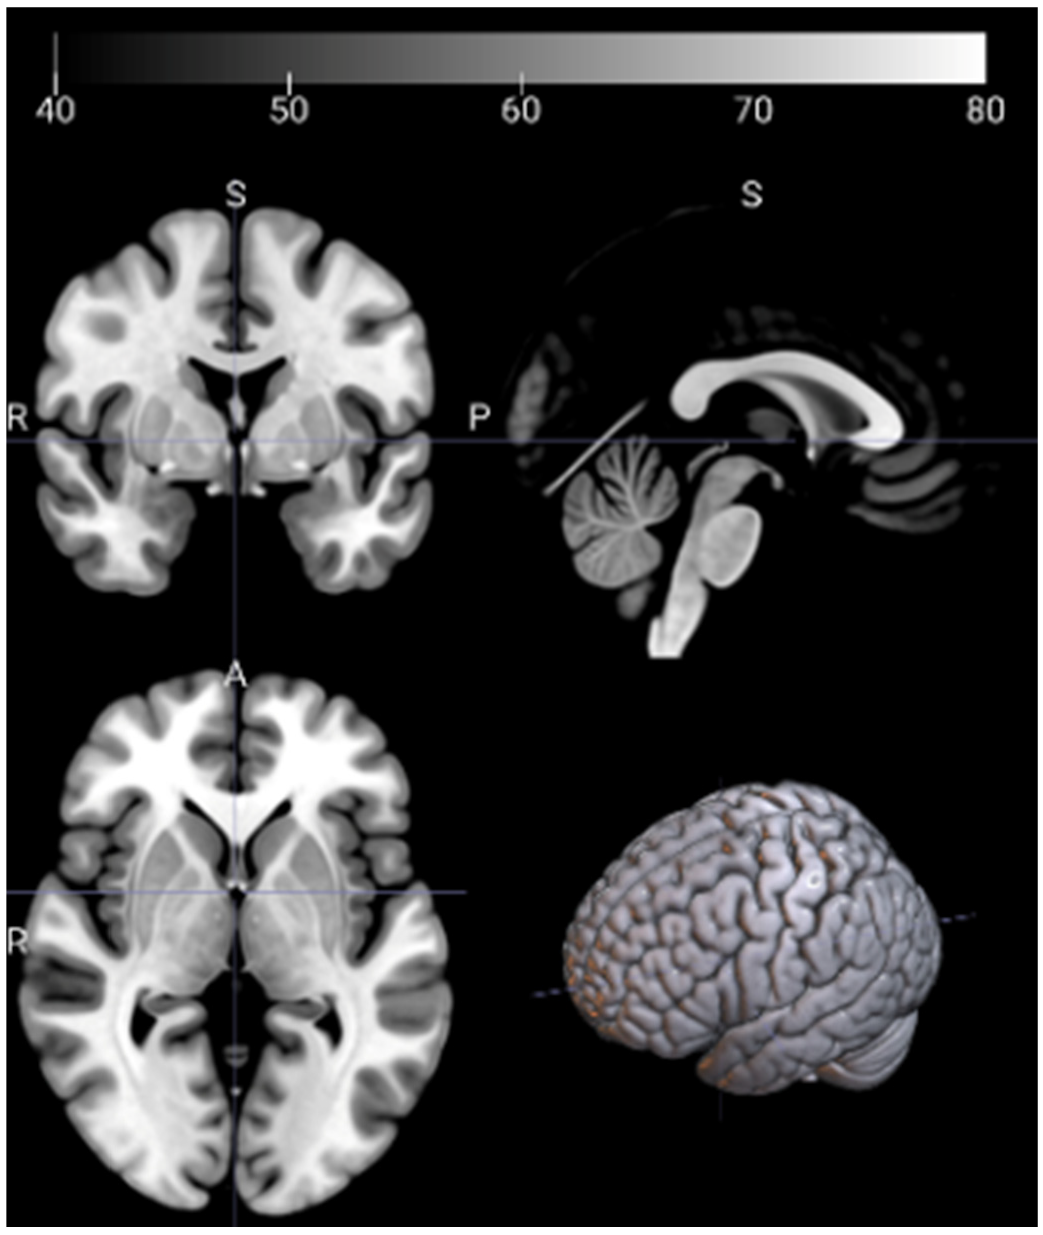
Figure 1. Samples of 3-D MRI images in PPMI dataset used in this study.
Applsci 15 11812 g001
Figure 2. Architecture of a classification model based on MedicalNet3D.
Applsci 15 11812 g002
Figure 3. Architecture of a classification model based on 3D ResNet18.
Applsci 15 11812 g003
Figure 4. Comparison of Classification Performance under Overall Feature Learning Strategy.
Applsci 15 11812 g004
Figure 5. Comparison of Classification Performance under Group-specific Feature Fusion Strategy.
Applsci 15 11812 g005
Figure 6. Comparison of Classification Performance under ID-separated Group-specific Feature Fusion Strategy.
Applsci 15 11812 g006
Figure 7. Training and validation accuracy (upper) and loss curves (lower) for Fold 1 using MedicalNet3D.
Applsci 15 11812 g007
Table 1. Participant Group Classification and Numbers Based on PPMI Data.
ClassNumber
Healthy Control (HC)139
Prodromal Parkinson’s Disease (Prodromal)146
Parkinson’s Disease (PD)498
Table 2. Number of samples used in this study.
ClassNumber
Healthy Control (HC)173
Prodromal Parkinson’s Disease (Prodromal)184
Parkinson’s Disease (PD)622
Total979
Disclaimer/Publisher’s Note: The statements, opinions and data contained in all publications are solely those of the individual author(s) and contributor(s) and not of MDPI and/or the editor(s). MDPI and/or the editor(s) disclaim responsibility for any injury to people or property resulting from any ideas, methods, instructions or products referred to in the content.