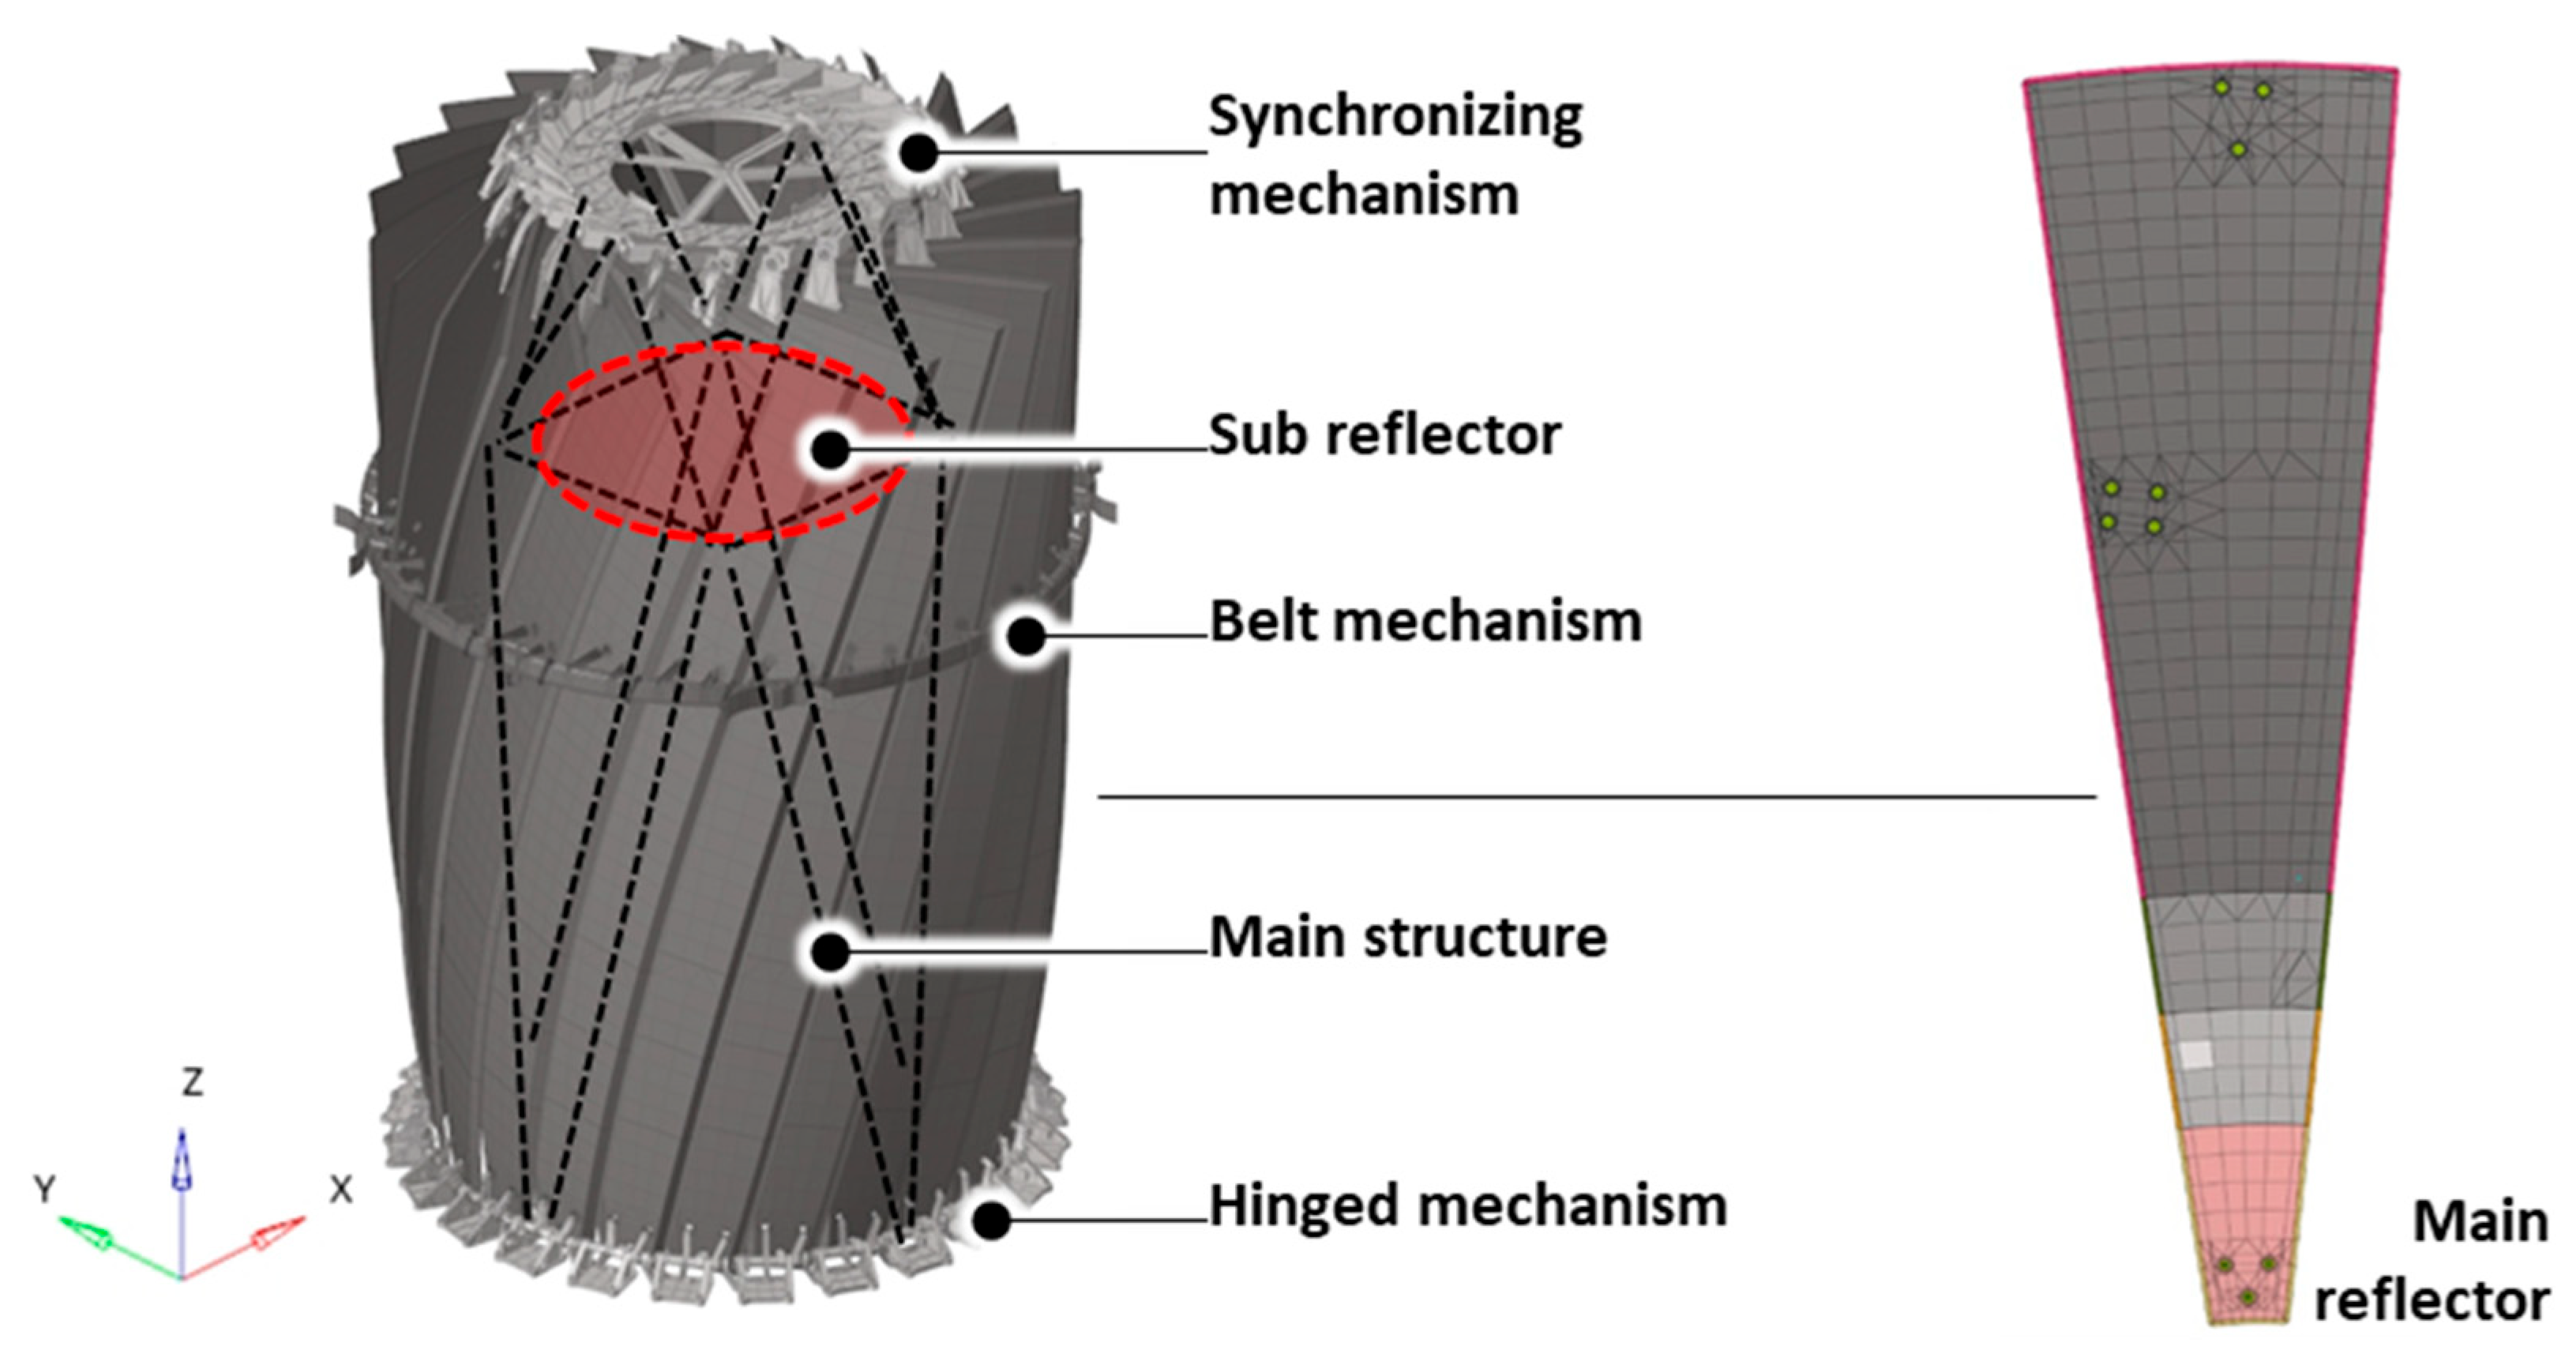
Abstract
The deployable reflector antenna mounted on the SAR satellite is an antenna with a folding structure and is one of the main components of the satellite body. Due to the limited space inside the launch vehicle fairing, the mounting efficiency was improved by applying a structural feature that allows the antenna to be stowed compactly. In addition, weight reduction was required to lower launch costs and improve the satellite revisiting cycle; therefore, the main reflector of the deployable reflector antenna was designed and manufactured using carbon fiber reinforced polymer and aramid honeycomb core. Since the main reflector made of carbon fiber-reinforced polymer and aramid honeycomb core is not an isotropic material, differences between theoretical and actual thermal properties were expected. Therefore, in this study, a thermal balance test was performed on the thermal structure model of the deployable reflector antenna, and the thermal analysis model simulated by the ground test was corrected using the verified temperature conditions as a reference. The thermal properties of the composite material and the thermal conductivity coefficient between the main reflector and the main components connected to it were the targets of correction. In addition, a numerical optimization technique was applied to reduce computational costs, and the thermal analysis assumed the orbital environment model of the deployable reflector antenna was optimized using the corrected thermal properties.
1. Introduction
In recent years, next-generation military reconnaissance satellites have been developed based on three basic technologies: high performance, high reliability, and sustainability. This type of advanced satellite is designed to carry out a strategy of monitoring and reconnaissance of the entire national territory with high-resolution images. In this satellite system, a synthetic aperture radar (SAR) antenna is used, which allows monitoring regardless of observation conditions such as weather, including day and night [,,]. The SAR antenna is one of the payloads that occupy the most weight and volume in this satellite system, so it must be designed to be as small and light as possible. Due to its small and lightweight design, developed countries such as Germany, Israel, and Italy have developed deployable reflector antennas (DRAs) with high storage efficiency. In the process of being launched on a launch vehicle and reaching the mission orbit to carry out a space mission, the satellite is subjected to severe conditions such as quasi-static, vibration, acoustic, and thermal loads [,]. Therefore, the satellite is designed and manufactured to validate structural and thermal stability most efficiently, taking into account the balance between performance and cost. The main reflector of a deployable reflector antenna has the largest mass ratio except for some electrical equipment in the antenna. Therefore, the design and manufacture of the main reflector is one of the most important factors to improve the performance and efficiency of the antenna system. Also, a lightweight antenna with the lowest weight while ensuring structural and thermal stability can improve the satellite revisit period and reduce the cost of the launch process. Therefore, the main reflector of a deployable reflector antenna must be designed to reduce weight while maintaining structural rigidity and thermal stability.
The new space paradigm has had a great impact on the philosophy of space engineering around the world []. As a result, the space industry ecosystem has begun to shift from government agency led to private company led, which suggests that the commercialization of the space industry is actively progressing. Weight reduction in satellites and satellite payloads was one of the most important development elements in the existing space paradigm, but its importance is further emphasized in the new space paradigm, which is led by private companies that prioritize profit-making. In order to reduce the weight of such satellites and satellite payloads, an improved version was developed that has the same performance structurally as the existing solid-type sandwich composite reflector antenna that possesses space heritage, but it is lighter [,,]. A deployable reflector antenna for satellites must be manufactured in a large parabolic form to enhance the performance of the SAR antenna, such as acquiring high-resolution images, maintaining signal transmission quality, and maximizing transmission and reception efficiency. However, it was necessary to improve the storage efficiency of the reflector antenna due to the limited volume inside the projectile fairing. For this purpose, the reflector antenna was developed in a deployable type.
All satellites and satellite-mounted equipment are subject to much more severe thermal effects than ground equipment due to the effects of the daylight and eclipse periods in orbit. If thermal stability in the orbital environment cannot be validated, the satellite and its mounted equipment may be damaged, potentially leading to the failure of the space mission. A thermal analysis of the assumed orbital environment was conducted to confirm the thermal stability of the improved sandwich composite reflector antenna under assumed on-orbit conditions. In this study, a Thermal Mathematical Model (TMM) was constructed for thermal balance testing to improve the reliability of the thermal analysis-assumed orbital environment, and the model was corrected using temperature data obtained from the thermal balance test. In the case of a reflector antenna using carbon fiber-reinforced composite and aramid honeycomb core, differences between theoretical and actual thermal property values were expected, as the material is not isotropic. Therefore, in this study, a thermal balance test was conducted on a sandwich composite reflector antenna using carbon fiber reinforced composite and aramid honeycomb core to validate the thermal property values. In addition, the thermal conductivity coefficient between the main reflector and its connected components was also selected as a correction target to reduce discrepancies from theoretical values and ensure greater accuracy. In general, in the case of interpretation models, corrections based on engineering judgment are intuitive but computationally expansive. To address this, we defined appropriate variables and correction ranges through numerical optimization techniques and corrected the analysis model through an automated process based on optimization techniques. In this way, we were able to obtain the thermo-physical properties of the sandwich composite reflector antenna from the corrected model through thermal balance tests, thereby increasing the reliability of the thermal analysis-assumed orbital environment [,,].
In Section 2.1, the development stages of the satellite and payload are introduced and based on this, and the STM of the deployable reflector antenna is described. The corrections and numerical optimization techniques for the corrections are introduced. In Section 3.2, the thermal analysis-assumed orbital environment and its results are presented.
2. Thermal Balance Test of the Deployable Reflector Antenna on STM Phase
2.1. Configuration of the Deployable Reflector Antenna STM
Figure 1 shows the general development process of a satellite and payload. In the development model (DM) process, functional tests of each component from a mechanical point of view and assembly reviews are performed. In the structural–thermal model (STM) stage, launch environment tests are performed to evaluate the structural integrity against vibration and acoustic loads, and thermal environment tests are performed to simulate thermal loads and evaluate the response in the thermal environment. A qualification model is designed and manufactured using the results of the environmental tests performed in the STM stage. The qualification model (QM) is a model that provides the same functions and performance as the flight model (FM) and is tested for the orbital environment, such as in the structural environment tests and thermal vacuum tests performed in the STM stage [].
Figure 1.
General flow chart for the development of the satellite and payload.
For the above reasons, a structural thermal model was created to verify the thermal performance of the deployable reflector antenna and each component. The STM was designed and fabricated to have the same shape and mass characteristics as the actual reflector antenna and is used in tests to confirm the response of the main components to thermal loads, the optical property values of each component, and the thermal conduction coefficient between the components.
The theoretical basis of the STM lies in modeling techniques to accurately predict the interaction of heat and structural deformation, which allows the thermal behavior of an actual reflector antenna to be reproduced. The fabricated STM was subjected to vibration and acoustic tests, which are launch environment tests, according to the established procedures, and thermal balance tests were performed in place of orbital environment tests.
Figure 2 shows a model of the reflector antenna under development at Hanwha Systems (Yongin-City, Republic of Korea). In this series, we have covered the process of designing and fabricating the main reflector, which is made of space-grade carbon composite material YSH70A and lightweight material aramid honeycomb core [,].
Figure 2.
Conceptual diagram of the deployable reflector antenna on STM phase.
In this study, thermal balance tests were conducted to confirm the response of each component of the deployable reflector antenna to thermal loads and to validate experimental physical properties of the composite-based castings, mounting plate, main reflector, etc. The metallic synchronizing mechanism (SM), belt mechanism (BM), hinged mechanism (HM), etc. were developed using Aluminum (AA6061) material, and the theoretical properties were determined to be accurate enough to perform thermal analysis-assumed orbital environment.
2.2. Thermal Mathematical Model for the Thermal Balance Test
Thermal analysis-assumed orbital environment of large satellite reflector antennas is an essential process for predicting the thermal environment for a satellite’s mission orbit and evaluating how a deployable reflector antenna will react to various environmental conditions in orbit [,]. The results derived from this process focus on mimicking the extreme temperature environments that a deployable reflector antenna may face and evaluating its structural and thermal stability in high and low temperature conditions. It is also the first step in securing the basis data to be used for predicting the temperature distribution of the deployable reflector antenna and, together with the associated material thermal expansion coefficient, for thermal deformation analysis of the deployable reflector antenna and antenna directivity analysis for the thermal deformation results.
As mentioned above, composite materials are used for various components of the reflector antenna, which causes a difference between the theoretical and actual thermo-physical properties used as input data when performing thermal analysis. To minimize this difference, it is necessary to correct the properties using data obtained from thermal balance tests and improve the reliability of thermal analysis-assumed orbital environment.
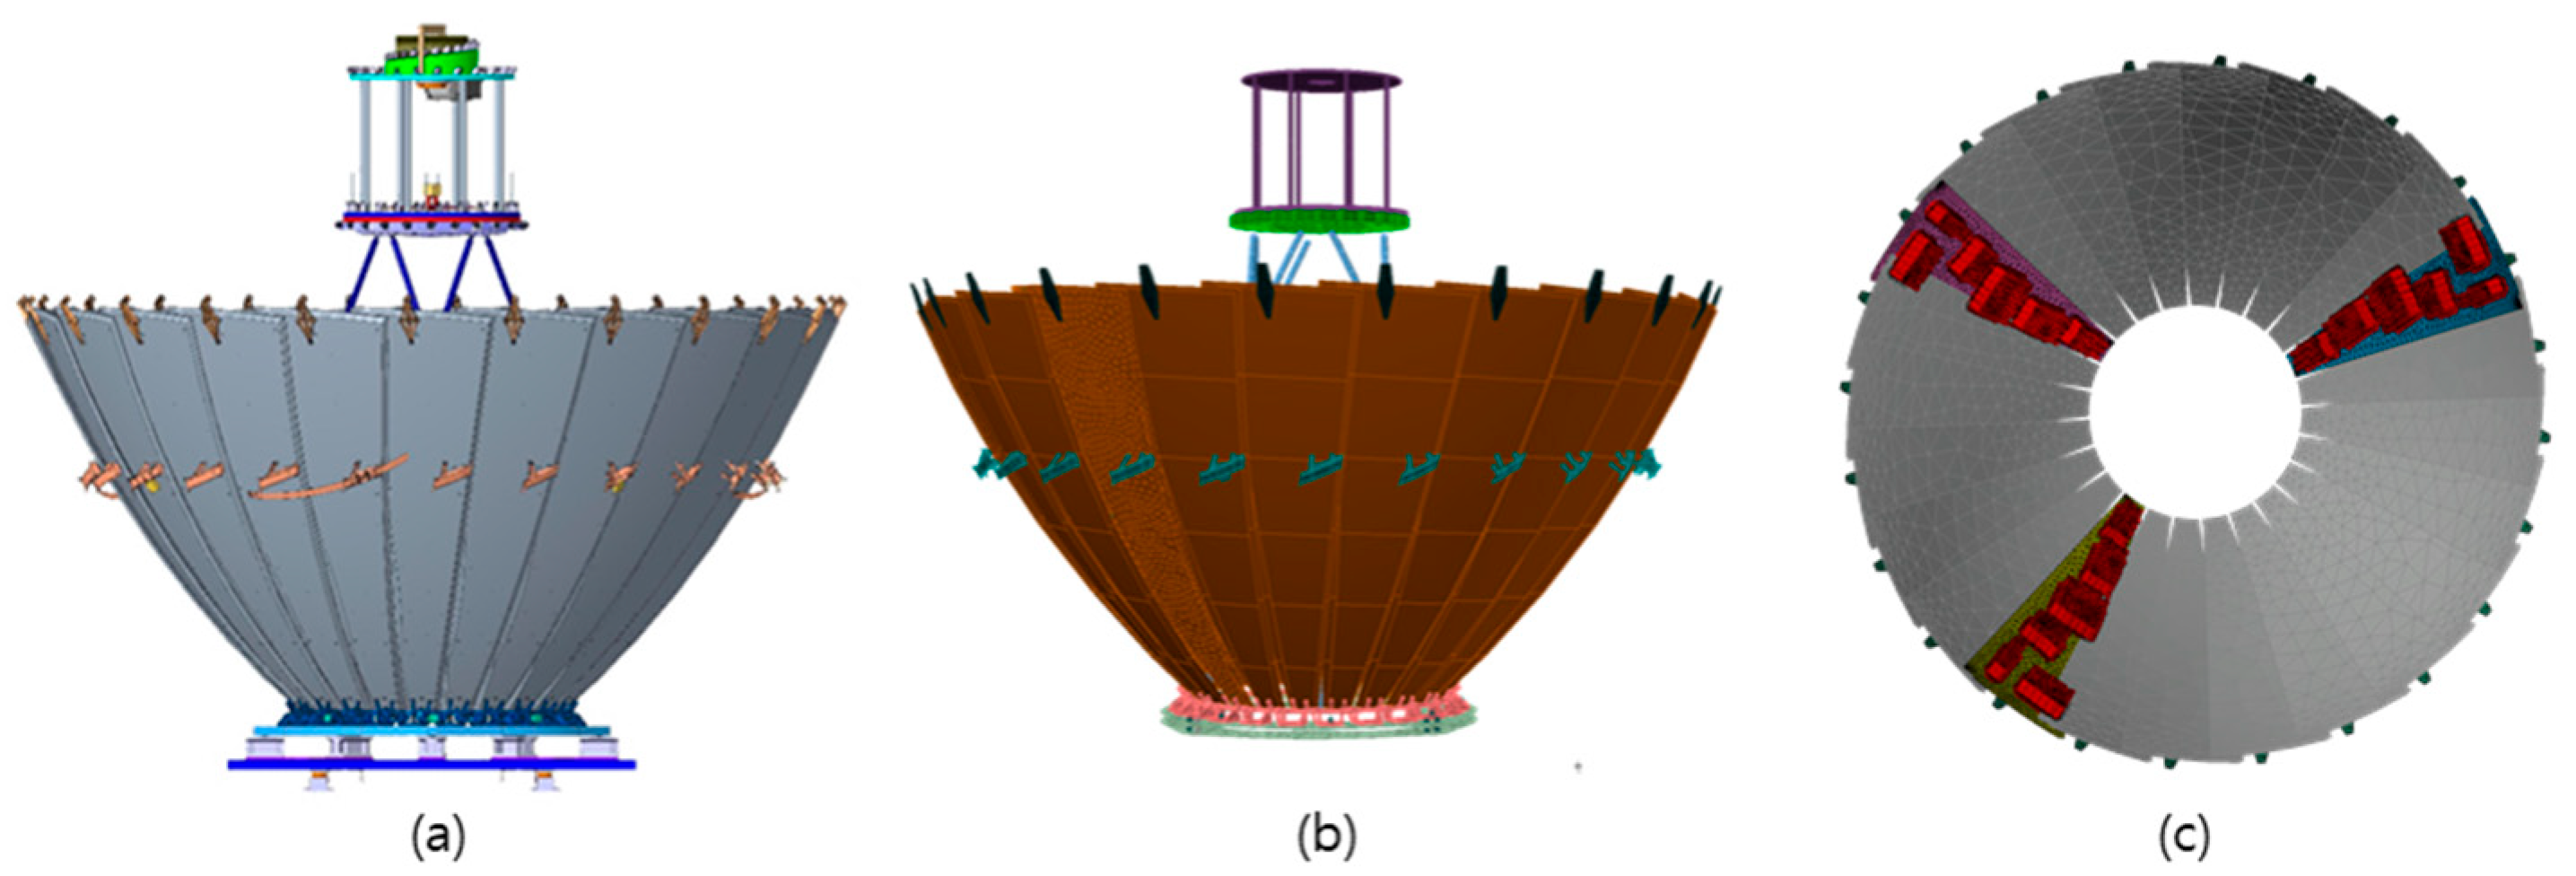
For this purpose, in this study, a ground test simulated-thermal material model was constructed to simulate the thermal balance test. The materials of the main components of the reflector antenna are mainly composed of metals and CFRP composites, and the parts made of metal have relatively high reliability of information on their properties. Therefore, when performing the thermal analysis, the theoretical values of the thermo-physical properties of the TMM were used as they were. However, since there was no reliable information on the heat conduction to the contact surfaces where the contact between each part occurs, it was validated while proceeding with the research. Sandwich composites, another main material of the reflector antenna, are anisotropic materials and are known to have different thermo-physical properties in the in-plane and out-plane directions. Therefore, when performing the thermal analysis, the physical properties in the in-plane direction and the physical properties in the out-plane direction are input in different ways, which is one of the important data that needs to be obtained in the thermal balance test. Considering the above parts, a ground test-simulated TMM was constructed, which can be seen in Figure 3.
Figure 3.
Thermal Mathematical Model of half-deployed reflector antenna for ground test simulation; (a) half-deployed reflector antenna CAD model; (b) half-deployed reflector antenna TMM; (c) top view of main reflectors TMM.
The TMM for simulating the ground test was partially deployed as shown in Figure 3. The reflector antenna was partially deployed in the actual thermal balance test because it is impossible to install it inside the thermal vacuum chamber when fully deployed. The TMM for simulating the ground test was also applied in the same deployed state to fully mimic the ground test as expressed.
The relatively red parts in Figure 3c are where the patch heaters are attached to the main reflector. Considering the power supply at the test site and the allowable temperature range of each component, patch heaters were installed on only 3 of the total 24 main reflectors. Therefore, all conditions were applied in the same way as in the actual thermal balance test, which will be dealt with in more detail in Section 2.3.
Table 1 shows the in-plane heat conduction diagram for the main reflector and baseplate made of sandwich composite material. Due to the characteristics of TMM, it is difficult to realize modeling of a sandwich shape made of a composite sheet and a honeycomb core composite sheet, so modeling was performed before and after the composite sheet, and the thermal conductivity in the out-plane direction was input as a physical property under the contact condition.
Table 1.
Thermo-physical properties for ground test simulation.
Table 1 confirms the thermo-physical properties applied to the simulated TMM for the ground test. Table 2 confirms the optical properties, and Table 3 confirms the contact condition.
Table 2.
Optical properties for ground test simulation.
Table 3.
Contact condition for ground test simulation.
Among the values confirmed in Table 1 and Table 3, the items marked as correlation targets are highly likely to have inaccurate theoretical values as mentioned above, and are values calculated using temperature data obtained by performing a thermal balance test.
In addition, when launching an actual reflector antenna, such as the strut and frame, parts that apply MLI to be protected from the environment were also subjected to MLI in the thermal balance test. Therefore, in the TMM, the MLI value was applied to the optical properties. Therefore, as shown in Table 2, the optical properties are broadly divided into three categories: metal parts surface-treated with alodine, composite surfaces, and parts wrapped with MLI.
2.3. Thermal Balance Test
This section presents the thermal balance test. The thermal balance test of the deployable reflector antenna was conducted in the Dirty Thermal Vacuum Chamber at the Korea Institute of Civil Engineering and Building Technology (KICT). The chamber is a lunar surface environment simulator designed for various tests related to construction activities on the lunar surface. Since the thermal balance test at the STM phase does not impose cleanliness requirements on the test facility, this equipment was selected.
The chamber can achieve a vacuum level below 1 × 10⁻⁶ mbar without a test article. It operates with one set of dry and booster pumps (4800 m3/h), two turbo pumps (N2, 2100 L/s), and two cryo pumps (N2, 28,000 L/s; H2O, 43,000 L/s). The vacuum pressure is measured using an MKS Baratron Gauge 627F (MKS Instruments, Inc., Andover, MA, USA) (1000–0.001 Torr) and a Pfeiffer PKR 251 (Pfeiffer Vacuum Technology AG, Aßlar, Germany) (below 0.001 Torr). In addition, by injecting liquid nitrogen into the shroud, the shroud surface temperature can be maintained below −180 °C. The temperature is measured using 240 channels of T-type thermocouples (Hioki LR8450 logger (Hioki E.E. Corporation, Nagano, Japan) with U8552) [].
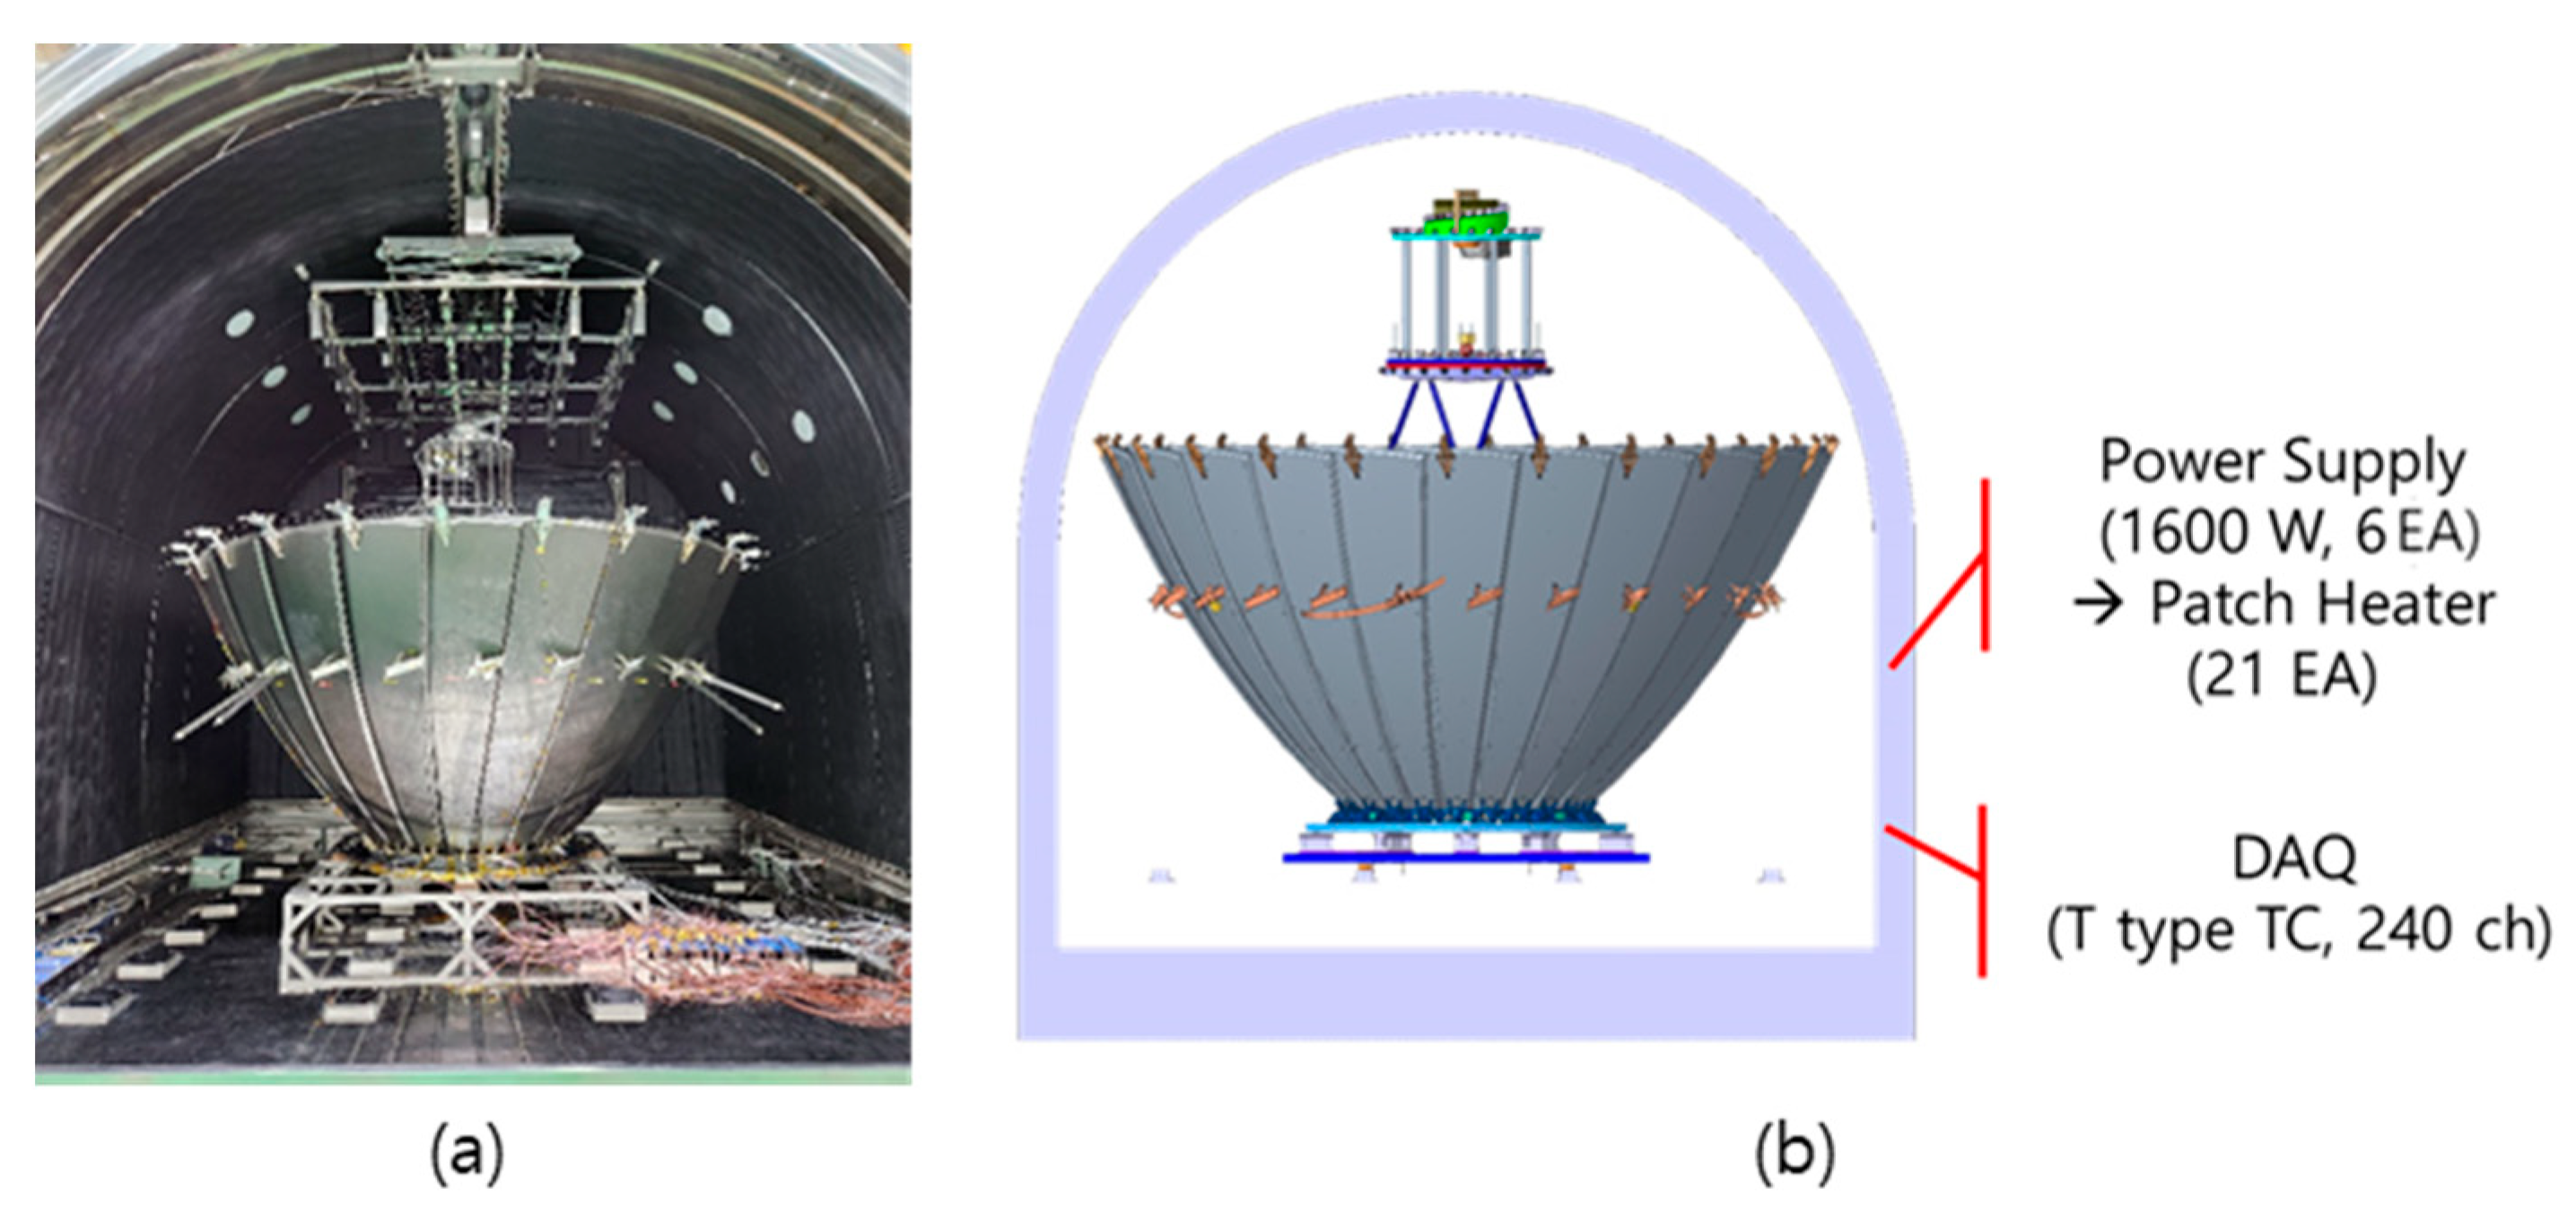
In Figure 4, the installation of the thermal balance test is completed. The thermal balance test is an experiment to evaluate the process of the reflector antenna reaching thermal equilibrium in the space environment and to secure temperature data for building a reliable thermal analysis model. During the thermal balance test, the reflector antenna must reach thermal equilibrium, a state in which all components in the system reach the same heat flow and no further thermal changes occur.
Figure 4.
Thermal balance test installation; (a) thermal balance test installation real photography; (b) thermal balance test installation and electrical configuration for thermal balance test.
In addition, as shown in Figure 4b, a total of 21 patch heaters were used, and six 1600 W power supplies were used to operate the patch heaters. A DAQ (Data Acquisition) with 240 channels was used to collect data from 178 thermocouples.
In the actual test, temperature changes are measured using temperature sensors at each point on the reflector, and it is considered that thermal equilibrium has been reached when the temperature no longer fluctuates within a certain range. In addition, while the test is in progress, the shroud temperature must always be maintained below −180 °C, and the vacuum in the chamber must be maintained at 10−5 mbar. These test conditions can be found in Table 4. This test will allow us to evaluate whether the reflector can operate stably in the thermal environment it may experience in orbit.
Table 4.
Test condition for thermal balance test.
The thermal balance test was performed using the STM described above. In the case of the reflector antenna used in the thermal balance test, the parts to which MLI was applied were protected from the orbit environment as in the actual FM. As described above, the reflector antenna was installed in a partially deployed state considering the volume inside the thermal vacuum chamber. Also, an antenna deployment device was installed to maintain the partially deployed state. The patch heater was attached to the reflecting surface rather than the outer surface of the main reflector considering adhesion. The thermal vacuum chamber can simulate vacuum conditions and extreme temperature conditions similar to those in orbit to simulate the orbit environment, providing an environment suitable for duplicating the thermal behavior of the reflector antenna in the actual orbit environment. A test jig with a heat insulating material was used to block heat conduction between the reflector antenna and the inside of the chamber. This blocks the heat path between the bottom surface inside the chamber and the reflector antenna.
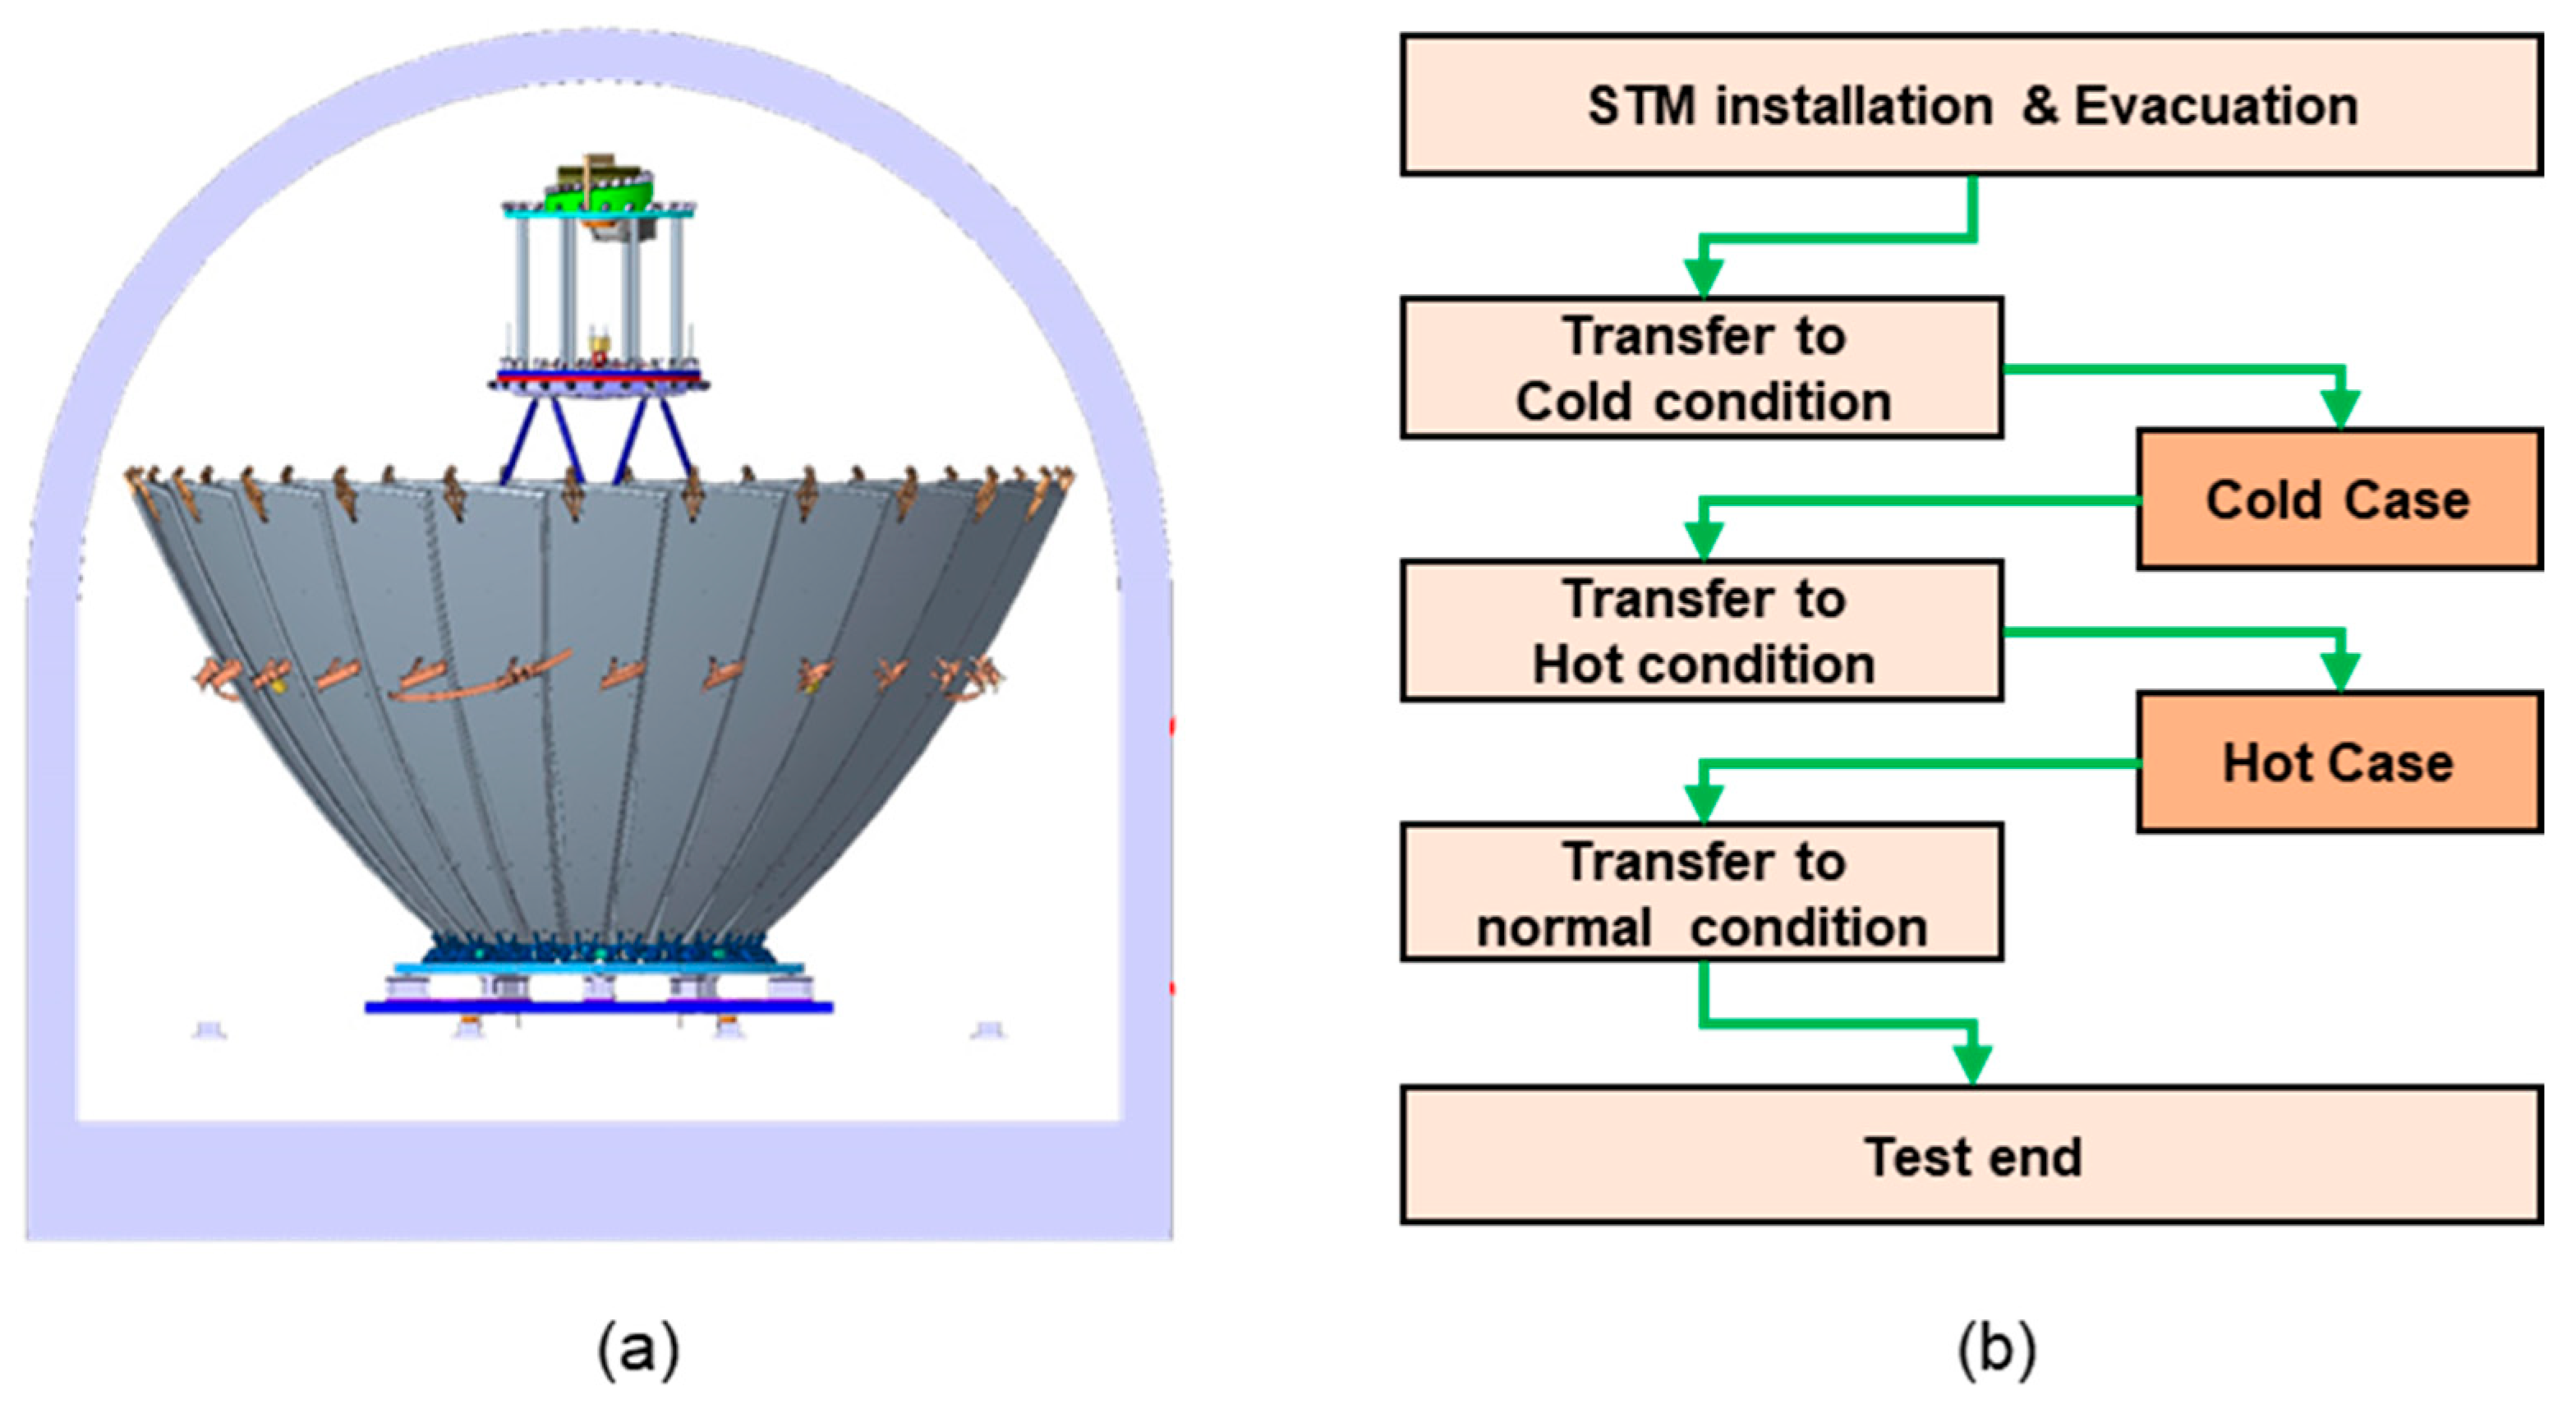
Figure 5 shows the interface between the chamber and the reflector antenna and the test configuration. The thermal balance test is performed for only one cycle in total, so the reflector antenna STM is installed and the cold case begins when the vacuum and shroud temperature reach the specified conditions. After the cold case ends, the hot case begins, and after the hot case, the vacuum and shroud temperature return to normal pressure and temperature. Thus, the thermal balance test ends.
Figure 5.
Thermal balance test configuration: (a) Thermal balance test interface to vacuum chamber; (b) thermal balance test configuration.
Figure 6 shows the pressure in the chamber and the shroud temperature during the entire test period [].
Figure 6.
Vacuum chamber condition during the thermal balance test; (a) chamber pressure condition; (b) chamber temperature condition.
In Figure 6a,b, there are sections where the pressure and temperature drop simultaneously. This section was for the test setup, and the cold case was performed when the pressure and temperature reached the specified conditions. After the cold case was performed, the slew was stopped for the weekend, and the pressure equipment was operated continuously. In addition, the heater temperature in the hot case was higher than that in the cold case, and thermal equilibrium was reached in a relatively short time.
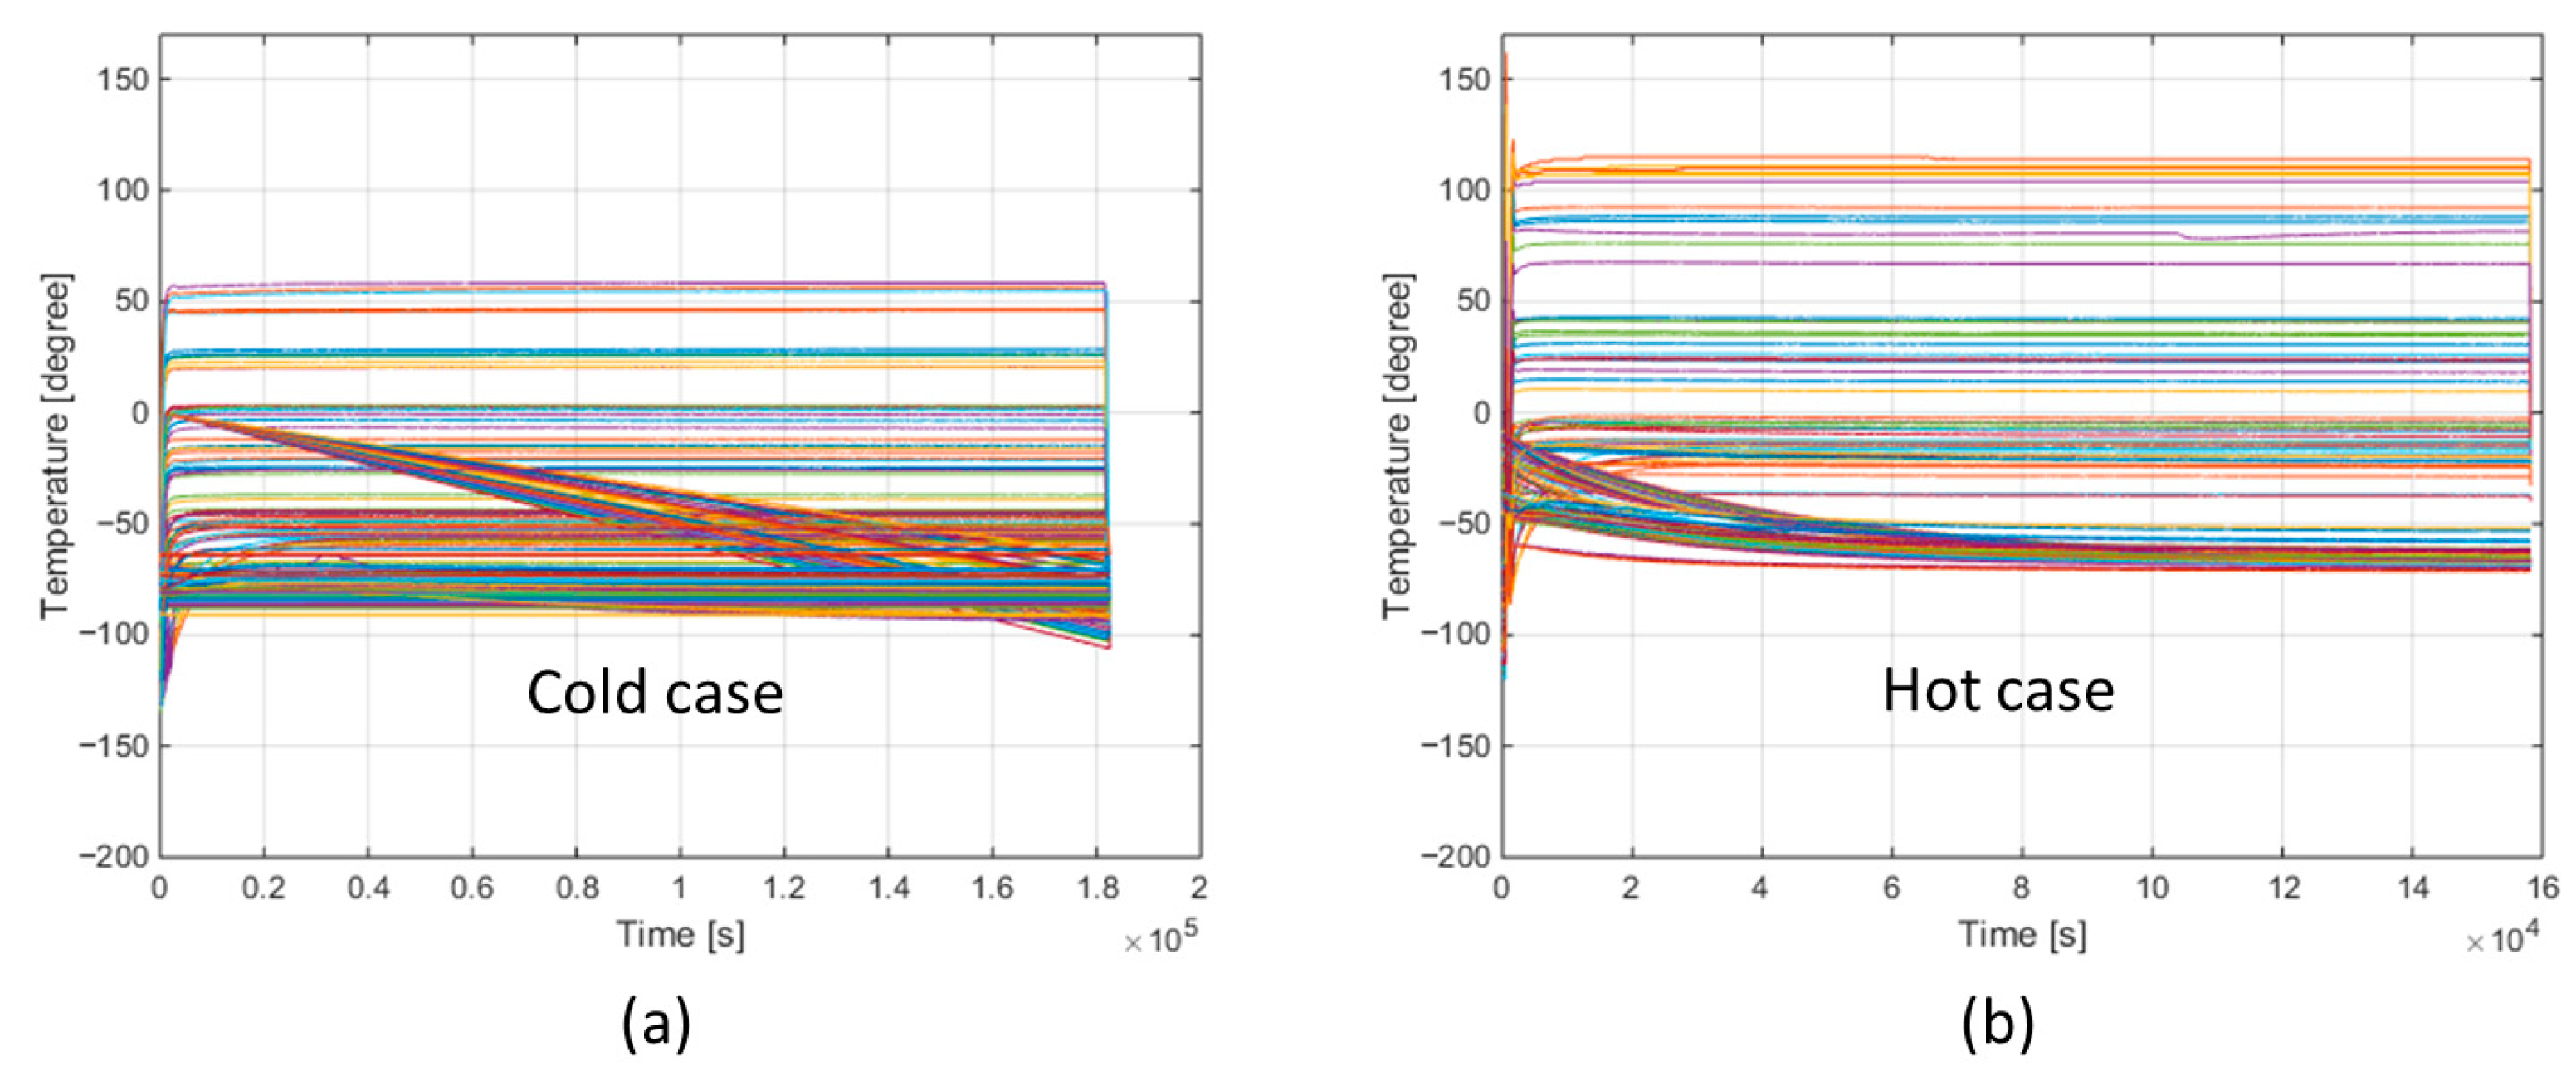
Through initial interpretation, the heater output for the hot case was determined taking into account the operating temperature of each component. In the hot case, 1.25 W/in2 was applied to each heater, and in the cold case, 0.5 W/in2 was applied to each heater to set the difference from the hot case. In Figure 7, the temperature of each temperature sensor rose rapidly due to the heater output applied in this way, but it can be seen that the thermal equilibrium was reached in about 50 h in the cold case and about 45 h in the hot case.
Figure 7.
Thermal balance test result; temperature history in (a) cold case and (b) hot case.
3. Thermal Mathematical Model Correlation and Thermal Analysis Assumed Orbital Environment
The TMM was corrected using the temperatures at the main positions of each part obtained as a result of the thermal balance test. The corrected TMM was analyzed to validate the heat transfer coefficients of the contact points between parts and the thermal properties of parts made of composite materials. This is used in the thermal analysis, and the input data corrected in this way increases the reliability of the thermal analysis-assumed orbital environment.
Thermal model correction is the process of improving the accuracy of the numerical analysis model by utilizing data obtained from experiments. By reflecting the test data in the model, it becomes possible to more accurately predict the thermal behavior of the reflector antenna in a real environment.
3.1. Thermal Mathematical Model Correlation
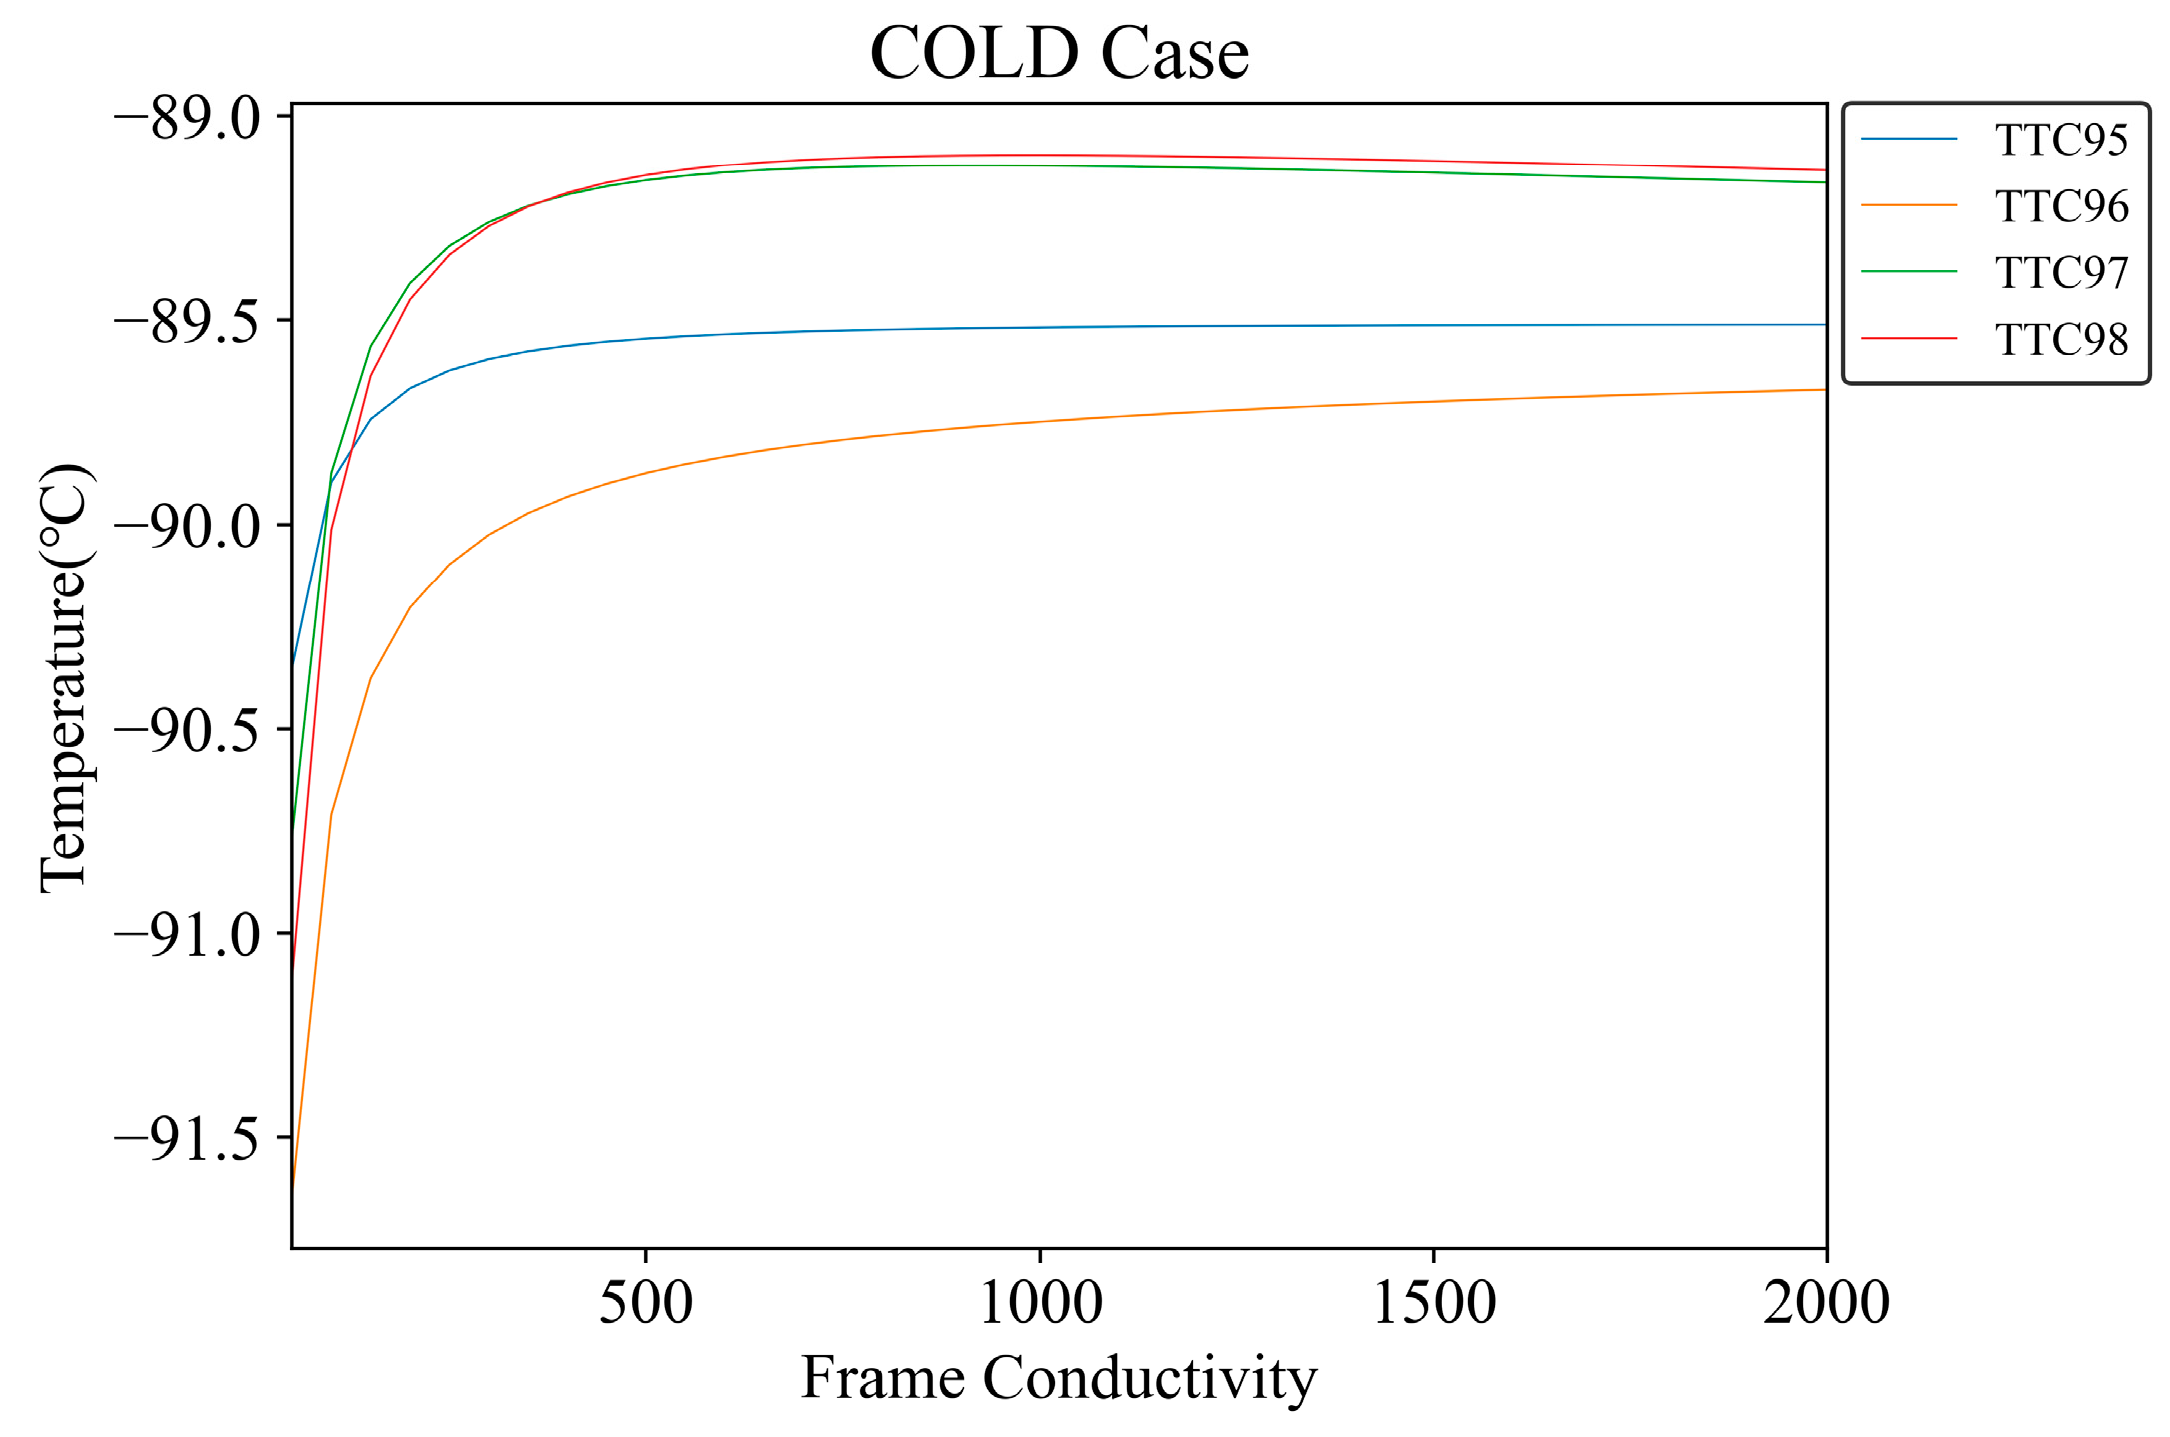
We first tried to determine the properties of the composite material by correcting the TMM constructed in Section 2.2. However, parts made of composite materials such as frames and struts showed that the conductivity value, which is the correlation target, converged to a certain level, making accurate correction difficult. This can be seen in Figure 8.
Figure 8.
Frame conductivity–thermal coupler temperature ratio at cold case.
Therefore, we used numerical optimization based on a reduced-order model (ROM) to reduce the computational cost required for model correlation and validate the reliability of the results. Unlike conventional methods that control variables at a common-sense level by the operator’s intuition and perform nearly infinite repeated calculations, model correlation by numerical optimization enables efficient model correlation that guarantees high accuracy. In particular, due to the characteristics of ROM, which extracts main variables and constructs a low-dimensional analytical model, it is very cost effective compared to conventional methodologies for model correlation. This approach enables intelligent sampling and robust data fitting, providing a high-fidelity thermal model. The problem statement for model correlation of a satellite reflector antenna proposed in this study is expressed as follows (1) [].
Here, p and mean the design variables and the objective function, i and j mean the test cases, and and mean the temperature values measured by the thermal balance test at the i test condition or calculated by the thermal analysis at the j measurement position. p and p0 mean the variables used in the optimization and the normalization coefficient, which is the initial condition, which is the variable value at the first initialization of the optimization process. Therefore, the first term of the objective function means the error of the thermal analysis and the thermal balance test that substitutes the temperature values at all test conditions and all positions, and the second term is used as a normalization term to prevent overfitting in the model correlation process and validate physical reliability. The first equation of the constraint is a mathematical expression to specify the range of the design variables, so that the material properties have physically possible values, and the second equation is a mathematical expression to limit the allowable temperature difference between the thermal analysis model and the thermal balance test result and is assigned to the requirements during the design of many satellites and payloads. By using the problem statement of the model correlation proposed in this chapter, we can construct a thermal analysis with physically reasonable properties that satisfies the system requirements of the model while taking into account all temperature reference points in the hot balance condition and cold balance condition.
Table 5 shows the variables used for model correlation and the boundary conditions for each variable. In this study, the thermophysical properties of each component and the thermal damping coefficient between each element are used as design variables, and boundary conditions were set so that each property value has a physically meaningful value. Table 5 and Table 6 present the initial value, final value, and bounded condition of each design variable expressed as coefficients and its ratios. For each cold and hot case in which thermal balance tests were performed, a thermal analysis model was constructed using the initial value corresponding to each design variable, and then an initial thermal analysis was performed. By using Veritrek v4.2, a thermal analysis model that minimizes the temperature difference with the experimental value can be constructed. As a result of parameter optimization, the following final values for the cold and hot cases were derived.
Table 5.
Thermo-physical properties of each component in the deployable reflector antenna.
Table 6.
Heat conduction coefficient between each component in the deployable reflector antenna.
Veritrek’s ROM-based automatic correlation allowed us to derive the thermo-physical properties and heat conduction coefficients in Table 5 and Table 6, and the temperature difference between the analytical model and the test temperature was less than 3 degrees, meeting the system requirements.
These corrected results can be seen as the coefficient and its ratios in Table 7 and Table 8. In Table 7, the thermo-physical properties of the sandwich panel, an anisotropic material consisting of a composite material and a honeycomb core, are confirmed for each case. In Table 8, the contact area of each part contains a composite material, and the contact area where the reliability of the theoretical value decreases is selected as the correlation target, and the results are displayed. This is used as input data for the thermal analysis-assumed orbital environment.
Table 7.
Thermo-physical properties of sandwich panel for TMM after correlation.
Table 8.
Contact condition for TMM after correlation.
3.2. Thermal Analysis-Assumed Orbital Environment
In thermal analysis-assumed orbital environment, both test and analysis results have been used so far. Ground test A thermal balance test standard was selected through simulated thermal analysis, and a thermal balance test was conducted based on this. In the thermal balance test, approximately 178 temperature sensors were used to analyze the temperature of each component. From these correlation results, the thermo-physical properties of the composite material in the form of a sandwich panel and the contact conditions for the contact points between the composite material and other parts were validated. The physical properties and data thus validated are used in thermal analysis-assumed orbital environment, which can be seen in Table 9, Table 10 and Table 11. Table 9 shows the thermo-physical properties used in the thermal analysis-assumed orbital environment, Table 10 shows the conductivity of the MLI for each temperature range, and Table 11 shows the optical properties used in the thermal analysis-assumed orbital environment.
Table 9.
Thermo-physical properties for thermal analysis.
Table 10.
Conductivity of MLI at various temperatures.
Table 11.
Optical properties for thermal analysis.
There are some peculiarities in Table 9. It is marked as (a), (b), and (c).
(a) For the main reflector and baseplate, front/back shell elements and front/back thermal contacts were implemented for anisotropic thermal properties. Plane direction conductivity was calculated as the thermal conductivity (k) of the front/back shell elements, and vertical direction conductivity was calculated as the thermal conductance (h) between the front and back surfaces. The values can be seen in the table above, which is the correction result.
(b) The main reflector is a sandwich panel consisting of a sheet with a density of 1700 kg/m3 and a specific heat of 830 J/kg °C and a honeycomb core with a density of 28 kg/m3 and a specific heat of 1420 J/kg °C. The density of the assembled panel is a maximum of 1700 kg/m3 to a minimum of 28 kg/m3, and the specific heat is a minimum of 830 J/kg °C to a maximum of 1420 J/kg °C. The product of specific heat and density is the heat capacity per unit volume, and since the smaller the heat capacity per unit volume in the thermal analysis-assumed orbital environment, the lower the minimum temperature and the higher the maximum temperature, it was determined that the density and specific heat of the main reflector can be assumed as the worst case to increase the effectiveness of the analysis. Therefore, the density and specific heat of the main reflector and baseplate, which are sandwich composite panels, were applied as shown in the table above.
(c) is the thermal conductivity by temperature of the MLI, which can be confirmed in detail in Table 10.
In Figure 9, the orbital conditions of the thermal analysis are visually confirmed. The orbit was selected as the orbit that is most likely to carry out the actual mission if the reflector antenna introduced in this study is manufactured by FM. In addition, the satellite body was also modeled on a satellite body that is most likely to carry a reflector antenna.
Figure 9.
Figure of thermal analysis-assumed orbital environment; (a) worst cold case of thermal analysis; (b) worst hot case of thermal analysis.
In Figure 9a, the worst cold case is confirmed. This assumes the moment when the satellite body is farthest from the sun and has not performed a mission for the longest time, and the solar panels are carrying the sun on their backs to store the maximum amount of energy. Figure 9b is the worst hot case, which assumes the moment when the satellite receives sunlight at a position close to the sun and simultaneously executes the mission, and the solar panels are lighting up the sun, but the satellite starts up at the target point and looks at the mission area.
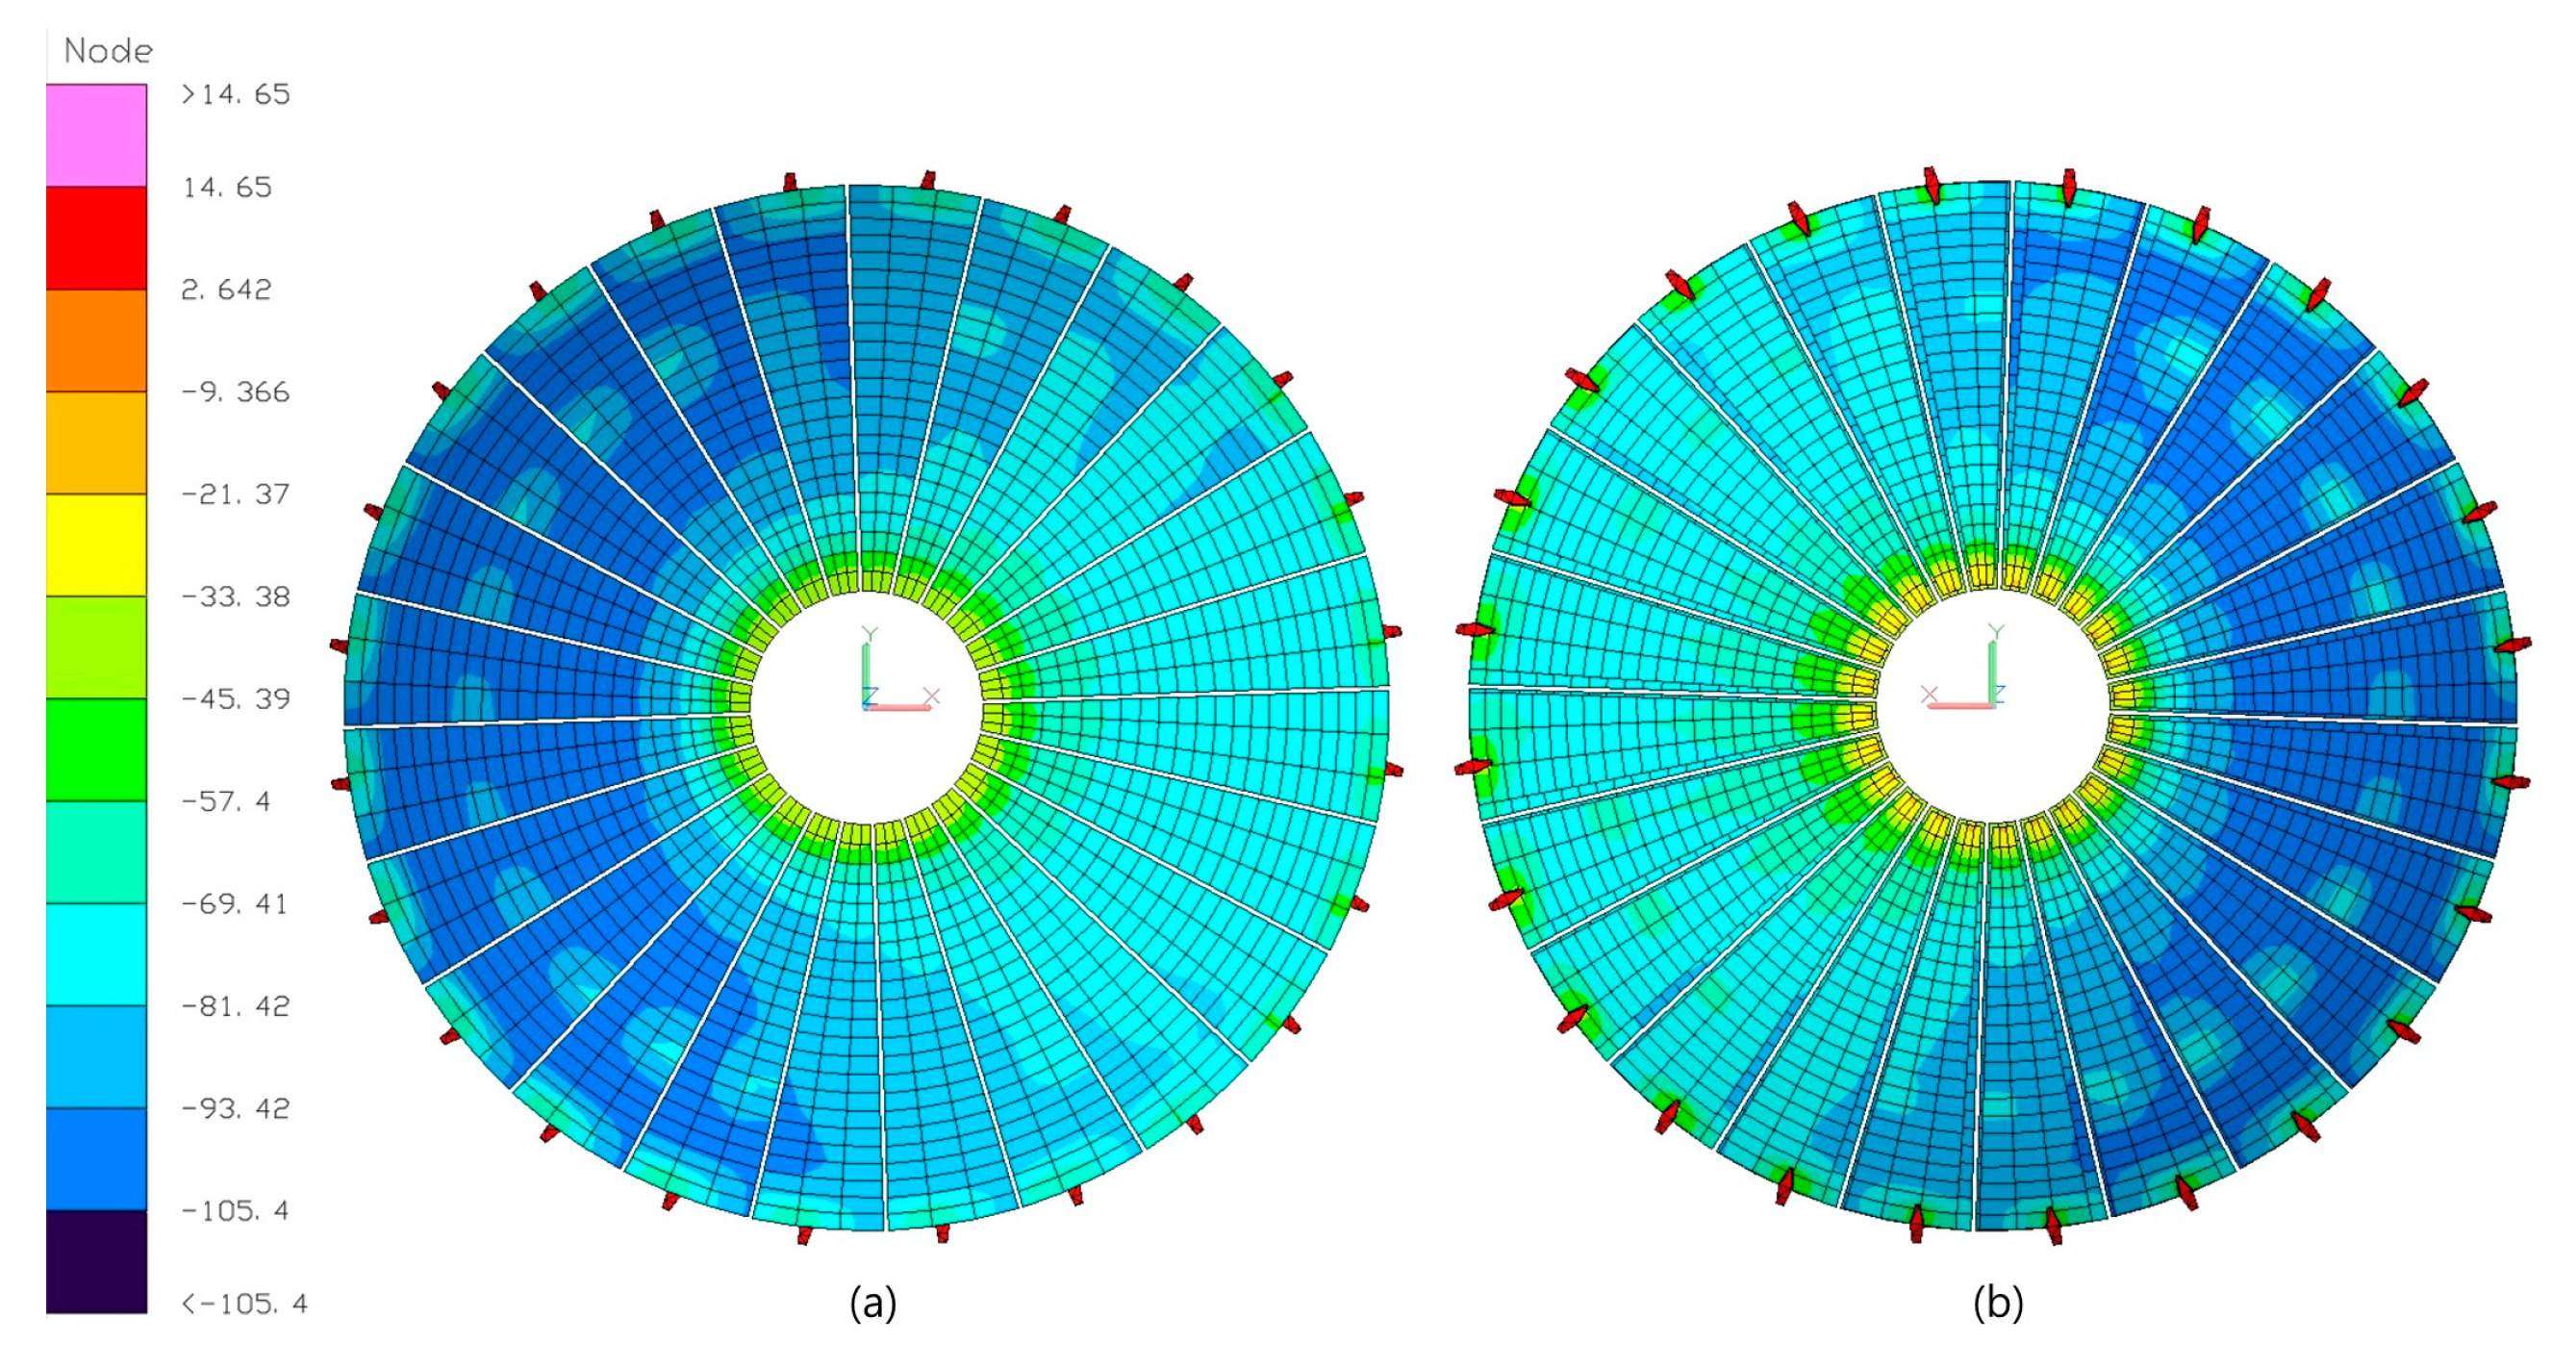
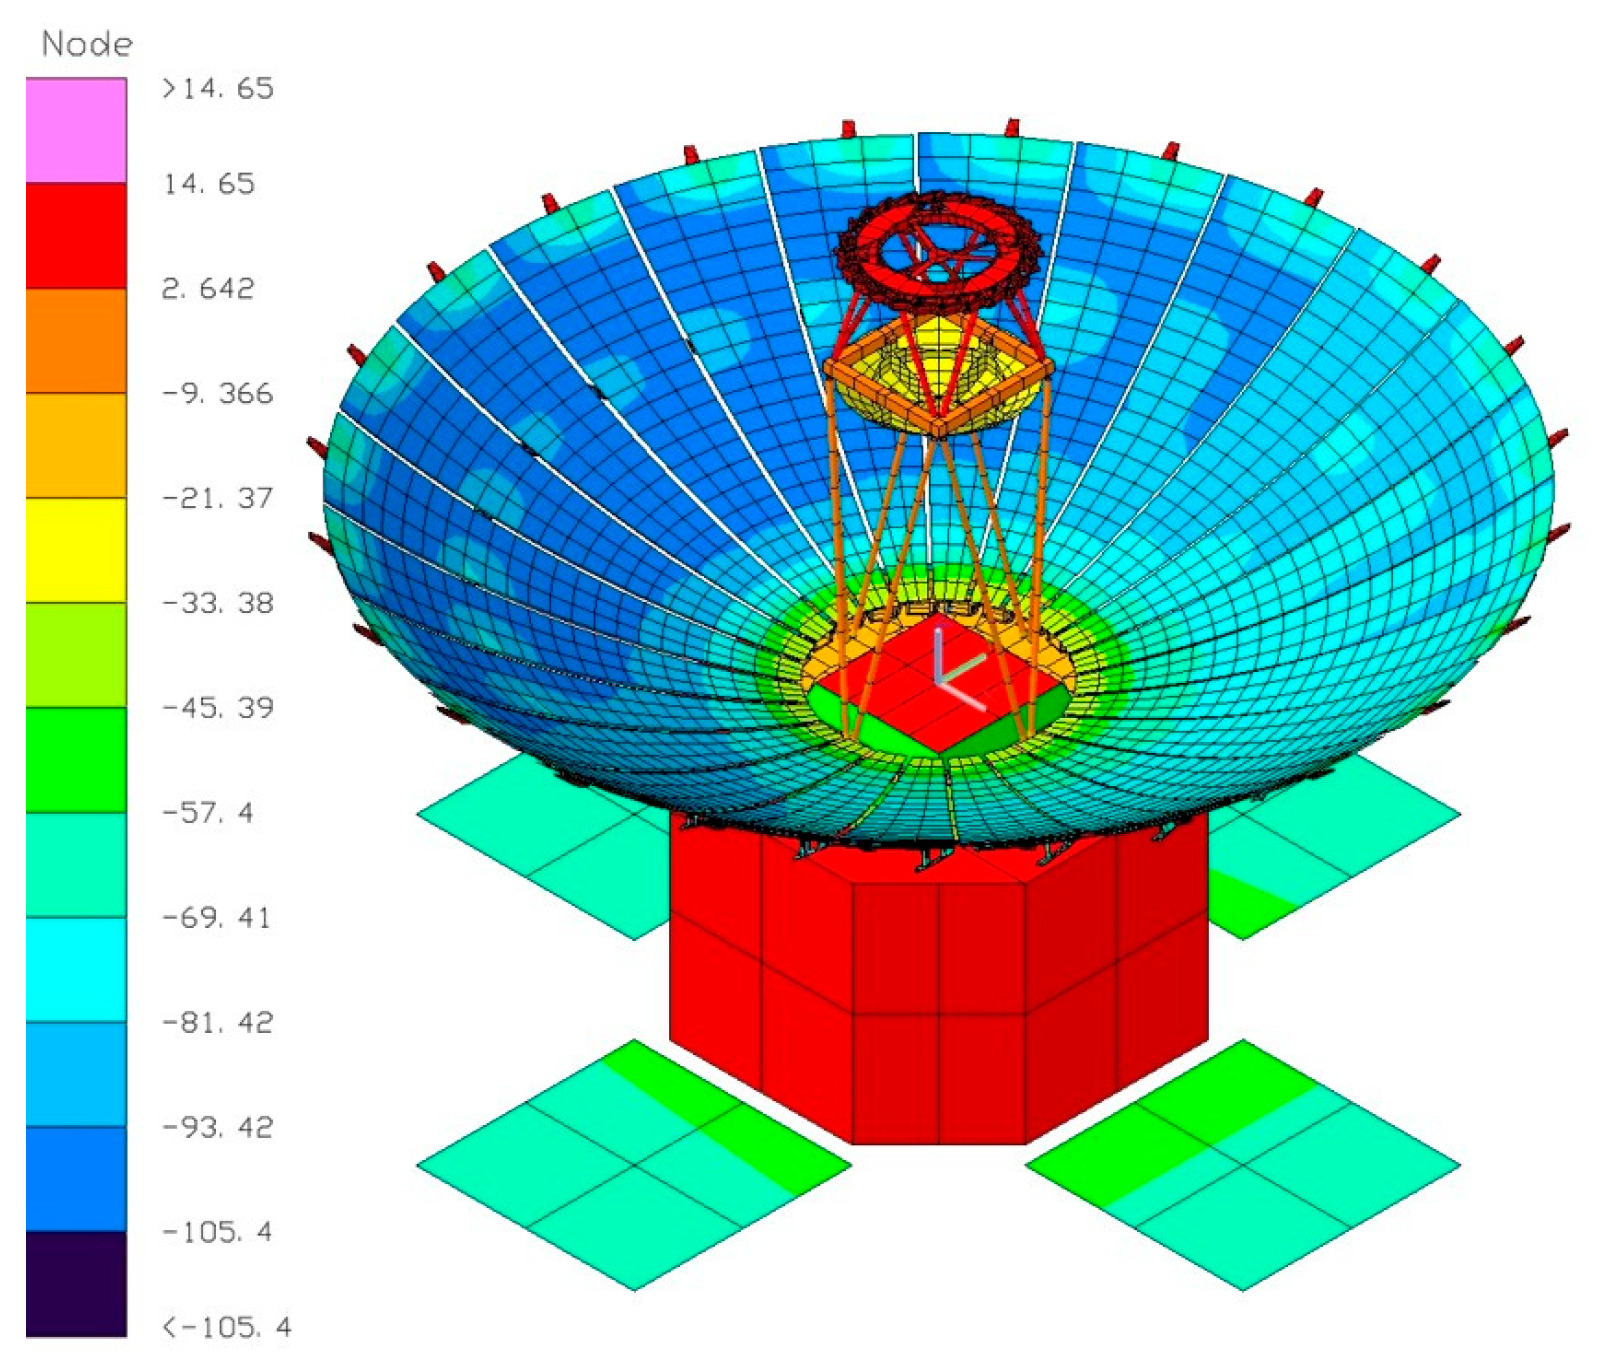
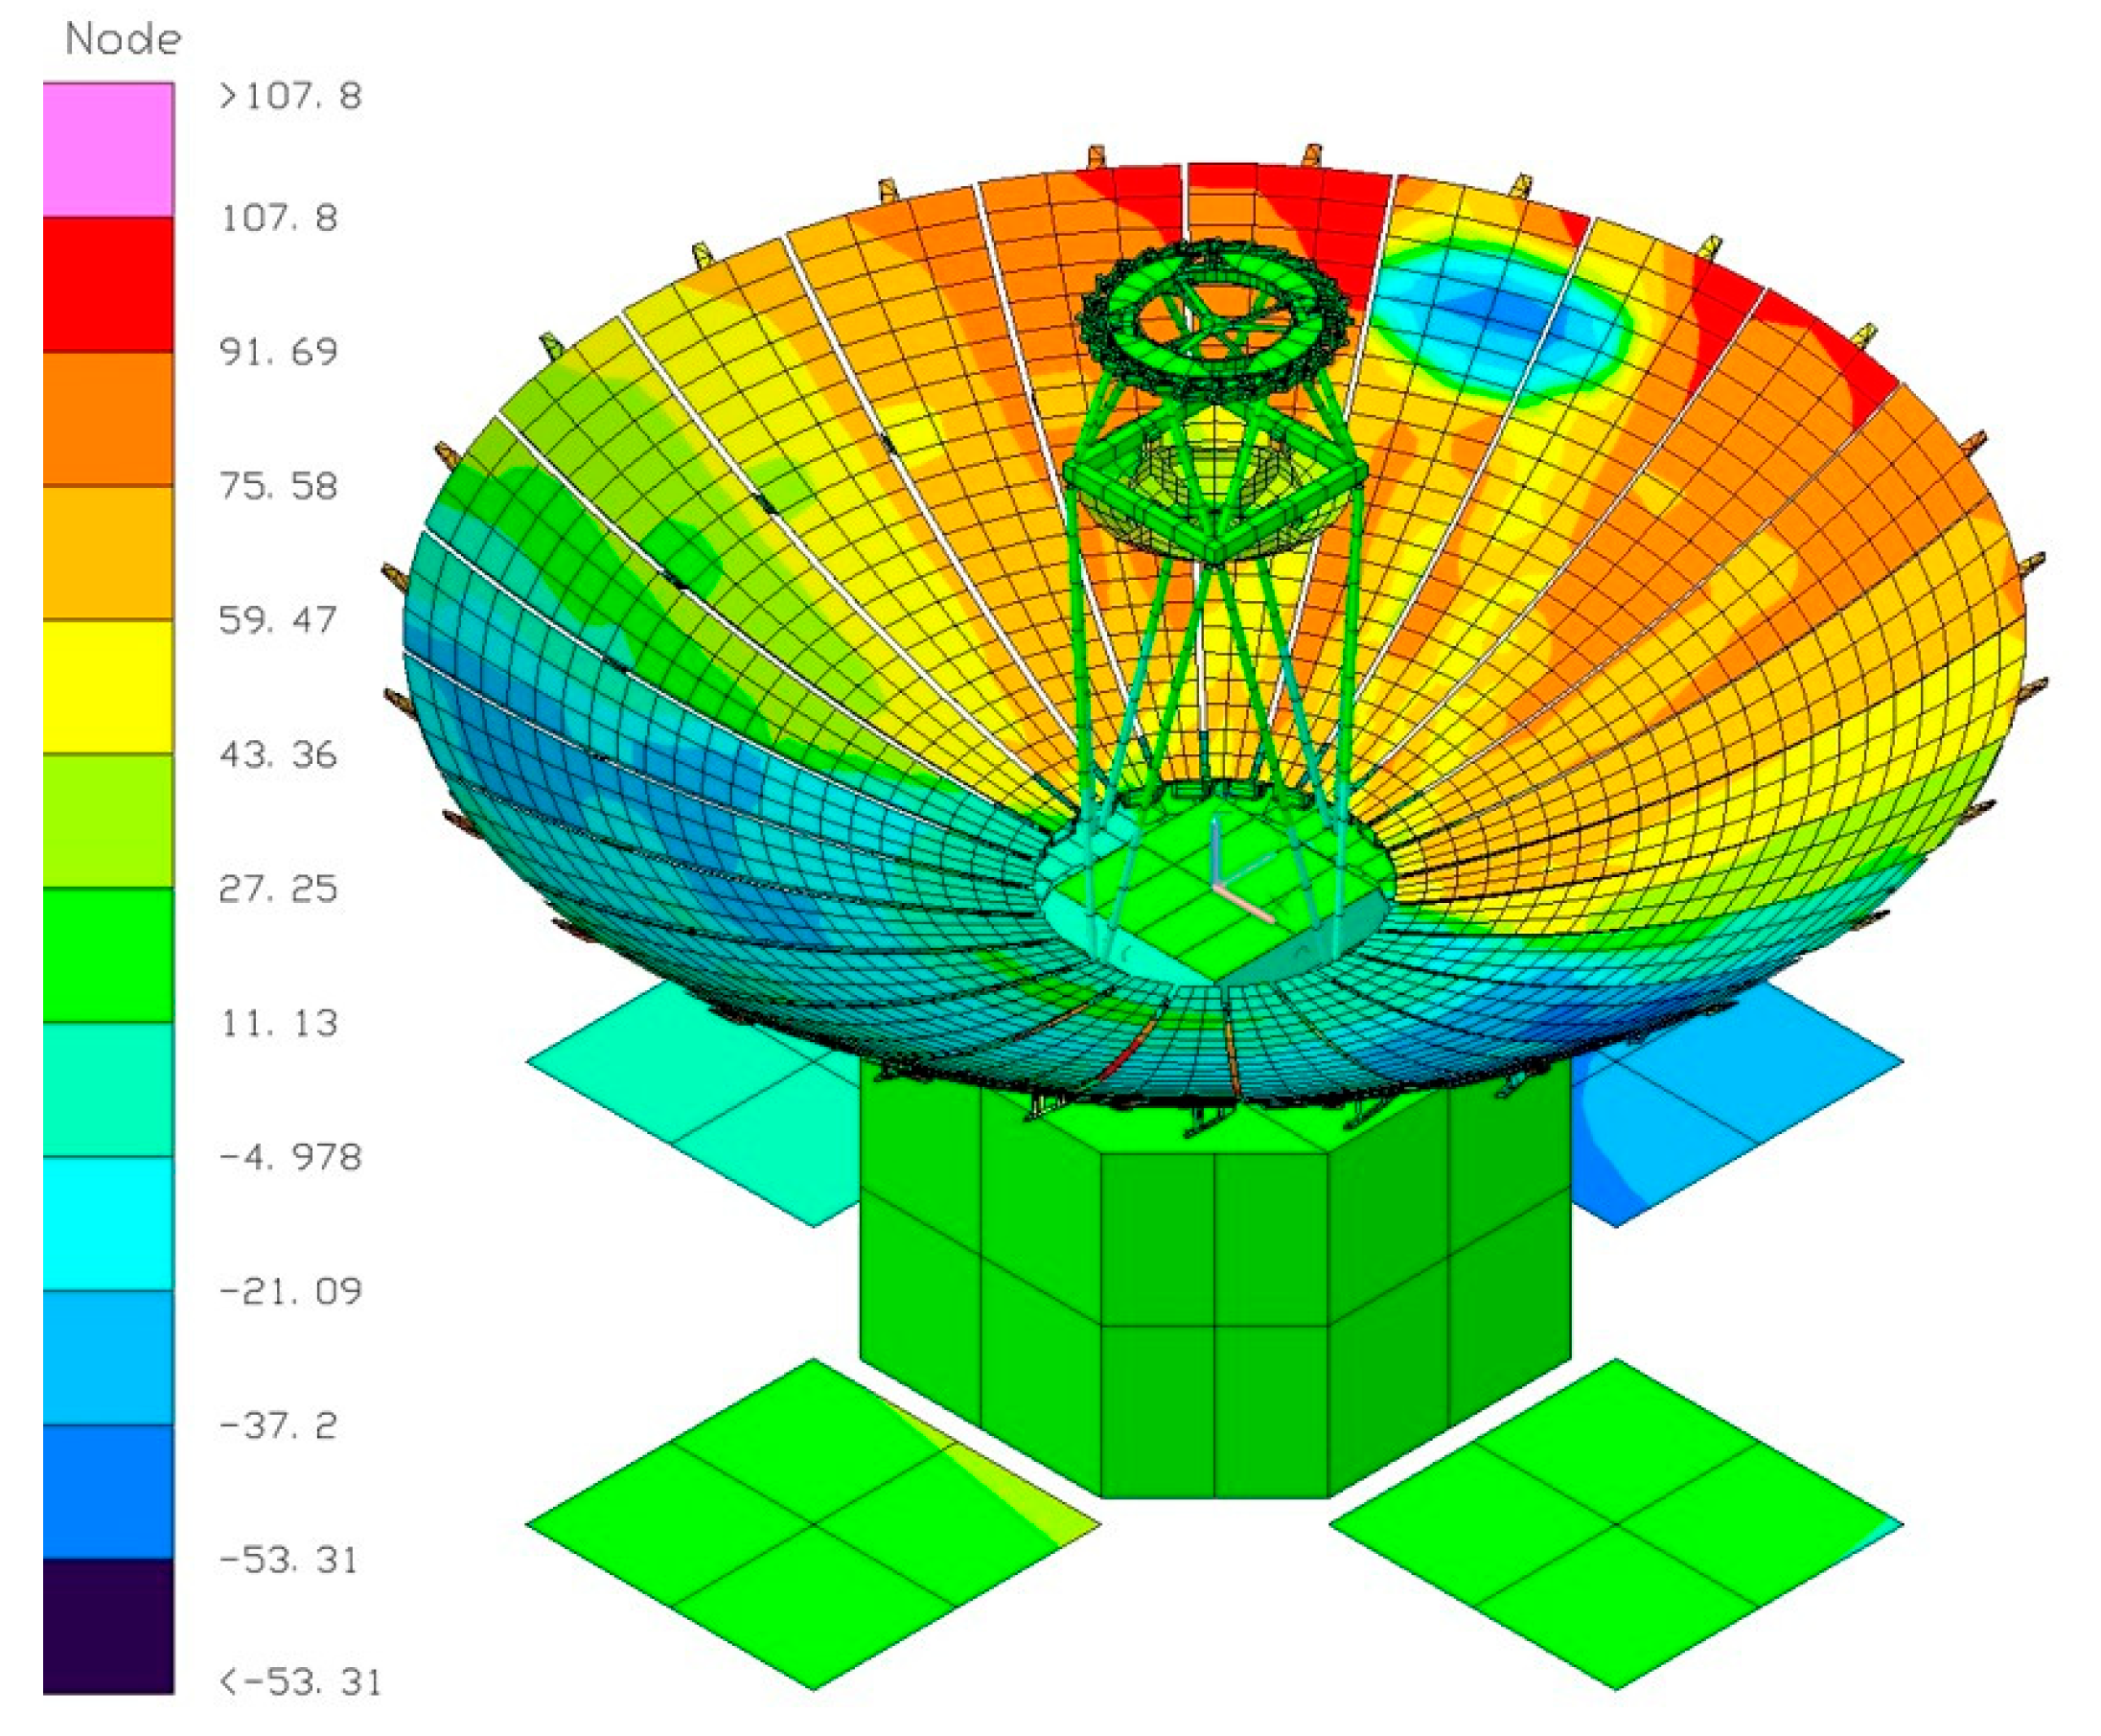
The results of the worst cold case during the thermal analysis performed in this way are shown in Figure 10, Figure 11 and Figure 12. Figure 10 shows the temperature distribution of the deployable reflector antenna in the worst cold case. Figure 11 shows the temperature distribution of the satellite and the deployable reflector antenna in the worst cold case, specifying the satellite BUS as the boundary condition. The resulting temperature distributions are listed under “Predict temperature” in Table 12 for each component. If a component’s predicted temperature falls within the minimum–maximum range indicated for the operating temperature, it is marked as Pass.
Figure 10.
Result of thermal analysis-assumed orbital environment at worst cold case; (a) top view of thermal analysis at worst cold case; (b) bottom view of thermal analysis at worst cold case.
Figure 11.
ISO view of thermal analysis-assumed orbital environment at worst cold case.
Figure 12.
Result of thermal analysis-assumed orbital environment at worst hot case; (a) top view of thermal analysis at worst hot case; (b) bottom view of thermal analysis at worst hot case.
Table 12.
Result of temperature analysis at worst cold case.
The results of the worst hot case during the thermal analysis are shown in Figure 12 and Figure 13 and Table 13. Figure 12 shows the temperature distribution of the deployable reflector antenna in the worst hot case. Figure 13 shows the temperature distribution of the satellite and the deployable reflector antenna in the worst hot case, with the satellite BUS specified as the boundary condition. The resulting temperature distributions are listed under “Predict temperature” in Table 13 for each component. If a component’s predicted temperature falls within the minimum–maximum range indicated for the operating temperature, it is marked as Pass.
Figure 13.
ISO view of thermal analysis-assumed orbital environment at worst hot case.
Table 13.
Result of temperature analysis at worst hot case.
4. Conclusions
In this study, a thermal balance test and thermal analysis-assumed orbital environment were performed on the deployable reflector antenna, which is the core payload of the SAR satellite. Before conducting the thermal balance test, a TMM was constructed to calculate the thermal balance test standard and select the test configuration, and the thermal balance test was performed using the corresponding TMM initial analysis results. By conducting the thermal balance test, the thermal stability of each component under hot temperature conditions was confirmed, and temperature data was obtained. The thermal balance test was performed and visual inspection was performed to confirm whether there was any damage before and after the test. In addition, a deployment test was performed before and after the thermal balance test, and it was confirmed that there were no functional problems with the deployable reflector antenna before and after the thermal test.
The temperature data obtained from the thermal balance test were utilized to correlate the TMM. For sandwich composite materials exhibiting anisotropic thermal conductivity between the in-plane and out-plane directions, additional temperature sensors were installed during the thermal balance test to acquire more detailed correction data.
To enhance the reliability of the TMM correlation and reduce computational cost, a modeling correlation method based on numerical optimization was applied. Compared to conventional approaches, this method maintained high accuracy while significantly reducing the time required for correlation. Whereas traditional methods often experience exponential increases in correlation time depending on the number of parameters involved, the proposed approach enabled completion of the correlation process with only one or two additional simulation iterations [].
Finally, the thermo-physical properties of each component, derived from the correlation process, were applied to the thermal analysis-assumed orbital environment, resulting in more reliable simulation outcomes.
The series of processes carried out in this way evaluated the soundness of the satellite and main payload against the thermal load as mentioned above and confirmed the temperature margin of each component. In addition, the temperature distribution as a result of the thermal analysis-assumed orbital environment will be used to analyze the thermal deformation of the antenna and satellite and the pointing error caused by the thermal deformation.
Author Contributions
Conceptualization, K.-R.K.; methodology, R.-H.D.; software, H.-G.K. and R.-H.D.; validation, R.-H.D. and H.-G.K.; formal analysis, D.-G.K.; investigation, R.-H.D.; resources, K.-R.K.; data curation, H.-G.K.; writing—original draft preparation, R.-H.D.; writing—review and editing, H.-G.K.; visualization, R.-H.D.; supervision, K.-R.K.; project administration, K.-R.K.; funding acquisition, K.-R.K. All authors have read and agreed to the published version of the manuscript.
Funding
This study was conducted with support from the Korea Research Institute for defense Technology planning and advancement and the Defense Acquisition Program Administration in 2021 (20-207-B00-011-001).
Data Availability Statement
All data are in the paper; There are no additional data.
Conflicts of Interest
The authors declare no conflicts of interest.
References
- Moreira, A.; Prats-Iraola, P.; Younis, M.; Krieger, G.; Hajnsek, I.; Papathanassiou, K.P. A tutorial on synthetic aperture radar. IEEE Geosci. Remote Sens. Mag. 2013, 1, 6–43. [Google Scholar] [CrossRef]
- Singh, P.; Diwakar, M.; Shankar, A.; Shree, R.; Kumar, M. A Review on SAR Image and its Despeckling. Arch. Comput. Methods Eng. 2021, 28, 4633–4653. [Google Scholar] [CrossRef]
- Castelletti, D.; Farquharson, G.; Stringham, C.; Duersch, M.; Eddy, D. Capella Space First Operational SAR Satellite. In Proceedings of the 2021 IEEE International Geoscience and Remote Sensing Symposium IGARSS, Brussels, Belgium, 11–16 July 2021; IEEE: Brussels, Belgium, 2021. [Google Scholar]
- Wijker, J. Random Vibrations in Spacecraft Structures Design: Theory and Applications; Springer Science & Business Media: Berlin/Heidelberg, Germany, 2009; Volume 165. [Google Scholar]
- ECSS-E-ST-10-03C; ECSS Standard: Testing (31 May 2022). European Consortium for Space Standards: Noordwijk, The Netherlands, 2022. Available online: https://ecss.nl/standard/ecss-e-st-10-03c-rev-1-testing-31-may-2022/ (accessed on 30 July 2023).
- Howard, E.M. Faster, Better, Cheaper: Low-Cost Innovation in the U.S. Space Program; The Johns Hopkins University Press: Baltimore, MD, USA, 2003. [Google Scholar]
- Kim, H.; Kim, D.G.; Do, R.H.; Koo, K.R.; Yu, Y. Development of Deployable Reflector Antenna for the SAR-Satellite: Part 1. Design and Analysis of the Main Reflector Using Honeycomb Sandwich Composite Structure. Appl. Sci. 2024, 14, 1590. [Google Scholar] [CrossRef]
- Kim, D.G.; Kim, H.; Kim, D.Y.; Do, R.H.; Koo, K.R.; Yu, Y. Development of a Deployable Reflector Antenna for the Synthetic Aperture Radar Satellite, Part 2: Manufacturing and Qualification of the Main Reflector Using a Honeycomb Sandwich Composite Structure. Appl. Sci. 2024, 14, 11273. [Google Scholar] [CrossRef]
- Kim, H.; Kim, D.G.; Do, R.H.; Koo, K.R.; Yu, Y. Development of Deployable Reflector Antenna for the SAR-Satellite, Part 3: Environmental Test of Structural-Thermal Model. Appl. Sci. 2025, 15, 1436. [Google Scholar] [CrossRef]
- Hengeveld, D.; Moulton, J.; Tobin, D.; Vasas, R.; Nelson, E.; Liu, A.; Peabody, H. Reduced-order modeling for spacecraft thermal-structural applications. In Proceedings of the International Conference on Environmental Systems, St. Paul, MN, USA, 10–14 July 2022. No. ICES-2022-110. [Google Scholar]
- Hengeveld, D.; Biskner, A. Enhanced data exploration through Reduced-order models. In Proceedings of the 47th International Conference on Environmental Systems, Charleston, SC, USA, 16–20 July 2017. [Google Scholar]
- Hengeveld, D.; Moulton, J. Automatic creation of reduced-order models using Thermal Desktop. In Proceedings of the 48th International Conference on Environmental Systems, Albuquerque, NM, USA, 8–12 July 2018. [Google Scholar]
- Perellón, M.; Alvarez, R.; Petrini, P.; Sauer, A.; Dolce, S. Sentinel 1–spacecraft and SAR antenna thermal design, analysis, verification and flight performances. In Proceedings of the 45th International Conference on Environmental Systems (ICES), Bellevue, WA, USA, 12–16 July 2015. [Google Scholar]
- Park, T.Y.; Kim, S.Y.; Jung, H.Y.; Lee, J.E.; Yun, J.H.; Oh, H.U. Thermal design and analysis of unfurlable CFRP skin-based parabolic reflector for spaceborne SAR antenna. Int. J. Aeronaut. Space Sci. 2021, 22, 433–444. [Google Scholar] [CrossRef]
- Arora, J.S. Introduction to Optimum Design; Elsevier: Amsterdam, The Netherlands, 2004. [Google Scholar]
Disclaimer/Publisher’s Note: The statements, opinions and data contained in all publications are solely those of the individual author(s) and contributor(s) and not of MDPI and/or the editor(s). MDPI and/or the editor(s) disclaim responsibility for any injury to people or property resulting from any ideas, methods, instructions or products referred to in the content. |
© 2025 by the authors. Licensee MDPI, Basel, Switzerland. This article is an open access article distributed under the terms and conditions of the Creative Commons Attribution (CC BY) license (https://creativecommons.org/licenses/by/4.0/).