Featured Application
This methodology provides a novel and efficient approach for achieving faster wind speed predictions through AI-based procedures, applicable not only to wind energy systems but also to a wide range of related applications. The proposed approach significantly reduces computation time and is expected to enhance the accuracy of predictive maintenance and other operational tasks in the near future.
Abstract
Onshore and offshore wind energy are two of the best options from an environmental point of view. Nevertheless, the volatile and intermittent nature of the wind resource hampers its integration into the power system. Accurate wind speed forecasting facilitates the operation of the electric grid, guaranteeing its stability and safety. However, most existing studies focus on very-short- and short-term time horizons, typically ranging from a few minutes to six hours, and rely exclusively on data measured at the prediction site. In contrast, only a few works address medium-term horizons or incorporate offshore data. Therefore, the main objective of this study is to predict medium-term (24 h ahead) onshore wind speed using the most influential offshore predictors, which are water surface temperature, atmospheric pressure, air temperature, wave direction, and spectral significant height. A new methodology based on twenty-seven machine learning regression models was developed and compared using the root mean squared error (RMSE) as the main evaluation metric. Unlike most existing studies that focus on very-short- or short-term horizons (typically below 6 h), this work addresses the medium-term (24 h ahead) forecast. After hyperparameter tuning, the CatBoost regressor achieved the best performance, with a root mean squared error of 2.06 m/s and a mean absolute error of 1.62 m/s—an improvement of around 40% compared to the simplest regression models. This approach opens new possibilities for wind speed estimation in regions where in situ measurements are not available. This will potentially reduce the cost, time, and environmental impacts derived from onshore wind resource characterisation campaigns. It also serves as a basis for future applications using combined offshore data from several locations.
1. Introduction
Energy plays a crucial role in modern societies, with electricity demand steadily increasing due to ongoing electrification processes. Within this context, wind energy has emerged as one of the most sustainable and promising alternatives, making accurate wind speed forecasting essential for its efficient integration into the power system.
There are many technologies that can be used to produce electricity. At present, the perfect alternative does not exist, since all of them generate some type of negative impact on the environment, if the entire life cycle, from-cradle-to-grave, is considered. Despite this, it is a well-known fact that some renewables exert less pressure on the planet than other technologies, such as large thermal power plants [1]. Both onshore and offshore wind energy are among the most environmentally sustainable alternatives [1]. However, beyond their ecological advantages, the variable and intermittent nature of wind poses major operational challenges for power system stability and economic efficiency. Accurate wind speed forecasting is therefore essential to ensure grid reliability, optimise scheduling and dispatch, and reduce balancing and maintenance costs [2,3,4,5].
Furthermore, wind energy is an inexhaustible source [6], in contrast to fossil fuels. However, wind speed is inherently uncertain, volatile, and non-stationary [6,7,8], affected by factors such as terrain, pressure, temperature, and humidity [5,9,10,11]. These fluctuations hinder the stable integration of wind farms into the power grid. Inaccurate wind forecasts can lead to significant operational and economic consequences—for instance, each 1 m/s deviation in wind speed prediction can alter power output by roughly 10–15%, affecting grid balancing and increasing reserve and maintenance costs [3,12,13,14,15]. Reliable forecasting is therefore essential to ensure system stability, reduce operating expenses, and optimise maintenance planning [9,16]. Given the cubic relationship between wind power and wind speed [12,17], even small prediction errors can amplify production deviations dramatically.
Wind speed forecasting can be achieved with different time horizons. Therefore, in the specialised literature, terms, such as very-short-term, ultra-short-term, short-term, medium-term, long-term or very-long-term forecasting, have arisen [12,16,18,19,20,21,22,23,24,25,26,27,28]. However, there is no unanimity on the temporal scope of each one of these terms. One of the most common temporal categorisations is as follows: ultra-short-term or very-short-term (from seconds to 30 min), short-term (between 30 min and 6 h), medium-term (from 6 h to 24 h), and long-term (from one day upwards) [12,21,22,24]. In this study, the medium-term horizon is specifically defined as 24 h, corresponding to the forecasting time adopted in the proposed methodology.
On the other hand, different methodologies can be used for wind speed prediction. One option is the physical approach, in particular, numerical weather prediction (NWP) models [2,3,4,6,9,16,24,29,30]. NWP models are generally suitable for medium- and long-term forecasting [9,14]; however, they demand substantial computational resources and long simulation times [4,24], making them less efficient for rapid or localised applications [9,12]. In the context of this study, which aims to develop a practical methodology based on easily available offshore and onshore data, the high computational cost and limited local resolution of NWP models make them unsuitable. Hence, data-driven and machine learning techniques were preferred for their faster processing and adaptability to regional conditions [14,25,29].
Another possibility is to apply a statistical strategy to historical wind speed data. Within this category, numerous mathematical models can be used (autoregressive (AR), autoregressive moving average (ARMA), autoregressive integrated moving average (ARIMA), Bayesian approach, Markov chain, among many others) [2,6,11,12]. These models are generally fast, computationally efficient, and easy to interpret [3,24], making them more suitable for short-term forecasts than physical models [4,24]. However, their accuracy tends to deteriorate as the prediction horizon increases [24]. For example, ARIMA-based models that achieve mean absolute errors below 1 m/s for 1–3 h forecasts can exceed 2.5–3 m/s when extended to 24 h horizons [19,27], illustrating their limited applicability for medium-term forecasting. In addition, their performance worsens when dealing with nonlinear or highly variable data [4,6,10,11], and some models struggle with large datasets [7].
Artificial intelligence (AI) techniques have emerged to overcome the limitations of physical and statistical approaches [8,12]. Common AI models applied to wind speed forecasting include machine learning algorithms (e.g., support vector machines, random forests, decision trees) and deep learning architectures (e.g., CNNs, RNNs, GRUs, and LSTMs) [2,3,12,31,32,33,34]. These models can capture complex nonlinear relationships and typically outperform traditional methods in accuracy. However, they also present notable drawbacks: their performance is highly dependent on proper hyperparameter tuning and data quality [8,10,35,36,37], and they often suffer from instability or overfitting when trained on limited or non-representative datasets [7]. Consequently, while AI-based models are powerful, their practical implementation requires careful optimisation and validation.
As can be deduced, physical, statistical, and AI-based methods have strengths and weaknesses. This is the main reason why many authors have adopted a hybrid approach, combining several techniques with the aim of boosting their advantages and, at the same time, compensating for the shortcomings they may have individually [12,21,28,38,39]. Although a detailed literature review is beyond the scope of this paper, the reader can find in Table 1 some of the most recent studies in wind speed prediction. Comprehensive reviews such as those by Valdivia-Bautista et al. [21], García Márquez and Peinado González [31], Yang et al. [40], Lipu et al. [41], and Liu et al. [42] provide an updated overview of the main developments and challenges in wind speed forecasting using AI-based and hybrid methods, which, among others [43,44,45,46,47,48,49,50,51,52,53], frame the present study within the current research trends.

Table 1.
Recent studies on wind speed prediction.
Several conclusions can be drawn from the existing literature. The current trend in wind speed forecasting relies on hybrid models that combine multiple techniques, often achieving excellent performance, but at the cost of increasing complexity and limited real-world applicability [19]. Moreover, most existing studies concentrate on very-short- or short-term horizons (Table 1), while medium- and long-term predictions remain less explored. Another limitation is that most models only use local wind measurements as predictors, typically from the same site where the forecast is intended. Offshore meteorological, oceanographic, and wave variables can provide valuable early indicators of large-scale atmospheric processes that influence inland wind conditions several hours later. Therefore, incorporating offshore predictors can enhance temporal lead time and improve the accuracy of onshore wind speed forecasting, particularly for medium-term horizons.
Taking all this into account, and based on an extensive review of the recent literature in major scientific databases (Scopus, Web of Science, and ScienceDirect) covering the 2015–2024 period, no previous studies that aim to predict medium-term onshore wind speed using meteorological, oceanographic, and wave variables measured at distant offshore locations have been identified. This work aims to address this gap by exploring the possibility of this novel approach through the application of 27 established machine learning models. The objective is not to propose a new forecasting technique, but rather to explore a new strategy that could significantly reduce the need for specific onshore measurement campaigns. This could, in turn, have a positive impact in terms of deployment costs and environmental impacts. It could also serve to shorten the lead time for the development of new onshore wind farms. A case study in Spain has been considered. The structure of the rest of the paper is as follows. The process carried out for wind speed forecasting is explained in Section 2. All the information related to the case study is included in Section 3. The results are presented and discussed in Section 4, including a detailed description of the 24 h horizon predictions, additional results for other time horizons that also fall within the medium-term range, as well as findings derived from additional experiments involving the addition and removal of certain predictor variables, and limitations. Finally, the reader can find the main conclusions in Section 5, as well as some potential future developments.
2. Materials and Methods
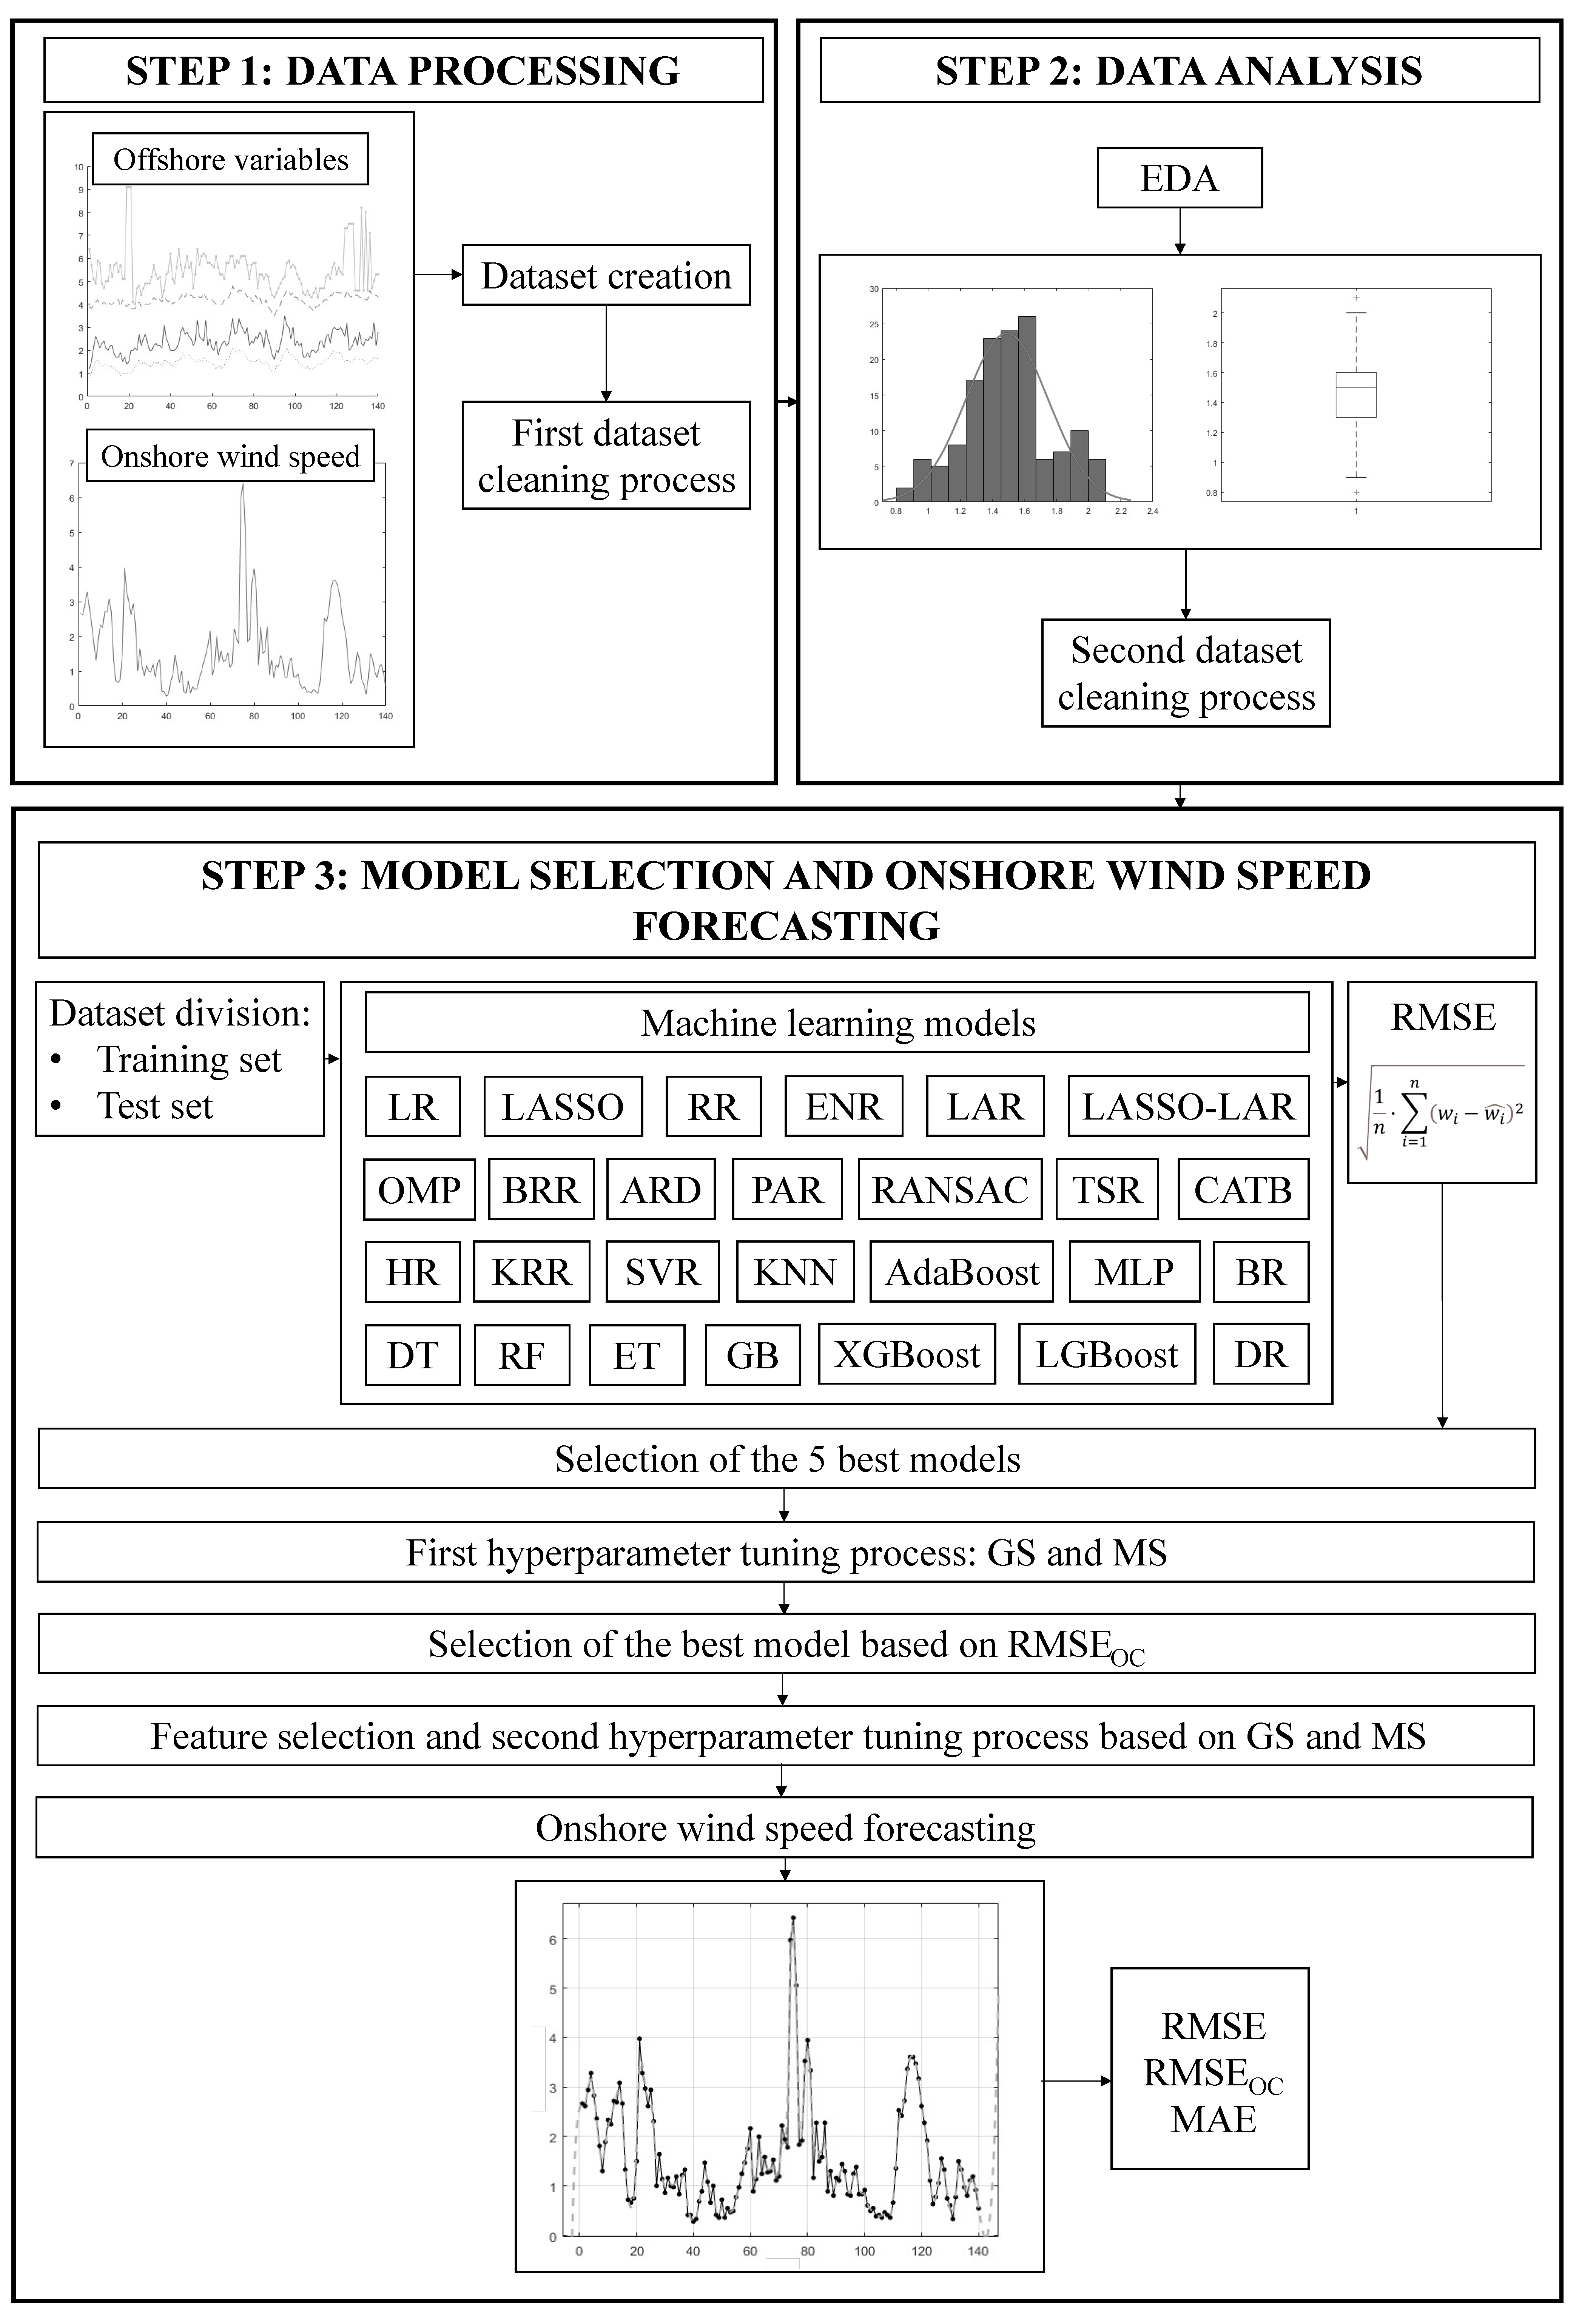
The proposed methodology consists of three main steps, as shown in Figure 1. In the first phase, a dataset is created, including both the onshore (wind speed) and offshore measured variables. Examples of offshore variables include average wind speed, significant wave height, atmospheric pressure, average air temperature, peak wavelength, solar radiation, water surface temperature, and the month of measurement, among others. The time lag for the onshore and offshore variables corresponds to the forecasting horizon considered. Each row of the dataset represents one observation containing all variable values. When missing values are detected, the corresponding observation is generally discarded to maintain data integrity. However, alternative imputation strategies—such as linear interpolation, mean or median substitution, and regression-based imputation—were preliminarily tested to assess their influence on model performance, confirming that simple deletion provided the most robust and unbiased results for this dataset. Then, the dataset is first subjected to a cleaning process in which those observations that present at least one variable with an anomalous value are discarded. Anomalous values were identified using both statistical and physical criteria: data points lying beyond three standard deviations from the variable mean or falling outside physically realistic ranges (e.g., negative wind speeds, salinity, or temperature values inconsistent with regional oceanographic records) were considered outliers and removed.
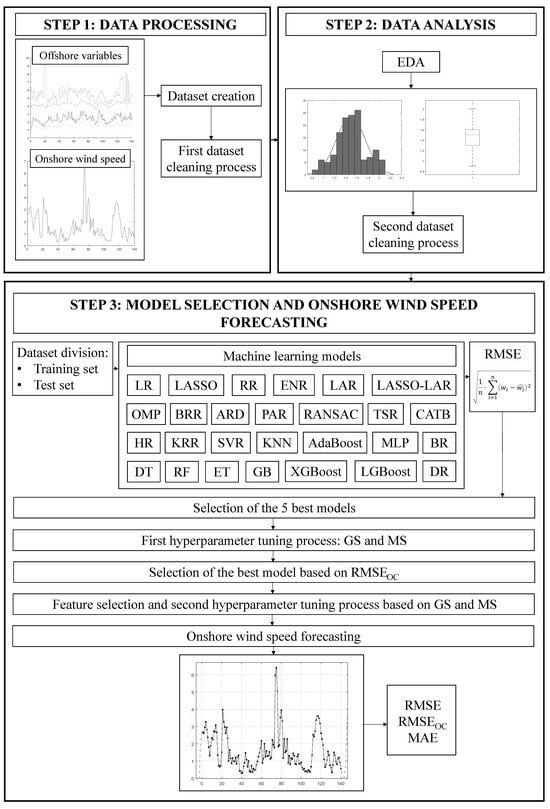
Figure 1.
Flowchart of the methodology employed (double column-width figure. To be printed in greyscale in both the online and printed versions of the paper).
In the second step, an exploratory data analysis (EDA) is carried out, including univariate and multivariate analyses, as well as correlation analysis and normality testing (Figure 1). The objectives of the EDA are to understand the behaviour of the variables and identify possible relationships among them. All statistical analyses and visualisations—such as histograms, scatter matrices, and correlation heatmaps—were performed using Python (v3.11) with the libraries pandas, NumPy, Matplotlib, and Seaborn. This stage also provided initial evidence of which types of models were likely to yield the most accurate results. The longer the period for which the variables have been measured, the more valuable the information provided by the EDA. If this time period for the onshore and offshore variables is different, it is possible to perform two EDAs, one for the onshore variables and the other for the offshore ones. After the EDA, a second cleaning process is carried out with the objective of removing observations with outliers.
In the third phase, the dataset is divided into two parts: training (75%) and test (25%) sets. It is important to note that this study proposes an exploratory methodology for onshore estimation using offshore data. Therefore, the primary objective is not necessarily to achieve accurate wind speed prediction in a real-world application under operational constraints, but rather to demonstrate the extent to which this approach may prove to be promising. After that, the exploratory nature of this study was taken into account. At the same time, the analysis was intentionally designed to estimate the best possible predictive performance under ideal conditions, meaning that some temporal overlap between training and testing periods was tolerated to explore the model’s upper-bound capability. This controlled setup should not be interpreted as data leakage, but rather as a benchmark exercise to assess the theoretical forecasting potential of each algorithm. It is important to note that an intended look-ahead bias is committed with the aim of obtaining the best potential forecast.
Consequently, 27 machine learning regression models were applied (Figure 1). These include linear, ensemble, kernel-based, and neural network approaches. For clarity, Table 2 summarises the models used, grouped by type and with their main bibliographic sources.

Table 2.
Summary of the 27 machine learning regression models applied.
All of them are employed with predefined values for their corresponding hyperparameters [54,55,56,57]. The root mean squared error (RMSE) for the test set is used to compare the performance of the 27 models, Equation (1) [22,27,39]. This metric is measured in the same units as wind speed, that is, in m/s. This makes it easier to interpret the error in the prediction. In Equation (1), is the observed onshore wind speed, while is the onshore forecasted value, and n is the number of samples. The RMSE is expressed in the same units as the target variable (m/s in this case), providing a direct measure of the average magnitude of prediction errors. Lower RMSE values indicate more accurate models and better agreement between observed and estimated wind speeds.
Subsequently, the five best models, that is, the ones with the lowest values for RMSE for the test set, are selected. The objective is to perform a hyperparameter tuning process with the best models. As this is a time-consuming procedure, only five models are selected in order to achieve a reasonable computation time. Grid search (GS) and manual search (MS) are employed [58,59,60]. Once the hyperparameters of the five best models have been optimised, the RMSE metric for the test set is used again to compare their performance. However, the selection of the best model is now based on a new metric that takes into account model overfitting, which has been named RMSE for overfitting control, as shown in Equation (2). This metric is calculated as the sum of the RMSE for the test set and the absolute value of the difference between RMSE for the test set and RMSE for the train set. This indicator measures the absolute difference between the RMSE values obtained for the training and test sets, providing a straightforward proxy for overfitting: large discrepancies suggest that the model has memorised training patterns instead of learning generalisable relationships. Conversely, a small RMSE difference indicates stable performance and adequate generalisation capability.
The best model is then selected. At this point, it is likely that some of the predictor (offshore) variables are not relevant for the onshore wind speed forecasting. It is also possible that some of them introduce noise in the estimation procedure. Therefore, the next step seeks to reduce the number of predictor variables by eliminating those that are less relevant (feature selection). There are multiple methods for such a purpose, including filter, wrapper, and embedded techniques [22,61,62]. After that, a second hyperparameter tuning process is performed, once again, using GS and MS. Finally, the best model, already optimised, is used for onshore wind speed forecasting, and RMSE, RMSEOC, and the mean absolute error (MAE) [27,49,51], as shown in Equation (3), are calculated (Figure 1). MAE is measured in m/s and its interpretation is analogous to that of RMSE, since a lower value also implies a better performance. Nevertheless, MAE is less sensitive to outliers, and this is the reason why it is also included as a performance index.
3. Implementation of the Proposed Methodology in a Case Study
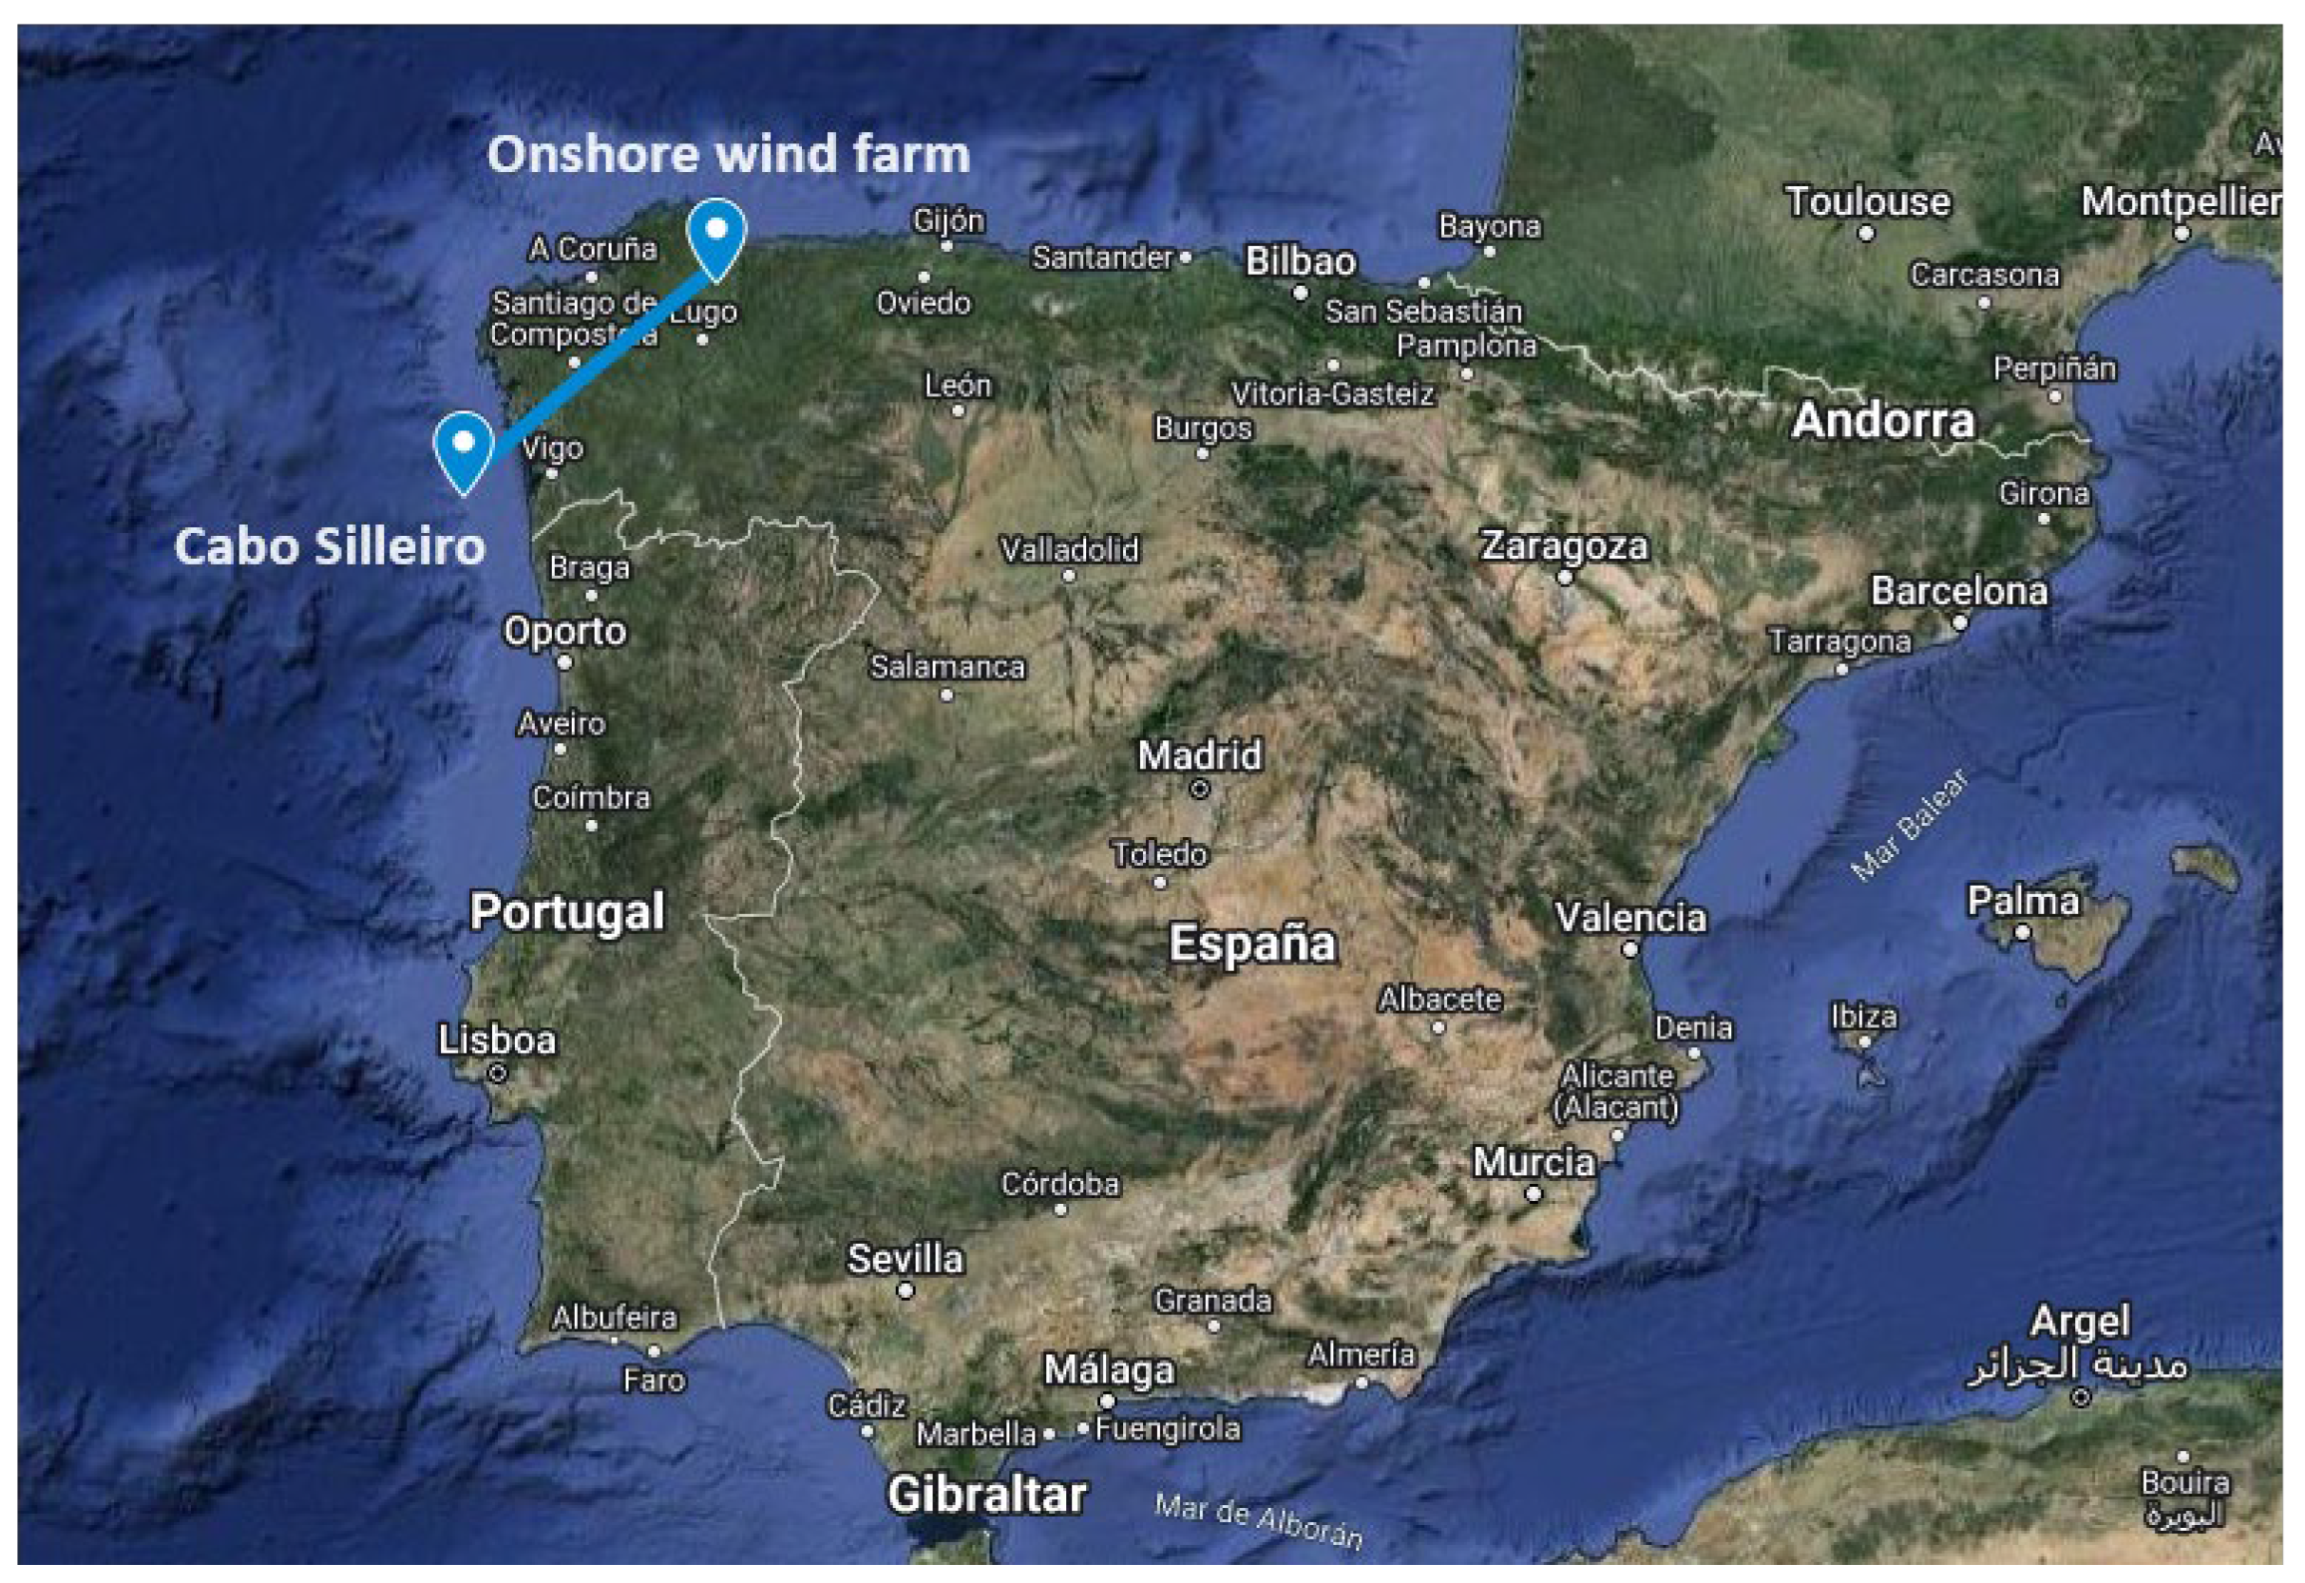
The real wind speed data () was obtained from an onshore wind farm located in Spain with coordinates 7.47° W and 43.33° N (Figure 2). Wind speed is measured at a height of approximately 44 m above the ground level. Wind farm anemometers record wind speed every ten minutes. In order to have the same type of data as for the offshore variables, the six wind speed values measured by the anemometers have been averaged for each hour. Furthermore, in this study, the average wind speed of all the wind turbines is used as the target variable. Averaging was selected over alternative aggregation methods (e.g., median or maximum values) because it smooths short-term turbulence and measurement noise, providing a more stable representation of the underlying wind regime. This approach is also consistent with standard practices in wind resource assessment and forecasting, where hourly averages better reflect the energy-relevant wind behaviour. The measurement period is from 1 January 2010 to 31 December 2012, with a total number of 25,572 observations.
The values for the offshore variables were collected and provided by Puertos del Estado [63]. In particular, they were recorded by the Cabo Silleiro buoy belonging to the REDEXT network and with coordinates 9.43° W and 42.12° N (Figure 2). The buoy is located an approximate straight-line distance from the onshore wind farm of 209 km. Although this distance may reduce the direct instantaneous correlation between offshore and onshore wind speeds, it also captures large-scale atmospheric dynamics that can propagate inland over several hours. Therefore, the offshore measurements provide valuable predictors for medium-term forecasting, where temporal lead, rather than spatial proximity, is the key factor. It provides only one value per hour for each of the offshore variables it measures. The sampling period starts on 1 January 2007 and ends on 31 December 2017. Offshore variables can be classified into three groups: (i) wave, (ii) oceanographic, and (iii) meteorological (Table 3). Wave variables are calculated over periods of 26 min, while oceanographic and meteorological variables are calculated over periods of 10 min. To ensure temporal consistency among all inputs, wave data were resampled by linear interpolation to match the 10 min resolution of the remaining variables before aggregation to hourly means. Although the difference in sampling intervals could introduce minor temporal smoothing, preliminary tests confirmed that it had a negligible impact on model accuracy, while maintaining coherence across variable types.

Table 3.
Description of the offshore variables. Offshore variables used as model inputs, with corresponding units and category classification.
Finally, it is of interest to highlight that wind behaviour was encoded using one-hot (dummy) encoding, allowing the models to account explicitly for periodic seasonal effects without imposing a linear temporal trend. Consequently, potential seasonal patterns—such as higher winter wind speeds or summer calm periods—were incorporated directly into the learning process.
The dataset used in this study was constructed by integrating onshore wind speed measurements with the set of offshore meteorological, oceanographic, and wave variables included in Table 2. Each observation in the dataset corresponds to a specific forecast horizon, defined as the time lag between the offshore predictor variables and the onshore wind speed value to be estimated. For example, to estimate wind speed h hours ahead, the offshore variables at time t are paired with the onshore wind speed at time t + h. This structure enables the training and evaluation of models across multiple prediction horizons.
As indicated in Section 2, a look-ahead bias was intentionally introduced in this study in order to estimate the maximum potential predictive capacity of distant offshore data under idealised conditions. In this sense, the objective is not only to develop an operational forecasting tool but also to assess the feasibility and theoretical limits of using offshore measurements from remote locations for onshore wind speed estimation. All variables were resampled or averaged to a common hourly timestamp, ensuring consistent temporal alignment. Observations were included only when all variables were available and correctly synchronised. In other words, observations with missing values in any variable were discarded. Measurements with implausible values were also excluded. Finally, after the EDA, observations identified as outliers were also removed to reduce noise in the modelling phase. After preprocessing, the resulting dataset was used to train and evaluate the 21 machine learning models indicated in Section 2.
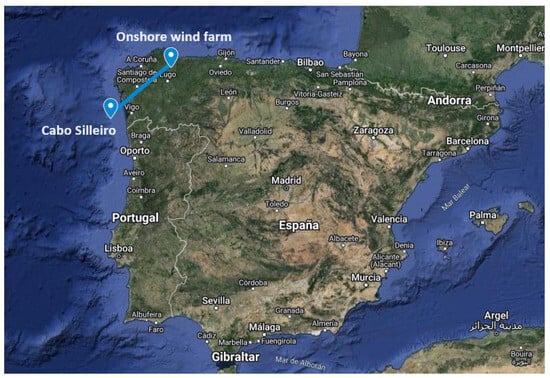
Figure 2.
Locations of the Cabo Silleiro buoy and the onshore wind farm [64] (1.5 column-width figure. To be printed in colour online and in greyscale in the printed version of the paper).
Figure 2.
Locations of the Cabo Silleiro buoy and the onshore wind farm [64] (1.5 column-width figure. To be printed in colour online and in greyscale in the printed version of the paper).
4. Results and Discussion
This section is divided into four sub-sections. In the first one (Section 4.1), the most interesting results for the EDA are presented. The results for the onshore wind speed forecasting with a 24 h time horizon are included in Section 4.2. This sub-section also discusses the extent to which the predicted wind speeds are useful in determining if the conditions for producing electricity at the onshore wind farm are met. This is of vital relevance as it serves to measure the validity of the methodology followed at the time of planning the maintenance activities. The reader can find wind speed prediction results for other time horizons in Section 4.3. Finally, the last sub-section includes additional results derived from a series of experiments carried out as a what-if analysis.
4.1. EDA Results
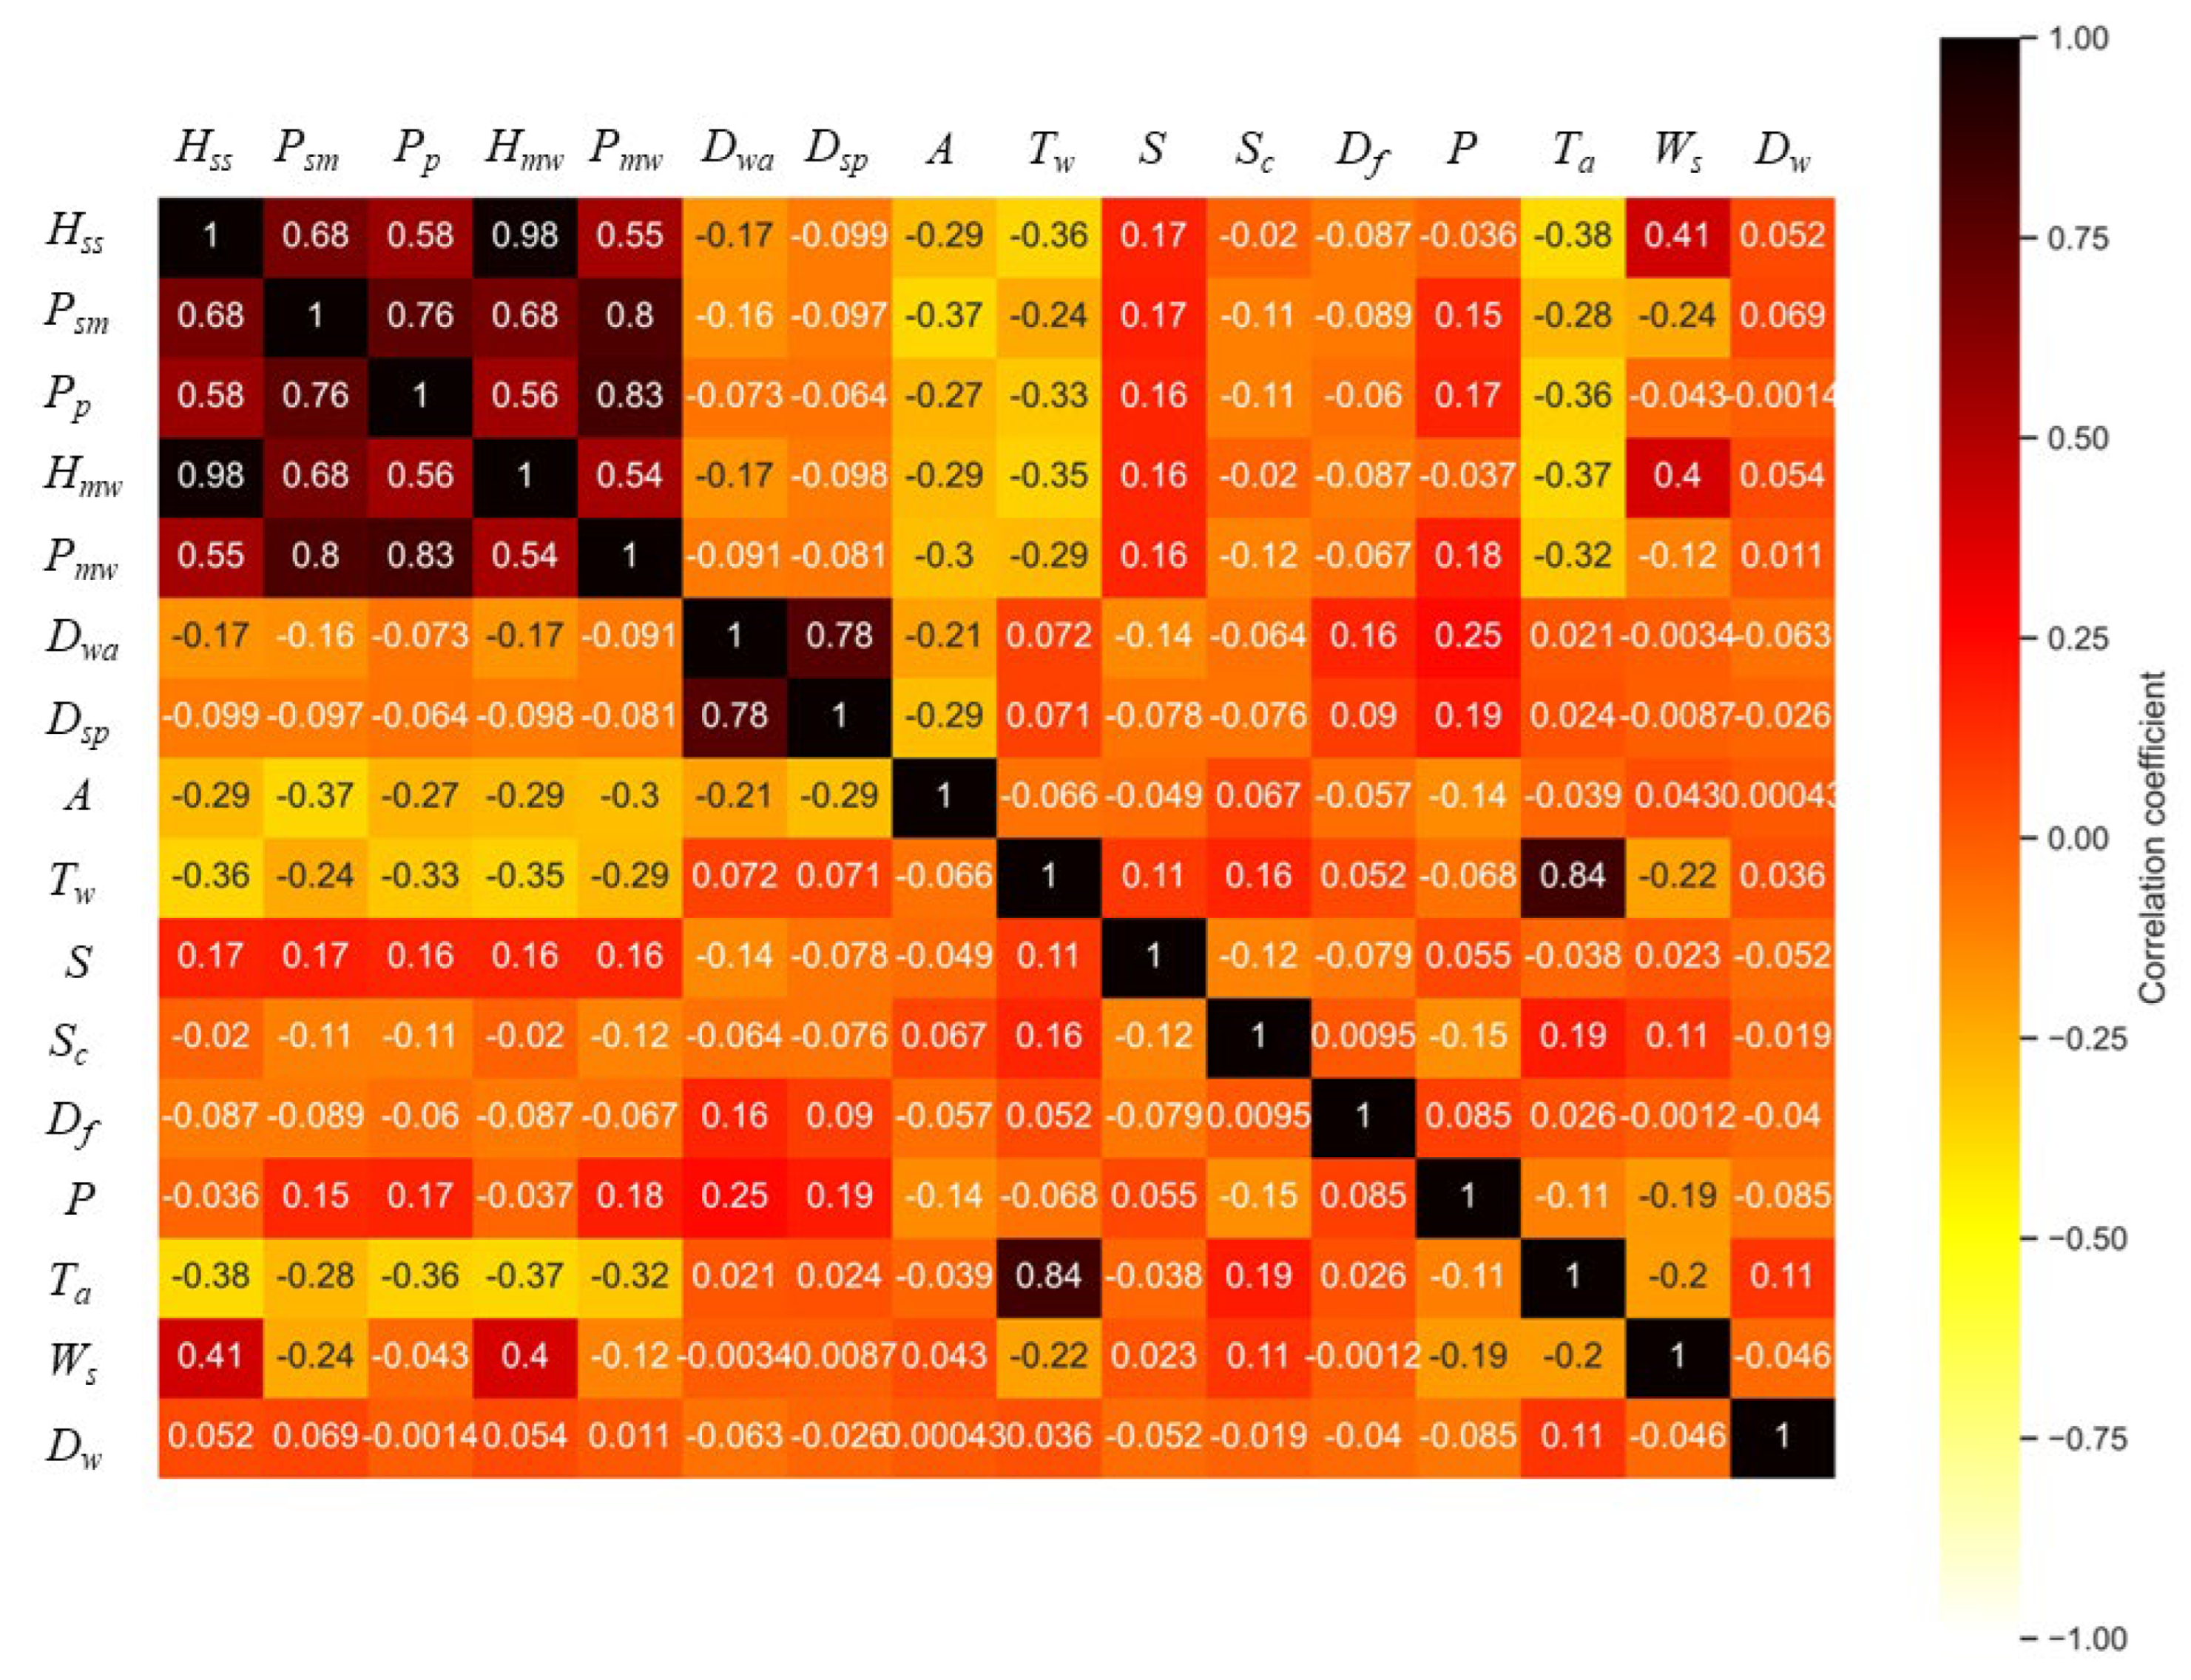
An EDA has been carried out for the 16 offshore variables included in Table 3. The corresponding Spearman correlation coefficients for the period 2007–2017 are shown in Figure 3. There is a non-negligible correlation among the variables Hss, Psm, Pp, Hmw, and Pmw. In all these cases, the correlation is positive. This is a logical result, since all of them are wave variables with a clear relationship among them. Similarly, there is also a strong and positive correlation between Dwa and Dsp, both wave variables measuring mean direction, as shown in Table 3. As it could not be otherwise, a high and positive Spearman correlation coefficient was also found between Tw and Ta. Although Tw is an oceanographic variable, while Ta is an atmospheric one, it is logical to think that there is a connection between water surface temperature and air temperature. It is also possible to highlight the relationship of average wind speed (Ws) with the spectral significant height (Hss) and with the height of the maximum wave (Hmw), which give Spearman coefficients of 0.41 and 0.4, respectively. Once again, this is a logical outcome, as wind speed is one of the multiple factors that influence the appearance of waves.
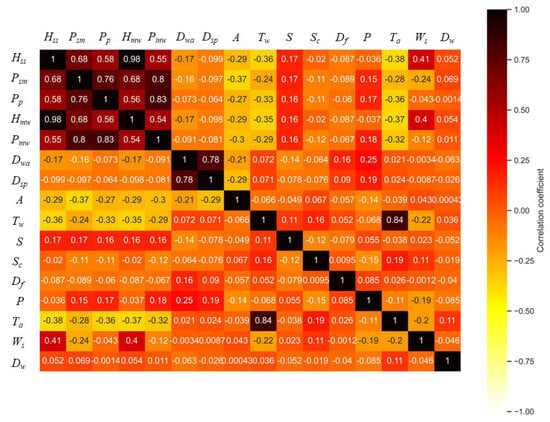
Figure 3.
Spearman correlation coefficients for the offshore variables for the period 2007–2017 (double column-width figure. To be printed in colour online and in greyscale in the printed version of the paper).
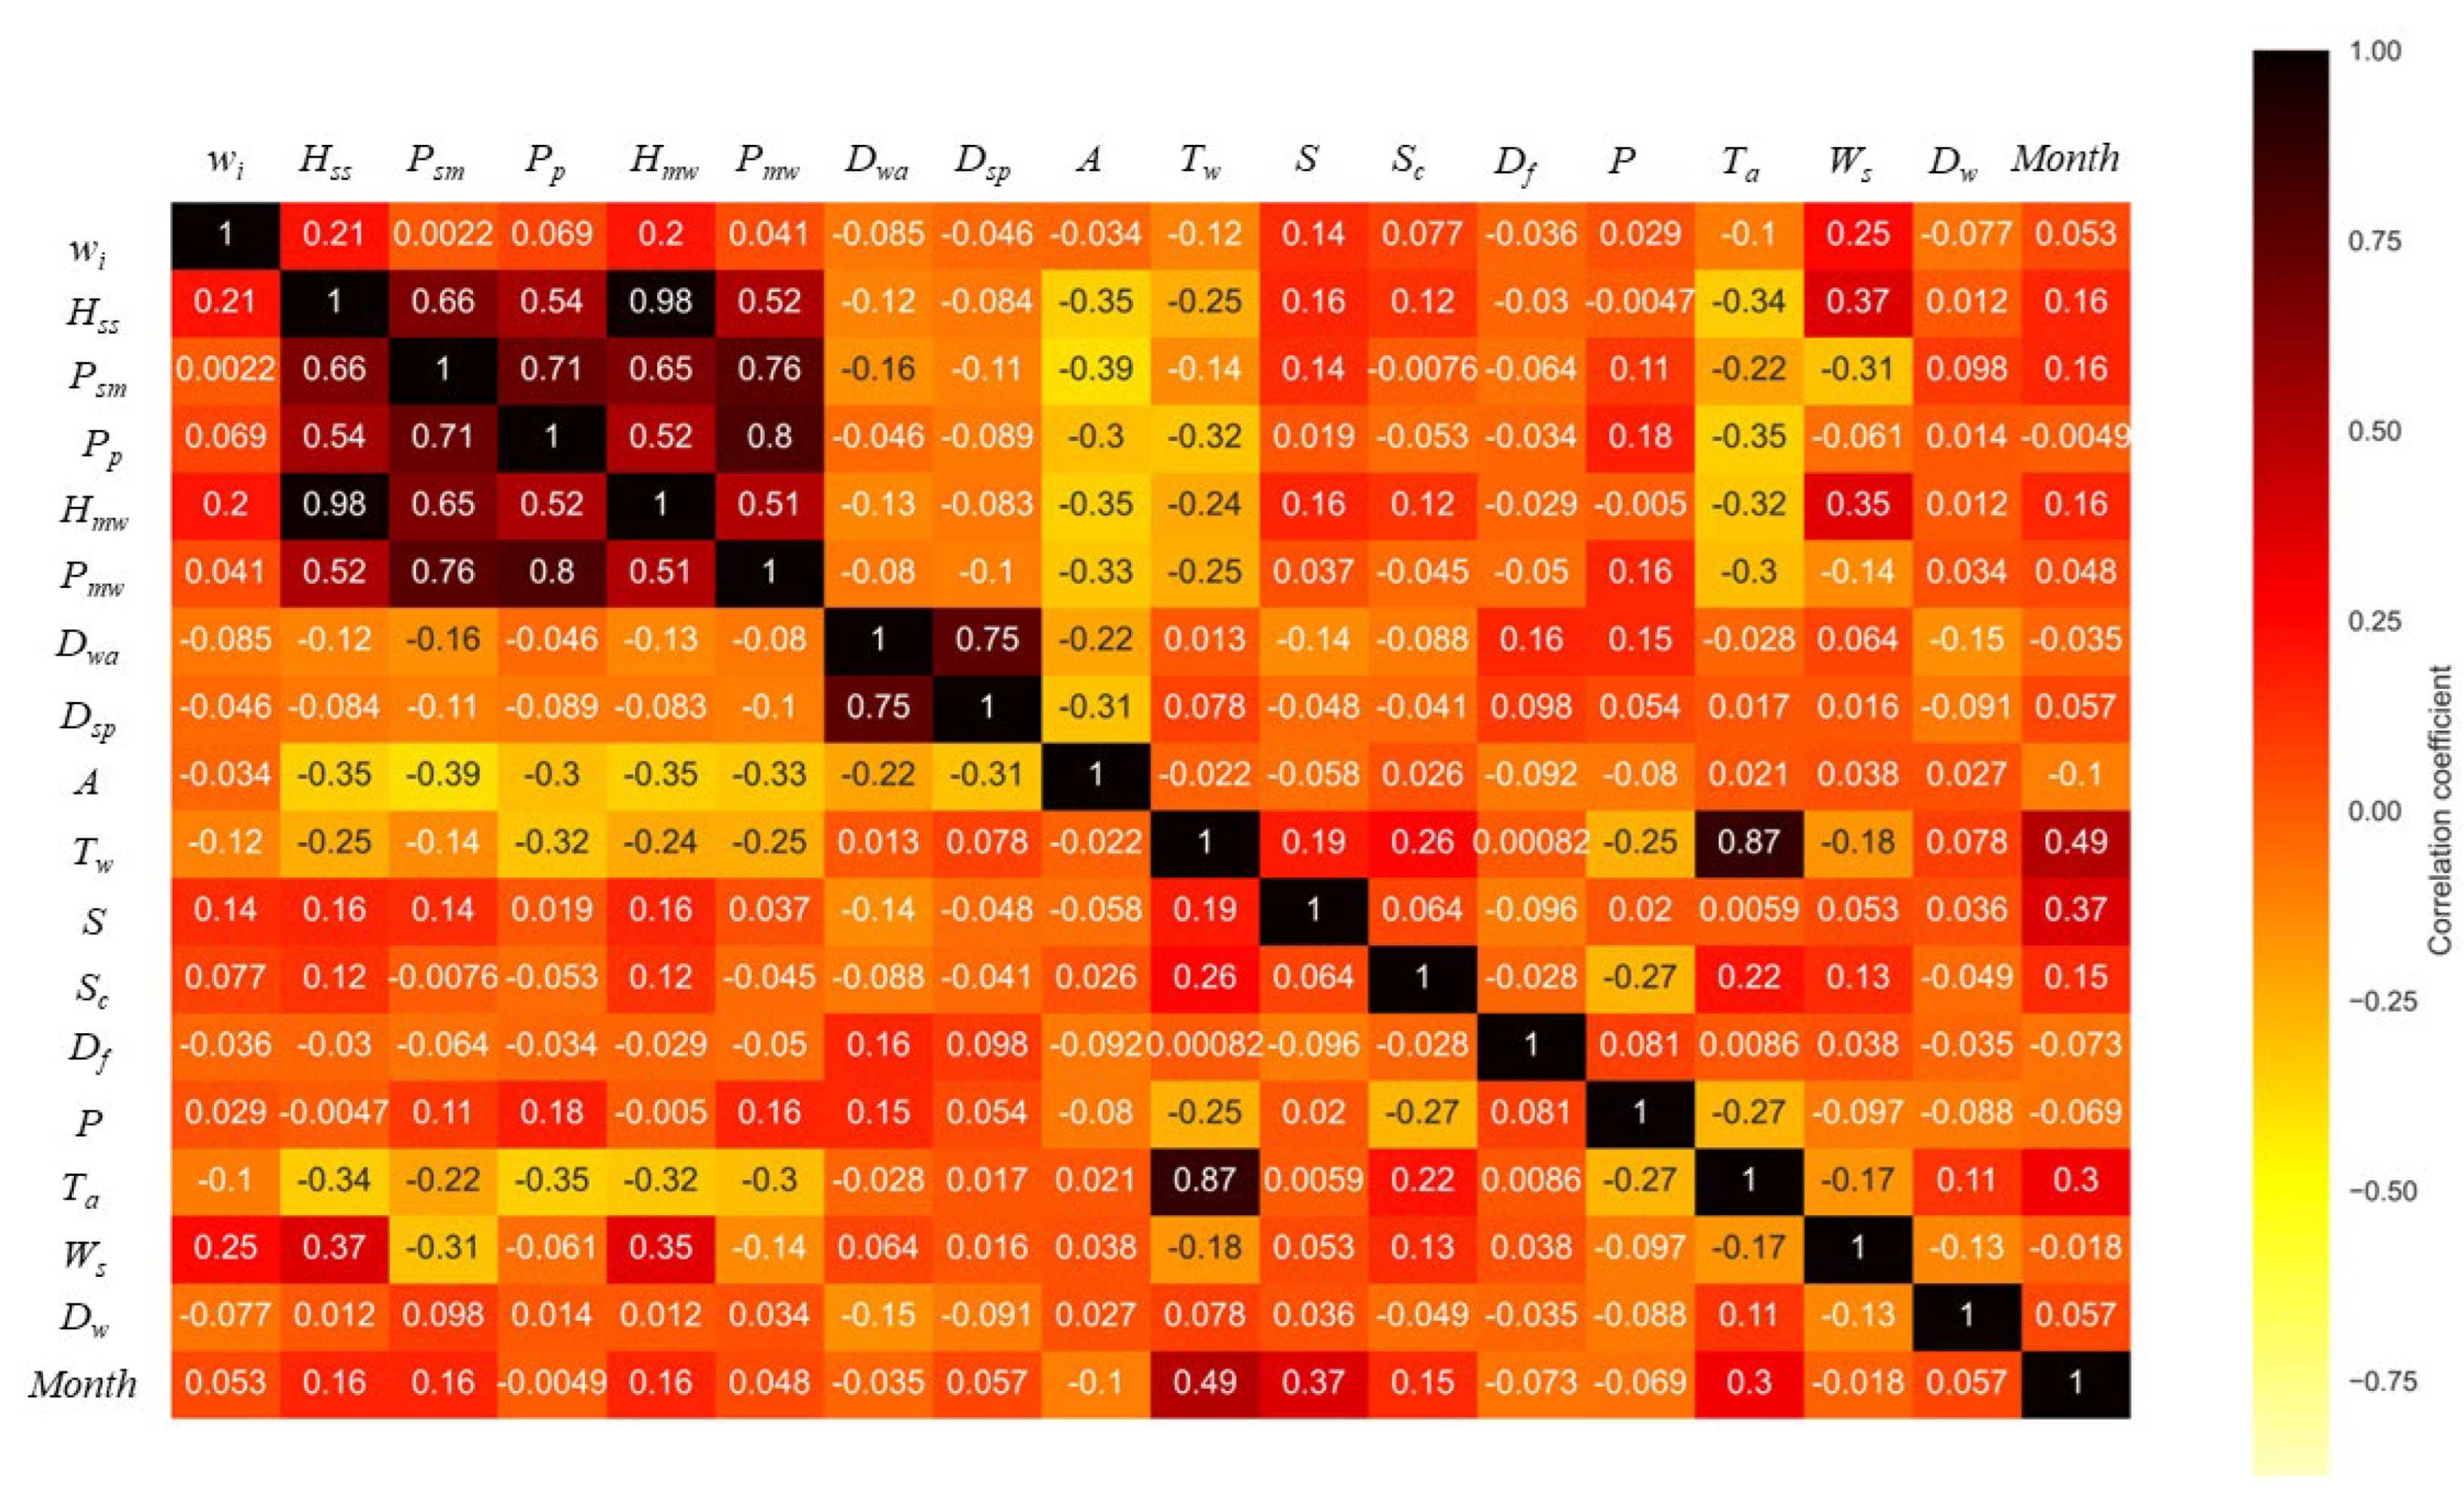
Another EDA has been conducted, in this case, for the onshore and offshore parameters, including the variable month, for the period 2010–2012. The Spearman correlation coefficients are included in Figure 4. It is possible to say that the relationships observed for the offshore variables in Figure 3 are maintained. In this case, it is interesting to analyse the potential correlations between the onshore wind speed (wi) and the predictor variables. Both positive and negative coefficients have been obtained. Nevertheless, in all cases, the correlations are weak with low coefficients. The highest correlation appears between the onshore (wi) and the offshore (Ws) wind speeds. This is a consistent result, since wind speed at a certain location is the sum of planetary, regional, and local phenomena [17]. In other words, taking into account the distance between the buoy and the onshore wind farm, it seems reasonable to say that both locations belong to the same prevailing wind at a global scale. Therefore, some correlation is expected. The following strongest correlations were with the spectral significant height (Hss) and with the height of the maximum wave (Hmw). As previously mentioned, there is a reasonable relationship between wind speed and waves. Since onshore and offshore wind speeds are slightly correlated, it seems logical to think that there can also be a slight relation between onshore wind speed and wave heights, as has been the case. Furthermore, both Spearman coefficients are slightly below 0.25, which makes sense.
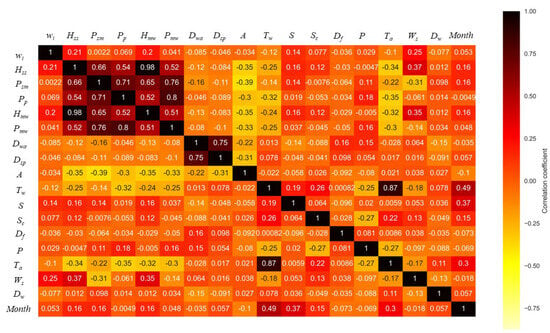
Figure 4.
Spearman correlation coefficients for the onshore and offshore variables for the period 2010–2012 (double column-width figure. To be printed in colour online and in greyscale in the printed version of the paper).
To sum up, it can be observed that, despite their low individual correlation coefficients, these variables can still hold valuable predictive information when used collectively in nonlinear machine learning models. Such models are capable of capturing complex, multivariate interactions and delayed effects that simple pairwise correlations cannot reflect. Therefore, the correlation values reported here should be interpreted as preliminary indicators of association, rather than exhaustive measures of predictive potential.
4.2. Onshore Wind Speed Forecasting: 24 H Results
The forecasting results for the 27 machine learning regression models are included in Table 4. As can be seen, the models with the five lowest RMSE values for the test set resulted in ET, RF, CATB, XGBoost, and BR, respectively. All of them are ensemble methods.

Table 4.
Forecasting performance of the 27 machine learning models.
It is important to note that, although offshore variables can provide valuable early indicators of atmospheric processes influencing inland wind conditions, their indirect nature introduces an inherent limitation compared to using onshore measurements. The spatial separation (≈209 km) and differing surface characteristics between marine and terrestrial environments may reduce the representativeness of offshore data for local wind dynamics. Nonetheless, this approach remains advantageous for medium-term forecasting, where the objective is to anticipate general wind patterns rather than short-term fluctuations.
Following the methodology presented in Section 2, these five models were first subjected to a hyperparameter tuning process, and new forecasting results were obtained, as shown in Table 5. To achieve this, a combination of filter and embedded approaches was employed: first, a correlation-based filter method was used to remove redundant predictors, followed by embedded feature importance analysis using tree-based models such as Random Forest and XGBoost.

Table 5.
Forecasting performance of the 5 best machine learning models after the first hyperparameter tuning process.
In particular, hyperparameter tuning and model selection were conducted through a multi-stage process combining automated grid search and manual refinement, with a consistent validation framework to ensure comparability. All models were first evaluated using their default configurations, and the top five performers—based on 5-fold cross-validation using RMSE as the selection metric—were shortlisted for further tuning (Grid Search 1, GS1). This initial grid focused on model capacity parameters (i.e., tree depth and ensemble size) within a reduced and uniform range to control variance and enable fair comparisons: max_depth ∈ {5, 10, 15} and n_estimators/iterations ∈ {100, 150, 300}. After that, new forecasting results were obtained, as shown in Table 5.
It may be surprising that RMSE values for the test set are now higher than the ones of Table 4. However, the reader should note that now the focus is not only on the best fit but also on avoiding excessive overfitting. According to the value of RMSE for overfitting control, the best model is now CATB. In other words, it is the model that strikes the best balance between adequate accuracy and limited overfitting. Therefore, CATB will be subjected to a second hyperparameter tuning process.
In addition, a second, model-specific grid search (GS2) was conducted around CATB, expanding the parameter space to include depth, iterations, learning_rate, l2_leaf_reg, and subsample, with ranges guided by the best-performing regions in GS1. This stage was followed by a two-phase fine-tuning process: (1) stabilisation of generalisation with capacity fixed, where fine parameters such as learning rate and regularisation were optimised; and (2) a narrow, local re-optimisation of capacity (depth and iterations) in combination with the previously fixed fine parameters. Additionally, a manual search procedure was applied in parallel, iteratively removing the least informative predictors, until no further performance gains were observed. All tuning was performed under 5-fold cross-validation using a fixed random seed for full reproducibility. The final model was trained with the selected configuration and evaluated once on the test set. Hyperparameters for the final CATB model were depth = 5, iterations = 960, learning_rate = 0.1, l2_leaf_reg = 0.5, and subsample = 0.9.
The results after the last fine-tuning with the CATB model are included in Table 6. As explained in Section 2, the reader should bear in mind that the values included in Table 6 are the result of a deliberate look-ahead bias with the aim of obtaining the best potential forecast. As can be seen, a better prediction has been achieved with less overfitting. The most relevant predictor variables have turned out to be water surface temperature (Tw), atmospheric pressure (P), average air temperature (Ta), mean direction of origin of the waves (Dwa), and spectral significant height (Hss). It can be stated that all types of variables are relevant, since one variable belongs to the oceanographic type, while the remaining are the meteorological and wave types. It may be surprising that the average wind speed (Ws) is not in the top five most important variables for prediction. Nevertheless, it is important to remember that there is a non-negligible correlation between Ws and Hss. On a separate issue, it is important to clarify that there are models in the existing literature with better values for RMSE and MAE. However, this does not mean that the methodology proposed here is worse. There are several reasons for this. On the one hand, onshore wind speed is being estimated using offshore data measured at a considerable distance. Existing models use onshore data to forecast wind speed in the same location. It is therefore logical to obtain better precision. On the other hand, the dataset cleaning process proposed in Section 2 has considerably reduced the number of observations to be used in this case study. In other words, if there were more data to work with, the accuracy of the model should increase. Finally, other variables, such as solar radiation, could improve the performance of the methodology. Unfortunately, no data have been obtained for variables other than those in Table 3.

Table 6.
Forecasting performance of the CATB model with the final configuration.
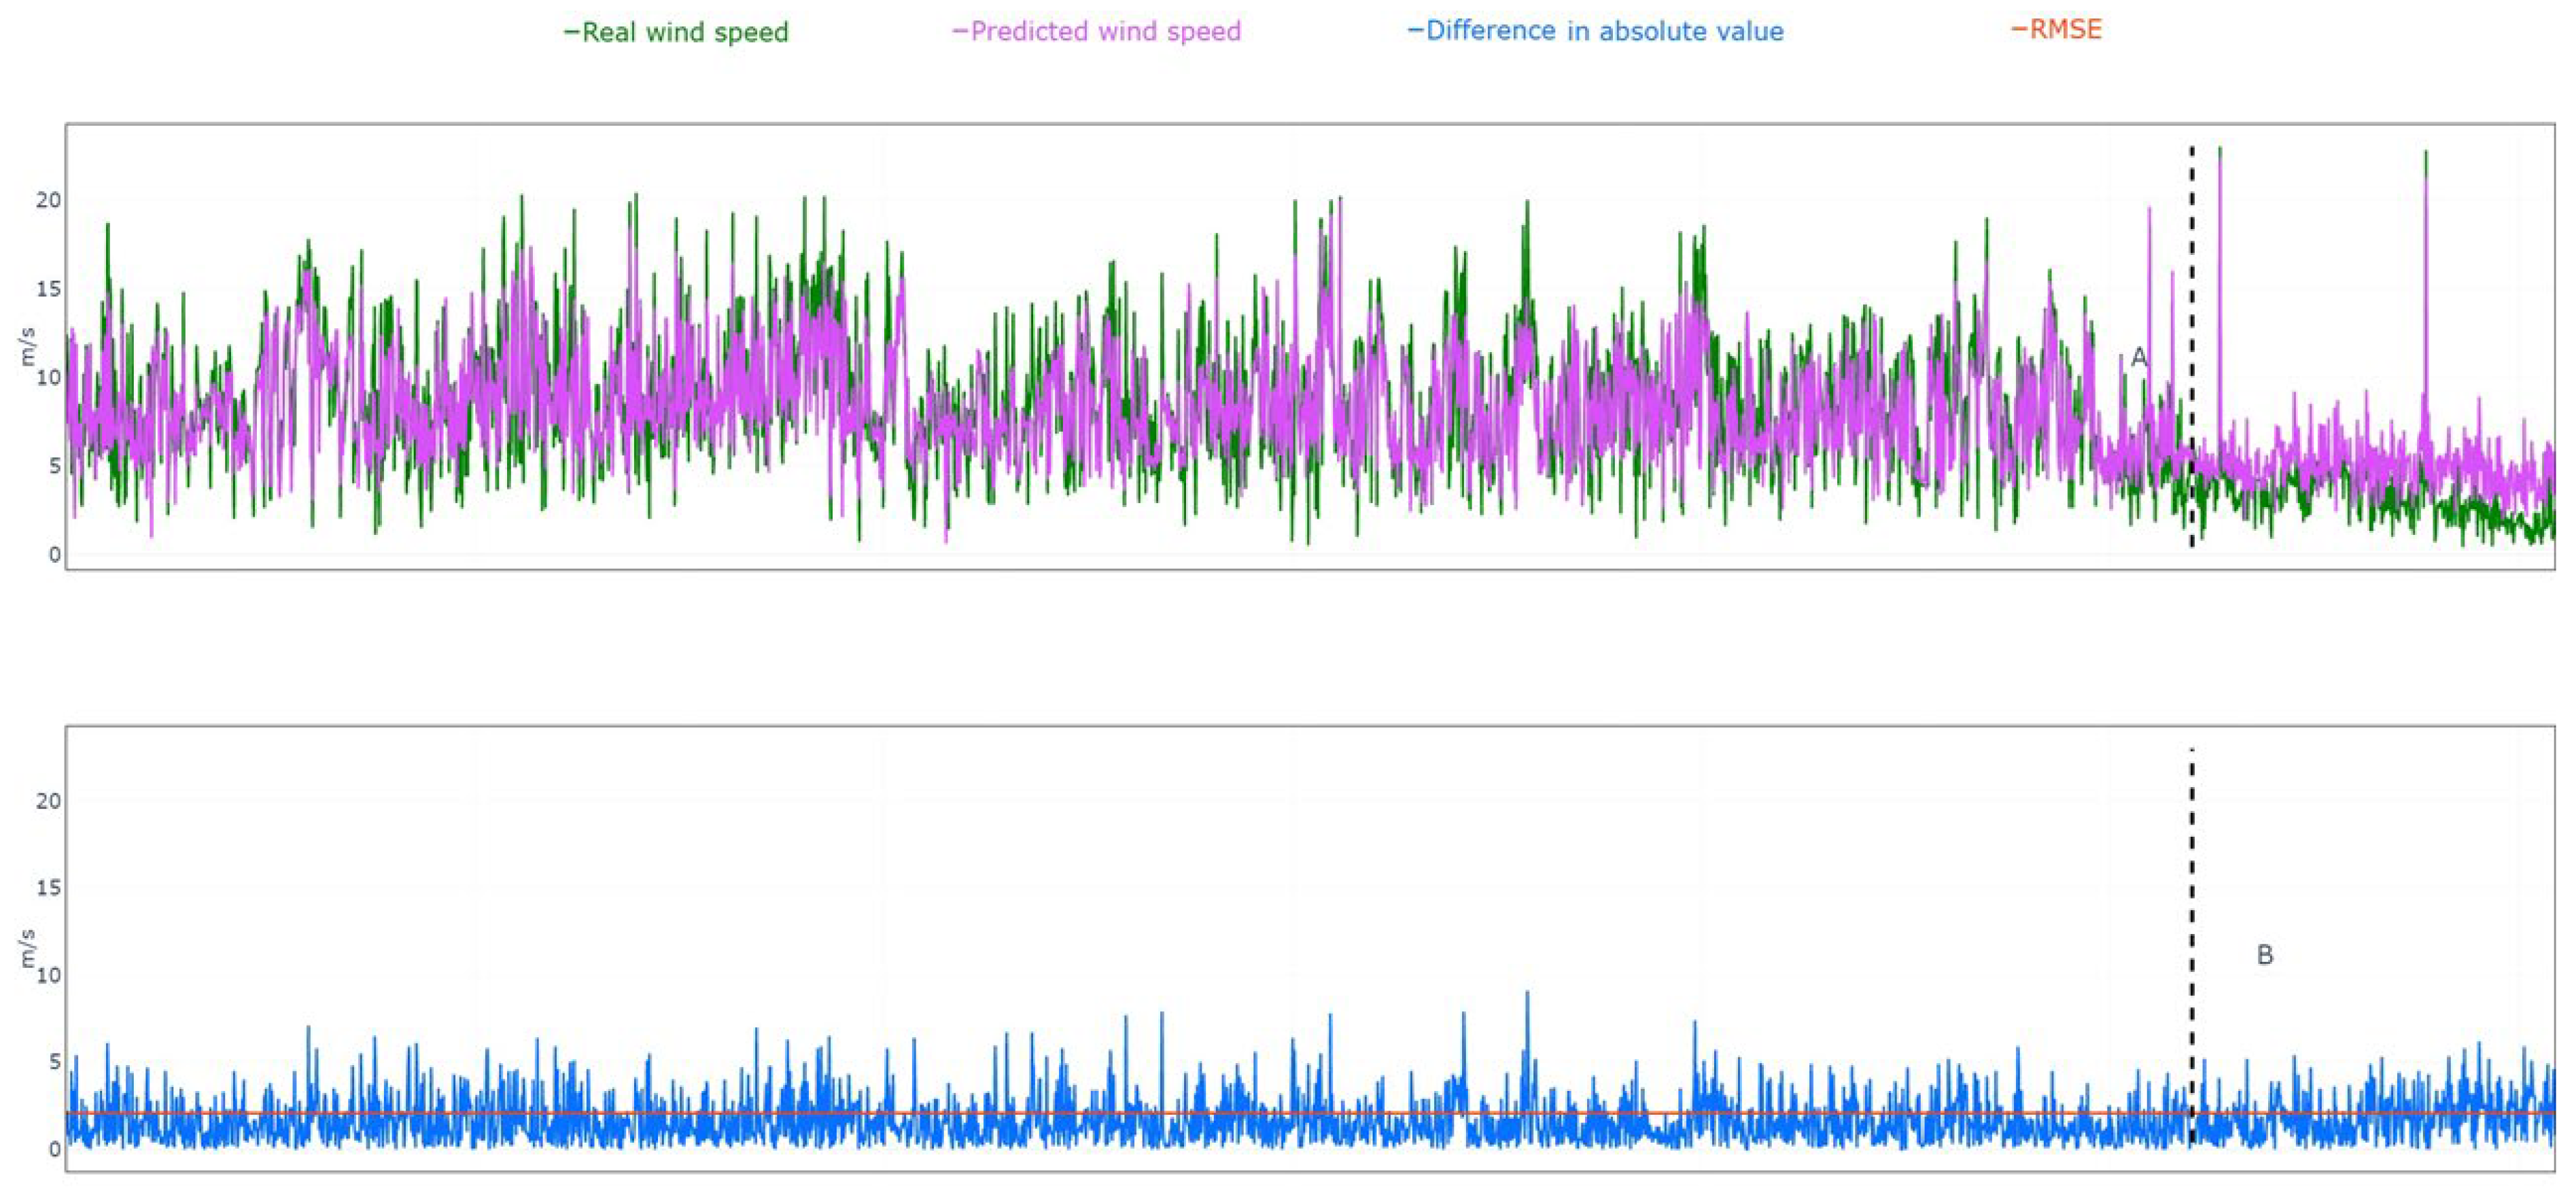
The reader can find the real onshore wind speed (wi), the predicted onshore wind speed () with the final CATB model, as well as their difference in absolute value and the RMSE metric for 3045 observations, in Figure 5. From Figure 5, it is clear that the CATB model is able to forecast the trend followed by the real onshore wind speed. Despite this, it is possible to clearly distinguish two zones: A and B (Figure 5). In the first one, there is a fine balance between overestimating and underestimating wind speed. In almost 55% of the observations belonging to A, the forecasted wind speed is under the real value, while the opposite is true for all other observations. By contrast, the model tends to predict higher wind speeds than real ones in zone B, which is the case for about 95% of the corresponding observations. In this regard, it is important to note that the standard deviation of real wind speed in A is more than twice that of zone B. Quantitatively, the mean bias error (MBE) indicates an average underestimation of approximately −0.25 m/s in zone A and an overestimation of +0.35 m/s in zone B.
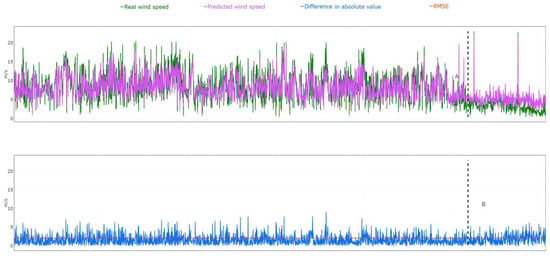
Figure 5.
Spearman correlation coefficients for the onshore and offshore variables for the period 2010–2012 (double column width figure. To be printed in colour online and in greyscale in the printed version of the paper).
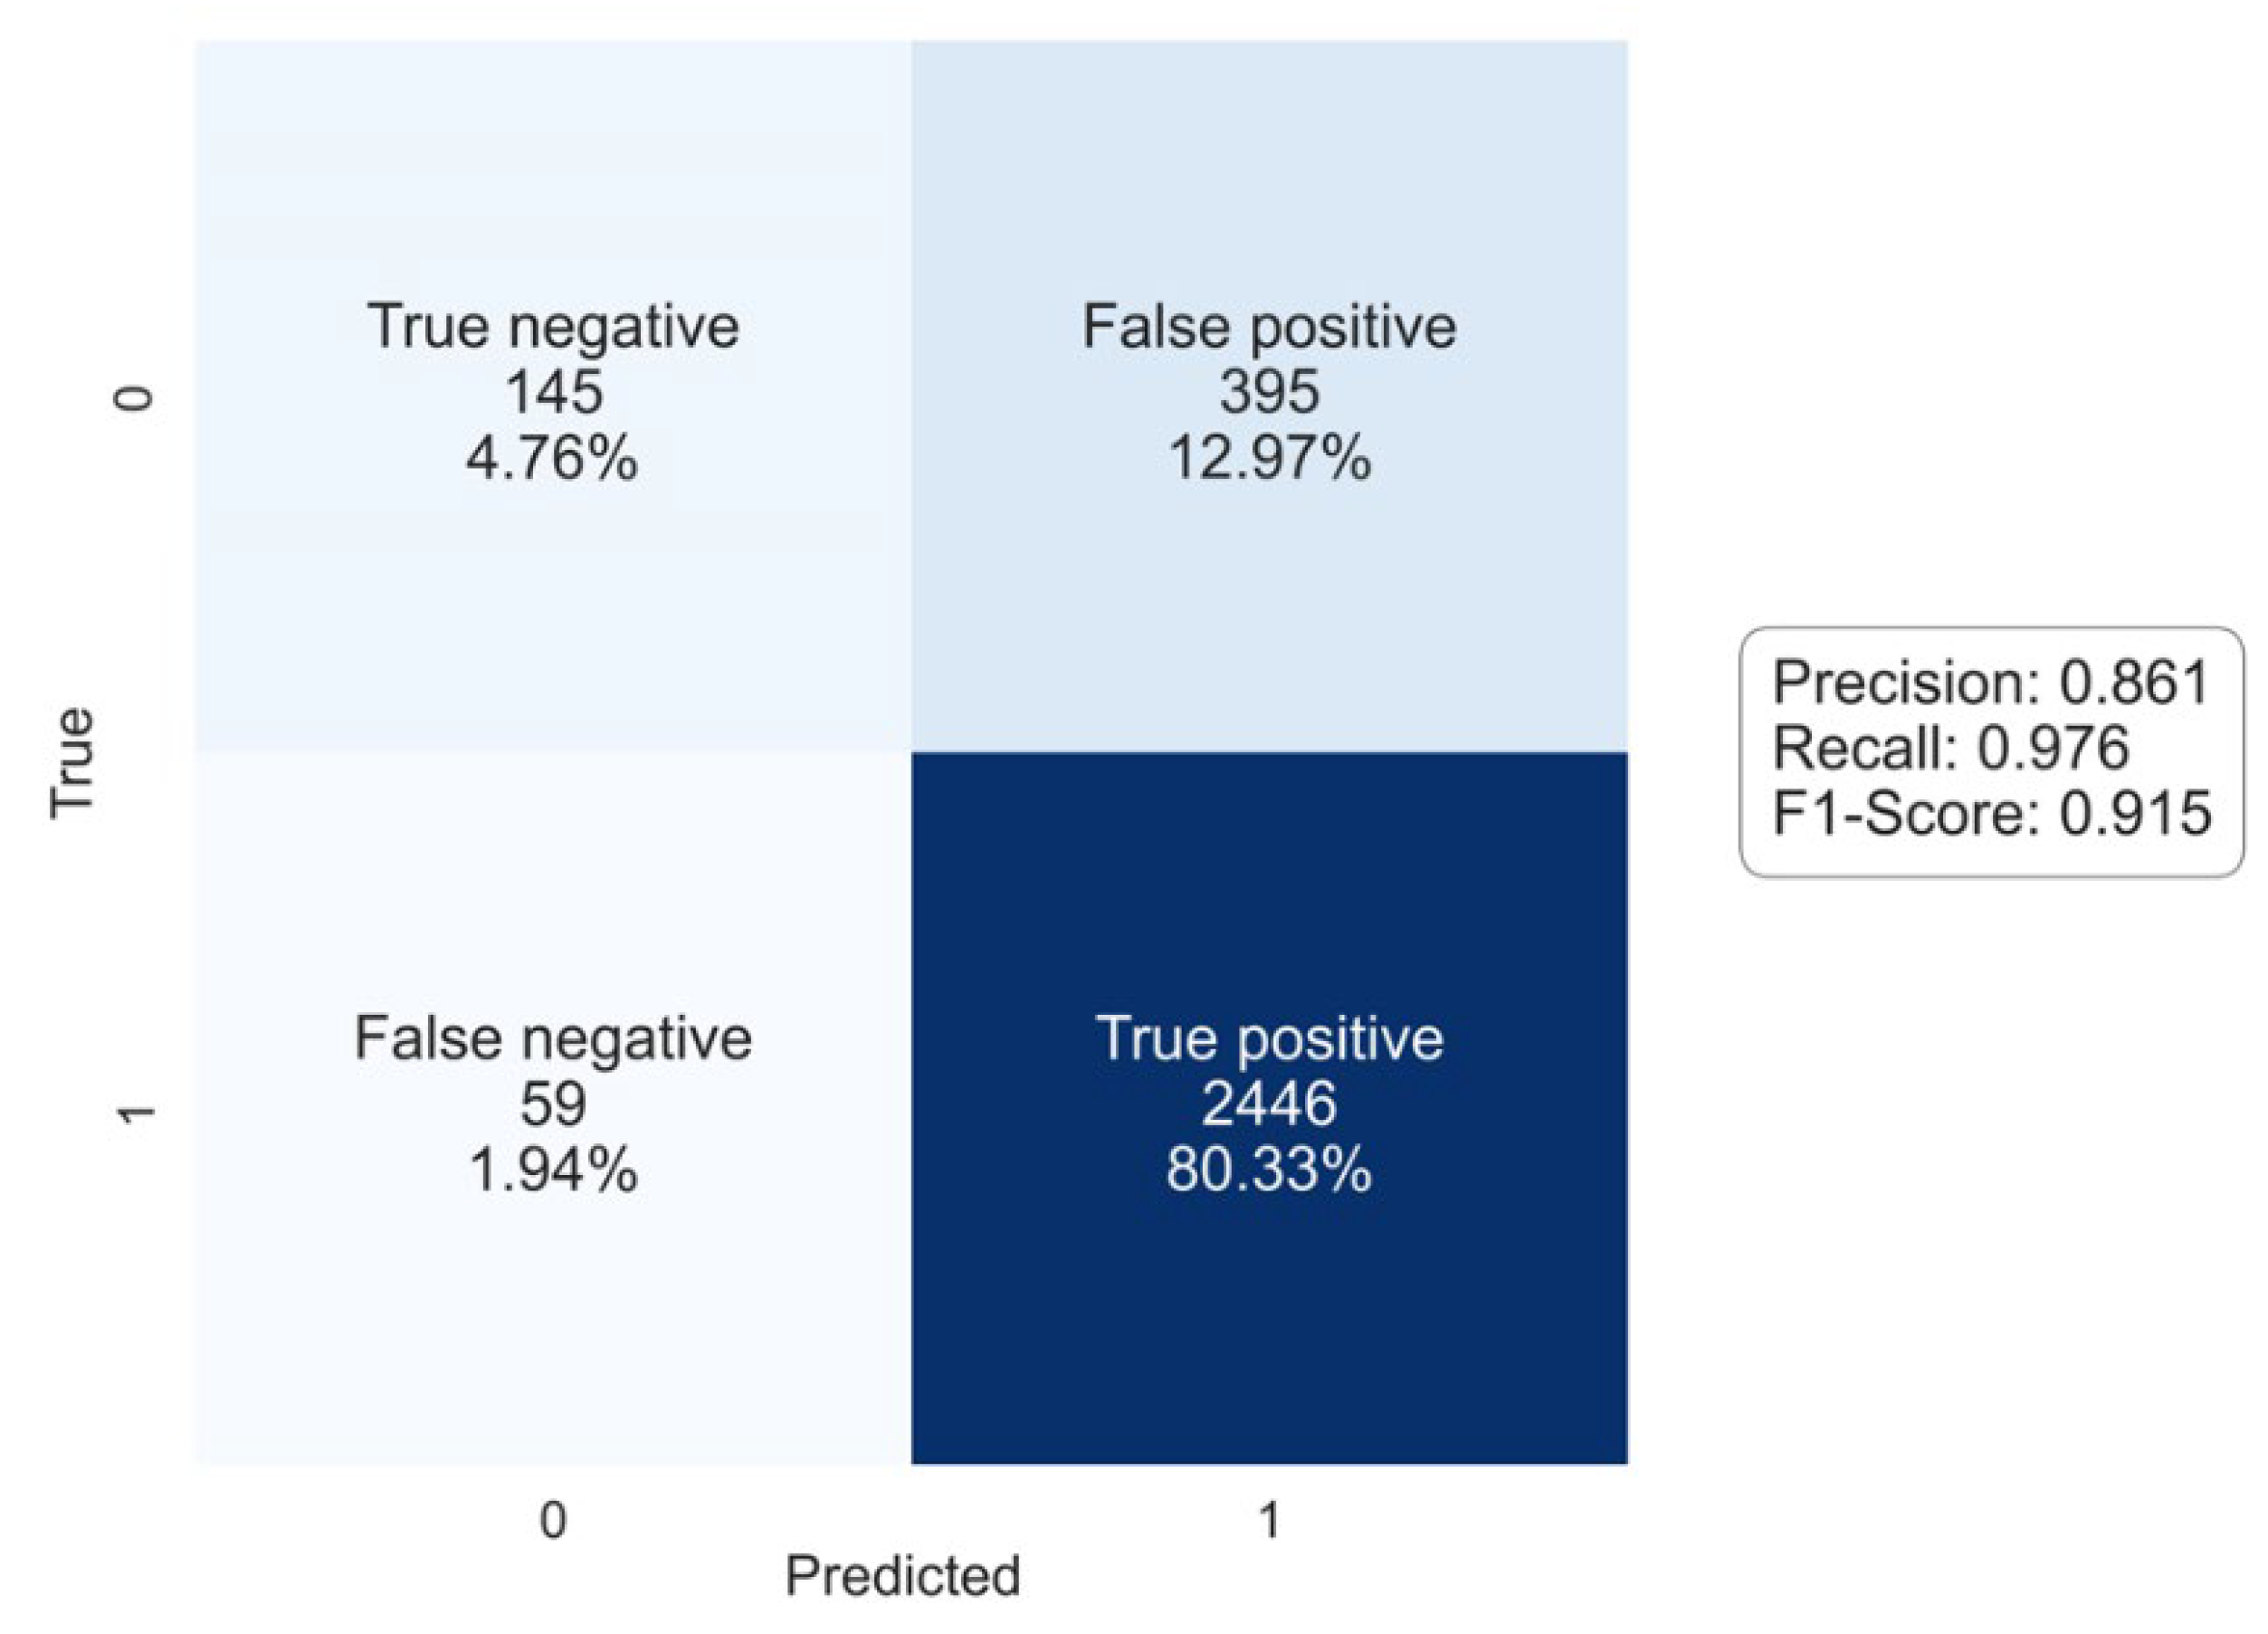
On the other hand, it is also interesting to analyse the capacity of the model to predict wind farm operating conditions 24 h in advance. Cut-in and cut-out wind speeds of 4 and 25 m/s, respectively, are assumed for such a purpose. The results, including precision, recall, and F1-score [65,66,67,68] are summarised in Figure 6. In this sense, in 85% of the observations, the model has been able to correctly predict the operating conditions of the wind farm. This is a remarkable reliability for programming the maintenance activities in those moments in which the conditions for generating electricity are not met.
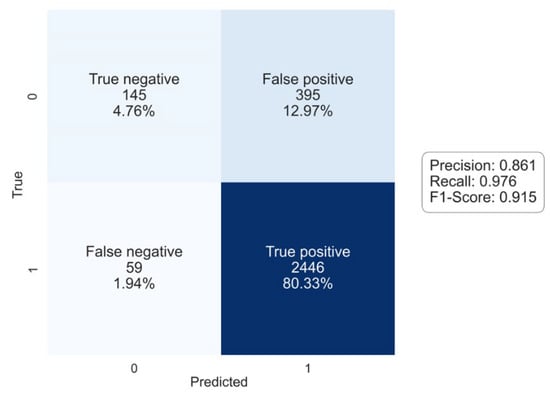
Figure 6.
Confusion matrix for the prediction of the onshore wind farm operating conditions with the CATB model. (Single column-width figure. To be printed in colour online and in greyscale in the printed version of the paper).
4.3. Onshore Wind Speed Forecasting: Alternative Time Horizons
The methodology was also applied to the same case study for the aim of forecasting wind speed with other time horizons. In particular, 4, 8, and 12 h of time lag were also considered, as shown in Table 7. The shorter the time horizon of the prediction, the lesser the error committed. The most relevant predictor variables resulted in being the same for the three-time horizons: average wind direction (Dw), average wind speed (Ws), mean direction of origin of the waves (Dwa), average air temperature (Ta), and water surface temperature (Tw). Compared to the 24 h results, the atmospheric pressure (P) and the spectral significant height (Hss) have been replaced by Dw and Ws. Nevertheless, as previously commented, there is a certain correlation between Ws and Hss.

Table 7.
Forecasting performance of the proposed methodology with 4, 8, and 12 h of time lag.
The time-lag analysis revealed a clear decrease in predictive accuracy as the forecasting horizon increased. Specifically, the average RMSE rose from approximately 1.10 m/s at 6 h to 1.65 m/s at 12 h, 2.10 m/s at 18 h, and 2.45 m/s at 24 h, corresponding to a cumulative degradation of about 35–40%. This trend is consistent with the increasing uncertainty associated with atmospheric variability over longer prediction intervals.
From an operational standpoint, this pattern suggests that while offshore-based models can provide reliable guidance for day-ahead planning (up to 24 h), their precision is better suited for strategic scheduling and maintenance support, rather than real-time control applications. Consequently, integrating these models with short-term onshore forecasts could enhance the overall robustness of hybrid wind prediction systems.
4.4. Onshore Wind Speed Forecasting: Additional Experiments
Finally, a series of experiments have been carried out with the aim of testing whether better results can be achieved by adding or removing certain predictor variables. Specifically, the following cases have been tested: (i) including the hour at which each parameter is measured as a predictor variable (Experiment 1), (ii) removing the month as a predictor variable (Experiment 2), (iii) using only wave parameters and the month as predictor variables (Experiment 3), (iv) the same as in Experiment 3, but using only oceanographic variables (Experiment 4), and (v) the same as the two previous cases, but now, using only meteorological variables (Experiment 5). All these tests have been developed for a time horizon of 24 h, using the CATB model with its final configuration. The results are included in Table 8.

Table 8.
Forecasting results for the additional experiments.
From Table 8, it is possible to state that considering the variable hour (Experiment 1) is not worthwhile, as it does not lead to an improvement in the prediction. However, the same is not true for the variable month (Experiment 2), as its elimination worsens the results. Furthermore, considering only one type of variable (wave, oceanographic, or meteorological) greatly reduces the accuracy of the model, as has been shown in Experiments 3–5. It would be expected that the same findings would be reached with 4, 8 and 12 h of time lag. Consequently, when the models were restricted to only one variable type, the RMSE increased by 20–35%, highlighting the complementary nature of the different offshore data sources. Regarding temporal predictors, the “month” variable proved more influential than “hour” in medium-term forecasting, reducing the RMSE by approximately 10% compared to models without seasonal information.
4.5. Limitations of the Proposed Methodology and Its Results
Despite the promising results of the proposed approach, it is important to point out some limitations of the results included in the previous sub-sections. On the one hand, the analysis relies on a relatively sparse dataset from a single case study (only one onshore location and one offshore locations), which can limit to a certain extent the generalisability of the findings to other onshore–offshore contexts with different characteristics. The data sparsity, in particular, after the dataset cleaning processes, also limits the capacity to fully capture variability and complex patterns in wind behaviour over time and space. Additionally, while hyperparameter tuning was performed for the promising models, it would have been desirable to do the same for the other models, as some of them could have reached promising results after their refinement. This could affect the relative comparison of model performance.
5. Conclusions and Future Developments
To effectively combat the climate crisis, humanity must accelerate the global energy transition toward renewable sources, with wind power playing a key strategic role in achieving a sustainable and decarbonised energy system. Wind energy is one of the technologies that puts less pressure on ecosystems. Nevertheless, the variable and intermittent nature of wind makes it difficult to integrate onshore and offshore wind farms into the power system. Therefore, many authors have worked on wind speed forecasting for different time horizons, but specially for the very-short- and short-terms. Despite this, there are still some gaps in the current knowledge that need to be filled.
This article proposes a methodology for the estimation of medium-term (24 h) wind speed at an onshore location using meteorological, oceanographic, and wave variables measured at a distant offshore location. This is the first time such an approach has been adopted in the specialised literature. The proposed methodology is based on the use of twenty-seven machine learning regression models, and it has been applied to a case study in Spain, with an onshore wind farm separated by a distance of about 200 km from the offshore location. Methodologies such as the one proposed in this study can contribute to the sustainability of the energy sector and, in particular, of the wind energy subsector. For instance, they can reduce both the financial and environmental costs associated with traditional on-site wind resource assessment campaigns. By taking advantage of existing offshore measurement infrastructure, it is possible to avoid or reduce the use of additional instrumentation on land, thus minimising environmental impacts. Moreover, such approaches may significantly shorten the lead times required for the installation of onshore wind farms, given that resource assessment campaigns are considerably time-consuming.
It is also important to remark that the proposed methodology is based on the use of established machine learning models implemented with open-source tools, which can be tested by using publicly accessible offshore and meteorological data. In other words, it can be easily applied by professionals in the wind energy sector without requiring specialised equipment or advanced computational resources. Even in its current state, its relative simplicity and transparency make it suitable for preliminary wind speed estimation in onshore projects.
The main conclusions drawn from this study are as follows:
1. The proposed methodology successfully integrates offshore meteorological, oceanographic, and wave data to forecast onshore wind speed for a 24 h horizon.
2. Among the 27 tested algorithms, the CatBoost regressor (CATB) achieved the best overall performance, providing a robust balance between accuracy and computational efficiency.
3. Adequate accuracy was achieved using relatively simple machine learning techniques, making the approach easily applicable to operational environments such as coastal forecasting systems and wind farm planning.
4. The use of offshore predictors introduces an innovative perspective that extends forecasting capability beyond local measurements and improves temporal anticipation of inland wind events.
5. Seasonal information—represented by the month variable—proved to be a key predictor, reinforcing the importance of incorporating temporal context into wind forecasting models.
6. The methodology demonstrates scalability and adaptability, offering potential for integration into hybrid systems that combine offshore data with short-term onshore forecasts to enhance decision-making in renewable energy operations.
7. Future research should explore the use of reanalysis datasets and coupled atmospheric–ocean models to further improve spatial resolution and extend forecasting horizons. Additionally, future developments should explore the inclusion of complementary predictor variables—such as solar radiation, relative humidity, and atmospheric stability indices—to capture broader meteorological influences. Testing the methodology across diverse geographic regions and climatic conditions would also help evaluate its generalisability and robustness for global wind forecasting applications.
Many of the previous conclusions are expected to be valid for other case studies. Regarding future developments, some lines of action are proposed. On one hand, other prediction techniques could be tested, e.g., neural networks or simple hybrid models. On the other hand, it would be interesting to repeat this study, but, in this case, using combined offshore data from several locations at a similar distance from the onshore wind farm.
Furthermore, it would also be interesting to concentrate on a more selective set of models, thereby reducing complexity and enabling a more detailed analysis. This would also facilitate the elimination of look-ahead bias, which may have influenced the current findings, specifically by configuring models for real-world applications. In addition, a more thorough hyperparameter tuning process could be implemented, potentially leading to improved predictive performance compared to that presented in this study, once the proposed approach has proven to be promising.
It is also important to remark that the RMSE for overfitting control introduced in this study serves as a new metric to balance model accuracy and generalisation by penalising discrepancies between training and test performance. However, its efficacy has not yet been formally validated. Future research should focus on rigorous statistical analysis of this metric, including comparisons with established techniques for overfitting detection and validation.
Another future line of work involves performing comprehensive sensitivity and uncertainty analyses to better characterise the robustness and reliability of the proposed methodology. In a similar vein, future work could benefit from the incorporation of statistical tests (paired t-tests or non-parametric tests (Friedman)), to confirm whether observed differences among different machine learning models are significant of, rather than attributable to, random variation.
Author Contributions
Conceptualisation, D.S.-P., J.J.C.B. and J.A.O.; methodology, D.S.-P., J.J.C.B. and J.A.O.; software, D.S.-P., J.J.C.B. and J.A.O.; validation, D.S.-P., J.J.C.B. and J.A.O.; formal analysis, D.S.-P., J.J.C.B. and J.A.O.; investigation, D.S.-P., J.J.C.B. and J.A.O.; resources, D.S.-P., J.J.C.B. and J.A.O.; data curation, D.S.-P., J.J.C.B. and J.A.O.; writing—original draft preparation, D.S.-P., J.J.C.B. and J.A.O.; writing—review and editing, D.S.-P., J.J.C.B. and J.A.O.; visualisation, D.S.-P., J.J.C.B. and J.A.O.; supervision, D.S.-P., J.J.C.B. and J.A.O.; project administration, D.S.-P., J.J.C.B. and J.A.O.; funding acquisition, D.S.-P., J.J.C.B. and J.A.O. All authors have read and agreed to the published version of the manuscript.
Funding
This research received no external funding.
Data Availability Statement
The data presented in this study are available on request from the corresponding author due to it was provided by Puertos del Estado.
Acknowledgments
The authors would like to thank “Puertos del Estado” for providing the data for the offshore variables.
Conflicts of Interest
The authors declare no conflicts of interest.
Abbreviations
| AdaBoost | adaptative boosting |
| AI | artificial intelligence |
| ANFIS | adaptive neuro fuzzy inference system |
| ANN | artificial neural network |
| AR | autoregressive |
| ARD | automatic relevance determination |
| ARMA | autoregressive moving average |
| ARIMA | autoregressive integrated moving average |
| AWNN | adaptive wavelet neural network |
| Bi-LSTM | bidirectional long-short term memory |
| BP | back propagation |
| BR | bagging regressor |
| BRR | Bayesian ridge regression |
| CATB | CatBoost regressor |
| CEEMDAN | complete ensemble empirical mode decomposition with adaptive noise |
| CNN | convolutional neural network |
| CSA | crow search algorithm |
| CTSR | contextual time series representation |
| DBN | deep belief network |
| DEA | differential evolution algorithm |
| DR | dummy regressor |
| DT | decision tree |
| EDA | exploratory data analysis |
| EEMD | ensemble empirical mode decomposition |
| ELM | extreme learning machine |
| ENN | Elman neural network |
| ENR | elastic net regression |
| EO | extremal optimisation |
| ESN | echo state network |
| ET | extra trees |
| EWT | empirical wavelet transform |
| FCM | fuzzy c-means |
| FIS | fuzzy inference system |
| FNN | feed-forward neural network |
| FPA | flower pollination algorithm |
| FS | feature selection |
| FWNSDEC | filter-wrapper non-dominated sorting differential evolution algorithm with K-medoid clustering |
| GA | genetic algorithm |
| GB | gradient boosting |
| GMDH | group method of data handling |
| GNDO | generalised normal distribution optimisation |
| GPR | gaussian process regression |
| GRNN | general regression neural network |
| GRU | gated recurrent unit |
| GS | grid search |
| HELM | hysteretic extreme learning machine |
| HC | hierarchical clustering |
| HR | Huber regressor |
| ICEEMDAN | improved complete ensemble empirical mode decomposition with adaptive noise |
| KDE | kernel density estimation |
| KELM | kernel extreme learning machine |
| KNN | K-nearest neighbours |
| KRR | kernel ridge regression |
| LAR | least angle regression |
| LASSO | least absolute shrinkage and selection operator |
| LASSO-LAR | LASSO least angle regression |
| LGBoost | light gradient boosting |
| LR | linear regression |
| LSTM | long short-term memory |
| MAE | mean absolute error |
| MCMC | Markov chain Monte Carlo |
| MDA | modified dragonfly algorithm |
| MFFNN | multilayer feed-forward neural network |
| MLP | multilayer perceptron |
| MMODA | modified multi-objective dragonfly algorithm |
| MOGWO | multi-objective grey wolf optimiser |
| MS | manual search |
| MST-GNN | multidimensional spatial–temporal graph neural network |
| NWP | numerical weather prediction |
| OMP | orthogonal matching pursuit |
| PAR | passive aggressive regressor |
| PDBM | predictive deep Boltzmann machine |
| PSO | particle swarm optimisation |
| PSR | phase space reconstruction |
| RANSAC | random sample consensus |
| RF | random forest |
| RFE | recursive feature elimination |
| RMSE | root mean squared error |
| RMSEOC | root mean squared error for overfitting control |
| RNN | recurrent neural network |
| RR | ridge regression |
| SCCS | simplex chaos cuckoo search |
| SHLDNN | shared-hidden-layer deep neural network |
| SSA | singular spectrum analysis |
| SVM | support vector machine |
| SVR | support vector regression |
| SVRM | support vector regression machine |
| SWLSTM | shared weight long-short term memory |
| TSR | Theil–Sen regressor |
| TDRF | top-down relevant feature search |
| VMD | variational mode decomposition |
| WT | wavelet transform |
| XGBoost | extreme gradient boosting |
References
- Cartelle Barros, J.J.; Lara Coira, M.; de la Cruz López, M.P.; del Caño Gochi, A.; Soares, I. Probabilistic multicriteria environmental assessment of power plants: A global approach. Appl. Energy 2020, 260, 114344. [Google Scholar] [CrossRef]
- Zhang, Y.; Pan, Z.; Wang, H.; Wang, J.; Zhao, Z.; Wang, F. Achieving wind power and photovoltaic power prediction: An intelligent prediction system based on a deep learning approach. Energy 2023, 283, 129005. [Google Scholar] [CrossRef]
- Sheng, Y.; Wang, H.; Yan, J.; Liu, Y.; Han, S. Short-term wind power prediction method based on deep clustering-improved Temporal Convolutional Network. Energy Rep. 2023, 9, 2118–2129. [Google Scholar] [CrossRef]
- Ma, Z.; Mei, G. A hybrid attention-based deep learning approach for wind power prediction. Appl. Energy 2022, 323, 119608. [Google Scholar] [CrossRef]
- Garrido-Perez, J.M.; Ordóñez, C.; Barriopedro, D.; García-Herrera, R.; Paredes, D. Impact of weather regimes on wind power variability in western Europe. Appl. Energy 2020, 264, 114731. [Google Scholar] [CrossRef]
- Zhang, Y.; Zhao, Y.; Shen, X.; Zhang, J. A comprehensive wind speed prediction system based on Monte Carlo and artificial intelligence algorithms. Appl. Energy 2022, 305, 117815. [Google Scholar] [CrossRef]
- Tian, Z.; Gai, M. A novel hybrid wind speed prediction framework based on multi-strategy improved optimizer and new data pre-processing system with feedback mechanism. Energy 2023, 281, 128225. [Google Scholar] [CrossRef]
- Neshat, M.; Nezhad, M.M.; Abbasnejad, E.; Mirjalili, S.; Tjernberg, L.B.; Astiaso Garcia, D.; Alexander, B.; Wagner, M. A deep learning-based evolutionary model for short-term wind speed forecasting: A case study of the Lillgrund offshore wind farm. Energy Convers. Manag. 2021, 236, 114002. [Google Scholar] [CrossRef]
- Wu, Q.; Zheng, H.; Guo, X.; Liu, G. Promoting wind energy for sustainable development by precise wind speed prediction based on graph neural networks. Renew. Energy 2022, 199, 977–992. [Google Scholar] [CrossRef]
- Liu, L.; Wang, J.; Li, J.; Wei, L. Monthly wind distribution prediction based on nonparametric estimation and modified differential evolution optimization algorithm. Renew. Energy 2023, 217, 119099. [Google Scholar] [CrossRef]
- Chen, W.; Zhou, H.; Cheng, L.; Xia, M. Prediction of regional wind power generation using a multi-objective optimized deep learning model with temporal pattern attention. Energy 2023, 278, 127942. [Google Scholar] [CrossRef]
- Parri, S.; Teeparthi, K.; Kosana, V. A hybrid VMD based contextual feature representation approach for wind speed forecasting. Renew. Energy 2023, 219, 119391. [Google Scholar] [CrossRef]
- Lu, P.; Ye, L.; Zhao, Y.; Dai, B.; Pei, M.; Li, Z. Feature extraction of meteorological factors for wind power prediction based on variable weight combined method. Renew. Energy 2021, 179, 1925–1939. [Google Scholar] [CrossRef]
- Jiang, P.; Liu, Z.; Niu, X.; Zhang, L. A combined forecasting system based on statistical method, artificial neural networks, and deep learning methods for short-term wind speed forecasting. Energy 2021, 217, 119361. [Google Scholar] [CrossRef]
- Couto, A.; Estanqueiro, A. Enhancing wind power forecast accuracy using the weather research and forecasting numerical model-based features and artificial neuronal networks. Renew. Energy 2022, 201, 1076–1085. [Google Scholar] [CrossRef]
- Lagomarsino-Oneto, D.; Meanti, G.; Pagliana, N.; Verri, A.; Mazzino, A.; Rosasco, L.; Seminara, A. Physics informed machine learning for wind speed prediction. Energy 2023, 268, 126628. [Google Scholar] [CrossRef]
- Cartelle Barros, J.J.; Lamas Galdo, M.I.; Orosa García, J.A.; Pérez Canosa, J.M.; Santiago Caamaño, L. Characteristics of the onshore and offshore wind resource. In Reference Module in Earth Systems and Environmental Sciences; Elsevier: Amsterdam, The Netherlands, 2023. [Google Scholar] [CrossRef]
- Yang, M.; Guo, Y.; Huang, Y. Wind power ultra-short-term prediction method based on NWP wind speed correction and double clustering division of transitional weather process. Energy 2023, 282, 128947. [Google Scholar] [CrossRef]
- Bouche, D.; Flamary, R.; d’Alché-Buc, F.; Plougonven, R.; Clausel, M.; Badosa, J.; Drobinski, P. Wind power predictions from nowcasts to 4-hour forecasts: A learning approach with variable selection. Renew. Energy 2023, 211, 938–947. [Google Scholar] [CrossRef]
- Yaghoubirad, M.; Azizi, N.; Farajollahi, M.; Ahmadi, A. Deep learning-based multistep ahead wind speed and power generation forecasting using direct method. Energy Convers. Manag. 2023, 281, 116760. [Google Scholar] [CrossRef]
- Valdivia-Bautista, S.M.; Domínguez-Navarro, J.A.; Pérez-Cisneros, M.; Vega-Gómez, C.J.; Castillo-Téllez, B. Artificial Intelligence in Wind Speed Forecasting: A Review. Energies 2023, 16, 2457. [Google Scholar] [CrossRef]
- Lv, S.X.; Wang, L. Multivariate wind speed forecasting based on multi-objective feature selection approach and hybrid deep learning model. Energy 2023, 263, 126100. [Google Scholar] [CrossRef]
- Lu, P.; Ye, L.; Pei, M.; Zhao, Y.; Dai, B.; Li, Z. Short-term wind power forecasting based on meteorological feature extraction and optimization strategy. Renew. Energy 2022, 184, 642–661. [Google Scholar] [CrossRef]
- Ogliari, E.; Guilizzoni, M.; Giglio, A.; Pretto, S. Wind power 24-h ahead forecast by an artificial neural network and an hybrid model: Comparison of the predictive performance. Renew. Energy 2021, 178, 1466–1474. [Google Scholar] [CrossRef]
- Zhu, S.; Yuan, X.; Xu, Z.; Luo, X.; Zhang, H. Gaussian mixture model coupled recurrent neural networks for wind speed interval forecast. Energy Convers. Manag. 2019, 198, 111772. [Google Scholar] [CrossRef]
- Sharifian, A.; Ghadi, M.J.; Ghavidel, S.; Li, L.; Zhang, J. A new method based on Type-2 fuzzy neural network for accurate wind power forecasting under uncertain data. Renew. Energy 2018, 120, 220–230. [Google Scholar] [CrossRef]
- Santamaría-Bonfil, G.; Reyes-Ballesteros, A.; Gershenson, C. Wind speed forecasting for wind farms: A method based on support vector regression. Renew. Energy 2016, 85, 790–809. [Google Scholar] [CrossRef]
- Kim, D.; Hur, J. Short-term probabilistic forecasting of wind energy resources using the enhanced ensemble method. Energy 2018, 157, 211–226. [Google Scholar] [CrossRef]
- Liu, C.L.; Chang, T.Y.; Yang, J.S.; Huang, K.B. A deep learning sequence model based on self-attention and convolution for wind power prediction. Renew. Energy 2023, 219, 119399. [Google Scholar] [CrossRef]
- Zhang, Y.; Pan, G.; Chen, B.; Han, J.; Zhao, Y.; Zhang, C. Short-term wind speed prediction model based on GA-ANN improved by VMD. Renew. Energy 2020, 156, 1373–1388. [Google Scholar] [CrossRef]
- García Márquez, F.P.; Peinado Gonzalo, A. A Comprehensive Review of Artificial Intelligence and Wind Energy. Arch. Comput. Methods Eng. 2022, 29, 2935–2958. [Google Scholar] [CrossRef]
- Hong, Y.Y.; Rioflorido, C.L.P.P. A hybrid deep learning-based neural network for 24-h ahead wind power forecasting. Appl. Energy 2019, 250, 530–539. [Google Scholar] [CrossRef]
- Kisvari, A.; Lin, Z.; Liu, X. Wind power forecasting—A data-driven method along with gated recurrent neural network. Renew. Energy 2021, 163, 1895–1909. [Google Scholar] [CrossRef]
- Zhang, C.Y.; Chen, C.L.P.; Gan, M.; Chen, L. Predictive Deep Boltzmann Machine for Multiperiod Wind Speed Forecasting. IEEE Trans. Sustain. Energy 2015, 6, 1416–1425. [Google Scholar] [CrossRef]
- Chitsazan, M.A.; Sami Fadali, M.; Trzynadlowski, A.M. Wind speed and wind direction forecasting using echo state network with nonlinear functions. Renew. Energy 2019, 131, 879–889. [Google Scholar] [CrossRef]
- Ding, L.; Bai, Y.; Liu MDe Fan, M.H.; Yang, J. Predicting short wind speed with a hybrid model based on a piecewise error correction method and Elman neural network. Energy 2022, 244, 122630. [Google Scholar] [CrossRef]
- Xing, Z.; He, Y. Multi-modal multi-step wind power forecasting based on stacking deep learning model. Renew. Energy 2023, 215, 118991. [Google Scholar] [CrossRef]
- Wang, L.; Guo, Y.; Fan, M.; Li, X. Wind speed prediction using measurements from neighboring locations and combining the extreme learning machine and the AdaBoost algorithm. Energy Rep. 2022, 8, 1508–1518. [Google Scholar] [CrossRef]
- Memarzadeh, G.; Keynia, F. A new short-term wind speed forecasting method based on fine-tuned LSTM neural network and optimal input sets. Energy Convers. Manag. 2020, 213, 112824. [Google Scholar] [CrossRef]
- Yang, B.; Zhong, L.; Wang, J.; Shu, H.; Zhang, X.; Yu, T.; Sun, L. State-of-the-art one-stop handbook on wind forecasting technologies: An overview of classifications, methodologies, and analysis. J. Clean. Prod. 2021, 283, 124628. [Google Scholar] [CrossRef]
- Lipu, M.S.H.; Miah, M.S.; Hannan, M.A.; Hussain, A.; Sarker, M.R.; Ayob, A.; Saad, M.H.M.; Mahmud, S. Artificial Intelligence Based Hybrid Forecasting Approaches for Wind Power Generation: Progress, Challenges and Prospects. IEEE Access 2021, 9, 102460–102489. [Google Scholar] [CrossRef]
- Liu, H.; Li, Y.; Duan, Z.; Chen, C. A review on multi-objective optimization framework in wind energy forecasting techniques and applications. Energy Convers. Manag. 2020, 224, 113324. [Google Scholar] [CrossRef]
- Wang, J.; An, Y.; Li, Z.; Lu, H. A novel combined forecasting model based on neural networks, deep learning approaches, and multi-objective optimization for short-term wind speed forecasting. Energy 2022, 251, 123960. [Google Scholar] [CrossRef]
- Duan, J.; Zuo, H.; Bai, Y.; Duan, J.; Chang, M.; Chen, B. Short-term wind speed forecasting using recurrent neural networks with error correction. Energy 2021, 217, 119397. [Google Scholar] [CrossRef]
- Qu, Z.; Mao, W.; Zhang, K.; Zhang, W.; Li, Z. Multi-step wind speed forecasting based on a hybrid decomposition technique and an improved back-propagation neural network. Renew. Energy 2019, 133, 919–929. [Google Scholar] [CrossRef]
- Zhang, Z.; Ye, L.; Qin, H.; Liu, Y.; Wang, C.; Yu, X.; Yin, X.; Li, J. Wind speed prediction method using Shared Weight Long Short-Term Memory Network and Gaussian Process Regression. Appl. Energy 2019, 247, 270–284. [Google Scholar] [CrossRef]
- Santhosh, M.; Venkaiah, C.; Vinod Kumar, D.M. Ensemble empirical mode decomposition based adaptive wavelet neural network method for wind speed prediction. Energy Convers. Manag. 2018, 168, 482–493. [Google Scholar] [CrossRef]
- Khosravi, A.; Machado, L.; Nunes, R.O. Time-series prediction of wind speed using machine learning algorithms: A case study Osorio wind farm, Brazil. Appl. Energy 2018, 224, 550–566. [Google Scholar] [CrossRef]
- Moreno, S.R.; dos Santos Coelho, L. Wind speed forecasting approach based on Singular Spectrum Analysis and Adaptive Neuro Fuzzy Inference System. Renew. Energy 2018, 126, 736–754. [Google Scholar] [CrossRef]
- Hu, Y.L.; Chen, L. A nonlinear hybrid wind speed forecasting model using LSTM network, hysteretic ELM and Differential Evolution algorithm. Energy Convers. Manag. 2018, 173, 123–142. [Google Scholar] [CrossRef]
- Chen, J.; Zeng, G.Q.; Zhou, W.; Du, W.; Lu, K.D. Wind speed forecasting using nonlinear-learning ensemble of deep learning time series prediction and extremal optimization. Energy Convers. Manag. 2018, 165, 681–695. [Google Scholar] [CrossRef]
- Hu, Q.; Zhang, R.; Zhou, Y. Transfer learning for short-term wind speed prediction with deep neural networks. Renew. Energy 2016, 85, 83–95. [Google Scholar] [CrossRef]
- Ramasamy, P.; Chandel, S.S.; Yadav, A.K. Wind speed prediction in the mountainous region of India using an artificial neural network model. Renew. Energy 2015, 80, 338–347. [Google Scholar] [CrossRef]
- Pedregosa, F.; Varoquaux, G.; Gramfort, A.; Michel, V.; Thirion, B.; Grisel, O.; Blondel, M.; Prettenhofer, P.; Weiss, R.; Dubourg, V. Scikit-learn: Machine Learning in Python. J. Mach. Learn. Res. 2011, 12, 2825–2830. [Google Scholar]
- XGBoost Python Package. Available online: https://xgboost.readthedocs.io/en/stable/python/index.html (accessed on 26 June 2024).
- CatBoost Regressor n.d. Available online: https://catboost.ai/en/docs/concepts/python-reference_catboostregressor (accessed on 26 June 2024).
- Light Gradient Boosting Machine n.d. Available online: https://lightgbm.readthedocs.io/en/latest/index.html (accessed on 26 June 2024).
- Larochelle, H.; Erhan, D.; Courville, A.; Bergstra, J.; Bengio, Y. An empirical evaluation of deep architectures on problems with many factors of variation. In Proceedings of the 24th International Conference on Machine Learning, Corvallis, OR, USA, 20–24 June 2007; pp. 473–480. [Google Scholar] [CrossRef]
- Floudas, C.A.; Pardalos, P.M. Encyclopedia of Optimization, 2nd ed.; Springer: Berlin/Heidelberg, Germany, 2009. [Google Scholar]
- Ensor, K.; Glynn, P. Stochastic optimization via grid search. Lect. Appl. Math. 1997, 33, 89–100. [Google Scholar]
- Guyon, I.; Elisseeff, A. An introduction to variable and feature selection. J. Mach. Learn. Res. 2003, 3, 1157–1182. [Google Scholar]
- Bolón-Canedo, V.; Sánchez-Maroño, N.; Alonso-Betanzos, A.; Benítez, J.M.; Herrera, F. A review of microarray datasets and applied feature selection methods. Inf. Sci. 2014, 282, 111–135. [Google Scholar] [CrossRef]
- Puertos del Estado (Ministerio de Fomento del Gobierno de España). Forecast, Real Time Weather and Climate 2019. Available online: http://www.puertos.es/en-us/oceanografia/Pages/portus.aspx (accessed on 26 June 2024).
- Google Maps. Map with the Locations of the Cabo Silleiro Buoy and the Onshore Wind Farm n.d. Available online: https://www.google.com/maps (accessed on 21 June 2024).
- Mir, M.; Nasirzadeh, F.; Zakeri, M.; Hill, A.; Karmakar, C. Assessing neural markers of attention during exposure to construction noise using machine learning classification of electroencephalogram data. Build. Environ. 2024, 261, 111754. [Google Scholar] [CrossRef]
- Qian, Z.; Chen, M.; Sun, Z.; Zhang, F.; Xu, Q.; Guo, J.; Xie, Z.; Zhang, Z. Simultaneous extraction of spatial and attributional building information across large-scale urban landscapes from high-resolution satellite imagery. Sustain. Cities Soc. 2024, 106, 105393. [Google Scholar] [CrossRef]
- Wang, Q.; Chen, D.; Li, M.; Li, S.; Wang, F.; Yang, Z.; Zhang, W.; Chen, S.; Yao, D. A novel method for petroleum and natural gas resource potential evaluation and prediction by support vector machines (SVM). Appl. Energy 2023, 351, 121836. [Google Scholar] [CrossRef]
- Zheng, J.; Wang, C.; Liang, Y.; Liao, Q.; Li, Z.; Wang, B. Deeppipe: A deep-learning method for anomaly detection of multi-product pipelines. Energy 2022, 259, 125025. [Google Scholar] [CrossRef]
Disclaimer/Publisher’s Note: The statements, opinions and data contained in all publications are solely those of the individual author(s) and contributor(s) and not of MDPI and/or the editor(s). MDPI and/or the editor(s) disclaim responsibility for any injury to people or property resulting from any ideas, methods, instructions or products referred to in the content. |
© 2025 by the authors. Licensee MDPI, Basel, Switzerland. This article is an open access article distributed under the terms and conditions of the Creative Commons Attribution (CC BY) license (https://creativecommons.org/licenses/by/4.0/).

