Abstract
The stability of absolute gravimeters during carriage-falling body separation is crucial for improving gravitational acceleration measurement accuracy. Transmission speed accuracy of the transmission system and system vibration are core factors determining this stability, while steel belt pre-tightening force, free-fall segment acceleration, and start-up segment displacement are key parameters influencing both. In-depth analysis of their coupling clarified their roles, and two objective function models (for speed accuracy and vibration) were established, with fitting accuracies R2 = 0.8976 and R2 = 0.8395, respectively. Since traditional single-objective optimization fails to balance “improving speed accuracy” and “suppressing vibration”, this study proposes a multi-objective optimization method: two Nondominated Sorting Genetic Algorithm II (NSGA-II) parameter sets were designed, Hypervolume (HV) index quantified solution set quality, and Wilcoxon signed-rank test was combined to determine the optimal parameter set; comparing the Global Criterion Method and Weighted Sum Method, the former was superior (no dimensional bias) and more suitable for this study, finally screening out the optimal parameter combination. Experimental results showed that the measured transmission speed accuracy was 0.09132 m/s (16.94% lower than the orthogonal experiment’s optimal level); the measured system vibration was 0.022 m/s2, falling within the orthogonal experiment’s optimal range. Consequently, separation moment stability was significantly enhanced, with its standard deviation reduced by 45% pre-optimization. This method achieves global balance in transmission system dynamic performance, providing an effective parameter optimization strategy for improving absolute gravimeter measurement accuracy.
1. Introduction
High-precision information on the absolute gravity field has substantial application value in fields such as fundamental surveying and mapping, resource exploration, and aerospace engineering [1,2,3]. Gravitational acceleration (g) refers to the acceleration experienced by objects on the Earth’s surface due to gravity. It is a fundamental physical quantity that characterizes the motion of objects caused by the Earth’s gravitational pull. Owing to factors including the Earth’s rotation, the centrifugal effect at the equator, variations in geological structure and density, differences in altitude, and the gravitational influences of the Moon and the Sun, the value of gravitational acceleration varies continuously across spatial and temporal scales [4,5]. Gravitational acceleration measurement has wide-ranging applications in metrological science, resource exploration, national defense, and geophysics [6,7,8,9]. The absolute gravimeter is an instrument that enables the direct and precise measurement of gravitational acceleration near the Earth’s surface [10,11]. It plays an essential role not only in seismic monitoring, crustal deformation detection, and defense-related research [12] but also in surveying and mapping, geophysical prospecting, sea-level and seismic monitoring, precise determination of the geoid, and studies of vertical crustal deformation. The accuracy of absolute gravimeters directly determines the reliability of gravity field data and reflects the technical capability for acquiring such data. In particular, the stability of the moment when the carriage separates from the falling body is a critical prerequisite for ensuring measurement accuracy. Any speed fluctuations or vibration disturbances during this separation process directly degrade measurement quality and introduce errors in the computation of gravitational acceleration.
Based on different working principles, absolute gravimeters can be classified as laser interferometric absolute gravimeters, atomic interferometric absolute gravimeters, and superconducting gravimeters. Among these, laser interferometric absolute gravimeters employ a Michelson interferometer to measure the free-fall displacement of a falling body (typically a corner-cube prism) while recording precise timing information. The gravitational acceleration value (g) is subsequently derived from displacement-time data [13]. During the operation of a laser interferometric absolute gravimeter, the transmission system functions as the core executive mechanism, and its performance is dictated by multiple factors. Transmission speed accuracy and system vibration are the most critical. Transmission speed accuracy reflects the degree of agreement between the actual and expected speed when the carriage drives the falling body, whereas system vibration describes the amplitude and frequency characteristics of oscillations in the transmission mechanism. Further investigation reveals that steel belt pre-tightening force (the initial tension applied to the steel belt in belt drive systems, ensuring no slackness, eliminating gaps between transmission components, balancing friction and deformation between the belt and pulleys, and preventing slippage), acceleration of the free-fall segment (the carriage’s acceleration during absolute gravimeter operation, from completion of separation from the falling body to adjustment to the preset state for receiving it), and displacement of the start-up segment (the actual distance traveled by the carriage in absolute gravimeters from the start of motion to the onset of separation from the falling body) are the main parameters influencing these two performance indicators. Moreover, strong coupling relationships exist among these parameters, transmission speed accuracy, and vibration. For example, insufficient pre-tightening force may cause belt slippage, reducing speed accuracy and amplifying vibration; in the early stage of free-fall motion, unstable conditions of the falling body not only disturb its trajectory but also introduce additional measurement errors [14,15]; and excessive acceleration can trigger start-stop shocks in the carriage. Thus, clarifying the coupling mechanisms among these parameters and achieving precise collaborative control constitute the key breakthrough for enhancing separation stability.
The performance improvement of absolute gravimeters relies on multi-dimensional optimization, involving the enhancement of several subsystems such as laser light sources, detection devices, vibration isolation systems, optical components, and transmission mechanisms. In the field of light source and detection technology for absolute gravimeters, Petr Křen [16] and his team optimized laser source parameters and the detection mechanism in their research on the FG5X absolute gravimeter. They pioneered the use of dual wavelengths (633 nm and 771 nm) to track the test mass and calculate gravitational acceleration. During their study, techniques such as the Fast Fourier Transform (FFT) frequency-sweeping filtering method were incorporated. The results demonstrated that the measurement consistency between the two wavelengths reached 2–4 microgal (µGal), while the 771 nm wavelength was found to exhibit low-frequency noise. Furthermore, they assessed the sensitivity of different wavelengths, providing essential guidance for the design of absolute gravimeters. In terms of vibration interference control, Zhou [17] and colleagues investigated the influence of start-stop vibration from V-shaped linear ultrasonic motors on measurements. Through theoretical analysis and experimental validation, they concluded that this type of motor can satisfy driving requirements while reducing system complexity and overall weight. Yao Jiamin [18] and co-workers carried out theoretical analysis and simulation modeling of four typical vibration isolation systems. Using various vibration types as input, they analyzed the effect of reference mirror vibration on gravity measurements. Comparative experiments revealed that under fixed-phase vibration noise, reference mirror vibration could introduce system errors exceeding 10 µGal; however, improvements in vibration isolation or error correction effectively enhanced the accuracy of domestic laser interferometric absolute gravimeters. With regard to optical system optimization, Ch. Rothleitner and B. Andreas [19] focused on improving optical components. Using a Shack–Hartmann sensor, they measured the beam parameters of four commercial collimators. By combining numerical simulations with experiments on the FG5X absolute gravimeter, they concluded that beam divergence contributes to deviations in gravity measurement, thus providing a basis for further optimization of optical systems. In the area of fault diagnosis, Hu Ruo [20] and his team proposed an optimized method to address accuracy reduction caused by early-stage faults in absolute gravimeters. They integrated Variational Mode Decomposition (VMD) with optimized parameters and LightGBM. By tuning VMD parameters via the Sparrow Search Algorithm (SSA) and extracting multi-scale permutation entropy as fault feature vectors, they achieved precise diagnosis of early faults in cam-driven absolute gravimeters, attaining a recognition accuracy of 98.41%. In the field of quantum technology applications, Christophe Cassens [21] and colleagues developed a gravimeter based on a Bose–Einstein condensate (BEC). Incorporating relevant quantum technologies, this instrument achieved absolute gravity measurement beyond the standard quantum limit, opening new avenues for improving gravimeter performance. For hardware design and dynamic adjustment of vibration isolation systems, Li Zilu [22] and colleagues designed an automatic zero-adjustment scheme for the vibration isolation system of a laser interferometric absolute gravimeter. The system, based on an STM32 microcontroller combined with a zero-adjustment motor mechanism, acquired the zero position through communication and controlled the motor for correction. Joint debugging confirmed that this system maintained long-term stability and high precision, with accuracy better than 10 µGal over 20 consecutive days. From the above analysis, it is evident that existing studies on absolute gravimeters cover multiple aspects, including light source and detection technology, vibration interference control, optical optimization, fault diagnosis, quantum technology integration, and hardware design with dynamic vibration isolation. However, research on the crucial issue of stability at the carriage-falling body separation moment remains relatively scarce. Moreover, most existing work is restricted to improving a single performance indicator or component, and no study has yet addressed multi-objective collaborative optimization of transmission system parameters. This represents a significant gap relative to the demand for global balance in the dynamic performance of transmission systems.
In research on the correlation between transmission system parameters and performance, Lu Qiang [23] and colleagues studied the steel belt pre-tightening force. They found that pre-tightening force significantly influences system output characteristics: a higher pre-tightening force reduces the output angle deviation of the belt system, thereby enhancing output accuracy and achieving smoother transmission. Lu Zhiqiang [24] investigated data-driven control methods for linear induction motors, analyzing the effect of controller parameters on speed regulation. He employed the Deep Deterministic Policy Gradient (DDPG) algorithm to optimize controller parameters, achieving optimal motor speed control and improving real-time tracking performance. However, such studies largely remain limited to the independent influence of single parameters on specific performance indicators. They do not sufficiently explore the coupling effects among multiple parameters on system-level performance, nor attempt to construct parameter-performance coupling models.
With regard to parameter optimization methods, multi-objective optimization algorithms are well-suited to handling trade-offs among multiple performance indicators. Among them, NSGA-II (Nondominated Sorting Genetic Algorithm II) has been widely applied in fields such as mechanical transmission and servo systems, due to its rapid convergence and excellent distribution of solution sets. Reference [25] employed it to optimize end-milling process parameters, balancing machining efficiency and surface precision. Some studies [26,27] applied NSGA-II to optimize robot motion parameters, reducing joint wear and energy consumption while enhancing efficiency. Despite its successful application in mechanical manufacturing and robotics, the algorithm has not yet been applied to parameter optimization of transmission systems in absolute gravimeters. In particular, no research has yet solved the Pareto optimal solution set of relevant objective functions in this context, nor attempted to enhance carriage-falling body separation stability by identifying optimal parameter combinations.
Aiming at the limitations in existing research on parameter optimization for transmission systems in laser interferometric absolute gravimeters, this paper proposes three core innovations: first, it systematically clarifies the intrinsic relationships between the three parameters (steel belt pre-tightening force, acceleration of the free-fall segment, and displacement of the start-up segment) and the two core indicators (transmission speed accuracy and system vibration) for the first time, filling the gap in exploring parameter-performance coupling in such transmission systems; second, it introduces multi-objective optimization methods (NSGA-II algorithm + Global Criterion Method) into the field of absolute gravimeters for the first time, realizing the acquisition of dual-objective Pareto optimal solution sets and engineering-oriented parameter screening; third, through precise measurement of the carriage-falling body separation moment and related motion parameters, it directly verifies the improved effect of separation stability, providing targeted support for enhancing gravitational acceleration measurement accuracy.
Therefore, in view of the limitations of existing research on parameter optimization for transmission systems in laser interferometric absolute gravimeters, this paper proposes a multi-objective optimization-based collaborative adjustment method for steel belt pre-tightening force, acceleration of the free-fall segment, and displacement of the start-up segment. The core objective of this method is to balance the multi-dimensional performance goals of transmission speed accuracy and vibration suppression. This method systematically analyzes the relationships between these three parameters and the two core indicators for the first time, filling the gap in exploring parameter-performance coupling in the transmission systems of absolute gravimeters. Meanwhile, it represents the first introduction of multi-objective optimization methods into the field of absolute gravimeters—by applying the NSGA-II algorithm to optimize the parameters of such transmission systems and obtaining the Pareto optimal solution set for dual objectives, and further integrating the Global Criterion Method to screen out the optimal parameter combination, it provides a new paradigm for parameter optimization of similar mechanical transmission systems in precision instruments. On this basis, through precise measurement and analysis of the separation time point of the carriage and falling body as well as relevant motion parameters, the stability of the carriage-falling body separation moment is verified, providing theoretical support and methodological strategies for improving the measurement accuracy of absolute gravimeters.
2. Multi-Objective Optimization Scheme for the Transmission System of Absolut Gravimeters
2.1. Hardware and Software Equipment Configuration for Absolute Gravimeter Transmission System Test
The test setup consists of an absolute gravimeter, a laser vibrometer, a brushed DC motor, a variable-capacitance accelerometer, a host computer, a motor control box, a linear power supply, a tension meter, a rubidium clock, and a data acquisition system. Among these devices, the laser vibrometer measures the actual falling speed of the carriage; the brushed DC motor drives the carriage by means of the friction of the steel belt; the variable-capacitance accelerometer collects vibration signals of the transmission mechanism; the motor control box regulates the motion state of the motor; the rubidium clock, integrated within the motor control box, provides a high-precision timing reference for the tests; the tension meter measures the steel belt pre-tightening force; and the linear power supply ensures stable electrical power for the system. The experimental configuration is illustrated in Figure 1. Specific parameters of the test equipment are provided in Table 1.
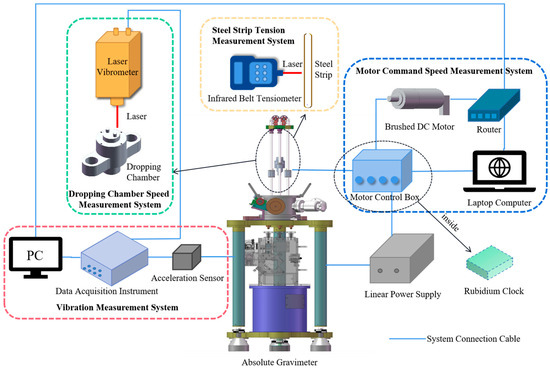
Figure 1.
Coupling of test equipment for the transmission system of absolute gravimeters.

Table 1.
Main Parameters of Test Equipment.
In terms of data acquisition, processing, and visualization: the actual speed of the carriage uses Coinv DASP V11 as the dedicated data acquisition tool; motor command speed is captured via the “plot” mode in PEWIN32PRO software (a specialized tool for motor parameter monitoring); and vibration signals are synchronized and stored using Coinv DASP V11. All acquired raw data are processed using MATLAB R2022a, and the results are visualized using Origin 2024.
The above test equipment configuration, coupled with the dedicated data acquisition, processing, and visualization tools, provides comprehensive and reliable support for quantifying key performance indicators of the transmission system. Specifically, the hardware ensures accurate collection of core physical signals, while the software tools enable systematic signal synchronization, feature extraction, and result presentation. Together, they lay a solid foundation for accurately measuring the two core indicators that determine separation stability—indicators which will be defined, modeled, and identified as the output objectives of the optimization in Section 2.2.
2.2. Selection of Output Objectives for the Transmission System of Absolute Gravimeters
2.2.1. Objective Function for Transmission Speed Accuracy
Transmission speed accuracy (ζRMSE) is a critical indicator for evaluating the dynamic performance of mechanical transmission systems. Its essence lies in describing the fidelity with which motion parameters at the input of the transmission chain are transferred to the output. In the steel belt transmission system of an absolute gravimeter, this indicator directly determines the coordination between the carriage and the falling body, and is thus a prerequisite for ensuring accurate gravity measurement. Speed tracking error is an essential parameter reflecting the dynamic response of the transmission system. It is defined as the deviation between the instantaneous command speed and the actual operating speed during transmission, expressed as
wherein vcmd denotes the motor command speed, and vact denotes the actual carriage speed.
The quantification of transmission speed accuracy is expressed by the dynamic accuracy indicator—transmission error. Transmission error is evaluated using the Root Mean Square Error (RMSE) [28], defined as
wherein vcmd represents the motor command speed at time t, vact represents the actual speed of the carriage at time t, and n denotes the number of sampling points. A smaller ζRMSE indicates a smaller cumulative transmission error and better stability in motion transfer.
In summary, transmission speed accuracy characterizes the degree of agreement between carriage motion and the motor command signal. Since its performance directly determines the stability of carriage-falling body separation, it is incorporated as a core objective in the multi-objective optimization framework. The minimization of ζRMSE is achieved by collaboratively adjusting the steel belt pre-tightening force, the free-fall segment acceleration, and the start-up segment displacement.
2.2.2. Objective Function for System Vibration
System vibration (VRMS) is a fundamental indicator of the dynamic stability of transmission systems. It reflects the deviation of mechanical structures under periodic or random excitations from multiple sources, thereby representing the system’s dynamic equilibrium. The vibration acceleration signal of an absolute gravimeter is inherently complex and exhibits strong non-stationary, time-varying characteristics [29]. The time-domain Root Mean Square (RMS) of vibration acceleration signal [30] is the optimal indicator for characterizing vibration intensity, and its mathematical definition is as follows:
where T denotes the sampling period, and ax(t) denotes the time-domain signal of vibration acceleration. By integrating the squared term of the vibration signal and taking its square root, the average cumulative effect of vibration energy can be obtained. Compared with peak indicators (e.g., peak-to-peak value), VRMS can more objectively characterize the long-term impact of vibration on the system. In an absolute gravimeter, vibration not only introduces disturbances to the motion of the falling body but also affects displacement measurement accuracy through micro-deformations in the laser interferometric optical path. Therefore, minimizing VRMS can suppress the influence of mechanical vibration on measurement results and extend the service life of the instrument.
Having clarified the two core output objectives (transmission speed accuracy and system vibration) and their quantification methods, the next step is to identify the key input parameters that directly influence these objectives—this is critical for constructing the parameter-performance coupling relationship and laying the foundation for subsequent optimization, which is elaborated in Section 2.3.
2.3. Selection of Input Parameters for the Transmission System of Absolute Gravimeters
2.3.1. Steel Belt Pre-Tightening Force
Pre-tightening force is a critical parameter for the stiffness and dynamic stability of transmission systems, and one of the essential factors enabling precise transmission in steel belt systems. Applying pre-tightening force eliminates gaps between components, balances friction and deformation between the steel belt and pulleys, prevents slippage, improves positioning accuracy, and prolongs the service life of the system.
During steel belt transmission, transverse vibration behavior significantly influences system vibration. Based on mechanical principles, the transverse vibration equation of the steel belt [31] can be expressed as
wherein ρ denotes the density of the belt material, and A denotes the cross-sectional area. Analysis of this equation indicates that the vibration amplitude y0 exhibits an inverse proportional relationship with the steel belt pre-tightening force F [32], expressed about as
The vibration VRMS of the transmission system is closely related to the vibration amplitude, and can be described as
where k1 is a coefficient reflecting material properties, geometric dimensions, and system structure, and C1 is a constant. Physically, the steel belt pre-tightening force F directly determines belt rigidity; when F is low, the belt is prone to large-amplitude vibration under excitation.
The slip ratio δ of a belt transmission system arises mainly from local micro-slip caused by elastic deformation. Slippage critically affects transmission speed accuracy. The relationship between slip ratio and pre-tightening force F [33] can be expressed as
wherein F0 denotes the critical pre-tightening force, related to the belt material and pulley surface characteristics.
The difference between motor command speed vcmd and actual carriage speed vact is measured by ζRMSE. Correlating slip ratio with speed difference yields:
where k2 is a coefficient determined by system transmission characteristics, and C2 is a constant. When the pre-tightening force is insufficient, friction between the belt and pulleys decreases, making slippage more likely. Consequently, the actual carriage speed deviates from the motor command speed, leading to reduced transmission accuracy and increased ζRMSE.
2.3.2. Acceleration of the Free-Fall Segment
The free-fall segment is the core stage of absolute gravimeter measurement, and its acceleration stability directly affects gravity measurement accuracy. Free-fall motion ideally corresponds to uniformly accelerated motion with acceleration g. However, in practical systems, factors such as steel belt dynamics and mechanical friction introduce additional forces, causing acceleration fluctuations.
Changes in the motion state of the falling body during the free-fall segment affect the transmission system, inducing vibration. Acceleration variations generate impact loads. The impact load Fimp can be expressed as
wherein m is the mass of the falling body. The vibration energy of the transmission system is closely related to the impact load . Since vibration depends on vibration energy, the following relation can be established:
where k3 is a coefficient related to the system structure and materials, and C3 is a constant. Physically, the rate of change in acceleration in the free-fall segment directly determines impact intensity. Large sudden changes in acceleration produce strong impacts on the transmission system, intensifying vibration.
The accuracy of the acceleration a in the free-fall segment directly affects carriage speed and displacement influencing the transmission speed accuracy. The speed tracking error Δv can be calculated by integrating the acceleration deviation over time, i.e.,
Therefore, the relationship between transmission speed accuracy and the acceleration of the free-fall segment can be derived as follows:
where k4 is a coefficient related to factors such as system control precision, and C4 is a constant. From the perspective of the actual motion process, if there is a significant deviation between the acceleration a of the free-fall segment and the command acceleration acmd, and this deviation accumulates continuously over time, it will result in a progressive increase in the difference between the actual carriage speed and the motor command speed. Consequently, the transmission speed accuracy indicator will steadily deteriorate.
2.3.3. Displacement of the Start-Up Segment
The kinematic characteristics of the start-up segment displacement directly determine the dynamic response quality at the moment of falling body separation and are associated with the positioning accuracy and dynamic response speed of the system during the start-up phase. The positioning deviation affects the stability of the free-fall segment acceleration through impact disturbances.
During the start-up phase of the transmission system, the magnitude of the start-up segment displacement x exerts a significant influence on the smoothness of the start-up process, which in turn is related to the vibration of the transmission system. In this phase, a start-up impact coefficient K exists, which depends on the start-up segment displacement x [34] and can be expressed as follows:
where x0 denotes the critical displacement, which is related to the structure and start-up characteristics of the transmission system. The vibration of the transmission system is closely related to the start-up impact coefficient, and a formula can usually be expressed as
By organizing the formulas, it can be obtained that
where k5 is a system-related coefficient, and C5 is a constant. From the perspective of the actual start-up process, an excessively large start-up segment displacement requires the system to overcome a large inertial force within a short time, thereby inducing severe vibration and increasing the vibration of the transmission system.
When the carriage starts up, if there is a deviation between the start-up segment displacement x and the reference displacement xref, that deviation represents the position error:
This position deviation leads to a speed compensation error. Generally, there is a linear relationship between the speed compensation error Δv and the position deviation Δx, expressed as
where kv is a coefficient related to the speed control characteristics of the system. The transmission speed accuracy is measured by ζRMSE, and its relationship with displacement can be expressed as
wherein k6 is a system-related coefficient, and C6 is a constant. From the analysis of the actual transmission process, if the start-up segment displacement is inaccurate, it will destabilize the initial motion state of the system and induce multi-degree-of-freedom coupling disturbances in the falling body motion (including uncoordinated behavior between rotational and translational degrees of freedom). As a result, the transmission speed accuracy indicator will increase.
With the input parameters (steel belt pre-tightening force, free-fall segment acceleration, start-up segment displacement) and output objectives (transmission speed accuracy, system vibration) clearly defined, and their coupling relationships analyzed, it is necessary to design an overall multi-objective optimization process to coordinate these parameters and achieve balanced improvement of the two objectives—this overall scheme is detailed in Section 2.4.
2.4. Overall Scheme for Multi-Objective Optimization of Parameter Adjustment in the Transmission System of Absolute Gravimeters
In research on the multi-objective optimization of the absolute gravimeter transmission system, the input parameters are determined as the steel belt pre-tightening force, the acceleration of the free-fall segment, and the displacement of the start-up segment. The output objectives are the transmission speed accuracy and system vibration of the transmission system. This study adopts a multi-objective optimization approach, combining the NSGA-II algorithm with the global criterion method, as shown in Figure 2.
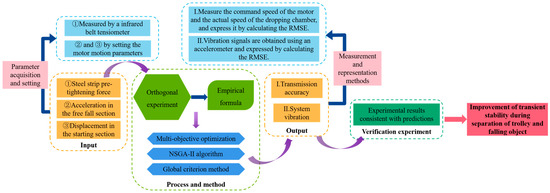
Figure 2.
Schematic diagram of the multi-objective optimization scheme for parameter adjustment in the transmission system of absolute gravimeters.
Firstly, based on the three input parameters, an orthogonal experiment is designed. Through statistical analysis and fitting of experimental data, empirical formulas between inputs and outputs are constructed, providing a data foundation for subsequent optimization. Secondly, the NSGA-II algorithm is applied to obtain the Pareto frontier solution set, reflecting the trade-off between objectives. Then, the global criterion method is used to screen the optimal parameter combination that balances transmission speed accuracy and vibration suppression. Subsequently, verification experiments are conducted to evaluate the consistency between predicted optimal solutions and experimental results, thereby verifying the reliability of the model. Finally, the results demonstrate that the smoothness of transient separation between the carriage and the falling body is significantly improved, proving the effectiveness of the proposed optimization scheme.
3. Optimization Methods for the Transmission System of Absolute Gravimeters
3.1. Multi-Objective Optimization
In the field of parameter optimization for absolute gravity measurement systems, traditional single-objective optimization methods exhibit significant limitations. When optimization is guided by a single indicator (such as minimizing only the transmission error ζRMSE or the vibration VRMS), these approaches fail to resolve the inherent conflict between transmission speed accuracy and vibration suppression, and thus cannot achieve global optimization of the system’s overall performance. Therefore, as a core factor in improving measurement accuracy and stability, the optimal selection of transmission parameters requires comprehensive consideration of the multi-objective collaborative optimization of transmission speed accuracy and vibration suppression [35]. This process requires a multi-objective collaborative optimization framework to balance mutually conflicting objectives, such as transmission speed accuracy and vibration suppression, while satisfying the parameter constraint set defined by physical boundaries. The general form of multi-objective optimization is as follows:
where x denotes the optimization variable, i.e., a column vector composed of optimization parameters; f1(x) represents the first objective function; g1(x) denotes the i-th inequality constraint function; hj(x) represents the j-th equality constraint function; m is the number of objective functions; q is the number of inequality constraints; and nc is the total number of constraints.
Pareto dominance is a core concept in multi-objective optimization. A solution x1 dominates another solution x2 (denoted as x1 > x2) if and only if x1 is no worse than x2 in all objectives and strictly better in at least one objective. If a solution x* is not dominated by any other solution, it is termed a Pareto optimal solution (or non-dominated solution). The set of all such non-dominated solutions constitutes the Pareto-optimal solution set. The projection of this set into the objective function space is referred to as the Pareto frontier, which provides an intuitive representation of the trade-off relationships among objectives. In the optimization of an absolute gravimeter transmission system, the Pareto frontier may appear as a compromise curve between transmission speed accuracy and vibration suppression. Its typical non-convex and irregular shape characterizes the degree of conflict between the objectives.
Transmission speed accuracy and system vibration are two mutually restrictive indicators in the transmission system of an absolute gravimeter, and both exert decisive influences on measurement accuracy and equipment stability. During gravitational acceleration measurement, it is necessary to suppress mechanical vibration transmission to reduce elastic deformation of the steel belt, ensure the linearity of the falling body trajectory, and improve the signal-to-noise ratio (SNR) of interference fringes. At the same time, the command response speed must be enhanced. A multi-objective collaborative optimization framework is therefore required to balance these conflicting aspects and achieve the Pareto optimal comprehensive performance of the measurement system.
To translate the above multi-objective optimization theoretical framework (including the definition of conflicting objectives, Pareto dominance principle, and Pareto frontier concept) into practical parameter optimization for the absolute gravimeter transmission system, a specific, efficient optimization algorithm is needed to solve the Pareto optimal solution set of the two objective functions. The NSGA-II algorithm—with its advantages of fast convergence and excellent solution set diversity, which are well-suited for handling dual-objective trade-off problems—is introduced in the following Section 3.2 to implement this key optimization step.
3.2. NSGA-II Algorithm
3.2.1. Core Principles and Execution Steps of the NSGA-II Algorithm
As a classic multi-objective optimization algorithm, the core of NSGA-II lies in simulating biological evolution. Under the dual constraints of transmission speed accuracy and system vibration for the transmission system of absolute gravimeters, this algorithm can efficiently search for parameter combinations (steel belt pre-tightening force F, acceleration of the free-fall segment a, and displacement of the start-up segment x) to balance these two conflicting objectives and find Pareto optimal solutions. It realizes the stratification of parameter combinations through non-dominated sorting (prioritizing combinations with better dual-objective performance) and retains diverse optimal solutions via crowding distance [36]. The specific process is as follows:
Step 1: Initialization and Objective Function Construction
An initial population of individuals is randomly generated. Each individual consists of three parameters: steel belt pre-tightening force F, acceleration of the free-fall segment a, and displacement of the start-up segment x. The parameter ranges are constrained by experimental data. By constructing an interpolation model of the experimental results, the interpolated values of transmission speed accuracy and system vibration are directly used as objective functions, achieving dual-objective optimization of “improving transmission speed accuracy + suppressing system vibration.”
Step 2: Non-Dominated Sorting for “Speed-Vibration” Trade-off
The initial population (or merged parent-offspring population) is stratified based on the dual objectives of the transmission system. The first stratum (rank 1) consists of non-dominated parameter combinations—i.e., no other combination in the population is simultaneously better in both ζRMSE and VRMS. Subsequent strata are formed by excluding the previous non-dominated set and repeating the screening. This stratification ensures that parameter combinations beneficial to transmission stability (lower ζRMSE and VRMS) are prioritized.
Step 3: Crowding Distance Calculation
For individuals within each stratum, crowding distance is calculated based on the distribution of objective values (ζRMSE and VRMS). This ensures comprehensive coverage of the transmission system’s operating conditions.
Step 4: Selection Operation
A tournament selection method is employed, combining non-dominated rank and crowding distance to screen parent individuals. Priority is given to individuals with lower ranks (better dual-objective performance for transmission stability). For individuals with the same rank, those with larger crowding distances are preferred. This ensures that parent combinations include both “high-precision low-vibration” optimal solutions and representative trade-off solutions.
Step 5: Crossover and Mutation
Crossover (with the default probability) and mutation operations are applied to selected parent individuals to generate offspring. Genetic recombination enhances exploration capability, prevents premature convergence to local optima, and enables broader traversal of the solution space in balancing ζRMSE and VRMS.
Step 6: Population Update
The parent and offspring populations are merged to form a temporary population of 200 individuals. After non-dominated sorting and crowding distance calculation, the top individuals are selected according to rank priority. If the number of individuals in a stratum exceeds the quota, screening is performed based on crowding distance. This process ensures the uniformity of the Pareto optimal solution set and provides favorable distribution characteristics with respect to both optimization objectives.
Step 7: Termination Condition Judgment
It is determined whether the maximum preset number of generations or other termination conditions has been met. If so, the algorithm terminates and outputs the final Pareto optimal solution set; otherwise, the process returns to Step 4, repeating selection, crossover, and mutation until termination conditions are satisfied.
To clearly present the dynamic relationship among the above steps, the execution path of the algorithm is visualized in Figure 3.
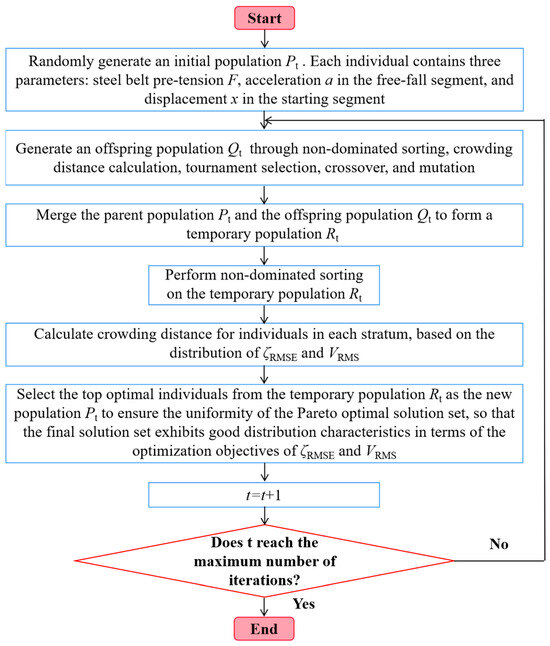
Figure 3.
Flowchart of the NSGA-II algorithm.
3.2.2. NSGA-II Parameter Adaptability Verification
As a core tool for solving Pareto optimal solution sets, the parameter configuration of the NSGA-II algorithm directly determines the algorithm’s search efficiency, convergence speed, and the quality of the final solution set. Improper parameter selection may lead to issues such as inadequate convergence or insufficient diversity of the solution set, thereby affecting the reliability and rationality of subsequent engineering parameter screening. To ensure that the NSGA-II parameters selected in this study are accurately suited to the optimization model, an analysis was conducted following a three-level verification logic of “comparative parameter design—quantitative index evaluation—statistical test verification.” First, two sets of differentiated core parameter combinations were designed, and the Pareto front was obtained by solving under the same optimization model. Then, the Hypervolume (HV) index was used to quantitatively evaluate the quality of both solution sets in terms of convergence and diversity. Finally, the Wilcoxon signed-rank test was applied to minimize random error interference, verify the statistical significance of performance differences between parameter groups, and ultimately determine the optimal NSGA-II parameter configuration suitable for this study.
- Design of NSGA-II Parameter Sets
The configuration of NSGA-II parameters directly affects the quality of the Pareto optimal solution set, which in turn influences the reliability of the final screened engineering parameters for the absolute gravimeter transmission system. To identify the most appropriate NSGA-II parameter settings for this study, a comparative experiment was conducted in which two parameter sets were used to solve the same multi-objective optimization model. Quantitative indicators and statistical tests were then employed to evaluate their relative performance. Four key parameters—maximum number of iterations, population size, crossover rate, and mutation rate—were selected for differentiated configuration design. The specific design scheme is shown in Table 2. All parameter values were chosen within the generally accepted reasonable range of the algorithm, ensuring the scientific validity and practical feasibility of the configuration.
Table 2.
Design of NSGA-II Parameter Sets.
Using the two sets of parameters mentioned above and the same optimization model, the results are shown in Figure 4.
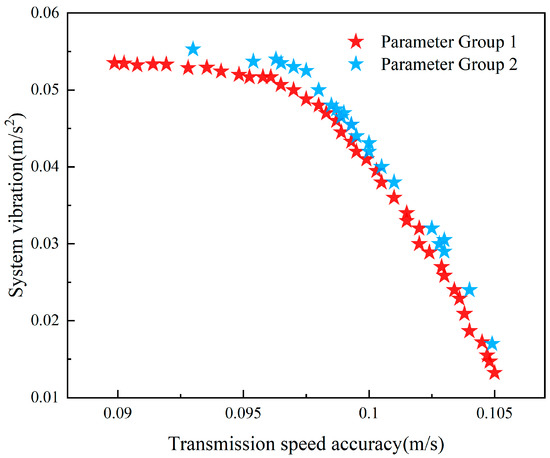
Figure 4.
Comparison of Pareto Fronts Under Two Sets of NSGA-II Parameters.
The figure illustrates the Pareto fronts obtained under two parameter sets. The horizontal axis represents transmission speed accuracy, and the vertical axis denotes system vibration. The red data points correspond to parameter group 1, whose distribution is closer to the lower-left region, covering a greater number of non-dominated solutions (40 solutions) with a uniform distribution across the trade-off range. The blue data points correspond to parameter group 2, whose front shifts toward the upper-right direction, containing fewer solutions (24 solutions) and showing an evident clustering phenomenon in the middle area of the front.
- 2.
- Definition of Hypervolume Index and Evaluation of Solution Set Quality
The Hypervolume (HV) [37] is the only comprehensive performance metric in multi-objective optimization that simultaneously quantifies both the convergence and diversity of a solution set. Its core principle is to assess solution-set quality by calculating the volume of the objective space enclosed by the non-dominated solutions and a reference point. The main calculation steps are as follows:
Step 1: Setting of Reference Point
The worst-performing point in the objective space is selected as the reference point to ensure that all non-dominated solutions dominate this point.
Step 2: Volume Accumulation Rule
HV is calculated according to the principle of segmenting the objective space step by step while avoiding repeated volume computation. First, the non-dominated solutions are sorted in descending order of transmission-speed accuracy (solutions with higher accuracy are placed first). Then, the rectangular area formed by each solution and the reference point is sequentially calculated, and the overlapping volume between subsequent rectangles is subtracted. The total hypervolume is obtained by accumulation, as expressed below:
Among them, xi and yi represent the coordinates of the i-th non-dominated solution in the bi-objective space; xref and yref denote the horizontal and vertical coordinates of the reference point, respectively; n is the number of non-dominated solutions; and Voverlap(i, j) indicates the overlapping volume of rectangles corresponding to the i-th and j-th solutions.
Step 3: Numerical Standardization
To remove the influence of differing dimensions and objective ranges, the calculated volumes are normalized to the interval [0, 1], facilitating direct comparison of HV results across different experiments.
Following the above procedure, ten repeated experiments were performed, and the HV values of both parameter sets were computed separately. The resulting statistical data are summarized below.
As shown in Table 3, the overall mean HV of parameter group 1 across ten runs is notably higher than that of parameter group 2, suggesting that the Pareto solution set generated by parameter group 1 exhibits superior distribution uniformity and broader trade-off coverage. However, this numerical difference may be influenced by random errors during genetic algorithm initialization and therefore cannot be directly interpreted as an inherent performance advantage of the parameter configuration itself. To eliminate random interference and quantitatively verify the statistical significance of the observed performance difference between the two parameter sets, a Wilcoxon signed-rank test was conducted.
Table 3.
Comparison of HV Values Between Two Sets of NSGA-II Parameters.
- 3.
- Wilcoxon Signed-Rank Test
The hypotheses were formulated as follows [38]:
Null Hypothesis H0: The population median of the differences in HV values between the two NSGA-II parameter sets equals 0, indicating no significant difference in optimization performance.
Alternative Hypothesis H1: The population median of the HV value differences is greater than 0, indicating that the HV values of parameter group 1 are significantly higher than those of parameter group 2, and thus its optimization performance is superior.
Significance Level: The conventional threshold α = 0.05 used in engineering optimization was adopted to ensure the reliability of the test results.
The specific implementation steps were as follows:
Step 1: Data Preprocessing and Difference Calculation
The original HV data from ten repeated experiments were extracted, and the difference for each paired observation was calculated using the formula: di = HV1,i − HV2, which represents the performance gap between the two parameter groups in the i-th experiment. The computed results are presented in Table 4.
Table 4.
Calculation Results of HV Value Differences Between Two NSGA-II Parameter Sets.
Step 2: Ranking of Absolute Differences and Assignment of Ranks
The absolute values of the differences |di| were first arranged in ascending order and assigned ranks to represent the relative magnitudes of the differences. In cases where identical absolute values (ties) occurred, the average of the corresponding rank positions was assigned. In this study, the |di| values of the 3rd and 9th experiments were both 0.313, and their assigned rank was 8.5. For all other non-duplicate values, ranks were assigned directly based on their order. The final results yielded a sum of positive ranks S+ = 55 and a sum of negative ranks S− = 0.
Step 3: Calculation of Test Statistic
The Wilcoxon signed-rank test statistic is defined as the minimum of the sums of positive and negative ranks: T = min(S+, S−).
Substituting the calculated values gives T = min(55, 0) = 0.
Step 4: Critical Value Comparison and Significance Judgment
According to the Wilcoxon signed-rank critical value table (one-tailed test, α = 0.05, number of valid pairs n = 10), the critical value is T0.05 (10) = 8. A comparison indicates that the calculated test statistic T = 0 < T0.05 (10) = 8. Furthermore, the corresponding p-value, determined using the normal approximation method, is as follows:
Among them, n = 10, ) is the tie correction term (only one tie exists in this study, so tj = 2).
After substitution and computation, Z = −3.57 was obtained, with the corresponding one-tailed p < 0.0002, which is far smaller than α = 0.05.
In summary, the null hypothesis H0 is rejected, and the alternative hypothesis H1 is accepted. The overall HV distribution of parameter group 1 is significantly superior to that of parameter group 2. The Pareto solution set generated by parameter group 1 exhibits inherent performance advantages in convergence and trade-off coverage, while the influence of random errors on the results is negligible. Therefore, it can be conclusively stated that parameter group 1 of the NSGA-II algorithm designed in this study represents the optimal parameter configuration for the bi-objective optimization problem of the absolute gravimeter transmission system. It can consistently generate high-quality Pareto solution sets and provide robust algorithmic support for subsequent engineering parameter screening.
Through the core principle elaboration and parameter adaptability verification, the NSGA-II algorithm—equipped with the optimal parameter configuration—has successfully generated a high-quality Pareto optimal solution set that accurately reflects the trade-off relationship between transmission speed accuracy and system vibration. However, this set still contains multiple non-dominated solutions, which cannot directly provide a unique, actionable parameter combination for the engineering application of absolute gravimeter transmission systems. To address this “multi-solution dilemma” and screen out the optimal parameter combination that meets the actual performance requirements of separation stability, a decision-making method is required to integrate the two conflicting objectives. Therefore, as elaborated in Section 3.3, this section presents the comparison and selection of decision-making methods applied to this screening task, and constructs a decision function for comprehensive optimization.
3.3. Comparison and Selection of Decision-Making Methods
In multi-objective optimization problems, after obtaining a set of non-dominated Pareto optimal solutions via an optimization algorithm, a decision-making method is required to select the unique final optimal parameter combination. Both the Global Criterion Method and the Weighted Sum Method are commonly used classical decision-making methods. The following sections explain the basis for method selection and compare these decision-making methods.
3.3.1. Comparison of Multi-Objective Decision-Making Methods
The core of the Global Criterion Method [39] lies in normalizing multiple conflicting objective functions, integrating them into a single global evaluation function through weighted summation, and optimizing this function to achieve a comprehensive trade-off of multi-objective performance. Ultimately, the unique optimal parameter combination is selected from the Pareto optimal solution set.
The Weighted Sum Method [40] converts multi-objective functions into a single function by multiplying each objective by a weight and summing the results, then selecting the solution with the smallest sum. However, it does not standardize objectives, leading to dimensional bias. These two methods were applied to the same Pareto optimal solution set to extract optimal parameter combinations, and their results were evaluated based on performance indicators and engineering feasibility.
As shown in Table 5, the Global Criterion Method exhibits significant advantages compared to the Weighted Sum Method. In terms of performance indicators, it achieves smaller transmission speed error and system vibration, resulting in higher speed accuracy and weaker vibration. In terms of engineering requirements, although both methods meet feasibility criteria, the parameter combination from the Global Criterion Method better balances the two objectives of “transmission speed accuracy improvement” and “vibration suppression,” and achieves higher alignment with separation stability. In contrast, the Weighted Sum Method is affected by dimensional bias, leading to inferior performance indicators and insufficient support for separation stability.
Table 5.
Comparison of Multi-Objective Decision-Making Results Between Global Criterion Method and Weighted Sum Method.
Additionally, the selection of the Global Criterion Method depends on two key characteristics of the optimization problem for the absolute gravimeter transmission system. First, to meet the engineering applicability requirement for “unique actionable parameters,” this study aims to provide a parameter combination directly applicable to gravimeter debugging. The Global Criterion Method converts the multi-objective problem into a single global evaluation function and outputs a unique optimal solution, avoiding the dilemma of being unable to determine which Pareto solution to adopt. Second, to balance the significant differences between the two core objectives, the method first normalizes the objective functions to ensure fair weighting of both objectives, laying a foundation for balancing “transmission speed accuracy improvement” and “vibration suppression.” Furthermore, regarding the clear priority of separation stability, the method supports flexible weight assignment based on engineering priorities. In contrast, methods such as the Weighted Sum Method lack this flexibility, as they treat all objectives equally by default. Therefore, the Global Criterion Method was selected as the decision-making method in this study.
3.3.2. Specific Procedure of the Global Criterion Method
Step 1: Determine Objective Functions and Pareto Solution Set
Define transmission speed accuracy and system vibration as the key performance objectives of the absolute gravimeter transmission system. Input the Pareto optimal approximate solution set P = {x1, x2, x3} (where xi is a vector of three input parameters) obtained via an optimization algorithm, along with the corresponding objective function vectors F(xi) = [ζRMSE (xi), VRMS (xi)].
Step 2: Normalization of Objective Functions
Perform normalization on the Pareto solution set P. This normalization ensures that ζRMSE and VRMS have equivalent weights in the evaluation.
Step 3: Set Objective Weights
Determine the relative importance weights of the two objectives according to the design requirements of the transmission system. Considering the critical impact of transmission speed accuracy on the stability of separation transients, assign the weight of ζRMSE to 0.6 and the weight of VRMS to 0.4 (satisfying ωk > 0 and ∑ωk = 1).
Step 4: Construct Global Evaluation Function
For each parameter vector xk in the solution set P, calculate its global evaluation function value F(xk).
Step 5: Screen Optimal Parameters
Traverse the entire Pareto solution set P, calculate F(xk) corresponding to all solutions, and select the parameter vector x* that minimizes the global evaluation function F(xk) as the final optimized parameter.
Step 6: Result Verification
Calculate the actual ζRMSE and VRMS corresponding to the parameter x* through the interpolation model, and verify whether the error between predicted and actual values falls within the acceptable range. If not, adjust the weights and recalculate until a parameter combination meeting the requirements is obtained.
3.4. Synergistic Advantages and Application Value of the Combined Optimization Method
The combination of NSGA-II and the Global Criterion Method forms a functionally complementary closed-loop optimization process, which collaboratively addresses key challenges that cannot be overcome by a single method alone. On one hand, NSGA-II can efficiently handle the inherent conflict between “improvement of transmission speed accuracy” and “suppression of system vibration”. By simulating the evolutionary process, it generates a Pareto optimal solution set covering all non-dominated trade-off points, avoiding the local optimality trap of traditional gradient-based algorithms. On the other hand, the Global Criterion Method can resolve the “multi-solution dilemma” of the Pareto solution set—through normalization and weighting based on engineering priorities, it converts the multi-objective problem into a single global evaluation function, and finally outputs a unique, engineerable parameter combination that can be directly used for debugging, rather than a theoretical solution set.
This study for the first time applies this framework to the parameter optimization of the transmission system in absolute gravimeters, filling the gap in multi-objective collaborative optimization for this specific field. Literature review in the Introduction shows that traditional research on the transmission system of gravimeters is mostly limited to single-parameter adjustment or single-objective optimization. No previous study has adopted the combined mode of “algorithm-generated solution set + decision-making method screening” to balance conflicting performance indicators related to separation stability.
Through targeted design, this combined method improves traditional methods in the field of gravimeter optimization from three dimensions. Firstly, to address the problem that traditional single-objective methods tend to cause “one-sided optimization”, NSGA-II incorporates both transmission speed accuracy and system vibration as dual objectives at the initial stage of optimization. It retains solutions that balance both objectives through non-dominated sorting, avoiding contradictions such as “increasing vibration to improve speed accuracy” or “sacrificing speed consistency to suppress vibration”. Secondly, to solve the problem that standalone multi-objective algorithms only output theoretical solution sets which are difficult to apply in engineering, the Global Criterion Method eliminates dimensional differences between different indicators through normalization, and assigns weights based on the separation stability requirements of gravimeters. This converts scattered Pareto solutions into a unique and clear parameter combination, which directly serves equipment debugging. Thirdly, to overcome the inefficiency of traditional manual trial-and-error that relies on experience, this combined method is based on experimental data modeling. It automatically searches the optimal parameter space through algorithms, without the need for repeated manual adjustments, significantly reducing the debugging cycle and human error.
4. Multi-Objective Optimization Experimental Process of the Transmission System of Absolute Gravimeters
To verify the effectiveness, reliability, and engineering applicability of the multi-objective optimization method proposed in this study for the absolute gravimeter transmission system, this section presents a comprehensive experimental verification process. The core goal of these experiments is to confirm whether the optimized parameter combination can effectively improve transmission speed accuracy, suppress system vibration, and ultimately enhance the separation stability between the carriage and the falling body—thereby providing practical support for improving gravitational acceleration measurement accuracy. To achieve this goal, the section is organized in a logical closed-loop: first, it clarifies the parameter constraints to ensure optimization results conform to the gravimeter’s actual operating limits; second, it collects sample data through orthogonal experiments and establishes reliable parameter-performance coupling models; third, it screens the optimal parameter combination based on the proposed optimization method; finally, it conducts verification experiments to compare key performance indicators before and after optimization, fully validating the method’s effectiveness.
4.1. Constraint Conditions of Input Parameters
Before establishing the multi-objective optimization model for the transmission system, a series of constraint conditions must be considered to ensure that the optimization results are feasible for the actual operation of the instrument.
During operation of the transmission system of an absolute gravimeter, the steel belt pre-tightening force must satisfy the dual constraints of material strength limit and motion stability, and remain between the minimum and maximum values permitted by the safety threshold for precision mechanical transmission:
In this formula, Fmin denotes the minimum pre-tightening force, and Fmax denotes the maximum pre-tightening force. The minimum force must be sufficient to prevent slippage and ensure effective frictional transmission; an excessively small force causes elastic sliding, reducing the linearity of the falling body trajectory. The maximum force must remain below the yield strength of the belt to prevent plastic deformation; an excessively large value will intensify vibration and noise, impairing the signal-to-noise ratio of the interference signal.
The acceleration a of the carriage during the free-fall phase must be constrained within the threshold range permitted by the servo tracking system:
In the formula: amin denotes the minimum acceleration of the free-fall segment, and amax denotes the maximum. Excessive acceleration induces Coriolis force errors and reduces the quality of the interference signal.
According to the dynamics of falling body release and engineering constraints of the absolute gravimeter, the displacement x in the start-up phase must satisfy the requirement of being within the allowable limits:
In the formula: xmin denotes the minimum displacement value of the start-up segment, and xmax denotes the maximum. An excessively short displacement fails to fully overcome static friction, resulting in a “failure to separate” situation [41]; an excessively long displacement produces unbalanced lateral forces on the guide rail, deviating the falling body trajectory.
The ranges of the three input parameters—steel belt pre-tightening force, free-fall segment acceleration, and start-up segment displacement—are summarized in Table 6.
Table 6.
Settings of constraint conditions.
4.2. Acquisition of Sample Experimental Data and Model Establishment
To analyze the influence relationships between the input parameters and output objectives of the optimized transmission system, an orthogonal experiment with three factors and six levels was designed [42]. The input parameters of the experimental transmission system are steel belt pre-tightening force F (unit: N), acceleration a of the free-fall segment (unit: m/s2), and displacement x of the start-up segment (unit: m). Transmission speed accuracy and system vibration were selected as the final output indicators. The specific settings of the input parameters are listed in Table 7.
Table 7.
Orthogonal experiment with three factors and six levels.
After completing the settings of the transmission system’s input parameters, we first performed refined PID parameter tuning on the motor drive system before formally conducting the experiments. Through this operation, the impacts of factors such as time delay and transient overshoot during the motor response on key indicators (including transmission speed accuracy and system vibration) could be suppressed to a negligible level. Notably, since changes in the steel belt pre-tightening force alter the load characteristics of the transmission system, it was necessary to re-tune the PID parameters synchronously after each adjustment of the steel belt pre-tightening force—this ensured that the motor drive performance always matched the current system state.
Following the completion of PID parameter tuning, orthogonal experiments were carried out, and statistical analysis was performed on the experimental data. The specific experimental results are presented in Table 8.
Table 8.
Results of the orthogonal experiment with three factors and six levels.
Range analysis was carried out on the experimental results in Table 8 to investigate the effects of different input parameters on transmission speed accuracy and system vibration. Figure 5 illustrates the influence of the input parameters on transmission speed accuracy. As shown in Figure 5a, the steel belt pre-tightening force exerts the most significant influence on transmission speed accuracy, followed by the displacement of the start-up segment, and finally the acceleration of the free-fall segment. Specifically, transmission speed accuracy decreases sharply as the steel belt pre-tightening force increases, and then rises slowly; with the increase in start-up segment displacement, transmission speed accuracy first decreases and then stabilizes; as the acceleration of the free-fall segment increases, transmission speed accuracy first decreases and then becomes stable. Figure 5b illustrates the effects of input parameters on system vibration. The steel belt pre-tightening force and the displacement of the start-up segment are positively correlated with system vibration: as both parameters increase, system vibration gradually increases. Conversely, as the acceleration of the free-fall segment increases, system vibration shows an overall decreasing trend.
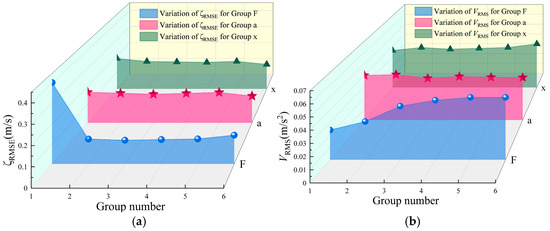
Figure 5.
Effects of different input parameters on transmission speed accuracy (a) and system vibration (b).
Based on the orthogonal experimental method, fitting was performed between the input parameters and output objectives to establish the relationships of transmission speed accuracy and system vibration with the steel belt pre-tightening force F, acceleration a of the free-fall segment, and displacement x of the start-up segment. Considering the complex nonlinear relationships involved, and to reduce dimensional interference so that the model captures the intrinsic relationships among variables more effectively, logarithmic transformation was applied to both sides of the formulas, converting the nonlinear equations into linear equations. Finally, the objective function for transmission speed accuracy was obtained as follows:
The parameters were fitted using the multiple linear regression, the objective function for system vibration was determined as
Figure 6 present the fitting plots of the objective functions for transmission speed accuracy and system vibration, respectively. In both figures, the blue dots represent actual data points, while the red dashed lines denote the ideal fitting lines, which characterize the trend of predicted values relative to actual values. The red shaded areas indicate the 95% confidence intervals, representing the range within which the true regression line is likely to lie with 95% confidence. The lighter shaded areas denote the 95% prediction bands, within which new observed values are expected to fall with 95% probability. It can be observed that the data points are generally distributed around the fitting lines, and the widths of the confidence and prediction bands are narrow. This demonstrates that the models established using the orthogonal experimental data exhibit strong fitting performance.
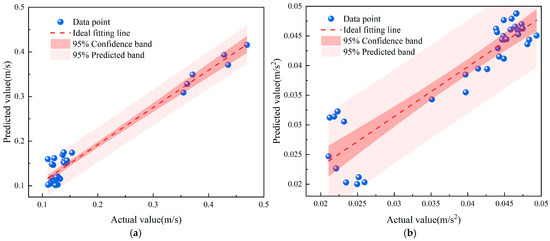
Figure 6.
Fitting plots of the objective functions for transmission speed accuracy (a) and system vibration (b).
The coefficient of determination R2 in the regression model was employed to evaluate the goodness of fit between the experimental data and the regression equations, thereby verifying model accuracy. Its expression is given as
In this equation: y denotes the actual value, denotes the mean value, and denotes the predicted value. The value of R2 ranges between 0 and 1. From Equation (28), the R2 value for transmission speed accuracy was found to be 0.8976, and for system vibration 0.8395. This indicates that the empirical models for both transmission speed accuracy and system vibration predict the experimental data with high reliability.
In summary, three parameters—steel belt pre-tightening force, acceleration of the free-fall segment, and displacement at the initial stage of falling body release—are taken as input variables, while minimizing system vibration and maximizing transmission speed accuracy are defined as the two optimization objectives. Since the transmission speed accuracy is quantified as transmission speed error, maximizing transmission speed accuracy is transformed into minimizing transmission error, the established optimization model is expressed as
4.3. Screening of Optimal Parameter Combinations Based on NSGA-II and Global Criterion Method
4.3.1. Multi-Objective Optimization of the NSGA-II Algorithm
Based on the optimization model fitted in the previous sections, and on the premise of clarifying the core principles, implementation process, and reasonable parameter configuration of the NSGA-II multi-objective algorithm, this algorithm was applied to the dimensional synthesis of the transmission system of the absolute gravimeter. Through iterative optimization, a Pareto optimal solution set was obtained, as shown in Figure 7. From the solution set, it can be clearly observed that the performance index of transmission speed accuracy exhibits a significant inverse correlation with system vibration characteristics. This result is fully consistent with the relationships among performance indicators derived from theoretical analysis in the previous sections, thereby verifying the effectiveness of the NSGA-II algorithm in this study and providing a reliable basis for subsequent screening of the optimal scheme.
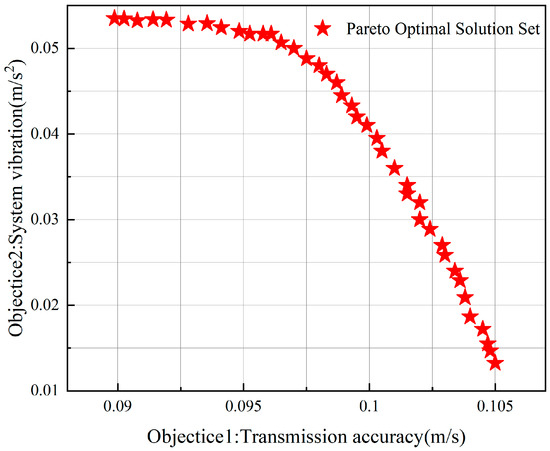
Figure 7.
Pareto optimal solution set of the NSGA-II algorithm.
4.3.2. Screening of Optimal Parameter Combinations via the Global Criterion Method
On the basis of obtaining the Pareto optimal solution set using the NSGA-II algorithm, and combined with the theoretical foundation and specific screening process of the Global Criterion Method described in the previous sections, the optimal parameter combination for the transmission system of the absolute gravimeter was determined. The specific results are presented in Table 9.
Table 9.
Optimal solution of multi-objective optimization.
4.4. Multi-Objective Optimization Verification Experiment and Result Analysis of the Absolute Gravimeter Transmission System
To verify the effectiveness of the obtained optimal parameter combination, the experiment was conducted in the following steps:
First, the experimental parameters were set and debugged. The steel belt tension was adjusted to 381 N; in the motor control parameter configuration, the acceleration of the free-fall segment was set to 9.843 m/s2 and the displacement of the start-up segment to 0.00668 m. After completing the parameter configuration, the motor was started to drive the dropping chamber and release the falling body into free-fall motion.
During data acquisition, the motor command speed was synchronously collected via the motor encoder and motion control card. At the same time, a laser vibrometer measured the actual speed of the dropping chamber, from which the transmission error was calculated. In addition, a vibration sensor was employed to collect vibration signals, enabling the extraction of vibration characteristic data.
The experimental data were analyzed and compared on two levels. First, the transmission error and system vibration measured in the verification experiment were systematically compared with the corresponding data from the orthogonal experiment, in order to evaluate the performance of the optimal parameter combination in terms of transmission speed accuracy and vibration suppression. Second, the vertical velocity of the dropping chamber during multiple falling processes was continuously collected using a laser vibrometer. From this velocity data, the acceleration in the acceleration separation stage was obtained; further analysis yielded the separation time between the dropping chamber and the falling body. The standard deviation of this separation time was calculated and compared with the standard deviation from the orthogonal experiment, thereby verifying the improvement in separation stability achieved by the optimal parameter combination.
4.4.1. Influence of the Optimal Parameter Combination on Transmission Speed Accuracy and System Vibration
In the verification experiment, transmission speed accuracy was calculated from the motor command speed and actual dropping chamber speed, and quantitatively evaluated using the root mean square error of transmission speed accuracy (ζRMSE). The measured ζRMSE was 0.09132 m/s, with a prediction accuracy of 98.99%. By contrast, the minimum ζRMSE observed in the orthogonal experiment was 0.10995 m/s. The verification experiment thus showed a 16.94% reduction relative to the orthogonal minimum, indicating a significant improvement in transmission speed accuracy. For vibration characteristics, vibration signals collected by the sensor were processed, and the root mean square value of vibration (VRMS) was used as the evaluation index. The measured VRMS was 0.022 m/s2, with a prediction accuracy of 98.21%. Overall, the measured results of transmission speed accuracy and vibration in the verification experiment were highly consistent with the theoretical predictions of the optimization model, fully confirming its reliability.
Figure 8 presents the comparison of transmission speed accuracy between the orthogonal experiment and the verification experiment. Transmission speed accuracy is characterized by ζRMSE. The red dashed line represents the minimum ζRMSE (0.10995 m/s) obtained in the orthogonal experiment. The red bars show the ζRMSE values of each experimental group in the orthogonal experiment, which are generally at a relatively high level. The blue bar indicates the ζRMSE from the verification experiment (0.09132 m/s), which is significantly lower than the minimum level of the orthogonal experiment. This comparison clearly demonstrates the substantial improvement in transmission speed accuracy achieved by the optimized system, verifying the effectiveness of the optimization scheme.
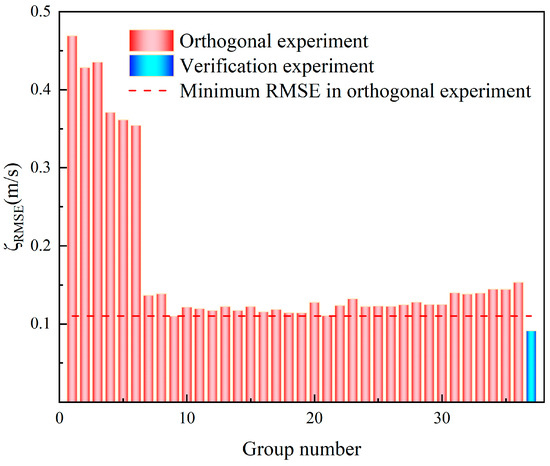
Figure 8.
Comparison plot of transmission speed accuracy between orthogonal experiment and verification experiment.
Figure 9 shows the dynamic variation in the speed difference between the motor and the dropping chamber over time for both the verification experiment and the orthogonal experiment. The orange solid line represents the variation curve of the verification experiment, while the blue solid lines represent the corresponding curves for the orthogonal experiment groups. From both the trend and numerical distribution of the curves, it is evident that the speed differences in the verification experiment are consistently lower than those of all groups in the orthogonal experiment. This dynamic comparison further demonstrates that the optimized system significantly reduced the speed difference between the motor and the dropping chamber, thereby improving motion coordination and validating the optimization scheme.
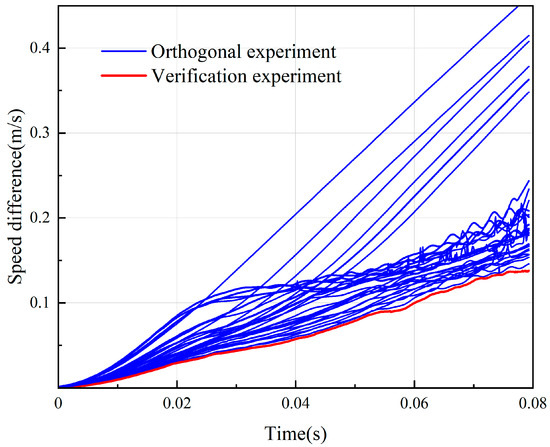
Figure 9.
Comparison plot of speed difference between orthogonal experiment and verification experiment.
Figure 10 presents the comparison results of system vibration between the orthogonal experiment and the verification experiment, where vibration is quantitatively characterized by VRMS. The red bars correspond to the VRMS values of each experimental group in the orthogonal experiment, and the blue bar corresponds to the VRMS value of the verification experiment. The red dashed line in the figure serves as a boundary for vibration level classification, dividing the VRMS values of the orthogonal experiment into three characteristic levels: when VRMS is lower than 0.03 m/s2, the system is in a low-level vibration state; when VRMS lies between 0.03 and 0.04 m/s2, the system is in a medium-level vibration state; and when VRMS exceeds 0.04 m/s2, the system is in a high-level vibration state. From the verification experiment, the VRMS value is 0.022 m/s2, which falls within the low-level vibration range. Based on the above vibration classification criteria, it can be determined that the vibration level of the optimized system reaches an excellent grade, verifying the effectiveness of the proposed optimization scheme in suppressing system vibration.
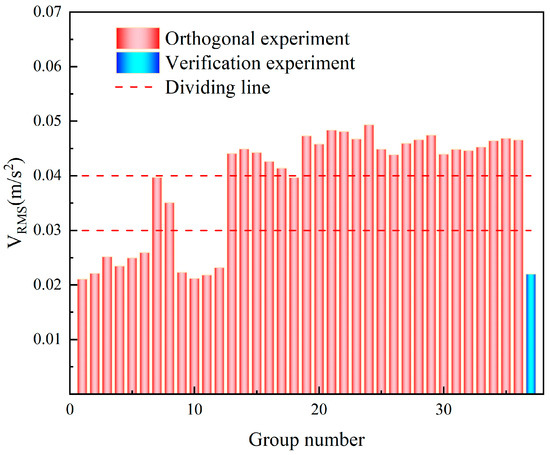
Figure 10.
Comparison plot of system vibration between orthogonal experiment and verification experiment.
Figure 11 illustrates the vibrational transverse displacement waveforms of the transmission mechanism in the verification experiment and orthogonal experiments. The blue lines represent the vibrational transverse displacement trends of the orthogonal experiments, while the red line corresponds to the curve of the verification experiment. From the perspective of curve waveforms, the vibrational transverse displacement in the orthogonal experiments exhibits a relatively large fluctuation amplitude, whereas the displacement curve of the verification experiment shows a significantly reduced fluctuation amplitude and stays within a low—vibration range. This result indicates that the parameter configuration adopted in the verification experiment can greatly suppress the discreteness of transverse vibration, thereby verifying the effectiveness of parameter optimization in improving the vibration characteristics of the system.
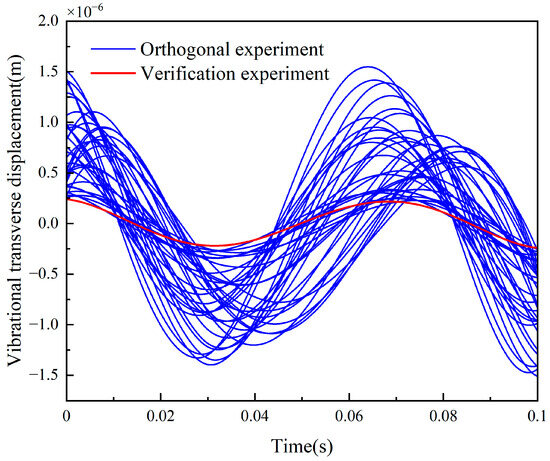
Figure 11.
Time-domain comparison of vibrational transverse displacement between orthogonal experiments and verification experiment.
4.4.2. Results and Comparative Analysis of the Separation Time Between the Dropping Chamber and the Falling Body and Its Standard Deviation
In the verification experiment, acceleration data were obtained by processing the vertical velocity of the dropping chamber measured by the laser vibrometer. The standard deviation of the separation time between the dropping chamber and the falling body was determined to be 0.00096 s. Compared with the minimum standard deviation of 0.00213 s obtained from 36 parallel experiments before optimization, this represents a reduction of about 45%, as shown in Figure 12. This substantial improvement verifies the effectiveness of the proposed multi-objective collaborative optimization method. The method successfully establishes a balance between the conflicting indicators of transmission speed accuracy and vibration suppression. While ensuring high transmission accuracy, it effectively suppresses vibration, thereby significantly improving the stability of separation between the dropping chamber and the falling body and laying a solid foundation for enhancing the accuracy of gravitational acceleration measurement.
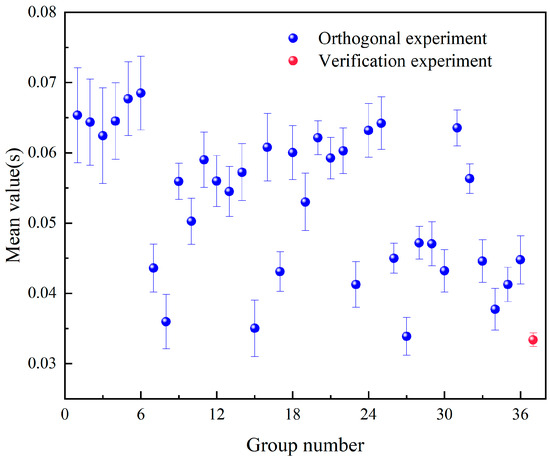
Figure 12.
Comparison plot of the standard deviation of dropping chamber-falling body separation time between the verification experiment and the orthogonal experiment.
5. Conclusions
This study focuses on improving the separation stability between the dropping chamber and the falling body in laser interferometric absolute gravimeters. It aims to address the limitation of traditional single-objective optimization, which struggles to balance transmission speed accuracy and system vibration. A multi-objective collaborative optimization strategy integrating multi-objective optimization, the NSGA-II algorithm, and the global criterion method is proposed. The core findings of the study, supported by specific quantitative data, are summarized as follows:
- Establishment of parameter-performance coupling models with high goodness of fit: By analyzing the coupling relationships between three input parameters (steel belt pre-tightening force, acceleration of the free-fall segment, and displacement of the start-up segment) and two output objectives (transmission speed accuracy and system vibration), nonlinear objective function models were constructed. Among them, the coefficient of determination R2 of the transmission speed accuracy model reached 0.8976, and that of the system vibration model was 0.8395. These values indicate that the two models can explain 89.76% and 83.95% of the variance in the experimental data, respectively, verifying the high fitting accuracy of the models and providing a reliable data foundation for subsequent optimization.
- With the goals of improving transmission speed accuracy and suppressing system vibration, the NSGA-II algorithm was applied to the parameter optimization of the absolute gravimeter’s transmission system for the first time. Specifically, two sets of NSGA-II algorithm parameters were designed; the Hypervolume index was used to quantify the quality of the generated solution sets, and the Wilcoxon signed-rank test (p < 0.0002) was combined to determine the optimal algorithm parameter set. On this basis, a Pareto optimal solution set reflecting the trade-off relationship between transmission speed accuracy and system vibration was generated. Further, the Global Criterion Method and Weighted Sum Method were compared: the former achieved smaller ζRMSE (0.090396 vs. 0.096142 m/s) and VRMS (0.0224 vs. 0.0317 m/s2) and more suitable for this study, showing obvious advantages. Combined with the Global Criterion Method, the optimal parameter combination was screened out, realizing the global balance of conflicting objectives.
- Significant improvement in transmission system performance and separation stability: Experimental validation showed that after parameter optimization, for transmission speed accuracy. The measured ζRMSE was 0.09132 m/s, with a prediction accuracy of 98.99%. Compared with the minimum ζRMSE = 0.10995 m/s in the orthogonal experiment, this represents a reduction of 16.94%, significantly improving the consistency of motion transmission. For system vibration: The measured VRMS was 0.022 m/s2, with a prediction accuracy of 98.21%, which falls within the low-level vibration range and is much lower than the medium-level vibration threshold of most orthogonal experiment groups. For the separation moment between the carriage and the falling body: The standard deviation decreased from the minimum value of 0.00213 s in the orthogonal experiment to 0.00096 s, a reduction of approximately 45%. This directly confirms that the optimized parameters effectively suppress speed fluctuations and vibration disturbances during the separation process, laying a solid foundation for improving the measurement accuracy of gravitational acceleration.
Notably, this study has limitations. The proposed multi-objective optimization strategy was validated under controlled lab conditions (23 ± 1 °C, 50 ± 5% RH, isolated external vibration) and a specific absolute gravimeter transmission configuration (RE40 brushed DC motor, PDV-100 laser vibrometer, fixed steel belt with consistent material properties). Though it shows significant improvements here, its universality and robustness need verification in broader scenarios: Different environments: Extreme temperatures, high humidity, or unisolated external vibrations may impact the optimized parameter combination’s stability, requiring further validation to enhance the model’s environmental adaptability. Different system configurations: Key component variations may alter the study’s established parameter-performance coupling relationships. Future research should validate the strategy across these configurations to expand its applicability to more absolute gravimeter models.
This study integrates the NSGA-II algorithm into the parameter optimization of the absolute gravimeter’s transmission system for the first time, breaking the inherent conflict between “improving transmission speed accuracy” and “suppressing vibration” in traditional single-objective methods. The proposed framework of “orthogonal experiment–model fitting–NSGA-II optimization–global criterion screening” provides a new paradigm for parameter optimization of similar mechanical transmission systems in precision instruments. It breaks the limitation of single-indicator optimization, ensures the global balance of dynamic performance, and offers an effective strategy for the transmission parameter optimization of absolute gravimeters, with important theoretical value and engineering application prospects. In the future, more advanced intelligent algorithms will be integrated to further optimize the precision of parameter regulation, thereby improving the overall performance of gravitational acceleration measurement.
Author Contributions
Conceptualization, L.G. and C.L.; methodology, L.G. and B.P.; software, L.G. and J.F.; validation, L.G., J.Y. and D.W.; formal analysis, L.G.; investigation, L.G. and L.M.; resources, C.L. and B.P.; data curation, L.G. and C.L.; writing—original draft preparation, L.G.; writing—review and editing, C.L. and B.P.; visualization, L.G., B.P. and J.Y.; supervision, J.F. and S.W.; project administration, C.L., J.Y., D.W. and L.M.; funding acquisition, S.W. All authors have read and agreed to the published version of the manuscript.
Funding
This research was funded by the National Natural Science Foundation of China (Grant No. 42304190), the Deep Earth Probe and Mineral Resources Exploration-National Science and Technology Major Project of China (Grant No. 2024ZD1002504), and the Fundamental Research Funds for National Institute of Metrology, China (Grant No. AKYZZ2302, AKYZZ2403, AKYZZ2501).
Institutional Review Board Statement
Not applicable. This study did not involve humans or animals.
Informed Consent Statement
Not applicable. This study did not involve humans.
Data Availability Statement
Data are contained within the article.
Conflicts of Interest
The authors declare no conflicts of interest.
Abbreviations
The following abbreviations are used in this manuscript:
| NSGA-II | Nondominated Sorting Genetic Algorithm II |
| HV | Hypervolume |
| RMSE | Root Mean Square Error |
| RMS | Root Mean Square |
| SNR | Signal-to-Noise Ratio |
| BEC | Bose–Einstein condensate |
| VMD | Variational Mode Decomposition |
| SSA | Sparrow Search Algorithm |
| DDPG | Deep Deterministic Policy Gradient |
| FFT | Fast Fourier Transform |
| RH | Relative Humidity |
References
- Huang, P.W.; Tang, B.; Chen, X.; Zhong, J.Q.; Xiong, Z.Y.; Zhou, L.; Wang, J.; Zhan, M.S. Accuracy and stability evaluation of the 85Rb atom gravimeter WAG-H5-1 at the 2017 International Comparison of Absolute Gravimeters. Metrologia 2019, 56, 045012. [Google Scholar] [CrossRef]
- Van Camp, M.J.; De Viron, O.; Warburton, R.J. Improving the determination of the gravity rate of change by combining superconducting with absolute gravimeter data. Comput. Geosci. 2013, 51, 49–55. [Google Scholar] [CrossRef]
- Hu, M.; Zhang, W.M.; Zhong, M. Robust regression and its application in absolute gravimeters. Rev. Sci. Instrum. 2017, 88, 6203–6209. [Google Scholar] [CrossRef] [PubMed]
- Pan, Y.H.; Chen, Z.H.; Chen, S. Time-Varying Gravity Observation in Mainland China: Technical Exploration, Challenges and Application Prospects. J. Geod. Geodyn. 2024, 44, 959–971. [Google Scholar]
- Sun, H.P. Some reflections on the developing trend of gravimetry in China. Bull. Chin. Acad. Sci. 2024, 39, 881–890. [Google Scholar]
- Su, D.W.; Wang, Q.Y.; Zhang, C.; Yuan, Y.; Liu, S.; Li, C.; Ji, W. Gravity calibration at Zhongshan Station, Antarctica using a domestic absolute gravimeter. Metrol. Sci. Technol. 2021, 65, 36–41. [Google Scholar]
- Wu, S.Q.; Li, T.C. Technical Development of Absolute Gravimeter: Laser Interferometry and Atom Interferometry. Acta Opt. Sin. 2021, 41, 0102002. [Google Scholar] [CrossRef]
- Sun, H.P.; Sun, W.K.; Shen, W.B.; Shen, Z.; Zhu, Y.; Fu, S.; Wu, S.; Cui, X.; Chen, X. Research progress of Earth’s gravity field and its application in geosciences—A summary of Annual Meeting of Chinese Geoscience Union in 2020. Adv. Earth Sci. 2021, 36, 445–460. [Google Scholar]
- Su, D.W.; Jin, S.M.; Shen, H.P.; Pang, L.; Hu, R.; Tang, Y.H.; Xin, G.H.; Mi, M. Gravity Calibration in Tibet Region Using NIM-3C Absolute Gravimeter. China Metrol. 2024, 46, 132–137. [Google Scholar]
- Mou, Z.L.; Li, Q.M.; Feng, J.Y.; Wang, Q.Y.; Wu, S.Q.; Li, C.J.; Yao, J.M.; Hu, R. Research and Application of Motion Control Strategy for the Towing Vehicle of Absolute Gravimeter. Opt. Precis. Eng. 2025, 33, 2231–2241. [Google Scholar]
- Wang, J.P.; Hu, M.Z.; Zhou, M.K.; Cheng, Y.; Deng, X.B.; Zhang, M.H.; Xiao, C.; Li, Z.Y.; Wei, J.; Zhou, C.; et al. Cave Comparison Observation of Domestic Absolute Gravimeter. J. Geod. Geodyn. 2025, 1–12. [Google Scholar]
- Mou, Z.L.; Han, X.; Hu, R. Optimal zero-crossing group selection method of the absolute gravimeter based on improved auto-regressive moving average model. Chin. Phys. B 2023, 32, 405–412. [Google Scholar] [CrossRef]
- Xu, J.Y.; Su, D.W.; Wang, Q.Y. Design of Host System for Miniature Absolute Gravimeter. Acta Metrol. Sin. 2022, 43, 489–493. [Google Scholar]
- Fan, F.; Yang, P.X.; Wang, Q.Y.; Feng, J.Y.; Yao, J.M.; Hu, R.; Wu, S.Q. Research on Adjustment Method of Distance Between Center of Mass and Optical Center of Falling Body in Absolute Gravimeter. Acta Metrol. Sin. 2024, 45, 231–237. [Google Scholar]
- Yu, Y.; Hu, X.; Shi, W.J.; Ye, Z.W.; Lü, K.; Bao, F.; Wang, R.L.; Feng, J.Y. Measuring and adjusting the distance between the center of mass and optical center of a free-falling body in an absolute gravimeter. Metrologia 2022, 59, 045001. [Google Scholar] [CrossRef]
- Kren, P.; Pálinkás, V.; Hald, J. Experiment with simultaneous measurements at two optical wavelengths in the FG5X absolute gravimeter. Meas. Sci. Technol. 2024, 35, 035013. [Google Scholar] [CrossRef]
- Zhou, L.F.; Xu, H.; Geng, R.R.; Yao, Z.Y. Modeling and application research of absolute gravimeter driven by a V-shaped linear ultrasonic motor. Rev. Sci. Instrum. 2024, 95, 125002. [Google Scholar] [CrossRef]
- Yao, J.M.; Zhuang, W.; Feng, J.Y.; Wang, Q.Y.; Zhao, Y.; Wang, S.K.; Wu, S.Q.; Li, T.C. Effect of vibration noise with fixed phase on absolute gravimetry applying vibration isolator. Acta Phys. Sin. 2021, 70, 219101. [Google Scholar] [CrossRef]
- Rothleitner, C.; Andreas, B. High-accuracy determination of the beam divergence error in free-fall absolute gravimeters. Metrologia 2024, 61, 035003. [Google Scholar] [CrossRef]
- Hu, R.; Feng, J.Y.; Mou, Z.L.; Yin, X.L.; Li, Z.F.; Ma, H.R. Incipient fault diagnosis for the cam-driven absolute gravimeter. Rev. Sci. Instrum. 2022, 93, 054501. [Google Scholar] [CrossRef] [PubMed]
- Cassens, C.; Meyer-Hoppe, B.; Rasel, E.; Klempt, C. Entanglement-Enhanced Atomic Gravimeter. Phys. Rev. X 2025, 15, 011029. [Google Scholar] [CrossRef]
- Li, Z.L.; Wu, Q.; Zhang, Y. Design of an automatic zeroing system for the laser interferometer absolute gravimeter based on STM32. Seismol. Geomagn. Obs. Res. 2025, 46, 147–155. [Google Scholar]
- Lu, Q.; Gao, Z.F.; Zhong, X.B.; Dai, J.; Huang, Q.; Hu, S.Y. Transmission characteristics of finite-angle steel belts and the influence of pre-tension on output characteristics. Acta Armamentarii 2022, 43, 676–685. [Google Scholar]
- Lu, Z.Q. Research on Data-Driven Control Method for Linear Induction Motors. Master’s Thesis, University of Jinan, Jinan, China, 2024. [Google Scholar]
- Ramesh, H.; Arockia Edwin Xavier, S.; Muthu Pandi, S. Prediction of End-Milling Optimal Parameters Using ANN-Based NSGA-II Model. In Recent Trends in Mechanical Engineering; Springer: Singapore, 2023. [Google Scholar]
- Wang, Y.Q.; Qin, X.Y.; Jia, W.X.; Lei, J.; Wang, D.X.; Feng, T.M.; Zeng, Y.J.; Song, J. Multiobjective Energy Consumption Optimization of a Flying–Walking Power Transmission Line Inspection Robot during Flight Missions Using Improved NSGA-II. Appl. Sci. 2024, 14, 1637. [Google Scholar] [CrossRef]
- Yang, D.; Yang, S.; Han, M.; Liu, J. Multi-Target Trajectory Optimization of Dual-Arm Robot Based on NSGA-II Algorithm. In Proceedings of the 7th International Conference on Electrical, Mechanical and Computer Engineering (ICEMCE), Kuala Lumpur, Malaysia, 15–17 November 2023; pp. 579–584. [Google Scholar]
- Deb, K.; Pratap, A.; Agarwal, S.; Meyarivan, T. A fast and elitist multiobjective genetic algorithm: NSGA-II. IEEE Trans. Evol. Comput. 2002, 6, 182–197. [Google Scholar] [CrossRef]
- Hu, R.; Wu, S.Q.; Mou, Z.L.; Feng, J.Y.; Niu, X.B. Research on vibration characteristics of absolute gravimeters. J. Vib. Meas. Diagn. 2022, 42, 220–226+403. [Google Scholar]
- Taengtang, T.; Srinuanjan, K.; Kamoldilok, S. Proof of using fourier coefficients for root mean square calculations on periodic signals. Adv. Stud. Theor. Phys. 2013, 8, 21–25. [Google Scholar]
- Wang, X.D.; Zhang, Z.F.; Lü, C.; Hu, C.Y.; Wu, Z.W.; Yang, F. Research on vibration characteristics of partially liquid-immersed steel strips under tension. J. Vib. Shock 2025, 44, 148–157. [Google Scholar]
- Zhang, J.; Liang, J.; Gu, P.Y.; Zhou, C.S.; Liu, L.S. Noise analysis and control caused by self-excited vibration of CVT steel belts. Noise Vib. Control 2021, 41, 175–179. [Google Scholar]
- Xue, D.L.; Liu, K.; Zhong, X. Research on clamping force control system of metal belt continuously variable transmission based on slip. J. Mech. Transm. 2013, 37, 10–13. [Google Scholar]
- Fan, Q.S.; Yin, Y.J. Engineering Mechanics. In Engineering Mechanics, 6th ed.; Higher Education Press: Beijing, China, 2021; pp. 128–135. [Google Scholar]
- Gong, C.G.; Hu, T.L.; Ye, Y.X. Dynamic multi-objective optimization strategy of milling parameters based on digital twin. Comput. Integr. Manuf. Syst. 2021, 27, 478–486. [Google Scholar]
- Wang, Q.; Cai, K.C.; Qin, Z.Y.; Guan, Z.L. Multi-objective optimization of laminated structures for central cone based on NSGA-II genetic algorithm. Int. J. Heat Mass Transf. 2025, 253, 127531. [Google Scholar] [CrossRef]
- Ji, H.; Zhao, J.Y.; Chen, J.; Ge, R. NSGA-II Algorithm Based on Simplified Hypervolume. Softw. Eng. 2024, 27, 26–29. [Google Scholar]
- Lin, Y.D. Analysis of Energy Consumption Right Verification Data Based on Wilcoxon Signed-Rank Test. Chem. Eng. Equip. 2021, 187–189. [Google Scholar]
- Sadeghian, O.; Oshnoei, A.; Nikkhah, S.; Mohammadi-Ivatloo, B. Multi-objective optimisation of generation maintenance scheduling in restructured power systems based on global criterion method. IET Smart Grid 2019, 2, 203–213. [Google Scholar] [CrossRef]
- Pei, H. Modal Analysis and Structural Optimization Design of Bogie Frame. Master’s Thesis, Dalian Jiaotong University, Dalian, China, 2025. [Google Scholar]
- Wu, Q.; Guo, Y.G.; Teng, Y.T.; Chi, S.L.; Huang, D.L.; Fang, Y.Y.; An, H.L. A new falling body control method in the design of absolute gravimeters. Prog. Geophys. 2011, 26, 443–449. [Google Scholar]
- Yun, P.W.; Fu, H.D.; Zhang, H.T.; Sun, J.T.; Zhao, M.H.; Xie, J.X. Rapid design of high-end copper alloy processes combining orthogonal experiments, machine learning, and Pareto analysis. J. Mater. Res. Technol. 2025, 36, 1005–1016. [Google Scholar] [CrossRef]
Disclaimer/Publisher’s Note: The statements, opinions and data contained in all publications are solely those of the individual author(s) and contributor(s) and not of MDPI and/or the editor(s). MDPI and/or the editor(s) disclaim responsibility for any injury to people or property resulting from any ideas, methods, instructions or products referred to in the content. |
© 2025 by the authors. Licensee MDPI, Basel, Switzerland. This article is an open access article distributed under the terms and conditions of the Creative Commons Attribution (CC BY) license (https://creativecommons.org/licenses/by/4.0/).