Featured Application
The findings of this study can inform the design and planning of non-motorized shared spaces by incorporating the microscopic behavior patterns and psychological safety preferences of vulnerable road users (VRUs), such as pedestrians, cyclists, and e-bike riders. By understanding interaction dynamics and perceived safety zones, urban planners and transport engineers can develop more inclusive and safer shared space environments, especially in high-density urban settings like Shenzhen City, China. The results also offer guidance for policymaking and infrastructure improvements, such as adjusting lane widths, introducing buffer zones, or accommodating users with large items to reduce conflict risks and enhance user comfort.
Abstract
The concept of shared space is proposed to improve the safety and health of vulnerable road users (VRUs) by promoting walking and cycling. However, despite the documented benefits of shared spaces, concerns were raised about the frequency and severity of road user interactions in shared spaces. Thus, the objective of this study is to investigate the microscopic behaviors and psychological characteristics of vulnerable road user interactions (i.e., pedestrian–e-bike interactions and pedestrian–cyclist interactions) in non-motorized shared spaces and their interplay mechanisms. We identify a total of 334 interactions in the same- and opposite-direction using the Dutch Objective Conflict Technique for Operation and Research (DOCTOR) method at four locations in Shenzhen city, China. Trajectories of road users involved in these interactions were extracted to identify key points in trajectories and interaction phases, considering both microscopic behaviors and psychological factors synthetically. The study also compared lateral and longitudinal decision distances, maneuvering distances, maneuvering time, and safety zones across different characteristics, including severity levels, road user types, genders, and whether road users carry large items or not. The results show that the main characteristic of the interaction’s starting and ending points changes in the lateral direction. Road users have a stronger sense of security in swerve-back phases. The average lateral psychological safety distance in shared spaces is about 1.125 m. Moreover, the average safety zone area for road users in opposite and same-direction interactions are 4.83 m2 and 9.36 m2, respectively. Road users carrying large items perceived a higher risk in shared spaces and required longer lateral psychological safety distances and larger safety zones. The findings of this study can be used to better design shared space facilities, considering the perceived risk of road users and their interactions and psychological behavior.
1. Introduction
Cycling and walking have been encouraged by many cities worldwide as healthy and environmentally friendly modes of transportation in recent years [1]. Specifically, electric bicycles (e-bikes) have become the preferred mode of commuting for more residents in China [2,3]. However, vulnerable road users (VRUs), including conventional bicycles, e-bikes, and pedestrians, are exposed to higher risks than motorized vehicles. For example, VRUs account for nearly half (46%) of the traffic fatalities worldwide [4]. The concept of shared space is proposed to reduce collision and fatality risks. A shared space is defined as “a street or place designed to improve pedestrian movement and comfort while reducing the dominance of motor vehicles and enabling all users to share the space rather than follow the clearly defined rules implied by more conventional designs” [5]. No obvious segregation is set between shared space users, and the right-of-way is shared by all road users. Motorized vehicles can be prohibited in shared spaces to create non-motorized shared spaces [6].
Despite the documented safety benefits of shared spaces, the frequency of interactions between road users increases [7]. However, the majority of the previous studies focused mainly on vehicular traffic on conventional roads, while little attention was paid to the non-motorized road users’ interactions in shared spaces. Only a few studies have investigated the behavior of VRUs. Phase identification and distances during interactions were analyzed as the key to interaction behavioral research in these studies [8,9]. The interaction behavior of VRUs in shared spaces can differ significantly from that of motorized vehicles or on conventional roads.
Moreover, little is known about the psychological change and how psychological factors affect behavior when shared space users are involved in interactions. For example, safety attitude, risk perception, and other psychological factors affect traffic safety in shared spaces. Additionally, psychological factors are closely linked to microscopic behaviors and influence one another. Therefore, investigating psychological factors is also conducive to more accurately and comprehensively identifying interaction phases.
This study aims to investigate the microscopic behaviors and psychological characteristics of e-bikes, conventional bicycles, and pedestrian interactions in shared spaces. The contribution of this paper lies in proposing an interaction phase division method that considers both behavioral and psychological characteristics. The contribution includes the following: (1) proposing the definition and identification method of trajectory key points and interaction phases considering microscopic behaviors and psychological characteristics synthetically; (2) investigating the lateral and longitudinal decision distance, maneuvering distance, maneuvering time, and safety zone by different characteristics; and (3) exploring psychological characteristics of road users during the interaction process and the relationship with microscopic behaviors. Specifically, this study addresses the research gap by developing a novel trajectory key point identification method that incorporates psychological decision-making phases, quantifies lateral psychological safety distances, and establishes safety zone requirements for different interaction scenarios in shared spaces.
2. Literature Review
2.1. Behavior Analysis of Non-Motorized Shared Space Users
A few studies have investigated the behavior of VRUs in shared space. Bicycle following and overtaking maneuvers were characterized by [9] on cycling paths using multivariate finite mixture model-based clustering. Kaparias and Li [10] studied the behavior and perceptions of powered two-wheeler users in shared spaces and provided recommendations about street layouts with elements of shared space. Beitel et al. [11] estimated the risk of pedestrian–cyclist interactions using several proposed surrogate safety measures (e.g., time-to-collision (TTC), Post-Encroachment Time (PET)). The study proposed a safety evaluation framework for shared spaces that combines behavioral analysis, event-based surrogate safety measures (SSMs), and traffic flow. Alsaleh and Sayed [12] developed a Markov Game-based interaction model for non-motorized shared space users, which can replicate microscopic interaction behavior.
Several parameters were used to discuss the behavior of VRS in shared spaces. These parameters include road user speed, acceleration, lateral distance, longitudinal decision, and comfort zone and were discussed as the key parameters of shared space user’s behavior. Khan and Raksuntorn [8] investigated the passing interactions on exclusive bicycle paths. The lateral spacing during passing and average passing lengths were used to describe the passing interactions. Alsaleh et al. [6] classified the interactions between cyclists and pedestrians in shared spaces based on the interacting angle, and defined indicators in different interaction phases such as speed profiles, acceleration profiles, and longitudinal and lateral distances between road users. The participants were recruited by Lee et al. [13] to avoid a stationary dummy cyclist by braking or steering comfortably. The parameters such as speed, distance-to-collision, time-to-collision, and lateral clearance were calculated to model cyclist braking and steering using constant deceleration and Gaussian curves separately. The study indicated that the field of safe travel and minimum stopping distance can describe the comfort zone of bicycles. Furthermore, headway and pedestrian gait parameters were also explored in several previous studies (e.g., [14,15,16]).
2.2. Psychology Analysis of Non-Motorized Shared Space Users
The studies on the psychological analysis of VRUs focus on macro security behavior, while little attention is paid to the psychological factors of VRU interactions and their microscopic behavior. For example, Wang et al. [17] used a questionnaire method to analyze the relationship between psychological factors and risky driving behaviors of e-bike riders. The study found that the risk-taking attitude may lead to group violation actions. Yao and Wu [18] found that the possibility of aberrant riding behaviors decreases with the increase in positive attitudes toward safety and concern about traffic risk. Lehtonen et al. [19] compared the risk perception of two groups: frequent and infrequent bicyclists. The result shows that frequent bicyclists are more cautious, and it is advantageous to anticipate or detect more hazards. Zheng et al. [20] also verified the conclusion of Lehtonen et al. [19]. The study found that psychological factors are influenced by riding frequency and experience, and the riding risk perception increased with the increase in these factors.
Only a few studies have investigated the psychological factors in non-motorized shared spaces. Risk compensation theory was used to explain how people adjust their behavior (compensate) according to their own perceived risk level [21]. It has provided important information on the relationship between psychological factors and behavior. Overtaking interactions were improved more critically than oncoming interactions in terms of safety perspective. Gkekas et al. [22] conducted an intercept survey of 337 travelers on a university campus and found that road users who have experienced an incident before may perceive more security in pedestrian–cyclist interactions.
In summary, while existing research has made significant contributions to understanding VRU behavior in shared spaces, several critical gaps remain. Current studies primarily focus on physical behavioral measures without integrating psychological factors that influence decision making during interactions. The majority of research lacks systematic methods for identifying key trajectory points that reflect both behavioral and psychological transitions. Furthermore, limited attention has been given to quantifying safety zones and psychological comfort distances that could inform infrastructure design. This study addresses these gaps by proposing a comprehensive framework that synthesizes microscopic behavioral analysis with psychological trajectory point identification, providing quantitative measures for shared space design optimization.
3. Methodology
3.1. Interaction Identification
The Dutch Objective Conflict Technique for Operation and Research (DOCTOR) is a standardized conflict manual observation technique with objective, well-defined observation units developed by the Stichting Wetenschappelijk Onderzoek Verkeersveiligheid (SWOV) and the Instituut voor Zintuigfysiologie (TNO) in The Netherlands [23]. In this study, we improved the DOCTOR technique considering more relevant characteristics for VRUs than motor vehicles, such as maneuvering time and space and controlling situations. This technique was used to identify normal interactions and traffic conflicts. A traffic conflict is defined as “an observable situation in which two or more road users approach each other in space and time to such an extent that there is a risk of collision if their movements remain unchanged” [24]. The key prerequisite for judging a conflict in this study is a high collision likelihood if the direction or speed of the road user does not change. In addition, VRU evasive action, available space, time-to-collision (TTC), and Post-Encroachment Time (PET) are recorded by observers and are used for identifying a conflict. However, the normal interaction refers to a situation where a road user’s moving situation (e.g., speed or direction) changes due to the existence of other road users without being involved in a conflict. Normal interactions and traffic conflicts are collectively referred to as interactions. The severity of normal interactions is 0, and the severity of traffic conflicts is scored on a scale of 1–5. The specific scoring criteria of different severity classes are shown in Table 1 [23,25]. For instance, a normal interaction (severity 0) occurs when a cyclist slightly adjusts their path upon seeing a pedestrian ahead, maintaining safe distance throughout. A traffic conflict (severity 2–3) occurs when a cyclist must brake suddenly and swerve sharply to avoid a pedestrian who unexpectedly changes direction, requiring controlled evasive action with limited maneuvering time.

Table 1.
Classification of the normal interactions and traffic conflicts by severity.
Two expert analysts validate and code the interactions together. Uncertain events are discussed by the two analysts before being recorded to ensure data accuracy, similar to the previous studies [26,27]. The disagreement rate was minimal (less than 2%). The specific coding rules are shown in Table 2 [23,25].
Table 2.
Traffic interaction variables.
3.2. Trajectory Extraction
In this study, we extracted VRU trajectories using the semi-automated T-Analyst software [28]. In this software, a camera calibration procedure is firstly carried out using the TSAI model [29], where the camera image coordinates are matched to the corresponding real-world coordinates so that the trajectory of each type of road user in the actual coordinated system can be extracted frame by frame. Then, road users are tracked each time frame to form road user trajectories. The extracted road user coordinates represent the center of the road users. Then, road user variables (e.g., speed, acceleration) are calculated each time frame using the extracted trajectories. A flowchart for the road user trajectories’ extraction process is presented in Figure 1.
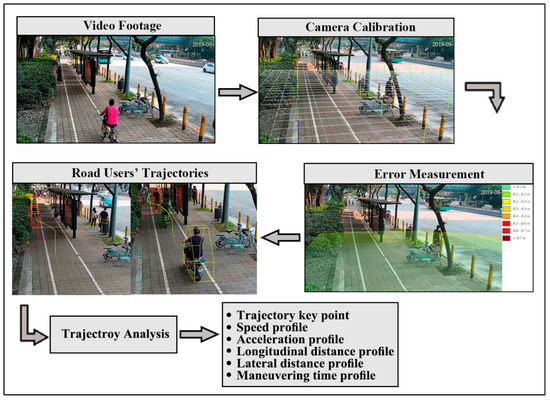
Figure 1.
A flowchart for the road user tracking process.
3.3. Behavioral and Psychological Variable Calculations
Several variables are used to describe the behavior of cyclists, e-bikers, and pedestrians in shared paths. These variables are selected based on previous studies on cycling behavior [30,31], e-bike behavior [10,20,32], pedestrian behavior [15,33,34], vulnerable road user interaction behavior [11,35], and mixed traffic research in shared paths/space [36,37,38,39]. The previous studies used several variables to describe the behavior of cyclists, e-bikers, and pedestrians, including speed, decision distance, swerve-away maneuvering distance, swerve-back maneuvering distance, safety distance, swerve-away time, swerve-back time, psychological starting point ratio, psychological ending point ratio, and safety zone.
A road user trajectory consists of a tuple of the spatial coordinates (x and y coordinate values) at each video frame (1/25 s), as shown in Equation (1). The road user speed components in the x and y coordinates are calculated as the rate of change in the road user spatial corresponding coordinates each time frame.
where is a discrete temporal index, ∈t is a discrete temporal index, are the spatial coordinates of the road user at time frame (), and are the corresponding velocities. A speed profile (S) for each road user is defined along the trajectory lifetime as , norm(.) is the Euclidean norm (L2 norm), and and are the velocity vectors of length n, for the and coordinates, respectively.
The decision distance is defined as the distance between two interacting road users at the moment when any of them decides to start swerving. The lateral and longitudinal decision distance are given in Equations (2) and (3).
where and are the spatial coordinates of the road user who took swerving action (calculation object) at the start point and and are the spatial coordinates of the other interacting road user. The lateral and longitudinal maneuvering distance is the moving distance of road user during the swerve-away phase and swerve-back phase , and can be computed using Equations (4)–(7).
where are the spatial coordinates of the start point, farthest point, and end point, respectively. The farthest point is the largest lateral distance point between the interacting road users. Moreover, it is the demarcation point of the swerve-away and swerve-back phases. The swerving direction from left to right or from right to left in the lateral direction is the most obvious feature of the farthest point, and correspondingly, the value of Vx must be 0 at this point.
The safety distance describes how far two interactive road users are when the swerving road user reaches the farthest point (road users think they keep a safe distance at this point). Similarly, the lateral and longitudinal distance components are calculated separately, as shown in Equations (8) and (9), respectively.
where , are the spatial coordinates of swerving road users and , are spatial coordinates of another interaction of participants at same moment. In addition, the ratio of the completed process and the whole swerve away or swerve back phase when the road user reaches the psychological point is calculated using Equations (10)–(13), respectively.
where are the X and Y coordinate value of the psychological starting point, and are the X and Y coordinate values of the psychological ending point. The illustrations of the distances are presented in Figure 2.
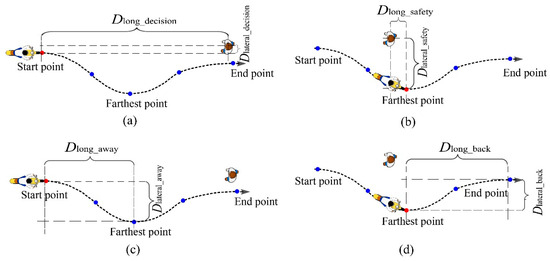
Figure 2.
Illustration of (a) longitudinal and lateral decision distance; (b) longitudinal and lateral safety distance; (c) longitudinal and lateral swerve-away maneuvering distance; and (d) longitudinal and lateral swerve-back maneuvering distance.
Serious surrogate safety measures were used in behavioral and psychological analysis studies to evaluate the interactions, such as overtaking speed, vehicle lateral placement at the time of passing bicyclists, and comfort zone boundaries (CZBs) [40,41,42,43]. The comfort zone boundary (CZB), which describes the minimum distance of two road users, is one of the most common measures. However, most of these measures can only describe a moment in the interactions. We define the safety zone in this study as a new index that can describe the whole interaction process. We defined the area enclosed by the actual trajectory and the virtual original trajectory if the road users are not involved in the interactions (i.e., the area is occupied by road users due to the interaction). The definition of the safety zone for two different types of trajectories is illustrated in Figure 3. In order to easily calculate the safety zone, the coordinate system of each trajectory is reset. The start point is set as the coordinate origin and the virtual trajectory direction is set as the y-axis. Equation (14) shows the calculation method.
where is the function represented as the actual trajectories in X and Y coordinates. Prior to conducting t-tests and ANOVA analyses, data normality was assessed using Shapiro–Wilk tests and homoscedasticity was verified using Levene’s test to ensure the validity of parametric statistical procedures. Tests of significance (two-sample t-test and ANOVA) were used with a significance level of p < 0.05 to investigate the significance of parameters in different factors during the interaction. Paired t-tests were used to compare the change in speed before and during the interactions.
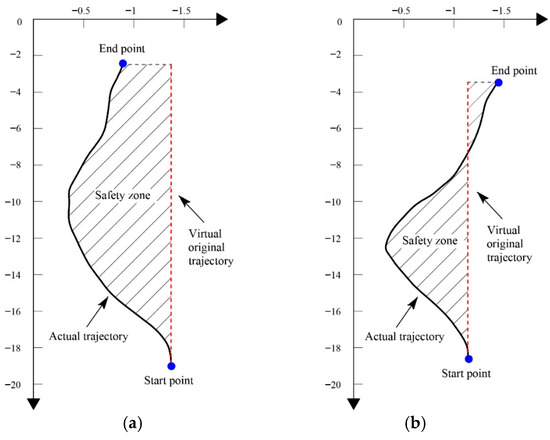
Figure 3.
Schematic diagram of the safety zones: (a) trajectory no crossing, (b) trajectory crossing.
3.4. Trajectory Key Points
The trajectory key points of road users who adopted evasive actions are classified into five points, as shown in Figure 4. These points include (1) the start point where the road user starts to adopt the evasive maneuver (e.g., swerving); (2) the psychological starting point where the road user’s psychology changes in the swerve away process; (3) the farthest point where the lateral distance between road users reaches the maximum; (4) the psychological ending point where the road user’s psychology changes in the swerve back process; and (5) the end point where the road user ends the collision avoidance maneuver and comes back to the normal moving condition. Thus, road user interactions can be classified into two phases: the swerve-away phase (from the starting point to the farthest point) and the swerve-back phase (from the farthest point to the ending point). The key points were identified manually based on both lateral speed (vx) and trajectories of road users. It is important to note that ‘psychological’ variables in this study refer to behaviorally inferred psychological states based on observable trajectory changes, rather than direct psychological measurements from participants.
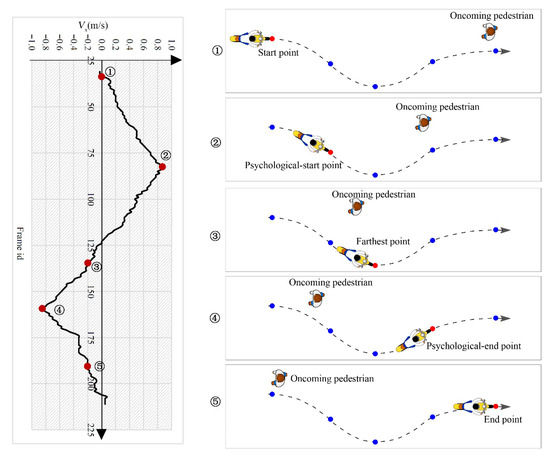
Figure 4.
Schematic diagram of trajectory key points and correspondence to Vx.
3.4.1. Trajectory Key Points Identification
The starting and ending points of road user interactions are associated with changing the moving direction or the acceleration status when the moving direction remains constant. Based on this phenomenon, five types of feature points of Vx used to identify starting and ending points are proposed and listed in Table 3. During the swerve-away phase, the two arcs split by the psychological start-point curve in different directions. The psychological start point and the psychological end point mark the positions along the smoothed trajectory where the longitudinal velocity (Vx) reaches its highest peak or lowest valley.
Table 3.
Feature points of vx for the interaction starting and ending points.
3.4.2. Psychological Starting and Ending Points
The psychological starting and ending point represent road users’ perception of how complete their swerving maneuver is. For example, at the psychological starting point, the road user is still swerving away from the other interacting user but shifts from accelerating laterally to decelerating in order to prepare for swerving back. The centers of the two arcs divided by the psychological starting point also differ in direction during the swerve-away phase. The psychological starting and ending points correspond to the peak or valley values of Vx in the smoothed trajectories. These kinematic markers indicate when road users transition between acceleration and deceleration phases, reflecting behavioral changes in their comfort level during interactions.
4. Data Description
4.1. Video Recordings
Video data were collected at four shared space facilities in the Futian district of Shenzhen city: Lianxin Street, Caitian Street, and two locations on Sungang West Street (Figure 5). Recordings were conducted during the morning (7:30–9:30) and evening (17:30–19:30) peak periods on normal working days in September 2019, under mild weather conditions. The cycleway type and widths in Lianxin Street, Caitian Street, and Huanggang Street are cement with 1.6 m, brick with 1.5 m, and cement with 1.6 m, respectively. Similarly, the walkway type for the three locations is bricks with widths of 1.6 m, 2.5 m, and 1.6 m, respectively.
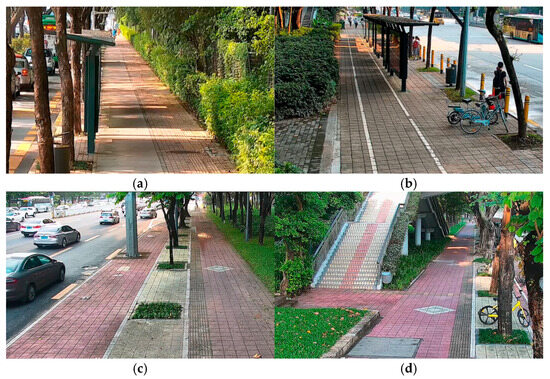
Figure 5.
Camera field of view at observed locations: (a) Lianxin Street, (b) Caitian Street, (c) Sungang West Street 1, and (d) Sungang West Street 2.
In total, the dataset includes pedestrians, conventional bicycles, and e-bikes. User density varied slightly between morning and evening periods, with slightly higher activity during the evening peak.
Videos were recorded at a resolution of 1920 × 1080 pixels and a frame rate of 25 frames per second, ensuring high-quality coverage of interactions between road users. This dataset provides a comprehensive basis for analyzing movement patterns, safety distances, and interaction behaviors in shared space environments.
Figure 5 presents four urban scenes selected from shared space facilities in the Futian district of Shenzhen. These scenes were chosen to reflect the diversity of spatial configurations and user interactions observed across the study sites. While Scene C does not include a bus stop and Scene D features a pedestrian overpass, these variations were intentional to capture a range of design elements commonly found in shared space environments. Rather than representing a uniform typology, the scenes illustrate specific cases that highlight different infrastructural features, user densities, and interaction patterns. This approach enables a more nuanced analysis of how shared space principles are applied in varied urban contexts.
4.2. Interaction and Trajectory Data
Road user interactions in the shared spaces were classified into two categories: (1) opposite-direction interaction and (2) same-direction interaction. A total of 668 road users involved in interactions were observed in the analyzed video data (412 in opposite-direction interactions and 256 in same-direction interactions). The interaction types were manually reviewed and classified based on the interaction angle, similar to [6,11]. The interaction angles for the opposite- and same-direction interactions are 180° ± 30° and 0° ± 30°, respectively. In the same-direction interactions, most of the interactions occur by faster road users in the rear (i.e., e-bikes) that overtake slower road users (i.e., pedestrians) in the front. In the opposite-direction interaction, at least one of the interacting road users swerves to avoid a collision.
The trajectories of all shared space users were extracted, smoothed, and recorded by T-Analyst. The trajectories of road users involved in the same-direction and opposite-direction interactions are presented in Figure 6.
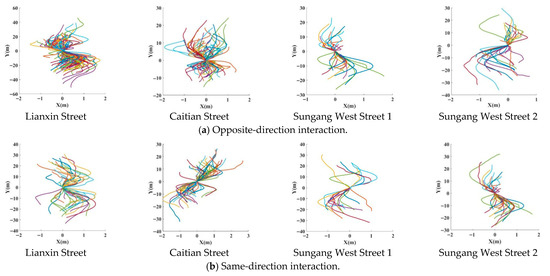
Figure 6.
Trajectory data of observed locations.
5. Result
5.1. Opposite-Direction Interactions
5.1.1. Start Point
We have listed the different start point types, severity levels, and road user types in opposite-direction interactions in Table 4. Class 0 is defined as a normal interaction, Class 1 and 2 conflicts are defined as slight conflicts, and Class 3, 4, and 5 conflicts are defined as serious conflicts. Figure 7 shows the proportions of different start point types across interaction severity levels and road user types. Overall, type 1 is the most frequent starting point type, accounting for more than half of all categories (except pedestrians, where type 1 and type 2 are the most frequent).
Table 4.
Overview of start point types and statistics by different classifications in opposite-direction interactions.
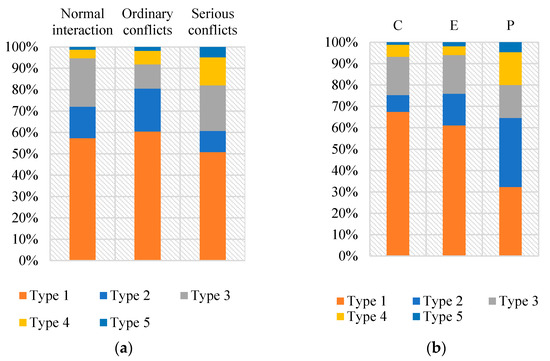
Figure 7.
Proportions of start point types in opposite interactions: (a) proportions by different severity levels; (b) proportions by road user types.
The means and standard deviation of lateral and longitudinal decision distances, swerve-away maneuvering distances, and swerve-away time of total and various classifications are shown in Table 5. The average lateral and longitudinal distances are found to be 0.45 m and 14.14 m, with standard deviations of 0.34 m and 8.38 m, respectively. There is no significant difference in the lateral (p-value = 0.874) and longitudinal (p-value = 0.734) decision distances between conventional bicycles and e-bikes, although both are considerably higher than those of pedestrians.
Table 5.
The decision distances and features of the swerve-away phase in opposite-direction interactions.
The average lateral and longitudinal swerve-away maneuvering distances are found to be 0.55 m and 7.71 m, with standard deviations of 0.38 m and 4.55 m, respectively. The lateral and longitudinal distances of pedestrians are far less than other road users (p-value < 0.001). The longitudinal swerve-away phase distance of e-bikes is the largest. The average swerve-away phase time is 2.07 s, with a standard deviation of 0.91 s. No significant differences are observed in the swerve-away times across the different severity levels (p-value = 0.709) or across the different road user types (p-value = 0.413). However, females are found to spend more time swerving away than males (p-value = 0.015).
5.1.2. Psychological Starting Point
The means and standard deviation of the psychological starting point across different interaction severity levels are shown in Table 6. The psychology start point presents the extent to which the swerve-away phase is completed. The ratios in the lateral and longitudinal directions are 0.47 and 0.48, with standard deviations of 0.17 and 0.18. No significant differences were found among the different interaction severity levels. Thus, the psychological point of road users usually occurs when they think they have completed half of the swerve-away phase both in lateral and longitudinal directions.
Table 6.
The features of psychology start point in opposite-direction interactions.
5.1.3. Farthest Point
The farthest point is the point with the largest lateral distance, also the point where the road user starts to swerve back. The result shows that about 67% of road users (235) decided to swerve back to their original moving direction before completely passing the other road user. Moreover, around 33% of road users (135) start to swerve back when they completely pass the other interacting road user. Table 7 presents the distances between the two road users at this point. The average lateral distance of road users at the farthest point is 1.12 m, with a standard deviation of 0.33 m. This value represents the safe lateral distance as perceived by road users. The mean longitudinal safety distance is 3.55 m, with a standard deviation of 3.57 m. Among the classifications, serious conflicts exhibit the lowest average lateral safety distance (p < 0.001). Pedestrians have the shortest lateral and longitudinal safety distances, whereas e-bikes show the highest average longitudinal distance (lateral, p = 0.001; longitudinal, p < 0.001). Moreover, the average lateral distance is significantly affected by the carrying of sunshades, large items, and takeout boxes (p-value = 0.002). The differences are not statistically significant regardless of gender.
Table 7.
The features of farthest point in opposite-direction interactions.
5.1.4. Psychological Ending Point
Similar to the psychology start point, the psychological ending point ratios were calculated and shown in Table 8. The average lateral and longitudinal ratios are found to be 0.38 and 0.42 with standard deviations of 0.15 and 0.16, respectively. Differences were not statistically significant in the psychological end point distances observed across the different severity levels, road user types, and genders.
Table 8.
The features of psychology end-point in opposite-direction interactions.
5.1.5. Interaction End Point
Table 9 and Figure 8 show the overview of end point types and statistics by different severity levels and road user types. Table 10 shows the time and maneuvering distances in the swerve-back phase and the time of the whole interaction process. The average lateral and longitudinal swerve-back maneuvering distances are 0.62 m and 7.43 m, with standard deviations of 1.43 m and 5.81 m. The average time of the whole process is 3.75 s. The swerve-back phase accounts for an average of 1.7 s. Male road users are faster in completing the whole process compared to female road users (p-value = 0.011).
Table 9.
Overview of end point types and statistics by different classifications in opposite-direction interactions.
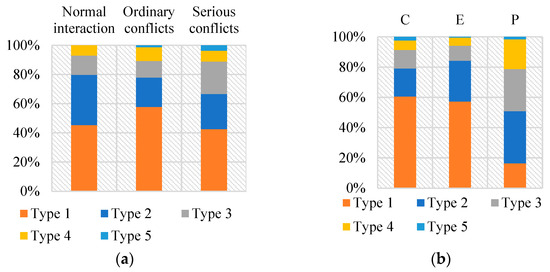
Figure 8.
Proportions of end point types in opposite-direction interactions: (a) proportions by different severity levels; (b) proportions by road user types.
Table 10.
The features of the swerve-back phase and whole process time in opposite-direction interactions.
5.1.6. Comparison of Speed by Interactions
The speeds before and during the opposite-direction interaction (swerve-away phase) are shown in Table 11. On average, the speed of e-bikes is reduced significantly by approximately 5.02% to ease the conflict and to ensure evasive action is taken (p-value < 0.001). Conventional bicycles significantly reduced their speed by 2.85% (p-value < 0.001). Conventional bicycles show a similar pattern to electric vehicles, but the speed drop is lower than that of electric vehicles. Values reported in Table 11 suggest that there is no significant change in pedestrian speeds when they swerve. A similar result is reported in [6].
Table 11.
Speed’s significance by interaction in opposite-direction interactions.
5.1.7. Safety Zone
The average safety zone for opposite-direction interactions is about 4.83 m2, with a standard deviation of 5.19 m2. The average value of the safety zone under various classifications is shown in Table 12. The results show that the safety zones of e-bikes and conventional bicycles are much larger than that of pedestrians (p-value < 0.001). Road users carrying other large items occupy larger safe zones (p-value = 0.033).
Table 12.
The average value of a safety zone under various classifications in opposite-direction interactions.
5.2. Same-Direction Interaction
Similar to opposite-direction interactions, same-direction interactions are analyzed from aspects of start point, psychology start point, farthest point, psychology end point, and end point. The behavior of the road user who adopted evasive actions (mostly conventional bicycles and e-bikes) is the same in same-direction interactions.
5.2.1. Start Point
The different start point types of the same-direction interactions are presented in Table 13. Type 1 and type 2 are the two major types of the start point. As the severity level increases, the proportion of type 1 increases while the proportion of type 2 decreases, as presented in Figure 9.
Table 13.
Overview of start point types and statistics by different classifications in same-direction interactions.
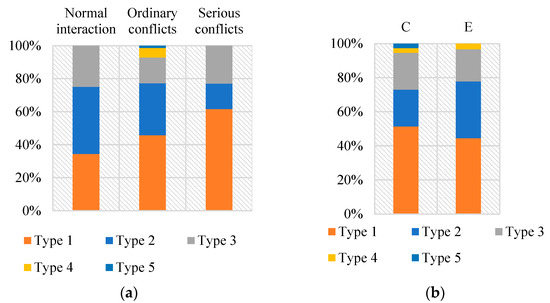
Figure 9.
Proportions of start point types in same-direction interactions: (a) proportions by different severity levels; (b) proportions by road user types.
For same-direction interactions, the mean lateral and longitudinal decision distances are 0.87 m and 10.18 m, with standard deviations of 0.43 m and 4.92 m, respectively (Table 14). The lateral and longitudinal swerve-away maneuvering distances average 0.35 m and 7.02 m, with standard deviations of 0.26 m and 4.40 m. E-bikes exhibit longer maneuvering distances compared with conventional bicycles (p < 0.001).
Table 14.
The decision distances and features of the swerve-away phase in same-direction interactions.
5.2.2. Psychological Starting Point
The psychological starting point ratios in lateral and longitudinal directions are 0.52 and 0.53, with standard deviations of 0.25 m and 0.18 m, as shown in Table 15. No notable variation in various severity levels, road user types, and genders are found.
Table 15.
The features of the psychological starting point in same-direction interactions.
5.2.3. Farthest Point
About half of the road users in the analyzed dataset started the swerving-back maneuver before completely overtaking the slower road users (pedestrians in most cases). The lateral and longitudinal safety distances are 1.13 m and 1.25 m, with standard deviations of 0.25 m and 1.67 m (Table 16). The average lateral safety distance of road users carrying large items is significantly shorter than other road users in same-direction interactions (p-value = 0.074).
Table 16.
The features of the farthest point in same-direction interactions.
5.2.4. Psychological Starting Point
The features of psychology end points in the same-direction interactions are shown in Table 17. The average lateral and longitudinal psychological ending point ratios are found to be 0.43 and 0.44, with standard deviations of 0.18 and 0.16. Results were mostly consistent across severity levels, road user types, and genders.
Table 17.
The features of the psychology end point in same-direction interactions.
5.2.5. End Point
The analysis of the different end point types in the same-direction interactions is shown in Table 18. The features of swerve-back time and the complete process time are shown in Table 19, as presented in Figure 10. Different from the start point, the proportion of type 1 increases with the increase in severity level. The average lateral and longitudinal maneuvering distances in the swerve-back phase are 0.62 m and 7.43 m, with standard deviations of 1.43 m and 5.81 m.
Table 18.
Overview of end point types and statistics by different classifications in same-direction interactions.
Table 19.
The features of swerve-back phase and whole process time in same-direction interactions.
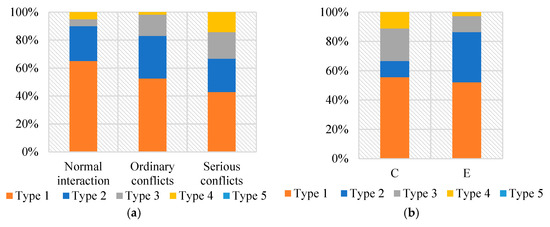
Figure 10.
Proportions of end point types in same-direction interactions: (a) proportions by different severity levels; (b) proportions by road user types.
5.2.6. Comparison of Road User Speed by Interaction
The average value of the e-bike and conventional bicycle speeds before and during same-direction interactions are presented in Table 20. The results show that e-bike speed reduced by 4.24% (p-value = 0.03), while conventional bicycle speed increased by 6.67% during the interaction (p-value = 0.04).
Table 20.
Speed’s significance by interaction in same-direction interactions.
5.2.7. Safety Zone
The average safety zone for the same-direction interaction is 9.36 m2, with a standard deviation of 6.26 m2. The average values of the safety zone under various classifications are shown in Table 21. Safety zones did not differ noticeably between road users carrying large items and others.
Table 21.
Safety zone average value of various classifications in same-direction interactions.
6. Discussion
6.1. Changing Maneuver in the Lateral Direction
Road user interaction behavior has been investigated in several previous studies. The phases of vulnerable users in shared spaces were identified by the change in the interaction state and road user trajectories [6]. In this study, key points of trajectory and feature points of vx were proposed to improve the accuracy of phase division. The findings conclude that changing direction in the lateral direction (type 1 and 2) is the main characteristic of the interaction’s starting and ending points. The proportion of cases where only acceleration changes but the moving direction remains constant (type 3, 4, and 5) is low.
Compared with e-bikes, the proportion of type 1 of conventional bicycles is higher. Different from the electric power system of e-bikes, conventional bicycles are entirely human-powered. Thus, cyclists tend to keep balance by turning the handlebars and traveling in arcs [44]. This may indicate that a certain lateral space is preferred in conventional bicycle interactions.
6.2. Road Users Have Higher Perceived Safety in the Swerve-Back Phase
Several previous studies have explored the feature points and phases of the swerving process. However, the majority of these studies are based on physical division and rarely consider psychological factors [8,9,40]. Unlike previous studies, changes in road user trajectories and psychological factors were considered in this study. The findings conclude that psychology start points in the same and opposite-direction interactions usually occur at the midpoint of the process. At the psychology start point, interacting road users perceive the resolution of the conflict (i.e., they do not accelerate away from each other in the lateral direction).
For the psychology end point, the interacting road users do not focus on the swerving back maneuver. For the opposite and same-direction interactions, the lateral ratios are found to be 0.38 and 0.43, and the longitudinal ratios are found to be 0.42 and 0.44, respectively. The comparison between the swerve-away phase and swerve-back phase is clearly shown in Figure 11. This result may indicate that road users have a stronger sense of security in the swerve-back phase than in the swerve-away phase and are more leisurely in their behavior. In addition, the ratio of psychology end points in opposite-direction interactions is smaller. It shows that swerve-back behavior in opposite-direction interactions is easier to complete for road users. One reason is that both road users perceive the conflict clearly and take evasive actions in most cases. Another reason is that the sense of being in conflict is reduced when they pass each other in opposite-direction interactions since they are far away from each other in the opposite-direction with a very low collision probability. In contrast, the road user in the same-direction interaction would feel a certain conflict after passing another road user, as the other interaction participant who is overtaken is moving in the same-direction, and the distance between them is still close.
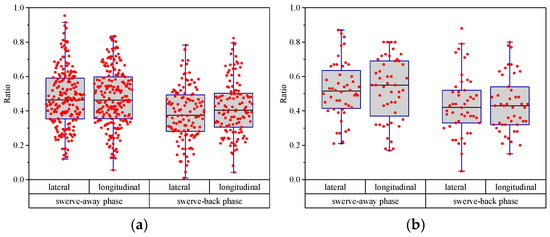
Figure 11.
Box plot of lateral and longitudinal ratio in different interaction phases; (a) opposite-direction interaction; (b) same-direction interaction.
6.3. Lateral Psychological Safety Distance
The distance between a road user and other interacting users is determined by the road user’s personal comfort zone [45]. Based on that, the farthest points in this study mean that the road users reach comfortable lateral distances and begin to swerve back. Therefore, the lateral distance at the farthest point of two road users can be seen as the lateral psychological safety distance. The average lateral psychological safety distances in opposite- and same-direction interactions are 1.12 m and 1.13 m, respectively. However, the maneuvering distances in the swerve-away phase of these two types of interaction are significantly different (0.55 m in opposite-direction interactions, 0.87 in same-direction interactions). This can be attributed to swerving a single road user in the same-direction interaction compared to both road users in opposite directions [25]. Finally, they reach almost the same lateral psychological safety distance. The average lateral psychological safety distance is about 1.125 m (average mean of lateral psychological safety distance in opposite- and same-direction interactions). On the other hand, road users feel safe when keeping a 1.125 m lateral distance. A similar result was reported by [13]. Their model shows that overtaking a steady cyclist may require approximately 1 m in the lateral direction. Although the traffic scene is different from this study and the results are slightly different, it can still provide evidence for our results.
The results show that the average lateral psychological safety distance of pedestrians is smaller than e-bikes and conventional bicycles. There is no difference between e-bikes and conventional bicycles. The average speeds of e-bikes and conventional bicycles at the farthest point are 4.74 m/s2 and 3.49 m/s2 in opposite-direction interactions (p < 0.001) and 4.40 m/s2 and 3.62 m/s2 in same-direction interactions (p < 0.001), respectively. It may indicate that speed is not critical in lateral psychological safety distance. A similar result is obtained by [41], when drivers overtake cyclists, the drivers appear to be unaware that faster speeds necessitate greater clearances in order to maintain comfort. Although the power system and speed of e-bikes and conventional bicycles are different, the body structures are similar. The structure leads to a lower controllability, stability, and flexibility of bicycles than pedestrians. The psychological safety of road users is influenced by these factors, which determine different lateral psychological safety distances. In addition, gender also had no effect on lateral psychological safety distance.
6.4. Road Users Carrying Large Items Perceive Higher Risk in Shared Spaces
The lateral psychological safety distance and safety zone of road users carrying large items is larger than other road users in opposite-direction interactions. This may indicate a higher perceived risk of road users carrying large items compared to other road users in shared spaces. The findings can also be supported by [46], where a series of reasons are identified that contribute to e-bike-related deaths, including carrying goods or children while riding. Similarly, Wang et al. [47] found that carrying a passenger may increase difficulty maneuvering, causing e-bikes to lose control more easily. Zhang et al. [3] also suggested that road users carrying passengers are 1.9 times and 1.6 times more likely to report crashes than those riders who do not carry passengers.
6.5. Maneuvering Time Is a Crucial Psychological Defense Factor of Road Users
The maneuvering distances in the swerve-away phase were counted according to road user types in this study, respectively, and the speeds of conventional bicycles, e-bikes, and pedestrians are different. The data indicate that maneuvering distance in the swerve-away phase increases as the speed increases. It is worth noting that the time used in the swerve-away phase is similar, although road user types, speed, and swerve-away phase longitudinal distances are completely different. The average time of conventional bicycles, e-bikes, and pedestrians are 2.10 s, 2.03 s, and 2.20 s in opposite-direction interactions (p = 0.413). The average times of conventional bicycles and e-bikes are 2.60 s and 2.52 s in same-direction interactions (p = 0.678). Road users evaluate their situation and traffic environment, then plan their swerve trajectories at the beginning of interactions, and the decision criteria may be the maneuvering time. This mental process also can be seen in car drivers. Overtaking safety is contingent on proper planning and correct anticipation of potentially critical situations [41]. So, maneuvering time can be an important psychological defense factor for road users in non-motorized shared spaces compared with other factors (i.e., distance, speed, or other factors).
While this study provides a foundational framework for identifying psychological trajectory points through kinematic markers, future research should develop more precise numerical formalization methods. Advanced statistical modeling or machine learning approaches could enhance the objectivity and reproducibility of psychological point identification, moving beyond the current qualitative–quantitative hybrid approach.
7. Conclusions
This study investigated the microscopic behavior and psychological characteristics of vulnerable road user interactions in non-motorized shared spaces. We analyzed a total of 334 opposite- and same-direction interactions along 16 h of footage from four different locations. The definition and identification method of trajectory key points, including the interaction start point, psychological starting point, farthest point, psychological ending point, and the interaction end point, were proposed considering both microscopic behaviors and psychological characteristics to better describe the interaction process. The change in the lateral direction (types 1 and 2) is the main characteristic of the starting and ending points for both interaction types. This can be attributed to the moving state and power system of bicycles. Moreover, the psychology start points usually occur at the midpoint of the swerve-away phase. The psychology start points appear more forward in the swerve-back phase, it indicates that road users perceive more security in this phase. More specifically, the sense of security is stronger in opposite-direction interactions’ swerve-back phase than in same-direction interactions.
The lateral and longitudinal maneuvering distance in all interaction phases and decision distances were calculated and compared by different factors, such as severity levels, road user types, genders, and whether road users carry large items or not. It may be worth noting that the average lateral psychological safety distance is about 1.125 m, which can serve as a minimum design standard for shared space widths. The lateral psychological safety is not affected by speed or gender but is determined by road users’ controllability, stability, and flexibility. The speed before and during opposite and same-direction interactions was calculated. In most cases, the speeds of e-bikes and conventional bicycles decrease during the interaction. Only the speed of conventional bicycles increases during the same-direction interaction to overtake pedestrians. The average area of the safety zone for road users who swerve in opposite-direction interactions is 4.83 m2 and in the same-direction interactions is 9.36 m2. A larger safety zone and longer lateral psychological safety distance are needed by road users carrying large items, and they may be at higher risk in shared spaces. The findings conclude that maneuvering time is an important psychological defense of road users in non-motorized shared spaces. This indicates that designers should prioritize wider spaces in areas where overtaking is expected, such as near transit stops or high-activity zones.
In this study, VRU interactions along a linear path were considered. Future work can consider different spatial configurations of shared spaces, other types of VRU interactions, or different modalities (e.g., motorized vehicles). Moreover, the parameters identified in this study can be used to model VRU interactions and provide relevant guidance for implementing non-motorized shared space facilities. More importantly, the exploration of psychological factors can be beneficial in creating a comfortable traffic environment for VRUs under the people-oriented traffic concept. Second, analyzing the interaction behavior between motorized and vulnerable road users can be considered in future work. Third, utilizing a fully automated approach for extracting road user trajectories can be considered in future work instead of the semi-automated approach utilized in this study. Fourth, considering vulnerable and user interactions in other geographical regions (e.g., North America) can be considered in future work. As well, future studies can consider inter-rater reliability assessments (e.g., Cohen’s kappa).
Author Contributions
Conceptualization, X.L., R.A., T.S. and G.M.; methodology, X.L., R.A., T.S. and G.M.; software, X.L., R.A., T.S. and G.M.; validation, X.L., R.A., T.S. and G.M.; formal analysis, X.L., R.A., T.S., G.M. and A.H.; investigation, X.L., R.A., T.S. and G.M.; resources, X.L., R.A., T.S., G.M. and A.H.; data curation, X.L.; writing—original draft preparation, X.L. and R.A.; writing—review and editing, X.L., R.A., T.S., G.M. and A.H.; visualization, X.L., R.A., T.S., G.M. and A.H.; supervision, X.L., R.A., T.S., G.M. and A.H.; project administration, X.L., R.A., T.S., G.M. and A.H.; funding acquisition, X.L., R.A., T.S. and G.M. All authors have read and agreed to the published version of the manuscript.
Funding
This research was financially supported by the National Natural Science Foundation of Hebei Province (Grant No. E2023202264). Open Project of Key Laboratory of Road and Traffic Engineering, Ministry of Education (Grant No. K202304) and funded by the Science Research Project of Hebei Education Department (Grant No. BJK2024078). The authors would like to thank the funded project for providing material for this research.
Institutional Review Board Statement
Not applicable.
Informed Consent Statement
Not applicable.
Data Availability Statement
The data are partially available upon request from the author.
Conflicts of Interest
The authors declare no conflicts of interest.
References
- Wegman, F.; Zhang, F.; Dijkstra, A. How to make more cycling good for road safety? Accid. Anal. Prev. 2012, 44, 19–29. [Google Scholar] [CrossRef]
- Ma, C.; Yang, D.; Zhou, J.; Feng, Z.; Yuan, Q. Risk riding behaviors of urban e-bikes: A literature review. Int. J. Environ. Res. Public Health 2019, 16, 2308. [Google Scholar] [CrossRef] [PubMed]
- Zhang, X.; Yang, Y.; Yang, J.; Hu, J.; Li, Y.; Wu, M.; Stallones, L.; Xiang, H. Road traffic injuries among riders of electric bike/electric moped in southern China. Traffic Inj. Prev. 2018, 19, 417–422. [Google Scholar] [CrossRef]
- World Health Organization; Department of Violence, Injury Prevention, World Health Organization; Violence, Injury Prevention,; World Health Organization. Global Status Report on Road Safety: Time for Action; World Health Organization: Geneva, Switzerland, 2009. [Google Scholar]
- UK Department for Transport. Local Transport Note 1/11---Shared Space; UK Department for Transport: London, UK, 2011. [Google Scholar]
- Alsaleh, R.; Hussein, M.; Sayed, T. Microscopic behavioural analysis of cyclist and pedestrian interactions in shared spaces. Can. J. Civ. Eng. 2020, 47, 50–62. [Google Scholar] [CrossRef]
- Kaparias, I.; Bell, M.G.; Dong, W.; Sastrawinata, A.; Singh, A.; Wang, X.; Mount, B. Analysis of pedestrian–vehicle traffic conflicts in street designs with elements of shared space. Transp. Res. Rec. 2013, 2393, 21–30. [Google Scholar] [CrossRef]
- Khan, S.I.; Raksuntorn, W. Characteristics of passing and meeting maneuvers on exclusive bicycle paths. Transp. Res. Rec. 2001, 1776, 220–228. [Google Scholar] [CrossRef]
- Mohammed, H.; Bigazzi, A.Y.; Sayed, T. Characterization of bicycle following and overtaking maneuvers on cycling paths. Transp. Res. Part C Emerg. Technol. 2019, 98, 139–151. [Google Scholar] [CrossRef]
- Kaparias, I.; Li, P. Behaviour and perceptions of powered two-wheeler users in street designs with elements of shared space. Transp. Res. Part F Traffic Psychol. Behav. 2021, 80, 368–380. [Google Scholar] [CrossRef]
- Beitel, D.; Stipancic, J.; Manaugh, K.; Miranda-Moreno, L. Assessing safety of shared space using cyclist-pedestrian interactions and automated video conflict analysis. Transp. Res. Part D Transp. Environ. 2018, 65, 710–724. [Google Scholar] [CrossRef]
- Alsaleh, R.; Sayed, T. Markov-game modeling of cyclist-pedestrian interactions in shared spaces: A multi-agent adversarial inverse reinforcement learning approach. Transp. Res. Part C Emerg. Technol. 2021, 128, 103191. [Google Scholar] [CrossRef]
- Lee, O.; Rasch, A.; Schwab, A.L.; Dozza, M. Modelling cyclists’ comfort zones from obstacle avoidance manoeuvres. Accid. Anal. Prev. 2020, 144, 105609. [Google Scholar] [CrossRef]
- Hussein, M.; Sayed, T. Microscopic pedestrian interaction behavior analysis using gait parameters. Transp. Res. Rec. 2015, 2519, 28–38. [Google Scholar] [CrossRef]
- Hussein, M.; Sayed, T. A bi-directional agent-based pedestrian microscopic model. Transp. A Transp. Sci. 2017, 13, 326–355. [Google Scholar] [CrossRef]
- Hediyeh, H.; Sayed, T.; Zaki, M.H.; Mori, G. Pedestrian gait analysis using automated computer vision techniques. Transp. A Transp. Sci. 2014, 10, 214–232. [Google Scholar] [CrossRef]
- Wang, C.; Xu, C.; Xia, J.; Qian, Z. The effects of safety knowledge and psychological factors on self-reported risky driving behaviors including group violations for e-bike riders in China. Transp. Res. Part F Traffic Psychol. Behav. 2018, 56, 344–353. [Google Scholar] [CrossRef]
- Yao, L.; Wu, C. Traffic safety for electric bike riders in China: Attitudes, risk perception, and aberrant riding behaviors. Transp. Res. Rec. 2012, 2314, 49–56. [Google Scholar] [CrossRef]
- Lehtonen, E.; Havia, V.; Kovanen, A.; Leminen, M.; Saure, E. Evaluating bicyclists’ risk perception using video clips: Comparison of frequent and infrequent city cyclists. Transp. Res. Part F Traffic Psychol. Behav. 2016, 41, 195–203. [Google Scholar] [CrossRef]
- Zheng, C.; Liu, Y.; Ma, G.; Deng, P.; Zhang, J. Research on relationship between risk perception and cycling crashes in electric cyclists. Adv. Mech. 2019, 11, 1687814019851639. [Google Scholar] [CrossRef]
- Che, M.; Wong, Y.D.; Lum, K.M.; Wang, X. Interaction behaviour of active mobility users in shared space. Transp. Res. Part A Policy Pract. 2021, 153, 52–65. [Google Scholar] [CrossRef]
- Gkekas, F.; Bigazzi, A.Y.; Gill, G.; Gingras, P. Perceived safety and experienced incidents between pedestrians and cyclists in a high-volume non-motorized shared space. Transp. Res. Interdiscip. Perspect. 2020, 4, 100094. [Google Scholar] [CrossRef]
- Kraay, J.H.; van der Horst, A.R.A.; Oppe, S. Manual Conflict Observation Technique DOCTOR Dutch Objective Conflict Technique for Operation and Research (Report 2013-1); van der Horst, A.R.A., Translator; Foundation Road Safety for All: Voorburg, The Netherlands, Originally published in 1986 by Stichting Wetenschappelijk Onderzoek Verkeersveiligheid SWOV and Instituut voor Zintuigfysiologie TNO; SWOV rapport R-86-3; Leidschendam, Stichting Wetenschappelijk Onderzoek Verkeersveiligheid SWOV Rapport IZF 1986 C-6; Soesterberg, Instituut voor Zintuigfysiologie TNO; 2013.
- Amundsen, F.H.E.; Hydén, C.H. Proceedings of the First Workshop on Traffic Conflicts; Institute of Transport Economics: Oslo, Norway; Lund Institute of Technology: Lund, Norway, 1977. [Google Scholar]
- Liang, X.; Meng, X.; Zheng, L. Investigating conflict behaviours and characteristics in shared space for pedestrians, conventional bicycles and e-bikes. Accid. Anal. Prev. 2021, 158, 106167. [Google Scholar] [CrossRef]
- Huertas-Leyva, P.; Dozza, M.; Baldanzini, N. Investigating cycling kinematics and braking maneuvers in the real world: E-bikes make cyclists move faster, brake harder, and experience new conflicts. Transp. Res. Part F Traffic Psychol. Behav. 2018, 54, 211–222. [Google Scholar] [CrossRef]
- Schleinitz, K.; Petzoldt, T.; Franke-Bartholdt, L.; Krems, J.; Gehlert, T. The German Naturalistic Cycling Study--Comparing cycling speed of riders of different e-bikes and conventional bicycles. Saf. Sci. 2017, 92, 290–297. [Google Scholar] [CrossRef]
- T-Analyst. Semi-Automated Video Processing. 2019. Available online: https://bitbucket.org/TrafficAndRoads/tanalyst/wiki/Manual (accessed on 20 October 2025).
- Tsai, R. A versatile camera calibration technique for high-accuracy 3D machine vision metrology using off-the-shelf TV cameras lenses. IEEE J. Robot. Autom. 1987, 3, 323–344. [Google Scholar] [CrossRef]
- Gavriilidou, A.; Daamen, W.; Yuan, Y.; Hoogendoorn, S.P. Modelling cyclist queue formation using a two-layer framework for operational cycling behaviour. Transp. Res. Part C Emerg. Technol. 2019, 105, 468–484. [Google Scholar] [CrossRef]
- Ma, X.; Luo, D. Modeling cyclist acceleration process for bicycle traffic simulation using naturalistic data. Transp. Res. Part F Traffic Psychol. Behav. 2016, 40, 130–144. [Google Scholar] [CrossRef]
- Petzoldt, T.; Schleinitz, K.; Heilmann, S.; Gehlert, T. Traffic conflicts and their contextual factors when riding conventional vs. electric bicycles. Transp. Res. Part F Traffic Psychol. Behav. 2017, 46, 477–490. [Google Scholar] [CrossRef]
- Wang, W.L.; Lo, S.M.; Liu, S.B.; Kuang, H. Microscopic modeling of pedestrian movement behavior: Interacting with visual attractors in the environment. Transp. Res. Part C Emerg. Technol. 2014, 44, 21–33. [Google Scholar] [CrossRef]
- Teknomo, K. Application of microscopic pedestrian simulation model. Transp. Res. Part F Traffic Psychol. Behav. 2006, 9, 15–27. [Google Scholar] [CrossRef]
- Alsaleh, R.; Sayed, T.; Zaki, M.H. Microscopic behavioural analysis of cyclists-pedestrian conflicts in shared spaces using explainable AI. Accid. Anal. Prev. 2019, 132, 105282. [Google Scholar]
- Dias, C.; Iryo-Asano, M.; Nishiuchi, H.; Todoroki, T. Calibrating a social force based model for simulating personal mobility vehicles and pedestrian mixed traffic. Simul. Model. Pract. Theory 2018, 87, 395–411. [Google Scholar] [CrossRef]
- Anvari, B.; Bell, M.G.; Sivakumar, A.; Ochieng, W.Y. Modelling shared space users via rule-based social force model. Transp. Res. Part C Emerg. Technol. 2015, 51, 83–103. [Google Scholar] [CrossRef]
- Luo, Y.; Jia, B.; Liu, J.; Lam, W.H.K.; Li, X.; Gao, Z. Modeling the interactions between car and bicycle in heterogeneous traffic. J. Adv. Transp. 2015, 49, 29–47. [Google Scholar] [CrossRef]
- Gorrini, A.; Crociani, L.; Vizzari, G.; Bandini, S. Observation results on pedestrian-vehicle interactions at non-signalized intersections towards simulation. Transp. Res. Part F Traffic Psychol. Behav. 2018, 59, 269–285. [Google Scholar] [CrossRef]
- Feng, F.; Bao, S.; Hampshire, R.C.; Delp, M. Drivers overtaking bicyclists—An examination using naturalistic driving data. Accid. Anal. Prev. 2018, 115, 98–109. [Google Scholar] [CrossRef] [PubMed]
- Dozza, M.; Schindler, R.; Bianchi-Piccinini, G.; Karlsson, J. How do drivers overtake cyclists? Accid. Anal. Prev. 2016, 88, 29–36. [Google Scholar] [CrossRef] [PubMed]
- Rasch, A.; Panero, G.; Boda, C.N.; Dozza, M. How do drivers overtake pedestrians? Evidence from field test and naturalistic driving data. Accid. Anal. Prev. 2020, 139, 105494. [Google Scholar] [CrossRef] [PubMed]
- Alsaleh, R.; Walia, K.; Moshiri, G.; Alsaleh, Y.T. Traffic Collision Severity Modeling Using Multi-Level Multinomial Logistic Regression Model. Appl. Sci. 2025, 15, 838. [Google Scholar] [CrossRef]
- Lignoski, B. Bicycle Stability, Is the Steering Angle Proportional to the Lean? Physics Department, The College of Wooster: Wooster, OH, USA, 2002; p. 4691. [Google Scholar]
- Rubie, E.; Haworth, N.; Twisk, D.; Yamamoto, N. Influences on lateral passing distance when motor vehicles overtake bicycles: A systematic literature review. Transp. Rev. 2020, 40, 754–773. [Google Scholar] [CrossRef]
- Feng, Z.; Raghuwanshi, R.P.; Xu, Z.; Huang, D.; Zhang, C.; Jin, T. Electric-bicycle-related injury: A rising traffic injury burden in China. Inj. Prev. 2010, 16, 417–419. [Google Scholar] [CrossRef] [PubMed]
- Wang, C.; Xu, C.; Xia, J.; Qian, Z. Modeling faults among e-bike-related fatal crashes in China. Traffic Inj. Prev. 2017, 18, 175–181. [Google Scholar] [CrossRef] [PubMed]


Disclaimer/Publisher’s Note: The statements, opinions and data contained in all publications are solely those of the individual author(s) and contributor(s) and not of MDPI and/or the editor(s). MDPI and/or the editor(s) disclaim responsibility for any injury to people or property resulting from any ideas, methods, instructions or products referred to in the content. |
© 2025 by the authors. Licensee MDPI, Basel, Switzerland. This article is an open access article distributed under the terms and conditions of the Creative Commons Attribution (CC BY) license (https://creativecommons.org/licenses/by/4.0/).