Abstract
Underground hydrogen storage in aquifers is a promising solution to address the imbalance between energy supply and demand, yet its practical implementation requires optimized strategies to ensure high efficiency and economic viability. To improve the storage and production efficiency of hydrogen, it is essential to select the appropriate cushion gas and to study the influence of reservoir and process parameters. Based on the conceptual model of aquifer with single-well injection and production, three potential cushion gas (carbon dioxide, nitrogen and methane) were studied, and the changes in hydrogen recovery for each cushion gas were compared. The effects of temperature, initial pressure, porosity, horizontal permeability, vertical to horizontal permeability ratio, permeability gradient, hydrogen injection rate and hydrogen production rate on the purity of recovered hydrogen were investigated. Additionally, the impact of different well pattern on the purity of recovered hydrogen was studied. The results indicate that methane is the most effective cushion gas for improving hydrogen recovery in UHS. Different well patterns have significant impacts on the purity of recovered hydrogen. The mole fractions of methane in the produced gas for the single-well, line-drive pattern and five-spot pattern were 16.8%, 5%, and 3.05%, respectively. Considering the economic constraints, the five-spot well pattern is most suitable for hydrogen storage in aquifers. Reverse rhythm reservoirs with smaller permeability differences should be chosen to achieve relatively high hydrogen recovery and purity of recovered hydrogen. An increase in hydrogen production rate leads to a significant decrease in the purity of the recovered hydrogen. In contrast, hydrogen injection rate has only a minor effect. These findings provide actionable guidance for the selection of cushion gas, site selection, and operational design of aquifer-based hydrogen storage systems, contributing to the large-scale seasonal storage of hydrogen and the balance of energy supply and demand.
1. Introduction
Hydrogen, as a clean secondary energy carrier, is of great significance for achieving carbon neutrality [1,2]. Underground hydrogen storage (UHS), which integrates water electrolysis with underground storage, has emerged as a key strategy to balance the energy gap [3]. Currently, the main geological structures considered for hydrogen storage include salt caverns, depleted oil and gas reservoirs, and aquifers [4]. Compared with the limited distribution of salt caverns and the complex microbial activity of depleted reservoirs, aquifers stand out as an ideal space for long-term hydrogen storage due to their wide distribution, abundant capacity, and favorable sealing properties [5,6]. Assuming a well-sealed storage space, the feasibility of the project largely depends on the hydrogen recovery and the purity of the recovered hydrogen. Both indicators are closely linked to pressure maintenance and mixing processes in porous media [7], which in turn are determined by the choice of cushion gas as well as reservoir and operational parameters [8]. Against this backdrop, a focused, comparative assessment that links cushion gas selection, hydrodynamic controls, and economics is needed.
UHS requires periodic storage and production of hydrogen. Therefore, to maintain reservoir pressure and to inhibit the flow of formation water, it is necessary to inject a certain amount of cushion gas, such as carbon dioxide (CO2), nitrogen (N2), or methane (CH4), before injecting hydrogen [9]. The use of CO2 as a cushion gas not only facilitates carbon sequestration but also enhances hydrogen storage capacity due to its high compressibility, making it a choice with both economic and environmental benefits [10]. CO2 is particularly effective in sustaining reservoir pressure and reducing hydrogen diffusion losses, while also limiting direct contact between hydrogen and formation water, thereby improving storage efficiency [11]. However, mixing between CO2 and hydrogen may lower hydrogen purity and adversely affect recovery efficiency [12]. In addition, the high solubility of CO2 can impact hydrogen recovery, and thermal diffusion effects may result in uneven hydrogen concentration distributions, compromising storage stability [13]. N2, with its low solubility in formation water and low interfacial tension, is advantageous for reducing hydrogen loss, maintaining reservoir pressure, and enhancing hydrogen recovery [14,15]. Nevertheless, molecular diffusion and mechanical dispersion promote mixing between N2 and hydrogen, which may reduce the purity of the recovered hydrogen and increase separation costs [16]. CH4, owing to its relatively low molecular weight, can achieve higher hydrogen recovery when used as a cushion gas [17]. However, simulation studies on depleted gas condensate reservoirs have shown that N2 injection results in the highest hydrogen recovery and purity [18]. In summary, existing studies have demonstrated that different cushion gases exhibit distinct effects on pressure maintenance, hydrogen recovery, and gas mixing behavior, highlighting the crucial role of cushion gas selection in UHS. However, existing studies often address these aspects in isolation: many compare cushion gases without embedding the analysis into a wider parameter-sensitivity space tailored to aquifers.
Beyond cushion gas selection, the performance of aquifer-based UHS is also strongly influenced by reservoir characteristics and operational parameters, which play a critical role in guiding both site selection and process design [19]. Many studies have shown that key geological parameters such as permeability, porosity, temperature, pressure, and heterogeneity significantly impact hydrogen injectivity and storage efficiency [20,21]. Permeability is consistently identified as one of the most influential parameters in sensitivity analyses, directly affecting hydrogen migration and production performance. Porosity, although less sensitive than permeability, modulates available pore volume and hydrogen mixing behavior [22]. Geological heterogeneity, especially in saline aquifers, can lead to asymmetric gas propagation and pressure buildup, thereby affecting storage efficiency [23]. Moreover, temperature and pressure affect hydrogen storage performance, so the operating parameters must be matched accordingly [24]. In aquifer-based hydrogen storage, microbial activity is inevitable; however, the extent of its impact remains uncertain. Microorganisms may induce pore clogging, but they can also promote lateral migration of hydrogen within the reservoir, leading to a more uniform distribution of hydrogen stored in the aquifers [25]. From an operational perspective, parameters such as injection rate, well patterns, and pressure control strategies significantly influence gas mixing and hydrogen recovery [23]. Hagemann et al. [26] employed numerical simulation to demonstrate that the hydrogen injection rate is a critical operational parameter; high injection rates can lead to unstable viscous fingering. Pan et al. [27] used the CMG-IMEX simulator to model UHS. Their study showed that increasing the production rate can improve hydrogen recovery, but it also aggravates water production issues. They further emphasized that there are fundamental differences between UHS and CO2 storage, and thus, experience from CO2 storage cannot be directly applied. Lu et al. [28] employed the MATLAB Reservoir Simulation Toolbox to simulate hydrogen storage in depleted oil and gas reservoirs. Their research investigated how different injection and production strategies affect hydrogen recovery efficiency and the purity of the produced hydrogen. At present, there is no unified model that clearly defines the trade-off between injection and production rates and the purity of recovered hydrogen, especially under complex geological conditions in aquifers. In addition, most existing studies focus on the injection of hydrogen and cushion gas using single-well scenarios, lacking quantitative investigations on how well pattern configurations affect the overall efficiency of UHS.
Currently, UHS technology has gradually transitioned from the initial exploration stage to the construction and implementation stage, with a complete UHS technology system progressively taking shape. When designing and operating hydrogen storage in aquifers, it is crucial to understand the effects of cushion gas and various factors on hydrogen recovery and the purity of recovered hydrogen. Overall, although current studies provide valuable insight into isolated sensitivity results, systematic frameworks that integrate geological and operational parameters to guide site screening and UHS process design are still lacking. This highlights the need for more comprehensive and coupled simulation studies to optimize UHS strategies in aquifers.
To address the above challenges and provide quantitative guidance for aquifer-based hydrogen storage design, this study systematically explores how cushion gas type, reservoir properties, and operational parameters affect storage performance. A series of numerical simulations were carried out using the CMG-GEM compositional simulator, which is well suited for modeling gas behavior in porous media due to its ability to handle variable viscosity and density, as well as capabilities for fully implicit calculations like physical dispersion. We first established a single-well injection-production model to evaluate the performance of three representative cushion gases (CO2, N2, and CH4). We then conducted a sensitivity analysis of key geological and operational parameters, including temperature, initial pressure, porosity, horizontal permeability, vertical to horizontal permeability ratio, permeability gradient, hydrogen injection rate, and production rate, to investigate their influence on the purity of recovered hydrogen. To further enhance recovery purity and reduce downstream processing costs, well pattern optimization was carried out under economic constraints. The proposed simulation framework and findings provide new insights into parameter optimization for aquifer-based UHS, and offer valuable theoretical guidance for future site selection and process design.
2. Methodology
Aquifers are widely distributed globally and are typically found at relatively shallow depths, making them a suitable choice for UHS [29,30]. Research on aquifer-based UHS is still in its early stages. According to standard surveys of aquifer-type hydrogen storage reservoirs, aquifers considered suitable typically exhibit porosities of 12–25%, permeabilities greater than 100 mD, depths not less than 305 m, and lithologies such as sandstone, limestone, and dolomite [31]. In this study, we referred to the global survey of potential UHS sites by Zivar et al. [32]. Among the aquifers identified as suitable, the San Pedro belt in Spain and the Mount Simon aquifer in Canada are representative. By integrating the parameter ranges of these two reservoirs (Table 1), a basic model was established using CMG 2021.10 (Figure 1). Specifically, we set the top depth to 800 m, which is within the shallow-moderate interval commonly considered for aquifer UHS and is consistent with hydrostatic pressure of approximately 8 MPa. The formation temperature of 50 °C follows a typical geothermal gradient of 3 °C per 100 m at this depth. The mean permeability of 100 mD with 30 mD vertically reflects moderate horizontal-vertical anisotropy typical of aquifers, balancing injectivity with vertical confinement. To better represent realistic reservoir conditions, reservoir permeability was assigned according to a log-normal distribution.

Table 1.
Aquifer conditions and rock properties.
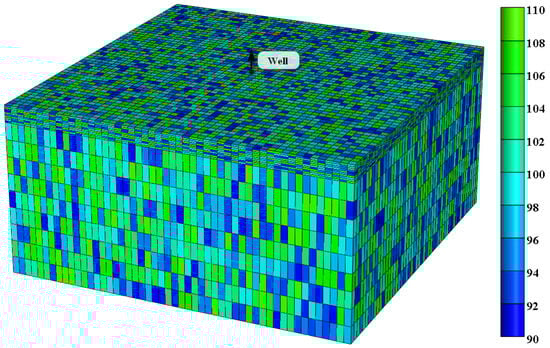
Figure 1.
Geometry of the simulation model (color represents permeability) and the location of injection/production well (black arrow).
An injection/production well was placed at the center of the model. Considering the effect of gravity segregation, the injected gas was mainly distributed near the top of the reservoir. To more accurately study the injected gas distribution, the vertical grid was refined: layers 1–10 were set with dimensions of 20 m × 20 m × 0.5 m, while layers 11–19 were set with dimensions of 20 m × 20 m × 5 m. The overall grid system consisted of 51 × 51 × 19 blocks. Coarser grids smear the gas-water front and bias hydrogen recovery/purity, whereas excessive refinement increases non-linearity and tightens time-step constraints, potentially slowing or destabilizing convergence. Grid sensitivity checks indicated that further refinement did not significantly change recovery, purity, or pressure responses; hence the chosen grid is adequate.
In addition, given that the kinetic parameters of microbial reactions remain highly site-dependent and lack field calibration, microbial processes are not considered in our model. According to Thaysen et al. [33], significant microbial hydrogen consumption only occurs under conditions of low temperature, low salinity, and the presence of nutrient replenishment. Under saline aquifer conditions with limited nutrients over seasonal storage cycles, net hydrogen losses are negligible to small. The focus of this study is on the preliminary screening of cushion gas types and favorable storage parameters.
For conventional aquifer-type reservoirs, the Brooks-Corey function was applied to characterize the capillary pressure curve, while the Corey model was used to describe the gas and water relative permeability. Model parameters were determined by referring to the studies of Yekta et al. [34] and Delshad et al. [35]. During the hydrogen storage simulations, fluid properties were calculated using the Peng-Robinson equation of state. Gas solubility in water was calculated using Henry’s law, whereas gas viscosity was calculated in GEM using the Jossi-Stiel-Thodos (JST) model with the HZYT mixing rule. The viscosity calculation procedure was as follows.
First, the viscosity of each component under low-pressure conditions was obtained using the Yoon-Thodos empirical correlation, as shown in Equation (1).
where μlow,i is the low-pressure viscosity of component i, cP; Tr is the reduced temperature; μp is the viscosity parameter.
Second, the Herning-Zipperer mixing rule was used to calculate the low-pressure viscosity of the gas mixture, as shown in Equation (2).
where μlow,mix is the mixture viscosity under low-pressure conditions, cP; xi is the mole fraction of component i; Mi is the molecular weight of component i, g/mol.
Finally, the JST model was applied to correct the low-pressure mixture viscosity to reservoir pressure conditions, as shown in Equation (3).
where μmix is the gas mixture viscosity under reservoir conditions, cP; ρr is the reduced density of the gas mixture; a0, a1, a2, a3, a4 are empirical coefficients.
Considering the injection of cushion gas, the procedure starts with injecting cushion gas into the reservoir for 6 months, followed by a shut-in period of 8 months to allow the reservoir to stabilize. After stabilization, a 5-year cycle of injection and production begins, with each cycle consisting of 6 months of hydrogen injection, 3 months of shut-in, and 3 months of hydrogen production. The minimum pressure of the hydrogen storage reservoir was set to 1.5 MPa. If cushion gas is not injected, the 5-year cycle of injection and production begins directly.
In the absence of site-specific field data for aquifer-based UHS, external validation is not yet feasible. Instead, we conducted internal numerical consistency checks suited to the present scope. The log-normal permeability field was generated with a deliberately narrow variance, so that the stochastic heterogeneity does not dominate the results. Under this constrained spread, independent random seeds produce virtually identical outputs. Consequently, a single seed was fixed for all simulations to guarantee reproducibility.
3. Results
3.1. Optimal Selection of Cushion Gas
The presence of cushion gas can enhance the operational efficiency of UHS. In this work, numerical simulations of UHS were conducted with the injection of different cushion gases (CO2, N2, CH4) as well as without cushion gas injection. By comparing the results of different cases, the impact of the type of cushion gas on aquifer-type UHS was studied. The results demonstrate that the type of cushion gas exerts a significant regulatory effect on reservoir pressure maintenance and hydrogen recovery, with CH4 exhibiting the most favorable overall performance.
Figure 2a shows the variation in average reservoir pressure over time for different cases. The injection of cushion gas into the reservoir increases the gas volume, which in turn leads to an increase in reservoir pressure. Without cushion gas, the reservoir pressure before hydrogen injection is relatively low, and the pressure increases slowly after hydrogen injection, resulting in a shorter stable production period. By injecting cushion gases, the reservoir pressure can be elevated before hydrogen injection. Injection of N2, CH4, and CO2 increased the reservoir pressure by 25%, 22%, and 11%, respectively.
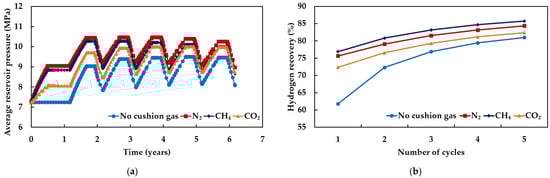
Figure 2.
Simulation results of different cushion gas injection cases: (a) Average reservoir pressure at different times; (b) Hydrogen recovery at different cycles.
Figure 2b shows the hydrogen recovery at the end of each injection–production cycle for different cases. As the number of cycles increases, hydrogen recovery improves in all scenarios. The lower average reservoir pressure during the first cycle leads to generally lower recovery. Injection of cushion gas enhances recovery, with N2 and CH4 providing more significant improvements, while CO2 results in comparatively lower recovery, likely due to its higher solubility in brine. Although N2 injection results in the greatest increase in reservoir pressure, CH4 as a cushion gas achieves the highest improvement in hydrogen recovery, with a 5.81% increase over five injection-production cycles. Based on these results, CH4 is selected as the cushion gas for subsequent UHS simulations.
3.2. Factors Affecting the Purity of Recovered Hydrogen in a Single Well
The purity of recovered hydrogen in UHS is typically defined as the proportion of hydrogen in the gas recovered from the reservoir. By studying the impact of reservoir conditions, and injection-production strategies on the purity of recovered hydrogen, UHS technology can be optimized to improve overall storage efficiency [36]. In this work, CH4 is selected as the cushion gas. The influencing factors chosen include temperature, initial pressure, porosity, horizontal permeability, Kv/Kh (vertical to horizontal permeability ratio), permeability gradient, hydrogen injection rate, and hydrogen production rate. The purity of recovered hydrogen is selected as the evaluation index. The study investigates the variation patterns of recovered hydrogen purity under the influence of different factors. Based on the established model, adjust different parameters to simulate one cycle of hydrogen injection and production. Table 2 presents the initial parameter values and ranges of variation for the simulation cases. The permeability gradient refers to the difference in horizontal permeability between each layer and the preceding layer. If the permeability gradient is 0, the horizontal permeability is equal across all layers. If the permeability gradient is −33, it indicates a reverse rhythm reservoir where the horizontal permeability of each layer differs by 33 mD.
Table 2.
Initial parameter values and ranges of variation for simulation cases.
- Temperature
Figure 3 shows the mole fraction of CH4 in the produced gas at different temperatures. The mole fraction of CH4 in the produced gas decreases as the temperature increases. The higher the temperature, the lower the mole fraction of CH4 in the produced gas, resulting in higher purity of the recovered hydrogen. When the temperature increases from 45 °C to 65 °C, the purity of the recovered hydrogen increases by 1.25%. As the temperature increases, the viscosity of hydrogen and CH4 decreases, enhancing the flowability of the gases. The gravity segregation effect strengthens, making hydrogen more likely to flow to the top layer.
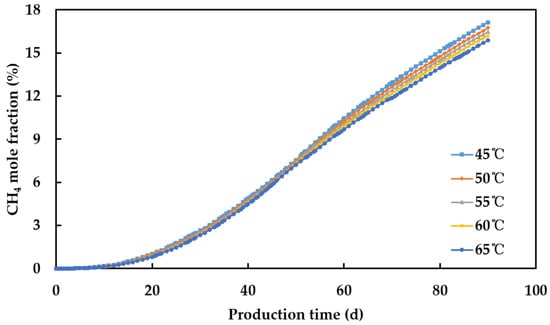
Figure 3.
Mole fraction of CH4 in the produced gas at different temperatures.
- Initial pressure
Higher initial pressure can increase the pressure difference, causing gases to flow to the top layer more quickly, resulting in increased hydrogen recovery. Figure 4 shows the mole fraction of CH4 in the produced gas at different initial pressures. The mole fraction of CH4 in the produced gas increases with higher initial reservoir pressure, resulting in lower purity of recovered hydrogen. Increasing the initial pressure may cause more mixing between CH4 and hydrogen, leading to reduced purity of recovered hydrogen. When the initial pressure increases from 6 MPa to 14 MPa, the purity of recovered hydrogen decreases by 6.18%, indicating that the initial pressure has a significant impact on the purity of recovered hydrogen.
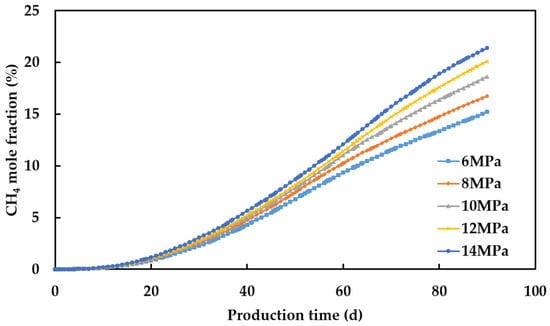
Figure 4.
Mole fraction of CH4 in the produced gas at different initial pressures.
- Porosity
Figure 5 shows the mole fraction of CH4 in the produced gas at different porosities. The mole fraction of CH4 in the produced gas increases with higher porosity. Higher porosity typically enhances the diffusion effect of gases within the reservoir. CH4 may more easily diffuse into the areas where hydrogen is present, increasing the CH4 content in the produced gas. When porosity increases from 17% to 29%, the purity of recovered hydrogen decreases by 1.49%.
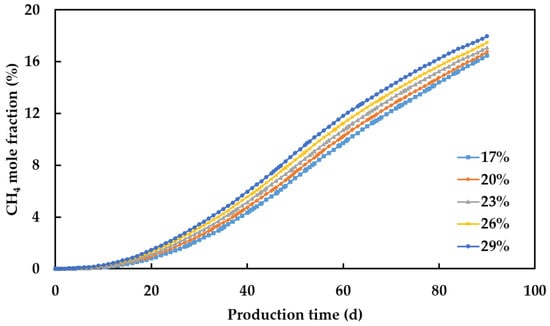
Figure 5.
Mole fraction of CH4 in the produced gas at different porosities.
- Horizontal permeability
Figure 6 shows the water saturation profiles at different horizontal permeabilities. As horizontal permeability increases, the injected gas more easily flows to the top layer. Figure 7 shows the mole fraction of CH4 in the produced gas at different permeabilities. From 0 to 70 days of production, the mole fraction of CH4 in the produced gas decreases with increasing permeability. In the later stage of production (70–90 days), the curve changes abruptly for the 500 mD permeability case because the cushion gas has mostly flowed to the top of the reservoir (Figure 8). When the production time is 70 days, increasing the horizontal permeability from 100 mD to 500 mD increases the purity of recovered hydrogen by 1.68%.
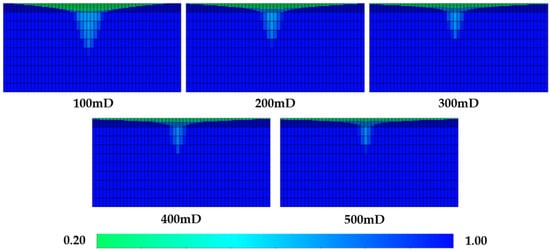
Figure 6.
Water saturation profiles at different horizontal permeabilities.
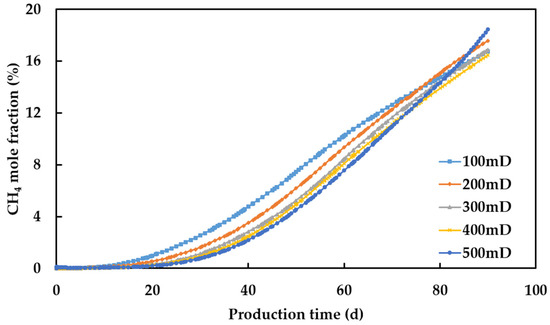
Figure 7.
Mole fraction of CH4 in the produced gas at different horizontal permeabilities.
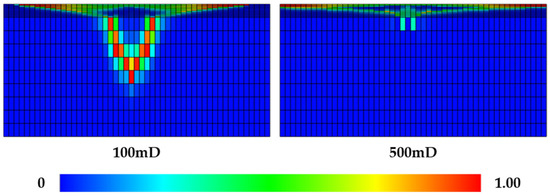
Figure 8.
Mole fraction profiles of CH4 in the reservoir at 80 days of production.
- Vertical to horizontal permeability ratio
As the Kv/Kh increases, the injected gas more easily flows to the top layer. Figure 9 shows the mole fraction of CH4 in the produced gas at different Kv/Kh. The larger the Kv/Kh, the smaller the mole fraction of CH4 in the produced gas. When the Kv/Kh increases from 0.2 to 0.4, the purity of recovered hydrogen increases by 1.47%.
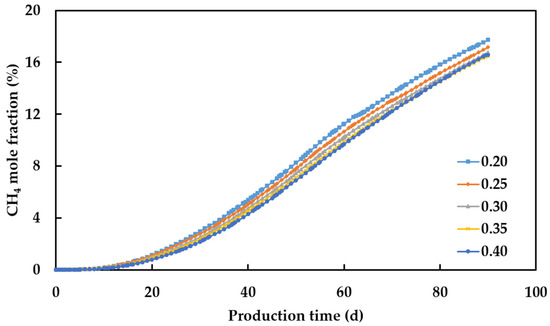
Figure 9.
Mole fraction of CH4 in the produced gas at different Kv/Kh.
- Permeability gradient
Figure 10 shows the water saturation profiles at different permeability gradients. As the permeability gradient decreases, meaning higher permeability in the upper layers (reverse rhythm), the injected gas more easily flows to the upper layers. Figure 11 shows the mole fraction of CH4 in the produced gas at different permeability gradients. The mole fraction of CH4 in the produced gas increases as the permeability gradient decreases, indicating that positive rhythm reservoirs have higher purity of recovered hydrogen compared to reverse rhythm reservoirs. This may be because the higher permeability in the upper layers of reverse rhythm reservoirs allows CH4 to more easily flow to the upper layers and mix with hydrogen, reducing the purity of recovered hydrogen.
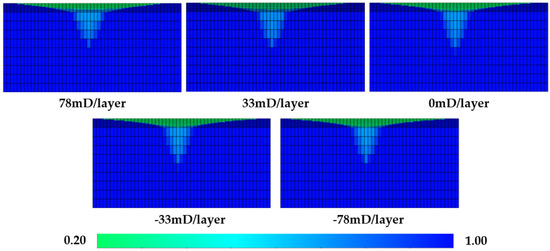
Figure 10.
Water saturation profiles at different permeability gradients.
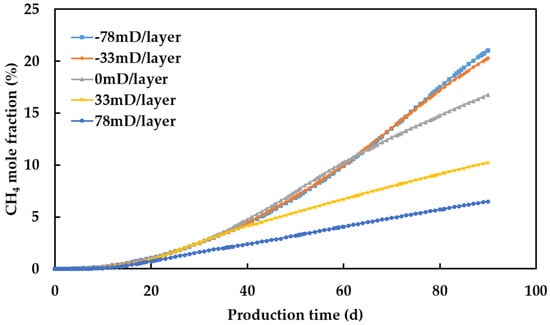
Figure 11.
Mole fraction of CH4 in the produced gas at different permeability gradients.
Figure 12 shows the hydrogen recovery at different permeability gradients. Hydrogen recovery increases as the permeability gradient decreases, indicating that reverse rhythm reservoirs have higher hydrogen recovery compared to positive rhythm reservoirs. Figure 13 shows the mole fraction profiles of hydrogen in the reservoir at the beginning and end of production for both positive and reverse rhythm reservoirs. Compared to positive rhythm reservoirs, reverse rhythm reservoirs allow hydrogen to flow more easily to the upper layers due to the higher permeability in the upper layers, making it easier to produce. As the permeability gradient decreases from 78 to −78, although the purity of recovered hydrogen decreases by 14.53%, the hydrogen recovery increases by 32.84%. Overall, reverse rhythm reservoirs are more suitable for UHS. In practice, when selecting a site for hydrogen storage, reverse rhythm reservoirs with smaller absolute values of permeability gradient should be chosen, as they can provide relatively high hydrogen recovery and purity of recovered hydrogen.
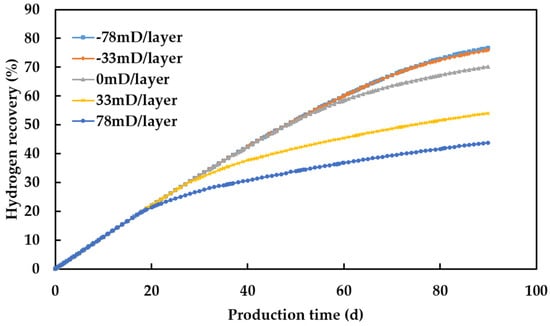
Figure 12.
Hydrogen recovery at different permeability gradients.
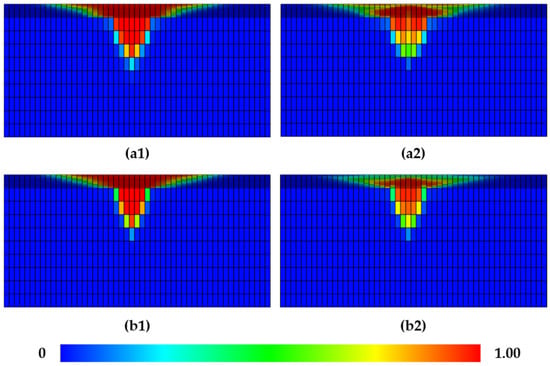
Figure 13.
Mole fraction profiles of H2 in the reservoir: (a1) positive rhythm reservoir (day 0); (a2) positive rhythm reservoir (day 90); (b1) reverse rhythm reservoir (day 0); (b2) reverse rhythm reservoir (day 90).
- Hydrogen injection rate
Figure 14 shows the mole fraction profiles of hydrogen in the reservoir at different hydrogen injection rates. With the same total amount of hydrogen injected, a lower injection rate allows hydrogen to flow and accumulate more easily at the top of the reservoir, making it easier to produce. Figure 15 shows the mole fraction of CH4 in the produced gas at different hydrogen injection rates. The mole fraction of CH4 in the produced gas increases with the increase in hydrogen injection rate. As the hydrogen injection rate increases from 3 × 10⁴ m3/d to 15 × 104 m3/d, the purity of recovered hydrogen decreases by 6.07%.
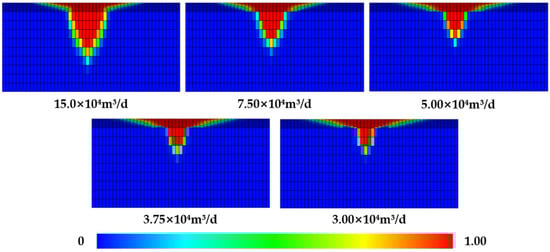
Figure 14.
Mole fraction profiles of hydrogen in the reservoir at 0 days of production.
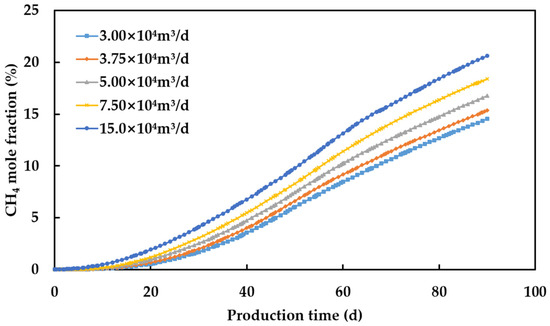
Figure 15.
Mole fraction of CH4 in the produced gas at different hydrogen injection rates.
- Hydrogen production rate
Figure 16 shows the mole fraction of CH4 in the produced gas at different hydrogen production rates. The mole fraction of CH4 in the produced gas increases with the increase in hydrogen production rate. High flow rates cause different gases to mix more easily, resulting in reduced purity of the recovered hydrogen. As the hydrogen production rate increases from 8.18 × 10⁴ m3/d to 12.86 × 10⁴ m3/d, the purity of recovered hydrogen decreases by 5.33%.
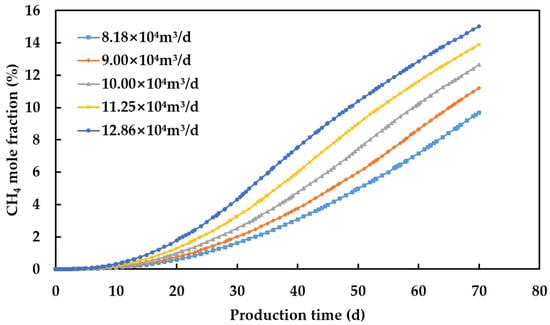
Figure 16.
Mole fraction of CH4 in the produced gas at different hydrogen production rates.
3.3. Well Pattern Optimization
3.3.1. Effect of Well Pattern on the Purity of Recovered Hydrogen
After studying cushion gas, it is evident that the injection of cushion gas has a positive effect on increasing hydrogen recovery. However, regardless of how the levels of various influencing factors are changed, the mole fraction of CH4 in the produced gas is generally high, often exceeding 15% in most cases. To explore whether other methods can improve the purity of recovered hydrogen, a study on the impact of different well patterns on hydrogen purity was conducted. In addition to the original single-well injection and production model, models for line-drive pattern and five-spot pattern were established. The hydrogen injection and production well locations remained unchanged. For the line-drive pattern, there are two cushion gas injection wells located at grid positions (12, 25) and (40, 25). For the five-spot pattern, there are four cushion gas injection wells located at grid positions (12, 12), (40, 40), (12, 40), and (40, 12). Other reservoir and process parameters of the models remain consistent with the basic model.
Figure 17 shows the planar mole fraction distribution of CH4 at day 0 of production for different well patterns. Figure 18 shows the planar mole fraction distribution of CH4 at day 90 of production for different well patterns. Figure 19 shows the mole fraction of CH4 in the produced gas for different well patterns. The simulation results of hydrogen storage under different well patterns indicate that the five-spot pattern achieves the highest purity of recovered hydrogen, with a CH4 mole fraction in the produced gas of only 3.05%, significantly improving the purity of recovered hydrogen compared to the single-well injection and production model.
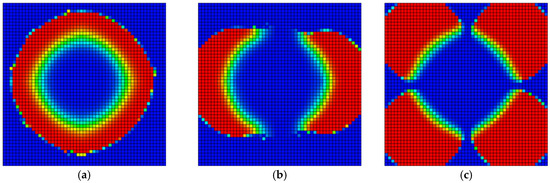
Figure 17.
Planar mole fraction of CH4 at day 0 of production under different well patterns: (a) Single-well; (b) Line-drive pattern; (c) Five-spot pattern. Color intensity indicates mole fraction, ranging from blue (0) to red (1).
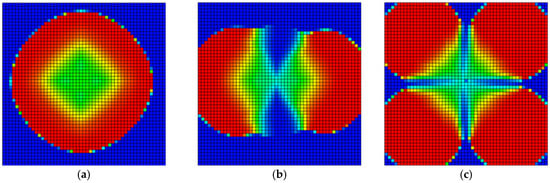
Figure 18.
Planar mole fraction of CH4 at day 90 of production under different well patterns: (a) Single-well; (b) Line-drive pattern; (c) Five-spot pattern. Color intensity indicates mole fraction, ranging from blue (0) to red (1).
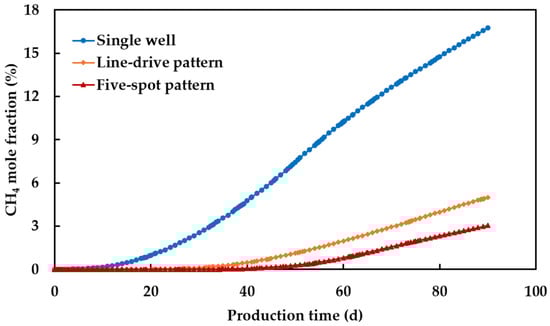
Figure 19.
Mole fraction of CH4 in the produced gas at different well patterns.
3.3.2. Economic Evaluation
Although the five-spot well pattern can achieve higher hydrogen purity upon recovery, its economic feasibility must also be considered. The primary cost differences among different well patterns lie in the number and type of wells. Under the temperature and pressure conditions of UHS, conventional steel wells face a risk of hydrogen embrittlement during long-term contact with hydrogen, and therefore hydrogen injection/production wells require hydrogen-resistant materials. As a result, the drilling and completion costs of hydrogen wells are higher than those of conventional natural gas wells. On the other hand, post-treatment costs are of greater concern. The recovered gas mixture from the storage reservoir contains both cushion gas and hydrogen, and hydrogen must be separated before use. Generally, as the hydrogen purity of the mixture decreases, the purification cost increases sharply [37].
Based on survey results, the correlation between purification cost and hydrogen purity was established, as shown in Equation (4).
where Cpurify is the hydrogen purification cost, $/kg; x is the purity of recovered hydrogen; a, b, c are fitting parameters (388.7, 5.646, and −1.404, respectively).
The levelized cost of hydrogen storage (LCHS) is calculated, as shown in Equation (5).
The capital recovery factor (CRF) is given, as shown in Equation (6).
where NH2 is the number of hydrogen production wells; CH2 is the cost of a hydrogen production well, $; NCH4 is the number of cushion gas injection wells; CCH4 is the cost of a cushion gas injection well, $; QH2 is the annual hydrogen production volume, kg; r is the discount rate; t is the economic life, year.
Since the reservoir conditions, surface facilities, and cushion gas type were assumed to be identical, the cost differences arising from these factors were neglected. This assumption leads to generally lower estimated absolute costs but does not affect the relative comparison among different well patterns. Based on Equations (4)–(6), the recovered hydrogen purity under different well patterns were substituted into the equations, and the calculated results are presented in Table 3. The results indicate that, under otherwise identical conditions, the hydrogen storage cost of the five-spot well pattern is the lowest. This outcome is primarily attributed to the higher recovered hydrogen purity achieved with this well pattern, which significantly reduces purification costs. Therefore, considering both hydrogen recovery purity and economic constraints, the five-spot well pattern is identified as the most suitable pattern for aquifer-based hydrogen storage.
Table 3.
The cost of hydrogen storage for different well pattern.
3.4. Factors Affecting the Purity of Recovered Hydrogen in a Five-Spot Pattern
Based on the study of the impact of different well patterns on the purity of recovered hydrogen, it is believed that the five-spot well pattern is more conducive to improving the efficiency of hydrogen storage in aquifers. In this work, the purity of recovered hydrogen is used as the evaluation indicator to study the variation patterns of recovered hydrogen purity for the five-spot well pattern with different influencing factors. Based on the experience from the single-well model, adjustments are made to the horizontal permeability and permeability gradient for the five-spot pattern simulation. Due to the difficulty of hydrogen production in positive rhythm reservoirs, only reverse rhythm reservoir models are designed for the five-spot pattern simulation. Table 4 presents the initial parameter values and ranges of variation for the five-spot well pattern simulation cases.
Table 4.
Initial parameter values and ranges of variation for the five-spot pattern simulation cases.
Figure 20 shows the mole fraction of CH4 in the produced gas with different factors under five-spot well pattern. Compared to the single-well model, the separation of cushion gas injection wells from hydrogen injection wells, as well as the change in the cushion gas injection locations in the five-spot well pattern, has altered the relationship between certain factors and the purity of recovered hydrogen. The mole fraction of CH4 in the produced gas is positively correlated with temperature, initial pressure, horizontal permeability, Kv/Kh, and hydrogen production rate. The relationship between permeability gradient and the purity of recovered hydrogen is the same for both the five-spot well pattern and the single-well model. The impact of hydrogen injection rate on the purity of recovered hydrogen is minimal, with a maximum difference of less than 1%. In the simulation of hydrogen storage with five-point well pattern, except for horizontal permeability, the mole fraction of CH4 in other cases was less than 6%, which indicates that higher purity of recovered hydrogen can be obtained by using five-point well pattern.
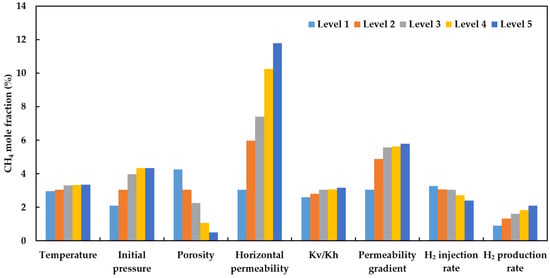
Figure 20.
Mole fraction of CH4 in the produced gas with different factors under five-spot well pattern.
4. Discussion
This study followed a staged, decision-oriented workflow. First, a single-well injection-production model was used to study cushion gases (CO2, N2, and CH4) based on reservoir pressure and hydrogen recovery, from which CH4 emerges as the most favorable owing to its highest recovery. Second, with CH4 fixed as the cushion gas, we conducted single-factor sensitivity analyses to quantify how reservoir and operational parameters individually influence the purity of the recovered hydrogen; under the single-well model, purity remains generally low across the tested ranges. Third, we therefore evaluated alternative well-pattern designs subject to economic constraints, and found that the five-spot pattern substantially increases recovered hydrogen purity while maintaining the economic advantage. Finally, we repeated the single-factor purity analysis under the five-spot pattern to provide design guidance.
Cushion gas fills the reservoir pores, increasing the initial reservoir pressure, leading to a more significant pressure increase when hydrogen is subsequently injected, thereby extending the stable production period. N2 and CH4 have higher compression factors under reservoir conditions. This means that, for the same volume change, these gases result in a more substantial pressure change. Therefore, after injecting N2 or CH4, the reservoir pressure increases more noticeably, especially during the first injection-production cycle. CH4 as a cushion gas achieves the highest improvement in hydrogen recovery. Because the molecular weight of CH4 is less than that of N2 or CO2. Decreasing the molecular weight of the cushion gas was found to increase the hydrogen recovery [17].
Moving from single-well to line-drive and five-spot patterns changes the flow path of both cushion gas and hydrogen. In the five-spot, corner injection of cushion gas establishes lateral pressure ridges that confine most CH4 to the flanks while the central well produced a gravity-segregated hydrogen. This geometry reduces the time-integrated cushion gas and hydrogen interfacial area near the producer and delays cushion gas breakthrough, hence the sharp improvement in hydrogen purity.
Figure 21 shows the rate of change in CH4 mole fraction with different factors under the five-spot pattern. Evidently, porosity and horizontal permeability exert the greatest influence on the purity of the recovered hydrogen. In the five-spot well pattern hydrogen storage simulation, larger porosity results in CH4 more easily accumulating near the corner wells, reducing the CH4 content near the central well, ultimately leading to an increase in the purity of recovered hydrogen. Higher horizontal permeability strengthens lateral connectivity between corner wells and the central well, enabling faster sweep and earlier breakthrough of cushion gas. Convective transport dominates near the wellbore, thickening the mixing zone and making gravity segregation during shut-in less effective, which reduces hydrogen purity. The effect of hydrogen production rate is likewise significant. As the hydrogen production rate increases, the pressure gradient around the central well becomes steeper, allowing CH4 from farther away to flow more readily toward the wellbore. This triggers viscous fingering and consequently reduces the purity of the produced hydrogen. By contrast, the influence of hydrogen injection rate is quite minor. Moreover, the permeability gradient is by no means intrinsically unimportant. The apparently minor impact observed here stems from the deliberately narrow range we assigned to this parameter when building the model. This study has demonstrated that reverse rhythm reservoirs with smaller inter-layer permeability differences can better improve the purity of recovered hydrogen. Finally, increasing depth generally raises both temperature and pressure. A five-spot well pattern can lower the purity of produced hydrogen. Meanwhile, drilling costs will change. These competing effects need to be re-evaluated in future work.
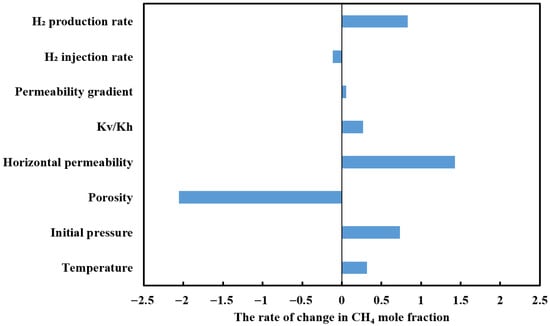
Figure 21.
The rate of change in CH4 mole fraction with different factors under five-spot well pattern.
5. Conclusions
The main purpose of this work was to study the effects of different cushion gases on the performance of UHS in an aquifer, and to study the impact of various factors on the purity of recovered hydrogen. Based on the simulation results, CH4 proved to be the most effective cushion gas for improving hydrogen recovery in aquifer-based UHS. In the single-well model, the mole fraction of CH4 in the produced gas was greater than 15% in most cases, resulting in generally low purity of recovered hydrogen. We evaluated alternative well-pattern designs subject to economic constraints, and found that the five-spot pattern substantially increases recovered hydrogen purity while maintaining the economic advantage.
In the five-point well pattern model, higher porosity tends to suppress mechanical dispersion and buffer cushion gas, enhancing purity; higher horizontal permeability accelerates convective sweep and early cushion-gas breakthrough, reducing purity. Hydrogen production rate is critical; if it is too high, the purity of the recovered hydrogen decreases. In contrast, hydrogen injection rate has only a minor effect. When selecting a site for hydrogen storage, reverse rhythm reservoirs with smaller permeability differences should be chosen to achieve relatively high hydrogen recovery and purity of recovered hydrogen.
This study provides a systematic parameter optimization framework and decision-making support for the field implementation of aquifer-based hydrogen storage, actively contributing to the large-scale seasonal storage of hydrogen energy and balancing supply and demand.
Despite systematically investigating the effects of cushion gases and various parameters on UHS performance, this study has certain limitations. Firstly, the model did not account for microbial activity, which could lead to hydrogen consumption and pore clogging, potentially affecting long-term storage efficiency in real-world aquifers. Furthermore, the model did not fully consider the impacts of complex structures on gas migration. Future research should incorporate microbial reaction modules and conduct coupled multi-physics simulations; explore hydrogen storage behavior under complex geological conditions using real field data, thereby facilitating the transition of aquifer-based hydrogen storage from theory to engineering practice.
Author Contributions
Conceptualization, Y.Q., C.C. and Z.W.; methodology, Y.Q. and K.R.; software, Y.Q. and K.R.; formal analysis, Y.Q. and C.C.; investigation, K.R. and Z.W.; resources, C.C.; writing—original draft preparation, Y.Q. and K.R.; writing—review and editing, Y.Q.; supervision, C.C. All authors have read and agreed to the published version of the manuscript.
Funding
This research was funded by the National Natural Science Foundation of China (No. 51974343) and the National Science and Technology Major Project of the Ministry of Science and Technology of China (No. 2024ZD1406605).
Institutional Review Board Statement
Not applicable.
Informed Consent Statement
Not applicable.
Data Availability Statement
The data used to support the findings of this study are available from the corresponding author upon request.
Conflicts of Interest
Author Kan Ren was employed by the Shaanxi Yanchang Petroleum (Group) Co., Ltd. The remaining authors declare that the research was conducted in the absence of any commercial or financial relationships that could be construed as a potential conflict of interest.
Abbreviations
The following abbreviations are used in this manuscript:
| UHS | Underground hydrogen storage |
| CO2 | Carbon dioxide |
| N2 | Nitrogen |
| CH4 | Methane |
| JST | Jossi-Stiel-Thodos |
| HZYT | Herning-Zipperer-Yoon-Thodos |
| Kv/Kh | Vertical to horizontal permeability ratio |
| LCHS | Levelized cost of hydrogen storage |
| CRF | Capital recovery factor |
References
- Yang, X.; Nielsen, C.P.; Song, S.J.; McElroy, M.B. Breaking the hard-to-abate bottleneck in China’s path to carbon neutrality with clean hydrogen. Nat. Energy 2022, 7, 955–965. [Google Scholar] [CrossRef]
- Tomassi, A.; Caforio, A.; Romano, E.; Lamponi, E.; Pollini, A. The development of a competence framework for environmental education complying with the european qualifications framework and the european green deal. J. Environ. Educ. 2024, 55, 153–179. [Google Scholar] [CrossRef]
- Tarkowski, R. Underground hydrogen storage: Characteristics and prospects. Renew. Sustain. Energy Rev. 2019, 105, 86–94. [Google Scholar] [CrossRef]
- Wang, J.K.; Wu, R.; Wei, M.Z.; Bai, B.J.; Xie, J.; Li, Y.H. A comprehensive review of site selection, experiment and numerical simulation for underground hydrogen storage. Gas. Sci. Eng. 2023, 118, 205105. [Google Scholar] [CrossRef]
- Cui, C.Z.; Ren, K.; Wu, Z.W.; Yao, T.Y.; Xu, H.; Qiu, X.H. Feasibility analysis of hydrogen storage in underground aquifers. Chem. Eng. Oil Gas. 2022, 51, 41–50. [Google Scholar] [CrossRef]
- Bai, T.; Tahmasebi, P. Coupled hydro-mechanical analysis of seasonal underground hydrogen storage in a saline aquifer. J. Energy Storage 2022, 50, 104308. [Google Scholar] [CrossRef]
- Bahrami, M.; Amiri, E.I.; Zivar, D.; Ayatollahi, S.; Mahani, H. Challenges in the simulation of underground hydrogen storage: A review of relative permeability and hysteresis in hydrogen-water system. J. Energy Storage 2023, 73, 108886. [Google Scholar] [CrossRef]
- Pan, S.Q.; Zou, C.N.; Wang, H.Z.; Xiong, B.; Wang, Z.H.; Wang, K.; Mu, Y.; Wang, S.; Li, Z.B.; Li, G.H.; et al. Development status of underground hydrogen storages and top ten technical challenges to efficient construction of gas reservoir-type underground hydrogen storages. Nat. Gas. Ind. 2023, 43, 164–180. [Google Scholar] [CrossRef]
- Hao, Y.M.; Ren, K.; Cui, C.Z.; Wu, Z.W. Optimization of cushion gas types and injection production parameters for underground hydrogen storage in aquifers. Energy Storage Sci. Technol. 2023, 12, 2881–2887. [Google Scholar] [CrossRef]
- Oldenburg, C.M. Carbon dioxide as cushion gas for natural gas storage. Energy Fuels 2003, 17, 240–246. [Google Scholar] [CrossRef]
- Jia, Z.H.; Cao, R.Y.; Pu, B.B.; Dehghanpour, H.; Cheng, L.S.; Zhang, Q.Y.; Awotunde, A.A. Pore-scale binary diffusion behavior of Hydrogen-Cushion gas in saline aquifers for underground hydrogen Storage: Optimization of cushion gas type. Fuel 2025, 381, 133481. [Google Scholar] [CrossRef]
- Saeed, M.; Jadhawar, P. Optimizing underground hydrogen storage in aquifers: The impact of cushion gas type. Int. J. Hydrogen Energy 2024, 52, 1537–1549. [Google Scholar] [CrossRef]
- Wang, Z.; Zhang, L.F.; Lu, W.J.; Guo, H.R.; Wang, Y.H. Soret effect on the mixing of H2 and CO2 cushion gas: Implication for underground hydrogen storage. Int. J. Hydrogen Energy 2024, 83, 1331–1337. [Google Scholar] [CrossRef]
- Yekeen, N.; Al-Yaseri, A.; Negash, B.M.; Ali, M.; Giwelli, A.; Esteban, L.; Sarout, J. Clay-hydrogen and clay-cushion gas interfacial tensions: Implications for hydrogen storage. Int. J. Hydrogen Energy 2022, 47, 19155–19167. [Google Scholar] [CrossRef]
- Tahmasebi, A.; Nasiri, A.; Riazi, M.; Amiri, M. Advantages and disadvantages of in situ N2 presence in underground gas storage (UGS) process: Technical and economical evaluation of a case study. J. Nat. Gas. Sci. Eng. 2020, 84, 103649. [Google Scholar] [CrossRef]
- Feldmann, F.; Hagemann, B.; Ganzer, L.; Panfilov, M. Numerical simulation of hydrodynamic and gas mixing processes in underground hydrogen storages. Environ. Earth Sci. 2016, 75, 1165. [Google Scholar] [CrossRef]
- Kanaani, M.; Sedaee, B.; Asadian-Pakfar, M. Role of cushion gas on underground hydrogen storage in depleted oil reservoirs. J. Energy Storage 2022, 45, 103783. [Google Scholar] [CrossRef]
- Zamehrian, M.; Sedaee, B. Underground hydrogen storage in a partially depleted gas condensate reservoir: Influence of cushion gas. J. Pet. Sci. Eng. 2022, 212, 110304. [Google Scholar] [CrossRef]
- Heinemann, N.; Alcalde, J.; Miocic, J.M.; Hangx, S.J.T.; Kallmeyer, J.; Ostertag-Henning, C.; Hassanpouryouzband, A.; Thaysen, E.M.; Strobel, G.J.; Schmidt-Hattenberger, C.; et al. Enabling large-scale hydrogen storage in porous media—The scientific challenges. Energy Environ. Sci. 2021, 14, 853–864. [Google Scholar] [CrossRef]
- Luboń, K.; Tarkowski, R. The influence of the first filling period length and reservoir level depth on the operation of underground hydrogen storage in a deep aquifer. Int. J. Hydrogen Energy 2023, 48, 1024–1042. [Google Scholar] [CrossRef]
- Bagchi, C.; Patwardhan, S.D.; Iglauer, S.; Mahmud, H.B.; Ali, M.F.J. A critical review on parameters affecting the feasibility of underground hydrogen storage. ACS Omega 2025, 10, 11658–11696. [Google Scholar] [CrossRef]
- Döpp, L.; Eckel, A.M.; Farkas, M.P.; Weinzierl, W.; Schmidt-Hattenberger, C.; Sass, I. Sensitivity analysis of geological parameters to evaluate uncertainty in underground hydrogen storage performance for a saline aquifer at Ketzin (Germany). Geomech. Geophys. Geo-Energ. Geo-Resour. 2025, 11, 98. [Google Scholar] [CrossRef]
- Mahmoodpour, S.; Singh, M.; Omrani, S.; Sass, I.; Drews, M. Thermo-hydro-mechanical simulation considering cushion gases, reservoir heterogeneity and sensitivity analysis of hydrogen storage in saline aquifers. J. Energy Storage 2025, 130, 117302. [Google Scholar] [CrossRef]
- Luboń, K.; Tarkowski, R.; Uliasz-Misiak, B. Impact of depth on underground hydrogen storage operations in deep aquifers. Energies 2024, 17, 1268. [Google Scholar] [CrossRef]
- Eddaoui, N.; Panfilov, M.; Ganzer, L.; Hagemann, B. Impact of pore clogging by bacteria on underground hydrogen storage. Transp. Porous Media 2021, 139, 89–108. [Google Scholar] [CrossRef]
- Hagemann, B.; Rasoulzadeh, M.; Panfilov, M.; Ganzer, L.; Reitenbach, V. Mathematical modeling of unstable transport in underground hydrogen storage. Environ. Earth Sci. 2015, 73, 6891–6898. [Google Scholar] [CrossRef]
- Pan, B.; Liu, K.; Ren, B.; Zhang, M.S.; Ju, Y.; Gu, J.W.; Zhang, X.Y.; Clarkson, C.R.; Edlmann, K.; Zhu, W.Y.; et al. Impacts of relative permeability hysteresis, wettability, and injection/withdrawal schemes on underground hydrogen storage in saline aquifers. Fuel 2023, 333, 126516. [Google Scholar] [CrossRef]
- Lu, J.H.; Muhammed, N.S.; Okolie, J.A.; Epelle, E.I. A sensitivity study of hydrogen mixing with cushion gases for effective storage in porous media. Sustain. Energy Fuels 2025, 9, 1353–1370. [Google Scholar] [CrossRef]
- Matos, C.R.; Carneiro, J.F.; Silva, P.P. Overview of large-scale underground energy storage technologies for integration of renewable energies and criteria for reservoir identification. J. Energy Storage 2019, 21, 241–258. [Google Scholar] [CrossRef]
- Muhammed, N.S.; Haq, B.; Shehri, D.A.; Al-Ahmed, A.; Rahman, M.M.; Zaman, E. A review on underground hydrogen storage: Insight into geological sites, influencing factors and future outlook. Energy Rep. 2022, 8, 461–499. [Google Scholar] [CrossRef]
- Navaid, H.B.; Emadi, H.; Watson, M. A comprehensive literature review on the challenges associated with underground hydrogen storage. Int. J. Hydrogen Energy 2023, 48, 10603–10635. [Google Scholar] [CrossRef]
- Zivar, D.; Kumar, S.; Foroozesh, J. Underground hydrogen storage: A comprehensive review. Int. J. Hydrogen Energy 2021, 46, 23436–23462. [Google Scholar] [CrossRef]
- Thaysen, E.M.; McMahon, S.; Strobel, G.J.; Butler, I.B.; Ngwenya, B.T.; Heinemann, N.; Wilkinson, M.; Hassanpouryouzband, A.; McDermott, C.I.; Edlmann, K. Estimating microbial growth and hydrogen consumption in hydrogen storage in porous media. Renew. Sustain. Energy Rev. 2021, 151, 111481. [Google Scholar] [CrossRef]
- Yekta, A.E.; Manceau, J.C.; Gaboreau, S.; Pichavant, M.; Audigane, P. Determination of hydrogen-water relative permeability and capillary pressure in sandstone: Application to underground hydrogen injection in sedimentary formations. Transp. Porous Media 2018, 122, 333–356. [Google Scholar] [CrossRef]
- Delshad, M.; Alhotan, M.; Fernandes, B.R.B.; Umurzakov, Y.; Sepehrnoori, K. Pros and cons of saline aquifers against depleted hydrocarbon reservoirs for hydrogen energy storage. In Proceedings of the SPE Annual Technical Conference and Exhibition, Houston, TX, USA, 3–5 October 2022; p. SPE-210351-MS. [Google Scholar] [CrossRef]
- Amiri, I.I.; Zivar, D.; Ayatollahi, S.; Mahani, H. The effect of gas solubility on the selection of cushion gas for underground hydrogen storage in aquifers. J. Energy Storage 2024, 80, 110264. [Google Scholar] [CrossRef]
- Chen, F.X.; Ma, Z.W.; Nasrabadi, H.; Chen, B.L.; Mehana, M.Z.S.; Wijk, J.V. Capacity assessment and cost analysis of geologic storage of hydrogen: A case study in Intermountain-West Region USA. Int. J. Hydrogen Energy 2023, 48, 9008–9022. [Google Scholar] [CrossRef]
Disclaimer/Publisher’s Note: The statements, opinions and data contained in all publications are solely those of the individual author(s) and contributor(s) and not of MDPI and/or the editor(s). MDPI and/or the editor(s) disclaim responsibility for any injury to people or property resulting from any ideas, methods, instructions or products referred to in the content. |
© 2025 by the authors. Licensee MDPI, Basel, Switzerland. This article is an open access article distributed under the terms and conditions of the Creative Commons Attribution (CC BY) license (https://creativecommons.org/licenses/by/4.0/).