Abstract
This study reports the development of a fiber-optic localized surface plasmon resonance (FO-LSPR) sensor incorporating a three-dimensional micropillar array functionalized with gold nanoparticles. The micropillar structures were fabricated on the fiber facet using a single-mask imprint lithography process, followed by nanoparticle immobilization to create a composite plasmonic surface. Compared with flat polymer-coated fibers, the micropillar array markedly increased the effective sensing surface and enhanced light trapping by providing anti-reflective conditions at the interface. Consequently, the sensor demonstrated superior performance in refractive index sensing, yielding a sensitivity of 4.54 with an R2 of 0.984, in contrast to 3.13 and 0.979 obtained for the flat counterpart. To validate its biosensing applicability, Interleukin-8 (IL-8), a cancer-associated cytokine, was selected as a model analyte. Direct immunoassays revealed quantitative detection across a broad dynamic range (0.1–1000 pg/mL) with a limit of detection of 0.013 pg/mL, while specificity was confirmed against non-target proteins. The proposed FO-LSPR platform thus offers a cost-effective and reproducible route to overcome the surface-area limitations of conventional designs, providing enhanced sensitivity and stability. These results highlight the potential of the micropillar-based FO-LSPR sensor for practical deployment in point-of-care diagnostics and real-time biomolecular monitoring.
1. Introduction
Localized surface plasmon resonance (LSPR) arises when incident light drives the collective oscillation of conduction electrons at the surface of metallic nanoparticles, producing pronounced absorption and scattering at characteristic wavelengths [1,2,3]. The resonance position and spectral intensity are strongly determined by factors such as the particle’s composition [4], size [5], geometry [6], and the refractive index of the surrounding environment [7]. Because of this sensitivity to local dielectric changes, LSPR-based platforms are capable of real-time, label-free, and highly sensitive detection of target analytes [8]. Compared with gold-film-based SPR sensors, which generate propagating plasmon modes with weak field confinement and require angle or polarization interrogation [9], Au nanoparticle-based LSPR produces strongly confined near-fields within only a few tens of nanometers of the particle surface [10]. Such localized fields are highly sensitive to molecular binding and enable simpler, alignment-free operation, motivating the use of AuNPs in this work instead of thin gold films.
In recent years, growing research interest has been directed toward combining LSPR with optical fiber technology, giving rise to fiber-optic LSPR (FO-LSPR) configurations. Compared with conventional free-space setups, FO-LSPR sensors exhibit several practical advantages, including compactness, flexibility, reduced optical losses, capability for remote operation, and robust mechanical stability. Furthermore, their inherent compatibility with components already standardized in the telecommunications industry allows low-cost and scalable fabrication [11]. Owing to these merits, FO-LSPR systems have been actively explored in diverse applications such as biosensing [12], environmental monitoring [13,14], and gas detection [15], and are increasingly recognized as promising candidates for developing portable, high-sensitivity analytical platforms.
Although conventional FO-LSPR sensors are implemented by coating metallic nanoparticles on the fiber end-face, the effective sensing surface area is restricted, thereby limiting performance [16,17]. Strategies to improve sensitivity are generally categorized into structural, material, and optical approaches [18]. Among these, a well-studied route involves tailoring nanoparticle geometries to maximize localized electromagnetic “hot spots.” For example, asymmetric designs such as nanodisks, nanorings, and nanostars can outperform conventional spherical or rod-like particles in concentrating the field [19,20]. Such architectures generate stronger field enhancement, thereby enabling reliable detection of analytes even at very low concentrations [21]. Beyond gold (Au), the use of alternative plasmonic materials—including silver (Ag), copper (Cu), and aluminum (Al)—as well as core–shell architectures has also been investigated to tune plasmonic properties for sensitivity enhancement [22,23]. From an optical standpoint, further improvements have been achieved by adjusting the polarization, angle, or wavelength of incident light, or by employing high-coupling fiber-end structures such as tapers, optrodes, and microtips [24,25]. In addition, plasmonic lattice resonances in periodic nanoparticle or nano bump arrays have also been reported to enhance sensitivity in optical biosensors [26,27,28]. Nevertheless, many of these high-sensitivity designs remain constrained by practical challenges, such as dependence on stringent fabrication parameters, chemical instability of constituent materials, limited reproducibility of nanostructure morphologies, and the complexity of optical alignment [29]. Collectively, these issues pose significant obstacles to large-area processing, sensor miniaturization, and the realization of portable diagnostic devices [30].
To address these limitations, this study introduces a straightforward single-mask nanoimprint process to integrate a three-dimensional micropillar array directly onto the fiber facet. Compared with a conventional flat surface, this architecture effectively enlarges both the accessible sensing area and the active volume, thereby increasing the probability of analyte–surface interactions. Moreover, by creating optical conditions close to anti-reflection at the structured interface, the micropillars enhance light confinement at the sensing region [31,32]. Taken together, these combined structural advantages provide a rational basis for simultaneous improvements in both LSPR signal intensity and overall detection sensitivity.
To demonstrate the practical utility of the proposed platform, Interleukin-8 (IL-8) was selected as a model biomarker. IL-8 is a cytokine involved in inflammatory signaling and modulation of the tumor microenvironment across various cancers, making it a clinically significant target for early diagnosis and prognosis [33,34]. Its potential role as an early diagnostic marker for pancreatic cancer has also been highlighted in recent studies, further underscoring its biomedical importance [35]. In this work, a direct immunoassay was employed to evaluate the sensitivity and quantitative response of the fabricated sensor toward IL-8. Overall, the three-dimensional micropillar-based FO-LSPR sensor is anticipated to overcome the inherent limitations of planar configurations and to provide tangible advantages for future applications in high-sensitivity biosensing, compact diagnostic devices, and field-deployable monitoring systems.
2. Materials and Methods
2.1. Materials
Deionized water (resistivity: 18.2 MΩ·cm) was obtained using an Arioso Power III system (Human Corporation, Hanam, Republic of Korea). Hydrofluoric acid (≥48%) and gold (III) chloride trihydrate were purchased from Sigma-Aldrich (St. Louis, MO, USA). Nitric acid (70%), isopropyl alcohol (99.5%), and sodium citrate dihydrate (≥99%) were supplied by Daejung Chemicals (Siheung, Republic of Korea). AZ 4330 photoresist was obtained from Clariant (Muttenz, Switzerland), while polydimethylsiloxane (PDMS, Sylgard 184) was procured from Dow Corning (Midland, MI, USA). The UV-curable adhesive NOA 74 was supplied by Norland Products (Cranbury, NJ, USA). 3-aminopropyldimethylethoxysilane (APMES, ≥95%) was purchased from Gelest (Morrisville, PA, USA). Silica-core multimode optical fiber (FG105UCA) was purchased from Thorlabs (Newton, NJ, USA), and the optical fiber cleaver (S326) was obtained from OFS Fitel (Norcross, GA, USA). Illumination sources included a white light source (HL-2000-LL, Ocean Insight, Orlando, FL, USA) and a monochromatic laser system (iFLEX-iRIS, Qioptiq, Neston, UK). Spectral detection was carried out using a CCD spectrometer (SM245, Korea Spectral Products, Seoul, Republic of Korea) and an amplified photodetector with adjustable gain (PDA36A2, Thorlabs, Newton, NJ, USA). Field-emission scanning electron microscopy (FE-SEM) was performed using an S-5200 instrument (Hitachi, Tokyo, Japan).
Phosphate-buffered saline (PBS, pH 7.4), bovine serum albumin (≥98%), and human serum albumin (≥97%) were all obtained from Sigma-Aldrich (St. Louis, MO, USA). Interleukin-8 (IL-8, ab281790-100) and the corresponding capture antibodies (ab241839) were acquired from Abcam (Cambridgeshire, UK).
2.2. Fabrication Process
The FO-LSPR sensor based on a polymer micropillar–gold nanoparticle composite was fabricated through four major steps. First, a primary mold was prepared using silicon micropillars. Second, a PDMS secondary mold was produced by soft lithography. In the third step, imprint lithography was employed to replicate a polymer micropillar array onto the optical fiber facet. Finally, gold nanoparticles were immobilized on the polymer structures to complete the sensor. Schematic overview of the entire fabrication sequence is presented in Figure 1.
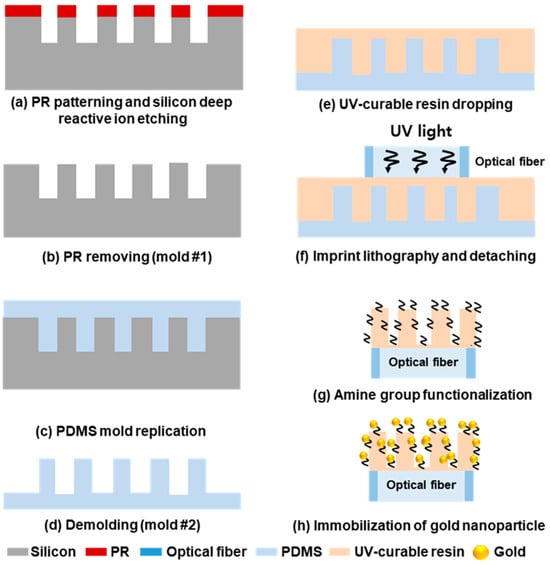
Figure 1.
Schematic diagram of overall fabrication process.
In the first step, silicon micropillars were formed by combining photolithography with deep reactive ion etching (DRIE). Using a mask aligner (MA-6, Karl Suss, Garching, Germany), photoresist disks with a diameter of 10 μm and a spacing of 5 μm were patterned on a silicon wafer. Subsequently, DRIE (SLR-770-10R-B, Plasma Therm, Petersburg, FL, USA) was performed to etch micropillars with an average depth of 8 μm (Figure 1a,b).
The PDMS secondary mold was fabricated from the silicon micropillar master using a soft lithography process. For this step, the silicon mold was fixed in a plastic dish, and a PDMS solution—prepared by mixing the elastomer base and curing agent at a 10:1 ratio—was poured onto it. The mixture was cured in an oven at 80 °C for 1 h (TH-ME-025, Jeio Tech, Daejeon, Republic of Korea (Figure 1c) [36]. After curing, the PDMS replica was carefully peeled off from the silicon master, resulting in the secondary mold (Figure 1d).
In the imprint lithography step, the PDMS secondary mold was used to replicate a micropillar array structure onto an optical fiber (FG105UCA, Thorlabs, Newton, NJ, USA) [37]. The multimode fiber had a core diameter of 105 μm and a cladding diameter of 125 μm, consisting of pure silica for the core and fluorine-doped silica for the cladding, with an operating range of 250–1200 nm [38]. Prior to imprinting, the fiber was cut into 15 cm segments, the cladding was stripped, and the end face was polished using a fiber-optic cleaver (S326, OFS Fitel, Norcross, GA, USA). Subsequently, 50 μL of UV-curable polymer was dispensed onto the PDMS mold (Figure 1e) and stored in a vacuum chamber for 10 min to remove air bubbles. Excess polymer was then removed to maintain uniform patterning, and the fiber facet was brought into contact with the mold. Finally, UV irradiation at 365 nm (M365FP1, Thorlabs, Newton, NJ, USA) was applied through the fiber for 20 min to cure the polymer (Figure 1f).
Gold nanoparticles (AuNPs) were immobilized onto the fabricated polymer micropillars to form a composite sensing structure. For comparison, a flat polymer-coated fiber was also functionalized with AuNPs using the same procedure. The immobilization process consisted of three sequential steps. First, the fiber surface was treated with oxygen plasma (CUTE, Femto Science, Hwaseong, Republic of Korea) at 60 W, 0.1 Torr for 40 s to increase surface polarity and promote electrostatic binding [39]. Second, the fiber was immersed in a 5% APMES solution for 90 min to introduce amine groups, thereby facilitating nanoparticle attachment (Figure 1g). Finally, the fiber was incubated in the colloidal AuNP solution for 60 min, allowing stable binding through interactions with the surface amine groups (Figure 1h) [40]. The AuNPs were synthesized by reducing 0.01% aqueous HAuCl4·3H2O (50 mL) with 1 mL of 1% sodium citrate dihydrate solution, yielding colloids of uniform size [41].
The miniaturized sensor design required only a small quantity of immobilized AuNPs. In addition, the silicon molds produced via photolithography and DRIE could be reused multiple times, thereby reducing the overall fabrication cost. Consequently, the proposed FO-LSPR sensors can be manufactured in a cost-effective manner.
2.3. Optical Measurement Setup
To evaluate the performance of the FO-LSPR sensor, a measurement system was constructed using two types of sensors, and spectral responses to refractive index changes were analyzed under white-light illumination. The optical setup consisted of a white light source (HL-2000-LL, Ocean Insight, Orlando, FL, USA), a spectrometer (SM245, Korea Spectral Products, Seoul, Republic of Korea), and a 2 × 1 fiber coupler (Thorlabs, Newton, NJ, USA). One port of the coupler was connected to the light source via a PC/PC connector, while the other was linked to the spectrometer through an SMA connector. The remaining port was spliced to the fabricated FO-LSPR sensor using a fusion splicer (A-80S, COMPTYCO, Shenzhen, China). In this configuration, light from the source was guided to the fiber surface through total internal reflection caused by the refractive index difference between the core and cladding [42]. For refractive index measurements, solutions with refractive indices ranging from 1.33 to 1.38 were placed in 1.5 mL vials, and the sensor tip with nanostructures was immersed for signal acquisition. Sensitivity and linearity were assessed based on the recorded spectral responses. For comparison, output signals were normalized with respect to the baseline response obtained in deionized water (n = 1.33). A schematic of the optical setup is shown in Figure 2.
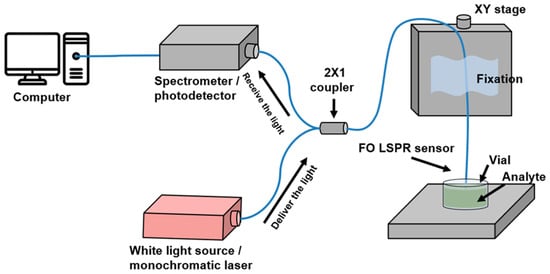
Figure 2.
Measurement setup of the fiber-optic plasmon nanoprobe system. The optical source and detector are connected via a 2 × 1 fiber coupler, and scattered light from the sensor surface is collected and transmitted to the spectrometer. For immunoassay monitoring, a laser and photodetector were used to record signal variations.
3. Results and Discussion
3.1. Fabrication Results
Scanning electron microscopy (SEM) images of each fabrication step for the polymer micropillar–gold nanoparticle composite FO-LSPR sensor are presented in Figure 3. Figure 3a shows the morphology of the silicon micropillar array used as the primary mold, with an average height of 8.91 ± 0.23 μm and a diameter of 9.26 ± 0.14 μm. After soft lithography, the replicated micropillar array in the PDMS secondary mold was observed, as illustrated in Figure 3b.
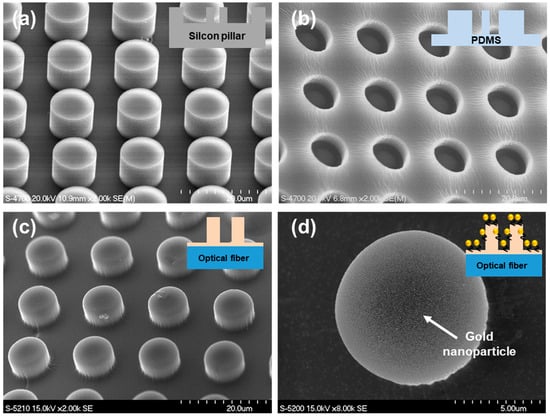
Figure 3.
SEM images in each fabrication step of FO-LSPR sensor based on polymer micropillar and gold nanoparticles composite: (a) Silicon micropillar array as primary mold, (b) PDMS secondary mold, (c) polymer micropillars fabricated on optical fiber, (d) gold nanoparticles attached on micropillar.
Figure 3c depicts the polymer micropillars replicated onto the fiber facet by imprint lithography using the PDMS mold. The average height and diameter of the fabricated polymer micropillars were measured to be 7.17 ± 0.62 μm and 9.02 ± 0.51 μm, respectively. The discrepancy in height compared with the original silicon micropillars is likely attributed to cumulative errors during the two-step molding process as well as shrinkage of the UV-curable polymer during curing [43]. Such deviations can be minimized by adjusting the dimensions of the silicon master and optimizing curing parameters, including exposure time and irradiation intensity. Figure 3d further confirms that AuNPs were successfully immobilized on the micropillar surfaces.
Figure 4 presents SEM images of the fabricated FO-LSPR sensor with micropillar architecture. In Figure 4a, the micropillar array is shown to be consistently formed across the fiber facet. A higher-magnification image of the array (Figure 4b) further demonstrates the uniformity and regularity of the replicated structures. Figure 4c,d displays SEM images of individual micropillars after AuNP immobilization, confirming that the nanoparticles were densely and uniformly attached to the surfaces. The average surface coverage of the immobilized AuNPs was quantified as 32.12 ± 2.19%, with an average particle diameter of 49.21 ± 6.62 nm. A uniform distribution of AuNPs was observed across the sensor regions, indicating homogeneous coverage of the structured surface. In addition, the optical characteristics of the colloidal AuNPs were verified by UV–Vis absorption spectroscopy (Supplementary Figure S1).
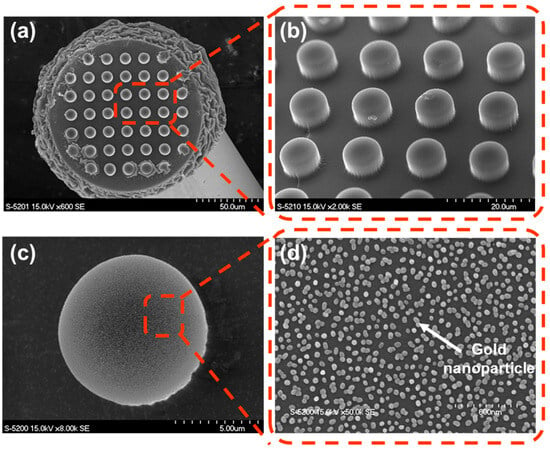
Figure 4.
SEM images validating the structural uniformity and nanoparticle distribution of the fabricated FO-LSPR sensor: (a,b) Low- and high-magnification images showing the polymer micropillar array uniformly formed on the optical fiber surface. (c,d) Single micropillar tip and its surface, where gold nanoparticles are densely distributed.
3.2. Characterization of the FO-LSPR
The RI response of the FO-LSPR sensors was analyzed using the optical setup described in Section 2.3. Figure 5 illustrates the refractive index response of an FO-LSPR sensor coated with a flat polymer surface. Spectral intensity was measured for refractive indices ranging from 1.33 to 1.38. As the refractive index increased, the sensor output also increased, with a peak observed at 609 nm (Figure 5a). Figure 5b shows the normalized response, revealing a positive correlation with refractive index and exhibiting linear behavior. Sensitivity of the sensor was evaluated based on intensity variations with refractive index changes [44,45]. The calculated sensitivity (slope) was 3.13, with a coefficient of determination (R2) of 0.979.
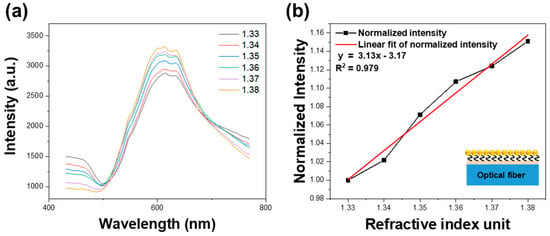
Figure 5.
Spectral responses of flat polymer-coated surface FO-LSPR sensors: (a) Intensity measured under different refractive indices (n = 1.33–1.38). (b) Sensitivity of FO-LSPR sensor. Max intensity is normalized with refractive index of 1.33.
The results for the fiber sensor incorporating polymer micropillars are presented in Figure 6a. Based on the resonance peak intensity, the slope was determined to be 4.54, with an R2 value of 0.984 (Figure 6b). These results confirm that the micropillar-based sensor provides higher sensitivity and improved linearity compared to the flat structure, while the resonance peak (601 nm) remains within the expected spectral range.

Figure 6.
Spectral responses of micropillar array FO-LSPR sensors: (a) Intensity measured under different refractive indices (n = 1.33–1.38). (b) Sensitivity of FO-LSPR sensor. Max intensity is normalized with refractive index of 1.33.
The micropillar configuration demonstrated a 45% enhancement in sensitivity compared with the flat polymer-coated surface. The observed enhancement in sensitivity and signal intensity can be attributed to the micropillar architecture, which captures incident light more efficiently than a flat surface and induces multiple scattering pathways at the fiber end face, thereby increasing the probability of light–analyte interactions [14,46]. In addition, the micropillar array expands the available surface area for nanoparticle attachment per unit area, effectively enlarging the active sensing interface. At the same time, the structure increases the effective sensing volume, raising the likelihood that target molecules will interact with the sensor surface. Collectively, these structural advantages enable sensitive detection of analytes even at low concentrations and contribute directly to the overall improvement in sensor performance [46,47].
3.3. Application as a Biosensor for Cancer Detection (IL-8)
Interleukin-8 (IL-8) is a cytokine involved in inflammatory processes as well as tumor growth, invasion, and metastasis, and it has been identified as a potential biomarker for a variety of malignancies [48]. Because IL-8 levels are closely correlated with cancer progression, precise quantitative analysis is essential for early diagnosis and prognosis monitoring [49]. In this study, FO-LSPR sensors with three-dimensional micropillar structures were employed to quantitatively detect IL-8 using a direct, label-free immunoassay format.
The optical system for the immunoassay was adapted from the refractive index measurement setup, with the white light source replaced by a 642 nm monochromatic laser and the spectrometer substituted with a photodetector. IL-8 detection was monitored by recording the intensity variation at 642 nm. Figure 7 shows the sensorgram obtained at 100 pg/mL IL-8, illustrating the signal change recorded during the immunoassay. First, a baseline was established by immersing the sensor in phosphate-buffered saline (PBS) for more than 5 min (a). Subsequently, IL-8 antibodies (20 μg/mL in PBS) were adsorbed onto the Au surface (b). Excess antibodies were removed by washing, and incubation cycles were repeated in biomolecular solutions to ensure stable adsorption (c). The sensor was then exposed to 1% BSA solution for 15 min to block nonspecific binding (d), followed by washing (e). Antigen–antibody binding was induced by incubating the sensor with IL-8 antigen solution for 5 min (f) [50]. Unbound antigens were rinsed away with PBS (g), and the change in LSPR intensity before and after binding was recorded in the sensorgram. Signal calibration was carried out against the baseline determined by the distribution of AuNPs on the fiber facet. All biomolecular samples were diluted in PBS, and calibration curves were generated from the mean values of three independent measurements of LSPR output at each antigen concentration (0.1–1000 pg/mL) using separate sensors.
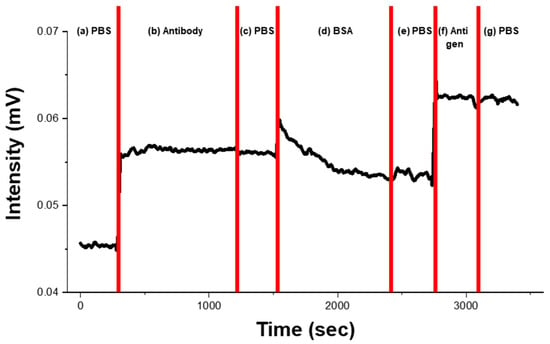
Figure 7.
Sensorgram of the IL-8 immunoassay of the FO-LSPR sensor obtained using a 642 nm laser. The figure shows signal response measured at an IL-8 concentration of 100 pg/mL. (a) The baseline was first recorded by exposing the sensor to PBS for more than 5 min. (b) IL-8 antibodies (20 μg/mL in PBS) were then adsorbed onto the AuNPs. (c) washing step to remove excess antibodies. (d) 1% BSA treatment 15 min to block nonspecific binding. (e) washing. (f) Antigen reaction. (g) Unbound antigens were removed by PBS washing.
Figure 8 presents the calibration results obtained by linear fitting of the mean values with standard deviations (σ). The limit of detection (LOD) was determined according to the International Union of Pure and Applied Chemistry (IUPAC) guidelines, using the mean and standard deviation of the blank samples to calculate the curve-fitting equation (black line). The LOD was estimated to be 0.013 pg/mL [51]. The average coefficient of variation (CV) was 14.6%, with the lowest CV of 6.16% at 1 pg/mL and the highest CV of 22.56% at 100 pg/mL, indicating acceptable reproducibility. To verify the specificity of the FO-LSPR immunoassay, a control test was performed using human serum albumin (HSA), a protein abundantly present in blood. No significant LSPR signal variation was observed with different HSA concentrations, and the CV ranged from 3.62% to 10.03%, further confirming good assay reliability. The performance of the proposed sensor was compared with previously reported IL-8 biosensors (Table 1), indicating a lower LOD than conventional methods while maintaining a broad dynamic range.
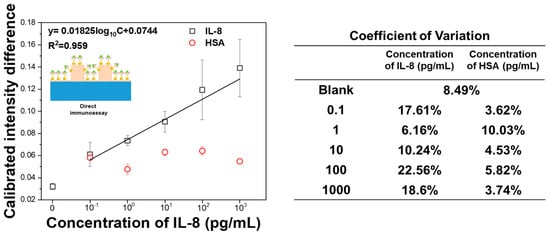
Figure 8.
Direct immunoassay of IL-8 using a gold nanoparticle-based FO-LSPR sensor and Coefficient of variation. HSA was tested as a negative control to evaluate specificity. The inset schematic illustrates the direct binding of IL-8 on the functionalized sensor surface.

Table 1.
Various sensors for the detection of IL-8.
4. Conclusions
In this study, an FO-LSPR sensor incorporating a three-dimensional architecture was fabricated and quantitatively evaluated, leveraging the inherent advantages of LSPR for high-sensitivity and real-time detection. LSPR, originating from the collective oscillation of conduction electrons on metallic nanoparticle surfaces, is highly responsive to changes in the surrounding dielectric environment, enabling versatile detection of a wide range of analytes.
In the proposed design, UV-curable polymer micropillars were formed on the fiber facet, effectively expanding both the sensing surface area and volume compared with flat structures. The arrangement and geometry of the micropillars were engineered to approximate anti-reflective conditions, thereby improving light trapping at the interface. These features collectively contributed to enhanced LSPR signal intensity and improved sensor sensitivity. The practical sensing capability was validated through a direct immunoassay targeting IL-8. The results confirmed that the proposed FO-LSPR sensor could reliably detect this biomarker with high sensitivity, underscoring its potential for medical diagnostic applications.
Overall, the 3D micropillar-based FO-LSPR sensor developed in this work represents a viable alternative to conventional planar designs and is expected to offer broad applicability in high-sensitivity bioanalysis, early disease diagnostics, and portable biosensing platforms.
Supplementary Materials
The following supporting information can be downloaded at: https://www.mdpi.com/article/10.3390/app152010894/s1, Figure S1. UV–Vis absorption spectrum of gold nanoparticle (AuNP) colloids synthesized by the Turkevich method.
Author Contributions
Conceptualization, M.-J.K., J.-H.B. and H.-M.K.; methodology, M.-J.K., J.-H.B. and H.-M.K.; validation, M.-J.K. and J.-H.B.; formal analysis, M.-J.K. and J.-H.B.; investigation, M.-J.K. and J.-H.B.; resources, S.-K.L. and J.-H.P.; data curation, M.-J.K., J.-H.B. and H.-M.K.; writing—original draft preparation, M.-J.K. and J.-H.B.; writing—review and editing, S.-K.L. and J.-H.P.; visualization, M.-J.K. and J.-H.B.; supervision, S.-K.L. and J.-H.P.; project administration, S.-K.L. and J.-H.P.; funding acquisition, S.-K.L. and J.-H.P. All authors have read and agreed to the published version of the manuscript.
Funding
This work was supported by the Technology Innovation Program grants through the Korea Planning & Evaluation Institute of Industrial Technology (KEIT), funded by the Ministry of Trade, Industry & Energy (project number: RS-2024-00507794). Also, this work was supported by the National Research Foundation of Korea (NRF) grant funded by the Korea Government (MSIT) (No. 2023R1A2C2003786).
Institutional Review Board Statement
Not applicable.
Informed Consent Statement
Not applicable.
Data Availability Statement
The original contributions presented in the study are included in the article/Supplementary Materials, further inquiries can be directed to the corresponding authors.
Conflicts of Interest
Author Hyeong-Min Kim was employed by the company Nanophilia Inc. The remaining authors declare that the research was conducted in the absence of any commercial or financial relation-ships that could be construed as a potential conflict of interest.
References
- Campos, A.; Troc, N.; Cottancin, E.; Pellarin, M. Plasmonic quantum size effects in silver nanoparticles are dominated by interfaces and local environments. Nat. Phys. 2019, 15, 275–280. [Google Scholar]
- Wu, Y.; Li, G.; Camden, J.P. Probing nanoparticle plasmons with electron energy loss spectroscopy. Chem. Rev. 2017, 117, 4929–4960. [Google Scholar]
- Chen, B.; Liu, C.; Hayashi, K. Selective terpene vapor detection using molecularly imprinted polymer coated Au nanoparticle LSPR sensor. IEEE Sens. J. 2014, 14, 3458–3464. [Google Scholar] [CrossRef]
- Sugawa, K.; Tahara, H.; Yamashita, A.; Otsuki, J.; Sagara, T.; Harumoto, T.; Yanagida, S. Refractive index susceptibility of the plasmonic palladium nanoparticle: Potential as the third plasmonic sensing material. ACS Nano 2015, 9, 1895–1904. [Google Scholar] [CrossRef]
- Spasopoulos, D.; Kaziannis, S.; Danakas, S.; Ikiades, A.; Kosmidis, C. LSPR based optical fiber sensors treated with nanosecond laser irradiation for refractive index sensing. Sens. Actuators B Chem. 2018, 256, 359–366. [Google Scholar]
- Shabaninezhad, M.; Ramakrishna, G. Theoretical investigation of size, shape, and aspect ratio effect on the LSPR sensitivity of hollow-gold nanoshells. J. Chem. Phys. 2019, 150, 144116. [Google Scholar] [CrossRef]
- Lee, S.; Song, H.; Ahn, H.; Kim, S.; Choi, J.-R.; Kim, K. Fiber-optic localized surface plasmon resonance sensors based on nanomaterials. Sensors 2021, 21, 819. [Google Scholar] [CrossRef] [PubMed]
- Xu, T.; Geng, Z. Strategies to improve performances of LSPR biosensing: Structure, materials, and interface modification. Biosens. Bioelectron. 2021, 174, 112850. [Google Scholar] [CrossRef] [PubMed]
- Homola, J. Surface plasmon resonance sensors for detection of chemical and biological species. Chem. Rev. 2008, 108, 462–493. [Google Scholar] [CrossRef]
- Mayer, K.M.; Hafner, J.H. Localized surface plasmon resonance sensors. Chem. Rev. 2011, 111, 3828–3857. [Google Scholar] [CrossRef] [PubMed]
- Jeong, H.H.; Erdene, N.; Park, J.H.; Jeong, D.H.; Lee, H.Y.; Lee, S.K. Real-time label-free immunoassay of interferon-gamma and prostate-specific antigen using a fiber-optic localized surface plasmon resonance sensor. Biosens. Bioelectron. 2013, 39, 346–351. [Google Scholar] [CrossRef]
- Kim, H.M.; Yang, S.H.; Park, J.H.; Lee, S.K. Fabrication of top-down-based optical fiber nanoprobes and their diagnostic application for pancreatic cancer. IEEE Sens. J. 2024, 24, 11966–11973. [Google Scholar] [CrossRef]
- Paul, D.; Dutta, S.; Saha, D.; Biswas, R. LSPR based ultra-sensitive low cost U-bent optical fiber for volatile liquid sensing. Sens. Actuators B Chem. 2017, 253, 735–742. [Google Scholar] [CrossRef]
- Kim, H.M.; Nam, K.T.; Lee, S.K.; Park, J.H. Fabrication and measurement of microtip-array-based LSPR sensor using bundle fiber. Sens. Actuators A Phys. 2018, 271, 146–152. [Google Scholar] [CrossRef]
- Kim, H.M.; Kim, H.J.; Park, J.H.; Lee, S.K. Bimetallic nanodisk-based fiber-optic plasmonic nanoprobe for gas detection. Spectrochim. Acta A Mol. Biomol. Spectrosc. 2024, 306, 123575. [Google Scholar] [CrossRef]
- Urrutia, A.; Goicoechea, J.; Arregui, F.J. Optical fiber sensors based on nanoparticle-embedded coatings. J. Sens. 2015, 2015, 805053. [Google Scholar] [CrossRef]
- Zhang, H.; Zhou, X.; Li, X.; Gong, P.; Zhang, Y.; Zhao, Y. Recent advancements of LSPR fiber-optic biosensing: Combination methods, structure, and prospects. Biosensors 2023, 13, 405. [Google Scholar] [CrossRef] [PubMed]
- Wang, M.; Krasnok, A.; Zhang, T.; Scarabelli, L.; Liu, H.; Wu, Z.; Liz-Marzán, L.M.; Terrones, M.; Alù, A.; Zheng, Y. Tunable Fano resonance and plasmon–exciton coupling in single Au nanotriangles on monolayer WS2 at room temperature. Adv. Mater. 2018, 30, 1705779. [Google Scholar] [CrossRef]
- Kim, H.-M.; Jeong, D.H.; Lee, H.-Y.; Park, J.-H.; Lee, S.-K. Design and validation of fiber optic localized surface plasmon resonance sensor for thyroglobulin immunoassay with high sensitivity and rapid detection. Sci. Rep. 2021, 11, 15985. [Google Scholar] [CrossRef]
- Zheng, P.; Cushing, S.K.; Suri, S.; Wu, N. Tailoring plasmonic properties of gold nanohole arrays for surface-enhanced Raman scattering. Phys. Chem. Chem. Phys. 2015, 17, 21211–21219. [Google Scholar] [CrossRef]
- Focsan, M.; Craciun, A.M.; Potara, M.; Leordean, C.; Vulpoi, A.; Maniu, D.; Astilean, S. Flexible and tunable 3D gold nanocups platform as plasmonic biosensor for specific dual LSPR-SERS immuno-detection. Sci. Rep. 2017, 7, 14240. [Google Scholar] [CrossRef]
- Cha, S.; Mun, J.; Chang, T.; Kim, S.Y.; Kim, J.; Jin, H.; Lee, J.Y.; Shin, J.; Kim, K.H.; Kim, S. Au–Ag core–shell nanoparticle array by block copolymer lithography for synergistic broadband plasmonic properties. ACS Nano 2015, 9, 5536–5543. [Google Scholar]
- Sekhon, J.S.; Malik, H.; Verma, S. Tailoring surface plasmon resonance wavelengths and sensoric potential of core–shell metal nanoparticles. Sens. Lett. 2013, 11, 512–518. [Google Scholar] [CrossRef]
- Moayyed, H.; Leite, I.; Coelho, L.; Santos, J.L.; Viegas, D. Analysis of a plasmonic based optical fiber optrode with phase interrogation. Photon. Sens. 2016, 6, 221–233. [Google Scholar]
- Chen, X.; Wang, X. Near-field thermal transport in a nanotip under laser irradiation. Nanotechnology 2011, 22, 075204. [Google Scholar] [CrossRef] [PubMed][Green Version]
- Kravets, V.G.; Kabashin, A.V.; Barnes, W.L.; Grigorenko, A.N. Plasmonic surface lattice resonances: A review of properties and applications. Chem. Rev. 2018, 118, 5912–5951. [Google Scholar] [CrossRef]
- Anulytė, J.; Bužavaitė-Vertelienė, E.; Vertelis, V.; Stankevičius, E.; Vilkevičius, K.; Balevičius, Z. Influence of a gold nano-bumps surface lattice array on the propagation length of strongly coupled Tamm and surface plasmon polaritons. J. Mater. Chem. C 2022, 10, 13234–13241. [Google Scholar] [CrossRef]
- Cuartero-González, A.; Sanders, S.; Zundel, L.; Fernández-Domínguez, A.I.; Manjavacas, A. Super- and subradiant lattice resonances in bipartite nanoparticle arrays. ACS Nano 2020, 14, 11876–11887. [Google Scholar] [CrossRef] [PubMed]
- Lee, B.-H.; Oh, G.; Kim, H.; Lee, T.-K.; Kim, D.-G.; Chung, T.; Choi, Y.-W. Design and fabrication of nano-plasmonics based high sensitivity sensor. In Proceedings of the IEEE-NANO 2012, Birmingham, UK, 20–23 August 2012; pp. 1–5. [Google Scholar]
- Rifat, A.; Ahmed, R.; Yetisen, A.; Butt, H.; Sabouri, A.; Mahdiraji, G.; Yun, S.; Adikan, F. Photonic crystal fiber based plasmonic sensors. Sens. Actuators B Chem. 2017, 243, 311–325. [Google Scholar]
- He, H.; Wei, X.; He, Y.; Liang, Y.; Fang, Y.; Peng, W. Plasmonic resonance coupling of nanodisk array/thin film on the optical fiber tip for integrated and miniaturized sensing detection. Sensors 2023, 23, 4163. [Google Scholar] [CrossRef] [PubMed]
- Meng, L.; Shang, L.; Feng, S.; Tang, Z.; Bi, C.; Zhao, H.; Liu, G. Optical fiber optrodes with silver-coated gold nanocavity ordered arrays for highly sensitive surface enhanced Raman spectrum. Sens. Actuators B Chem. 2023, 380, 133314. [Google Scholar] [CrossRef]
- Yan, X.; Han, L.; Zhao, R.; Fatima, S.; Zhao, L.; Gao, F. Prognosis value of IL-6, IL-8, and IL-1β in serum of patients with lung cancer: A fresh look at interleukins as a biomarker. Heliyon 2022, 8, e11352. [Google Scholar] [CrossRef]
- Bazzichetto, C.; Milella, M.; Zampiva, I.; Simionato, F. Interleukin-8 in colorectal cancer: A systematic review and meta-analysis of its potential role as a prognostic biomarker. Biomedicines 2022, 10, 2631. [Google Scholar] [CrossRef]
- Callaway, C.S.; Delitto, A.E.; D’Lugos, A.C.; Patel, R.; Nosacka, R.L.; Delitto, D.; Deyhle, M.R.; Trevino, J.G.; Judge, S.M.; Judge, A.R. IL-8 released from human pancreatic cancer and tumor-associated stromal cells signals through a CXCR2-ERK1/2 axis to induce muscle atrophy. Cancers 2019, 11, 1863. [Google Scholar] [CrossRef] [PubMed]
- Kim, G.-M.; Lee, S.-J.; Kim, C.-L. Assessment of the physical, mechanical, and tribological properties of PDMS thin films based on different curing conditions. Materials 2021, 14, 4489. [Google Scholar] [CrossRef]
- Wei, J.; Shi, J.; Wang, B.; Tang, Y.; Tu, X.; Roy, E.; Ladoux, B.; Chen, Y. Fabrication of adjacent micropillar arrays with different heights for cell studies. Microelectron. Eng. 2016, 158, 22–25. [Google Scholar] [CrossRef]
- Liu, Y.; Ma, L.; Xiao, W.; Wang, R.; Xiong, J.; Luo, J.; He, Z. Wideband multimode fiber with an optimized core size and fluorine-doped cladding for high-speed SWDM and CWDM transmission. Opt. Express 2019, 27, 15433–15443. [Google Scholar] [CrossRef] [PubMed]
- Lim, K.; Lee, D. Surface modification of glass and glass fibres by plasma surface treatment. Surf. Interface Anal. 2004, 36, 254–258. [Google Scholar] [CrossRef]
- Zhang, X.; Xiong, X.; Yu, J.; Guo, Z.-X. Amine-functionalized thermoplastic polyurethane electrospun fibers prepared by co-electrospinning with 3-aminopropyltriethoxysilane and preparation of conductive fiber mats. Polymer 2012, 53, 5190–5196. [Google Scholar] [CrossRef]
- Verma, H.N.; Singh, P.; Chavan, R. Gold nanoparticle: Synthesis and characterization. Vet. World 2014, 7, 72–77. [Google Scholar] [CrossRef]
- Cao, C.; Sim, S.J. Resonant Rayleigh light scattering response of individual Au nanoparticles to antigen–antibody interaction. Lab Chip 2009, 9, 1836–1839. [Google Scholar] [PubMed]
- Jian, Y.; He, Y.; Jiang, T.; Li, C.; Yang, W.; Nie, J. Volume shrinkage of UV-curable coating formulation investigated by real-time laser reflection method. J. Coat. Technol. Res. 2013, 10, 231–237. [Google Scholar]
- Kim, H.-M.; Park, J.-H.; Lee, S.-K. Fiber Optic Plasmonic Sensors Based on Nanodome Arrays with Nanogaps. ACS Sens. 2022, 7, 1451–1457. [Google Scholar] [CrossRef] [PubMed]
- Focsan, M.; Craciun, A.M.; Potara, M.; Vulpoi, A.; Leordean, C.; Soritau, O.; Maniu, D.; Astilean, S. Gold nanoparticle-decorated multilamellar liposomes as plasmonic vehicles for the photothermal release of doxorubicin. Biosensors 2023, 13, 512. [Google Scholar]
- Yang, X.; Ileri, N.; Larson, C.; Carlson, T.; Britten, J.; Chang, A.; Gu, C.; Bond, T. Nanopillar array on a fiber facet for highly sensitive surface-enhanced Raman scattering. Opt. Express 2012, 20, 24819–24826. [Google Scholar] [CrossRef]
- Ringe, E.; McMahon, J.M.; Sohn, K.; Cobley, C.; Xia, Y.; Huang, J.; Schatz, G.C.; Marks, L.D.; Van Duyne, R.P. Unraveling the Effects of Size, Composition, and Substrate on the Localized Surface Plasmon Resonance Frequencies of Gold and Silver Nanocubes: A Systematic Single-Particle Approach. J. Phys. Chem. C 2010, 114, 12511–12516. [Google Scholar] [CrossRef]
- Yuan, A.; Chen, J.J.W.; Yao, P.L.; Yang, P.C. The role of interleukin-8 in cancer cells and microenvironment interaction. Front. Biosci. 2005, 10, 853–865. [Google Scholar] [CrossRef]
- Kozłowski, L.; Zakrzewska, I.; Tokajuk, P.; Wojtukiewicz, M. Concentration of interleukin-6 (IL-6), interleukin-8 (IL-8) and interleukin-10 (IL-10) in blood serum of breast cancer patients. Rocz. Akad. Med. Białymstoku 2003, 48, 82–84. [Google Scholar]
- Ogi, H.; Fukunishi, Y.; Nagai, H.; Okamoto, K.; Hirao, M.; Nishiyama, M. Nonspecific-adsorption behavior of polyethylenglycol and bovine serum albumin studied by 55-MHz wireless-electrodeless quartz crystal microbalance. Biosens. Bioelectron. 2009, 24, 3148–3152. [Google Scholar]
- Huber, W. Basic calculations about the limit of detection and its optimal determination. Accredit. Qual. Assur. 2003, 8, 213–217. [Google Scholar]
- Promega Corporation. Lumit® IL-8 (Human) Immunoassay. Available online: https://worldwide.promega.com/products/cell-health-assays/inflammation-assay/lumit-il-8-human-immunoassay/ (accessed on 6 October 2025).
- Rashidova, S.; Anokhin, I.; Parfenov, D.; Abdurakhmanov, A.; Venediktov, V.; Bozhevolnyi, S.I.; Sypabekova, M.; Tosi, D. Functionalized optical fiber ball-shaped biosensor for label-free, low-limit detection of IL-8 protein. Biomed. Opt. Express 2024, 15, 523–535. [Google Scholar]
- Verma, R.; Gupta, B.D. Anti-IL8/AuNPs/rGO/ITO as an immunosensing platform for noninvasive electrochemical detection of oral cancer. Biosens. Bioelectron. 2017, 89, 175–183. [Google Scholar] [CrossRef]
- Alrebaish, S.; Althagafi, S.; Alfadhel, H.; Alshehri, A.; Alyami, H.; Alamer, M.; Alqahtani, F. Au-IDE-Based Non-Faradaic Electrochemical Biosensor for Early Detection of Interleukin-8 Protein. Micromachines 2025, 16, 395. [Google Scholar] [CrossRef] [PubMed]
- Zhakypbekova, A.; Matayev, D.; Alimbek, D.; Shukirbekov, M.; Tursynbek, A.; Artykbekov, A.; Korganbayev, S.; Molardi, C.; Blanc, W.; Ayupova, T.; et al. Parallel fiber-optic semi-distributed biosensor for detection of IL-6 and IL-8 cancer biomarkers in saliva at femtomolar limit. Opt. Laser Technol. 2025, 182, 110264. [Google Scholar] [CrossRef]
Disclaimer/Publisher’s Note: The statements, opinions and data contained in all publications are solely those of the individual author(s) and contributor(s) and not of MDPI and/or the editor(s). MDPI and/or the editor(s) disclaim responsibility for any injury to people or property resulting from any ideas, methods, instructions or products referred to in the content. |
© 2025 by the authors. Licensee MDPI, Basel, Switzerland. This article is an open access article distributed under the terms and conditions of the Creative Commons Attribution (CC BY) license (https://creativecommons.org/licenses/by/4.0/).